Article

A Data-Driven Reaction Network for the Fluid Catalytic Cracking of Waste Feeds

Department of Chemical Engineering, University of the Basque Country UPV/EHU, P.O. Box 644, 48080 Bilbao, Spain
*
Author to whom correspondence should be addressed.
These authors contributed equally to this work.
Processes 2018, 6(12), 243; https://doi.org/10.3390/pr6120243
Submission received: 16 October 2018 / Revised: 19 November 2018 / Accepted: 21 November 2018 / Published: 27 November 2018
(This article belongs to the Special Issue Modeling, Simulation and Control of Chemical Processes)

Abstract

:
Establishing a reaction network is of uttermost importance in complex catalytic processes such as fluid catalytic cracking (FCC). This step is the seed for a faithful reactor modeling and the subsequent catalyst re-design, process optimization or prediction. In this work, a dataset of 104 uncorrelated experiments, with 64 variables, was obtained in an FCC simulator using six types of feedstock (vacuum gasoil, polyethylene pyrolysis waxes, scrap tire pyrolysis oil, dissolved polyethylene and blends of the previous), 36 possible sets of conditions (varying contact time, temperature and catalyst/oil ratio) and three industrial catalysts. Principal component analysis (PCA) was applied over the dataset, showing that the main components are associated with feed composition (27.41% variance), operational conditions (19.09%) and catalyst properties (12.72%). The variables of each component were correlated with the indexes and yields of the products: conversion, octane number, aromatics, olefins (propylene) or coke, among others. Then, a data-driven reaction network was proposed for the cracking of waste feeds based on the previously obtained correlations.

1. Introduction

The global requirement for transportation fuels is expected to grow steadily over the coming years due to an increasing demand of energy from developed and developing countries [1]. The foreseeable petroleum depletion will be anticipated by the use of heavier and low-quality crudes, together with a switch of market demand from heavy-fuel fractions towards gasoline and light olefins. These combined aspects justify the current necessity of refineries to evolve by introducing new units, revamping used ones and varying the feedstock to expand their versatility and capacity [2].
The fluid catalytic cracking (FCC) unit plays a key role in an integrated and intensified refinery as the primary catalytic conversion process (in terms of volume) greatly determining its competitiveness and margin [3]. In recent years, important efforts have been directed towards the improvement of these highly demanding units [4]. The underlying drive of these works highlights the essential role of the FCC unit in the path towards an integrated waste and bio-refinery concept [5,6,7]. FCC units have traditionally processed heavy petroleum fractions (vacuum gasoil, VGO) into interesting products such as gasoline, diesel or propylene [8,9]. However, taking the remarkable versatility of FCC, other non-conventional feeds have also been studied [10]: (i) secondary refinery streams; (ii) streams derived from the consumer society; or (iii) oxygenated bio-derived feedstock. As secondary refinery streams (i), Arandes et al. [11,12] studied the effect of co-feeding atmospheric distillation residue (20 wt %) with VGO in a riser simulator, observing a crucial role of the reactant accessibility for the efficient conversion of bulky aromatic molecules, and also the great influence of the temperature and catalyst/oil (C/O) ratio on gasoline composition. Garcia et al. [13] observed an improvement of conversion of the blend of atmospheric distillation residue (10 wt %) and VGO, compared with the VGO alone. Specifically, these authors observed a higher yield of light cycle oil (LCO) at the expense of slightly faster coke formation with the blend. Regarding streams derived from the consumer society (ii), waste polyolefins have an ideal composition as FCC feedstock and their valorization can be carried out by either dissolving the polymer in the feed [14,15] or performing a previous pyrolysis [16,17,18,19]. Lovás et al. [20] compared the catalytic cracking in FCC conditions of high-density polyethylene (HDPE) and polypropylene (PP) waxes together with VGO and it was concluded that PP should be used preferentially in order to boost gasoline production. On the other hand, the condensed pyrolysis oil derived from waste (scrap) tires also shows great prospects to become a FCC feed and produce high quality fuels [21,22,23]. Concerning oxygenated bio-derived streams (iii), a great research interest has been directed towards exploring the possibilities of bio-derived feedstock (i.e., bio-oil and vegetable oils) for FCC conversion [24,25,26,27,28,29,30].
Despite the effort, a proper assessment of the effect of the set of conditions (feed, catalyst, and operational conditions) on the results and the subsequent proposal of a reaction network are challenging due to the great number of correlated and uncorrelated variables affecting the system [31]. In this context, principal component analysis (PCA) is a valuable statistical tool that can aid in categorizing the variables by replacing a large set of parameters with a smaller set of new ones (principal components) that describe the observed patterns [32,33,34]. Categorizing and grouping variables is the main aim of PCA and, to date, this methodology has been used in the oil industry as a predictive tool for process monitoring and control [35], fault discovery [36], reactor modeling [37], determination of physical properties of petroleum samples [38], catalyst characterization [39] and gathering insight into catalyst behavior and classification of the main reaction routes in the catalytic cracking of decalin over Y-zeolites [40]. The application of this method has also been reported for the evaluation of the optimal reaction conditions for the catalytic oxidation of toluene [41] as well as for proposing kinetic schemes in the thermal pyrolysis of waste HDPE plastics [42] and waste tires [43]. Pasadakis et al. [39] used the PCA methodology to highlight the differences among different hydrotreating catalysts based on several physical and chemical properties of the products along with other kinetic constants. PCA is among the disruptive methodologies which can lead to new catalysts or models for complex problems, together with artificial neural networks [44]. This approach is fundamentally distinct to the empiric one that uses the principal component equations to describe observations or predict new conditions [45], namely the principal component regression (PCR) or the principal component analysis and multiple linear regression (PCA-MLR). The partial least squared regression (PLS) uses PCA methodology to select the most influential variables and subsequently calculate the (empirical) functions that describe the results with less error [46].
The main aim of this work was to obtain a reaction network for the cracking of waste feeds applying the PCA methodology over 104 uncorrelated experiments. In particular, the aim was to measure the quantitative impact of processing alone or together with VGO: scrap tire pyrolysis oil, high-density polyethylene pyrolysis waxes or dissolved high-density polyethylene. This study pursued analyzing the impact of using different experimental conditions (resembling those of industrial units) and using three different equilibrated FCC catalysts (discarded from actual industrial FCC units). The partial goal was to gather insights into the main key parameters or variables affecting product yields in terms of conversion, octane number, propylene yield or coke formation, among others.

2. Materials and Methods

The variables used in this work are shown in Table 1, categorized into four groups: (i) catalyst properties; (ii) feed properties; (iii) reaction conditions; and (iv) products.

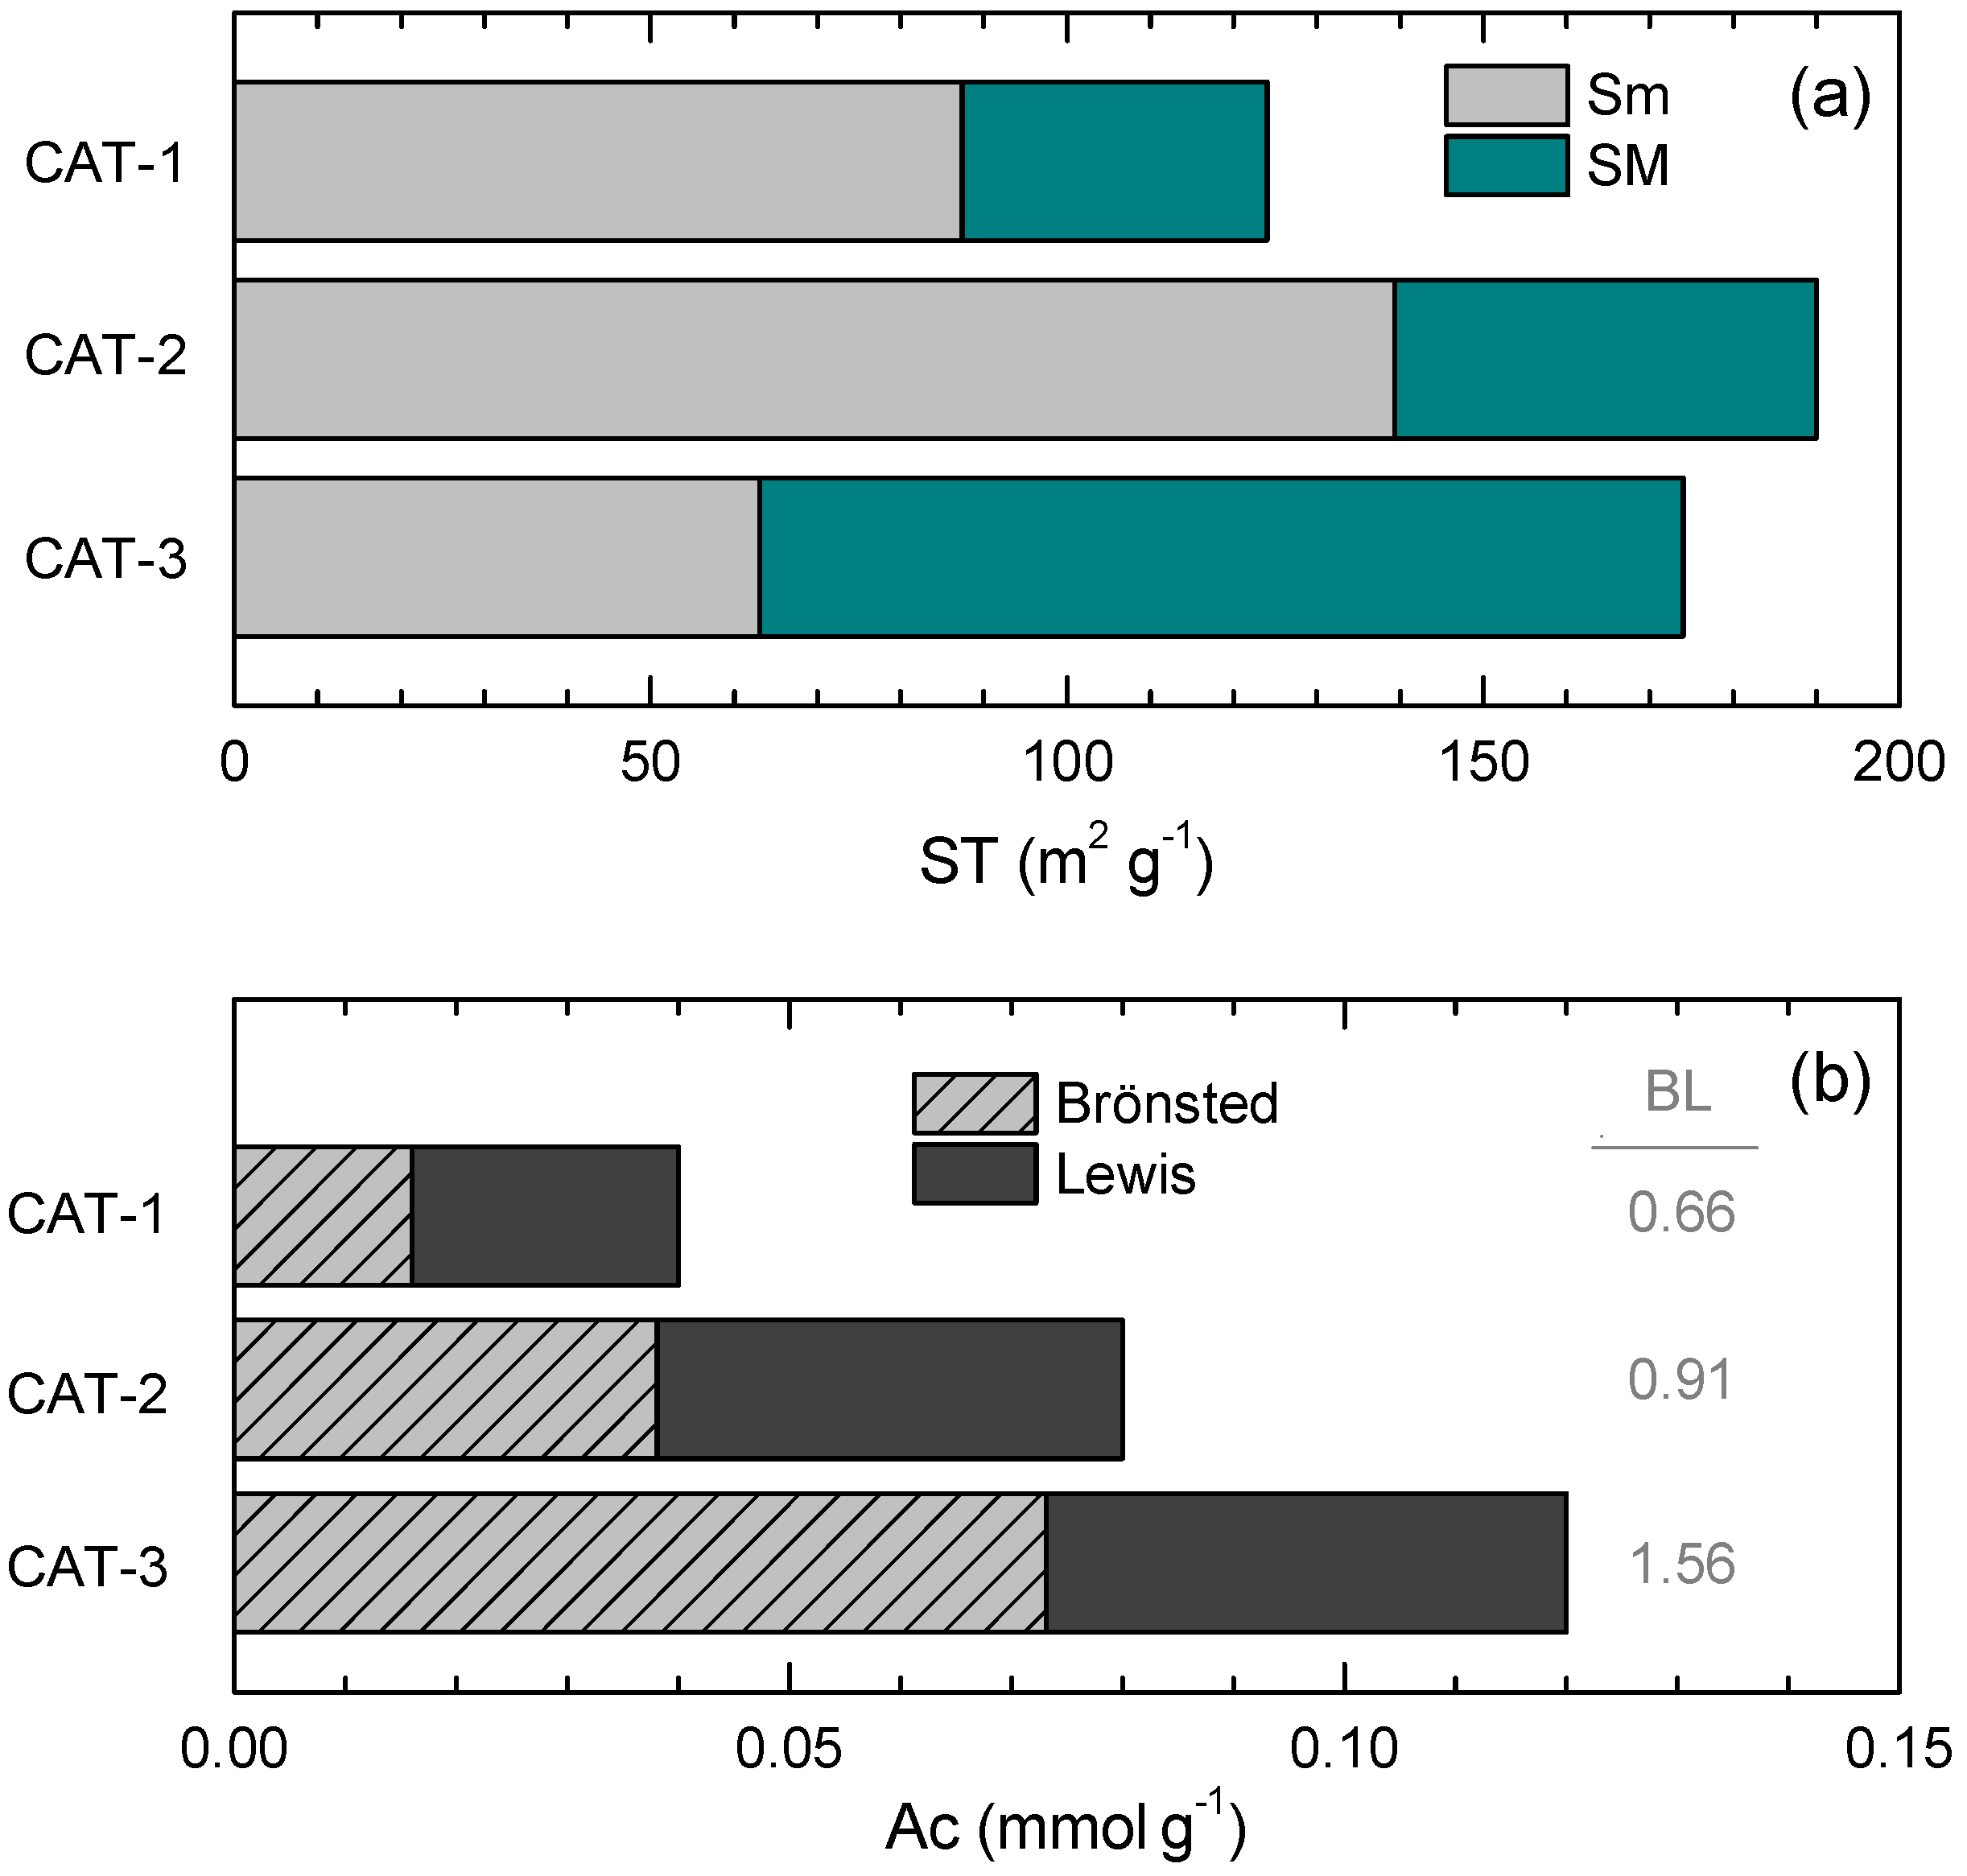
2.1. Catalyst Properties

Three equilibrated commercial FCC catalysts based on HY zeolite were used in this study and designated as CAT-1 to -3. These three catalysts are considered spent, i.e., collected after exiting the stripper section and discarded from industrial FCC units [47].
The textural properties (ST, Sm, SM, Vm and mV) were measured by N2 adsorption–desorption isotherms at −196 °C using a Micromeritics ASAP 2010 apparatus (Micromeritics, Norcross, GA, USA), after the samples were degassed at 150 °C for 8 h. The zeolite percentage (Z) was calculated using the Johnson correlation [48].
The unit cell size (Dc) was obtained from X-ray diffraction (XRD) analysis in a Philips PW 1710 apparatus (Philips Industrial & Electro-acoustic Systems Division, Almelo, the Netherlands) with a graphite monochromator using CuKα radiation (λ = 1.5544 Å). Data were collected using a coupled configuration in the 2–50° range with a step size of 0.02 and a scan time of 1 s. The acidity (Ac) was measured through temperature programmed desorption (TPD) of NH3 adsorbed at 150 °C in a TG-DSC Setaram 111 calorimeter (Setaram, Caluire-et-Cuire, France), which was connected on-line with a Balzers Quadstar 422 mass spectrometer (Thermo Scientific, Germany). The Brönsted–Lewis acid site ratio (BL) was obtained using Fourier transformed infrared (FTIR) spectrometry of adsorbed pyridine in a Nicolet 6700 FTIR apparatus (Agilent Technologies, Wilmington, DE, USA) with a catalytic SPECAC chamber. The elemental analysis (Cu, Ni, V, Fe, Na, Al, Re and P) was carried out by Inductively Coupled Plasma–Atomic Emission Spectroscopy (ICP-AES) using a X7-II Thermo quadrupolar mass spectrometer (QICP-MS) (TA Instruments, New Castle, DE, USA), previously subjecting the fresh catalysts to acid digestion with HF (Merck) at 90 °C.

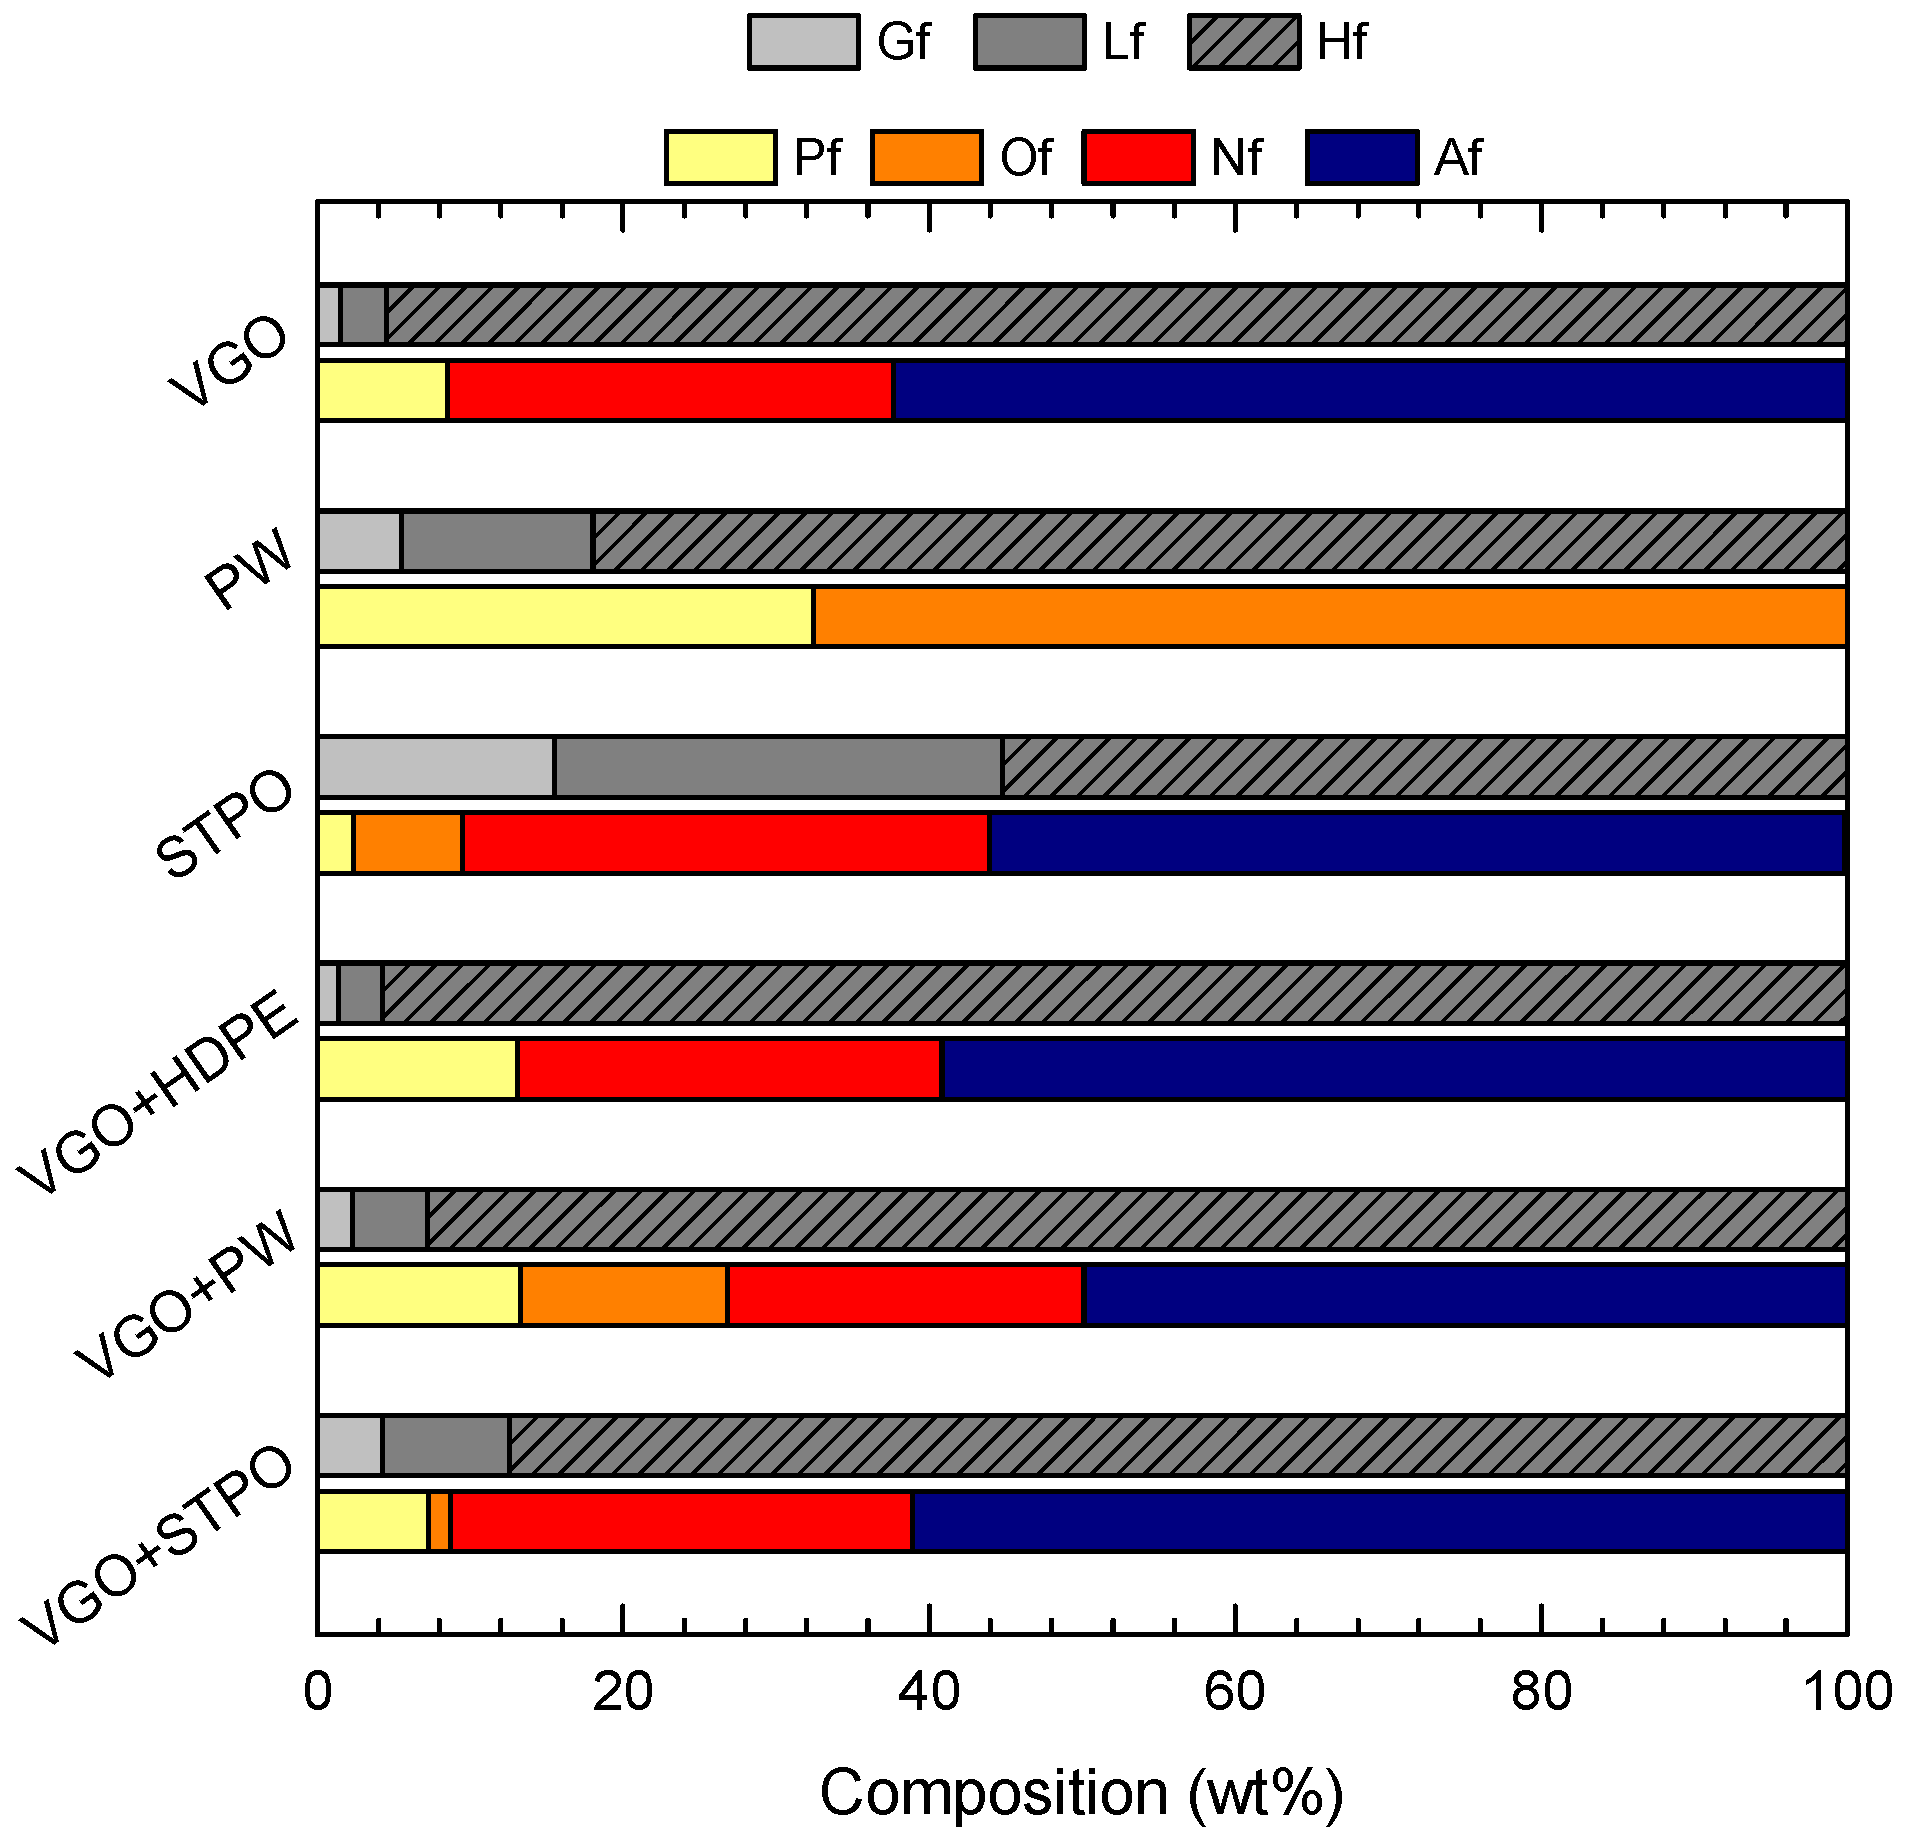
2.2. Feed Properties

Six feeds were used: (1) vacuum gasoil, VGO; (2) high-density polyethylene (HDPE) pyrolysis waxes, PW; (3) scrap tire pyrolysis oil, STPO; (4) VGO + HDPE, 95 wt % + 5 wt %; (5) VGO + PW, 80 wt % + 20 wt %; and (6) VGO + STPO, 80 wt % + 20 wt %. VGO was provided by Petronor S.A. (Muskiz, Spain), with an API gravity of 21.1 and a viscosity at 100 °C of 8.6 cSt. Pre-grinded particles of <1 mm of HDPE were provided by Dow Chemical (Tarragona, Spain), with an average molecular weight of 46,200 g mol−1 and a polydispersity of 2.89.
The pyrolysis of HDPE or tires—previously grinded to particles of <1 mm, after removal of textile reinforcements and metallic components provided by Jenecan S.L. (Abanto-Zierbana, Spain)—was performed in a conical spouted bed reactor under the following conditions: (i) for HDPE (continuous flow regime): 500 °C, HDPE flow rate of 1 g min−1, N2 flow rate of 7.5 L min−1, and 30 g of sand (0.63 < dp < 1 mm) in the bed [49]; and (ii) for tires (semi-continuous regime): 500 °C, tire feed of 2 g per run, N2 flow rate of 6.5 L min−1, and 30 g of sand (0.63 < dp < 1 mm) in the bed [50], respectively.
The fractions of the feed (Gf, Lf and Hf) were analyzed by simulated distillation, according to the ASTM D-2887 standard, in an Agilent 6890 Series GC gas chromatograph. To carry out the simulated distillation of PW, this feed was diluted in tetrahydrofuran (THF) at 55 °C in a PW:THF mass ratio of 1:2. The amount of sulfur (Sf) was analyzed by gas chromatography in an Agilent Technologies 7890A setup (Agilent Technologies, Wilmington, DE, USA) connected in line and provided with an FID detector and a pulsed flame photometric detector (PFPD). Additionally, the chemical composition (Pf, Of, Nf and Af) analysis was performed in a bi-dimensional Agilent 7890A gas chromatograph (GC × GC) (Agilent Technologies, Wilmington, DE, USA) provided with two columns and a flow modulator, coupled in line with an Agilent 5975C Series mass spectrometer (MS) (Agilent Technologies, Wilmington, DE, USA) and a flame ionization detectors (FID) (Agilent Technologies, Wilmington, DE, USA); additional details can be found elsewhere [22].

2.3. Reaction Conditions and Product Properties

The FCC runs were carried out in a CREC (Chemical Reactor Engineering Centre, University of Western Ontario, London, ON, Canada) riser simulator, using reaction condition resembling those of industrial FCC units [51]: T, 500–530–560 °C; CO, 3–5–7 g g−1; t, 3–6–12 s. A detailed schematization of the reactor is described in a previous work [24]. Please note that t denotates the contact time during which reactants and products were in contact with the catalyst within the reaction chamber Once this contact time was completed, the products were withdrawn from the reactor by triggering a valve which connects the reactor with a vacuum chamber in order to avoid side reactions.
The reaction products that are gases in the reaction conditions were analyzed through the same GC described before for the analysis of Sf. The coke content (Ck) was determined by combustion in a TA Instruments TGA-Q 5000 thermobalance (TA Instruments, New Castle, DE, USA), applying a temperature ramp of 300–550 °C, at a 3 °C min−1 rate. The conversion (Xi) was defined as the fraction of the feed that yields the most important products (LG + LPG + GL + Ck). The individual yield of each product/lump referred to the total mass of products (LG + LPG + GL + LCO + HCO + Ck). The research octane number (RON) was calculated from a method established by Anderson et al. [52] and based on the composition of the GL fraction measured by gas chromatography.

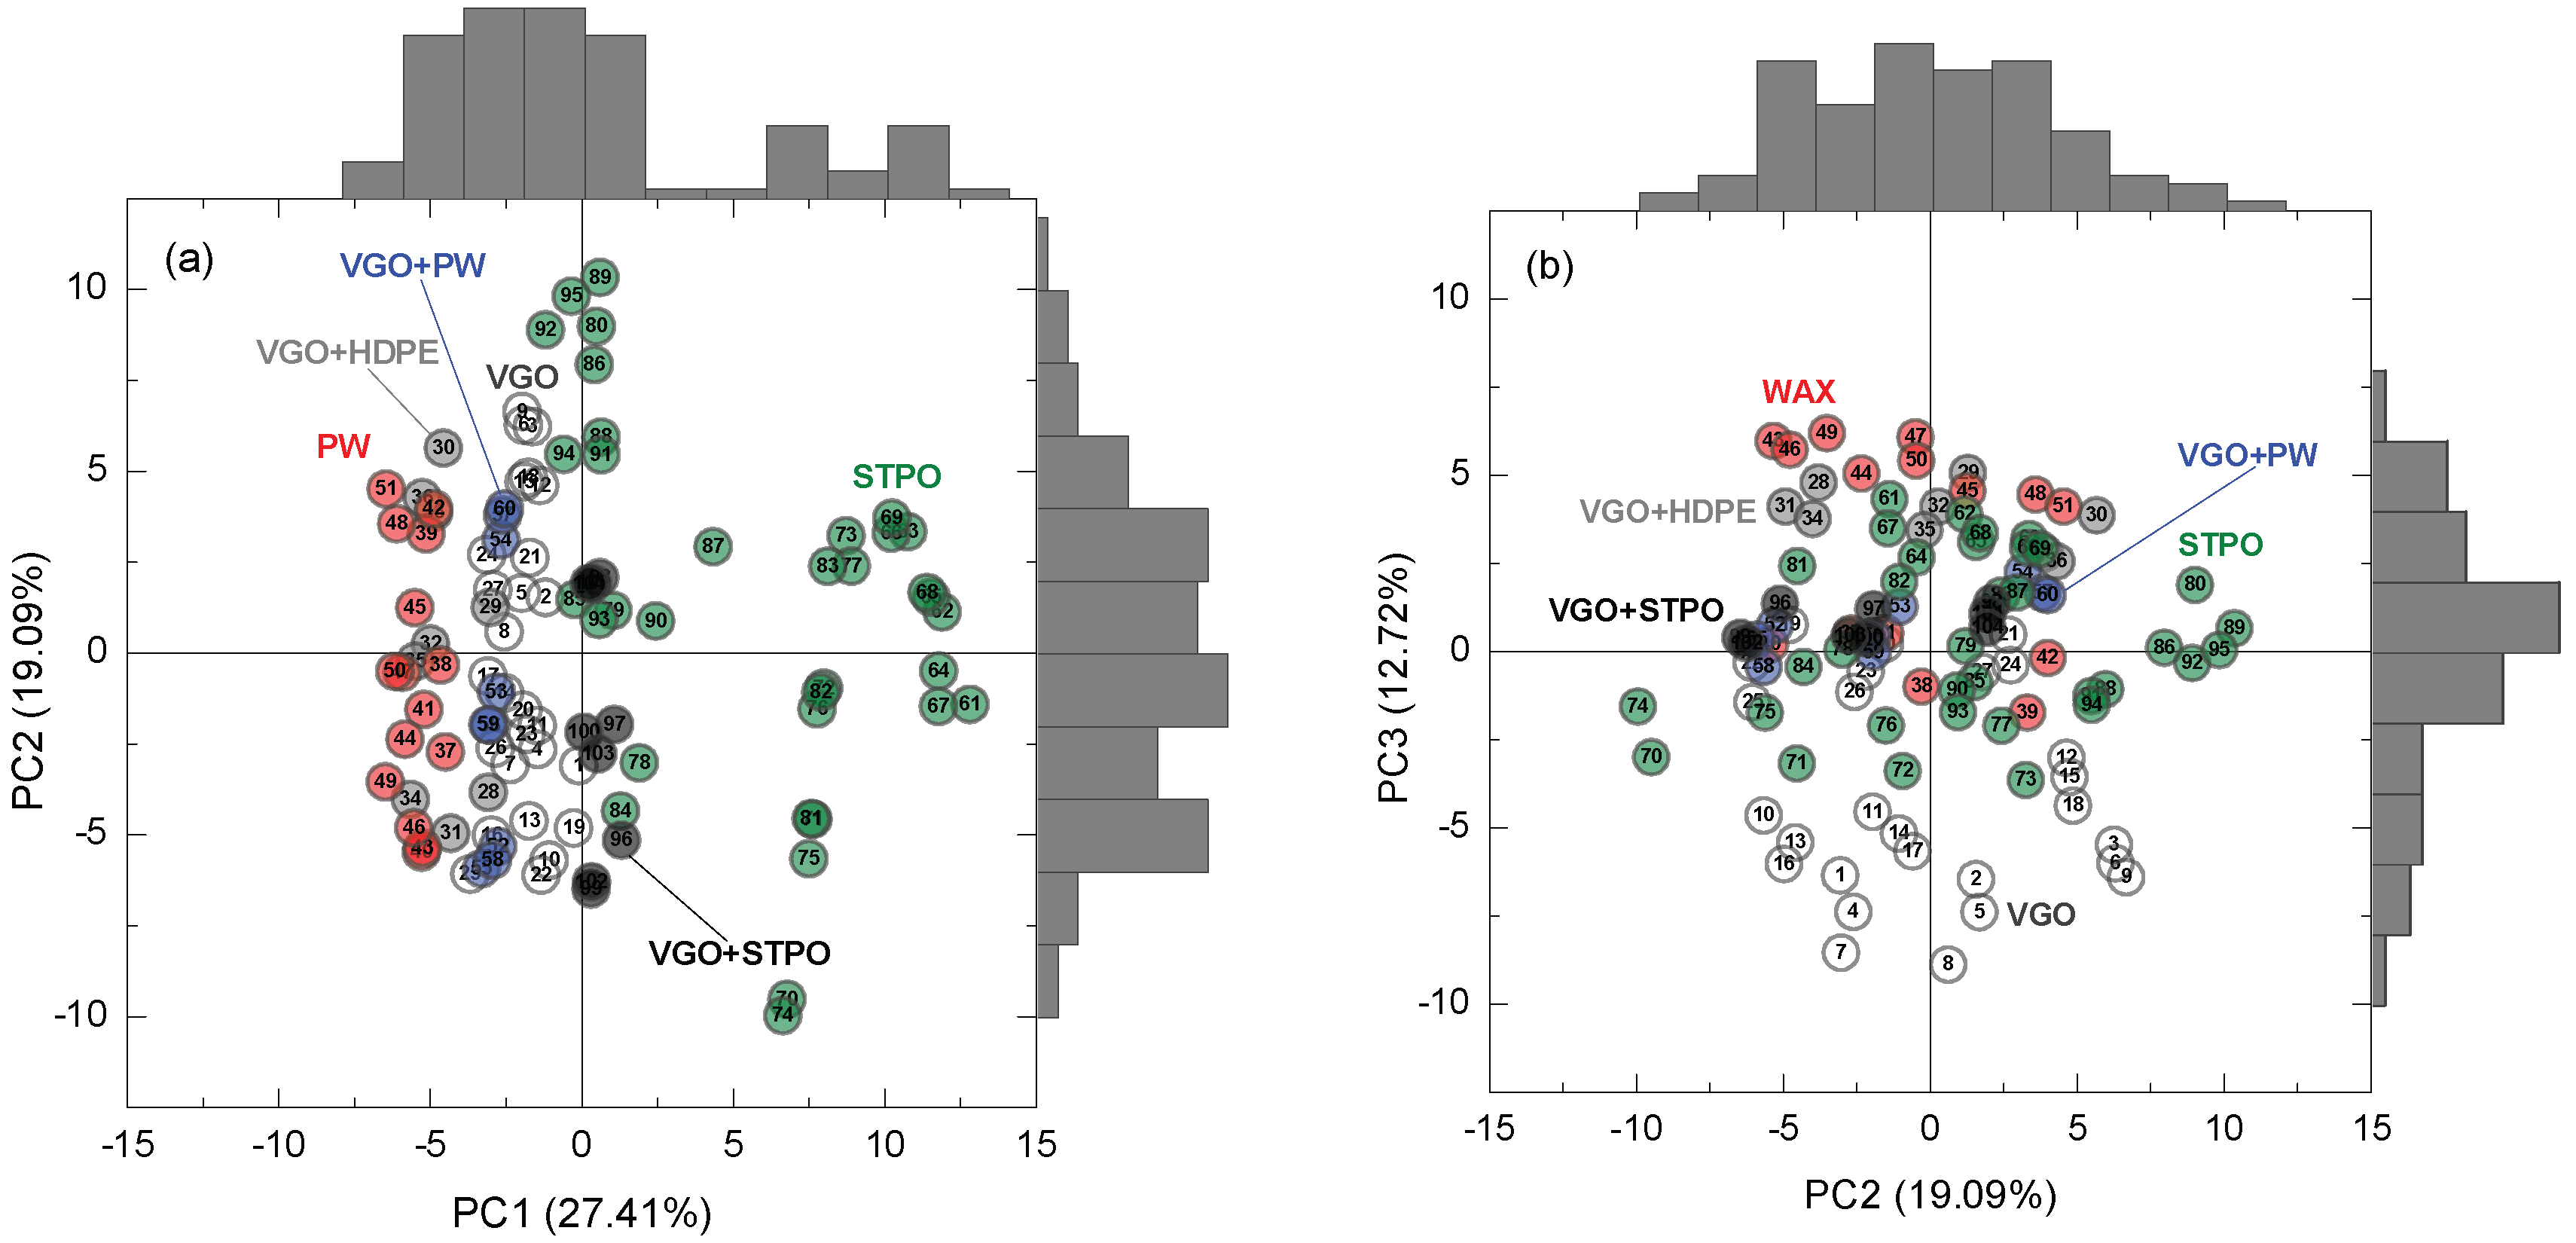
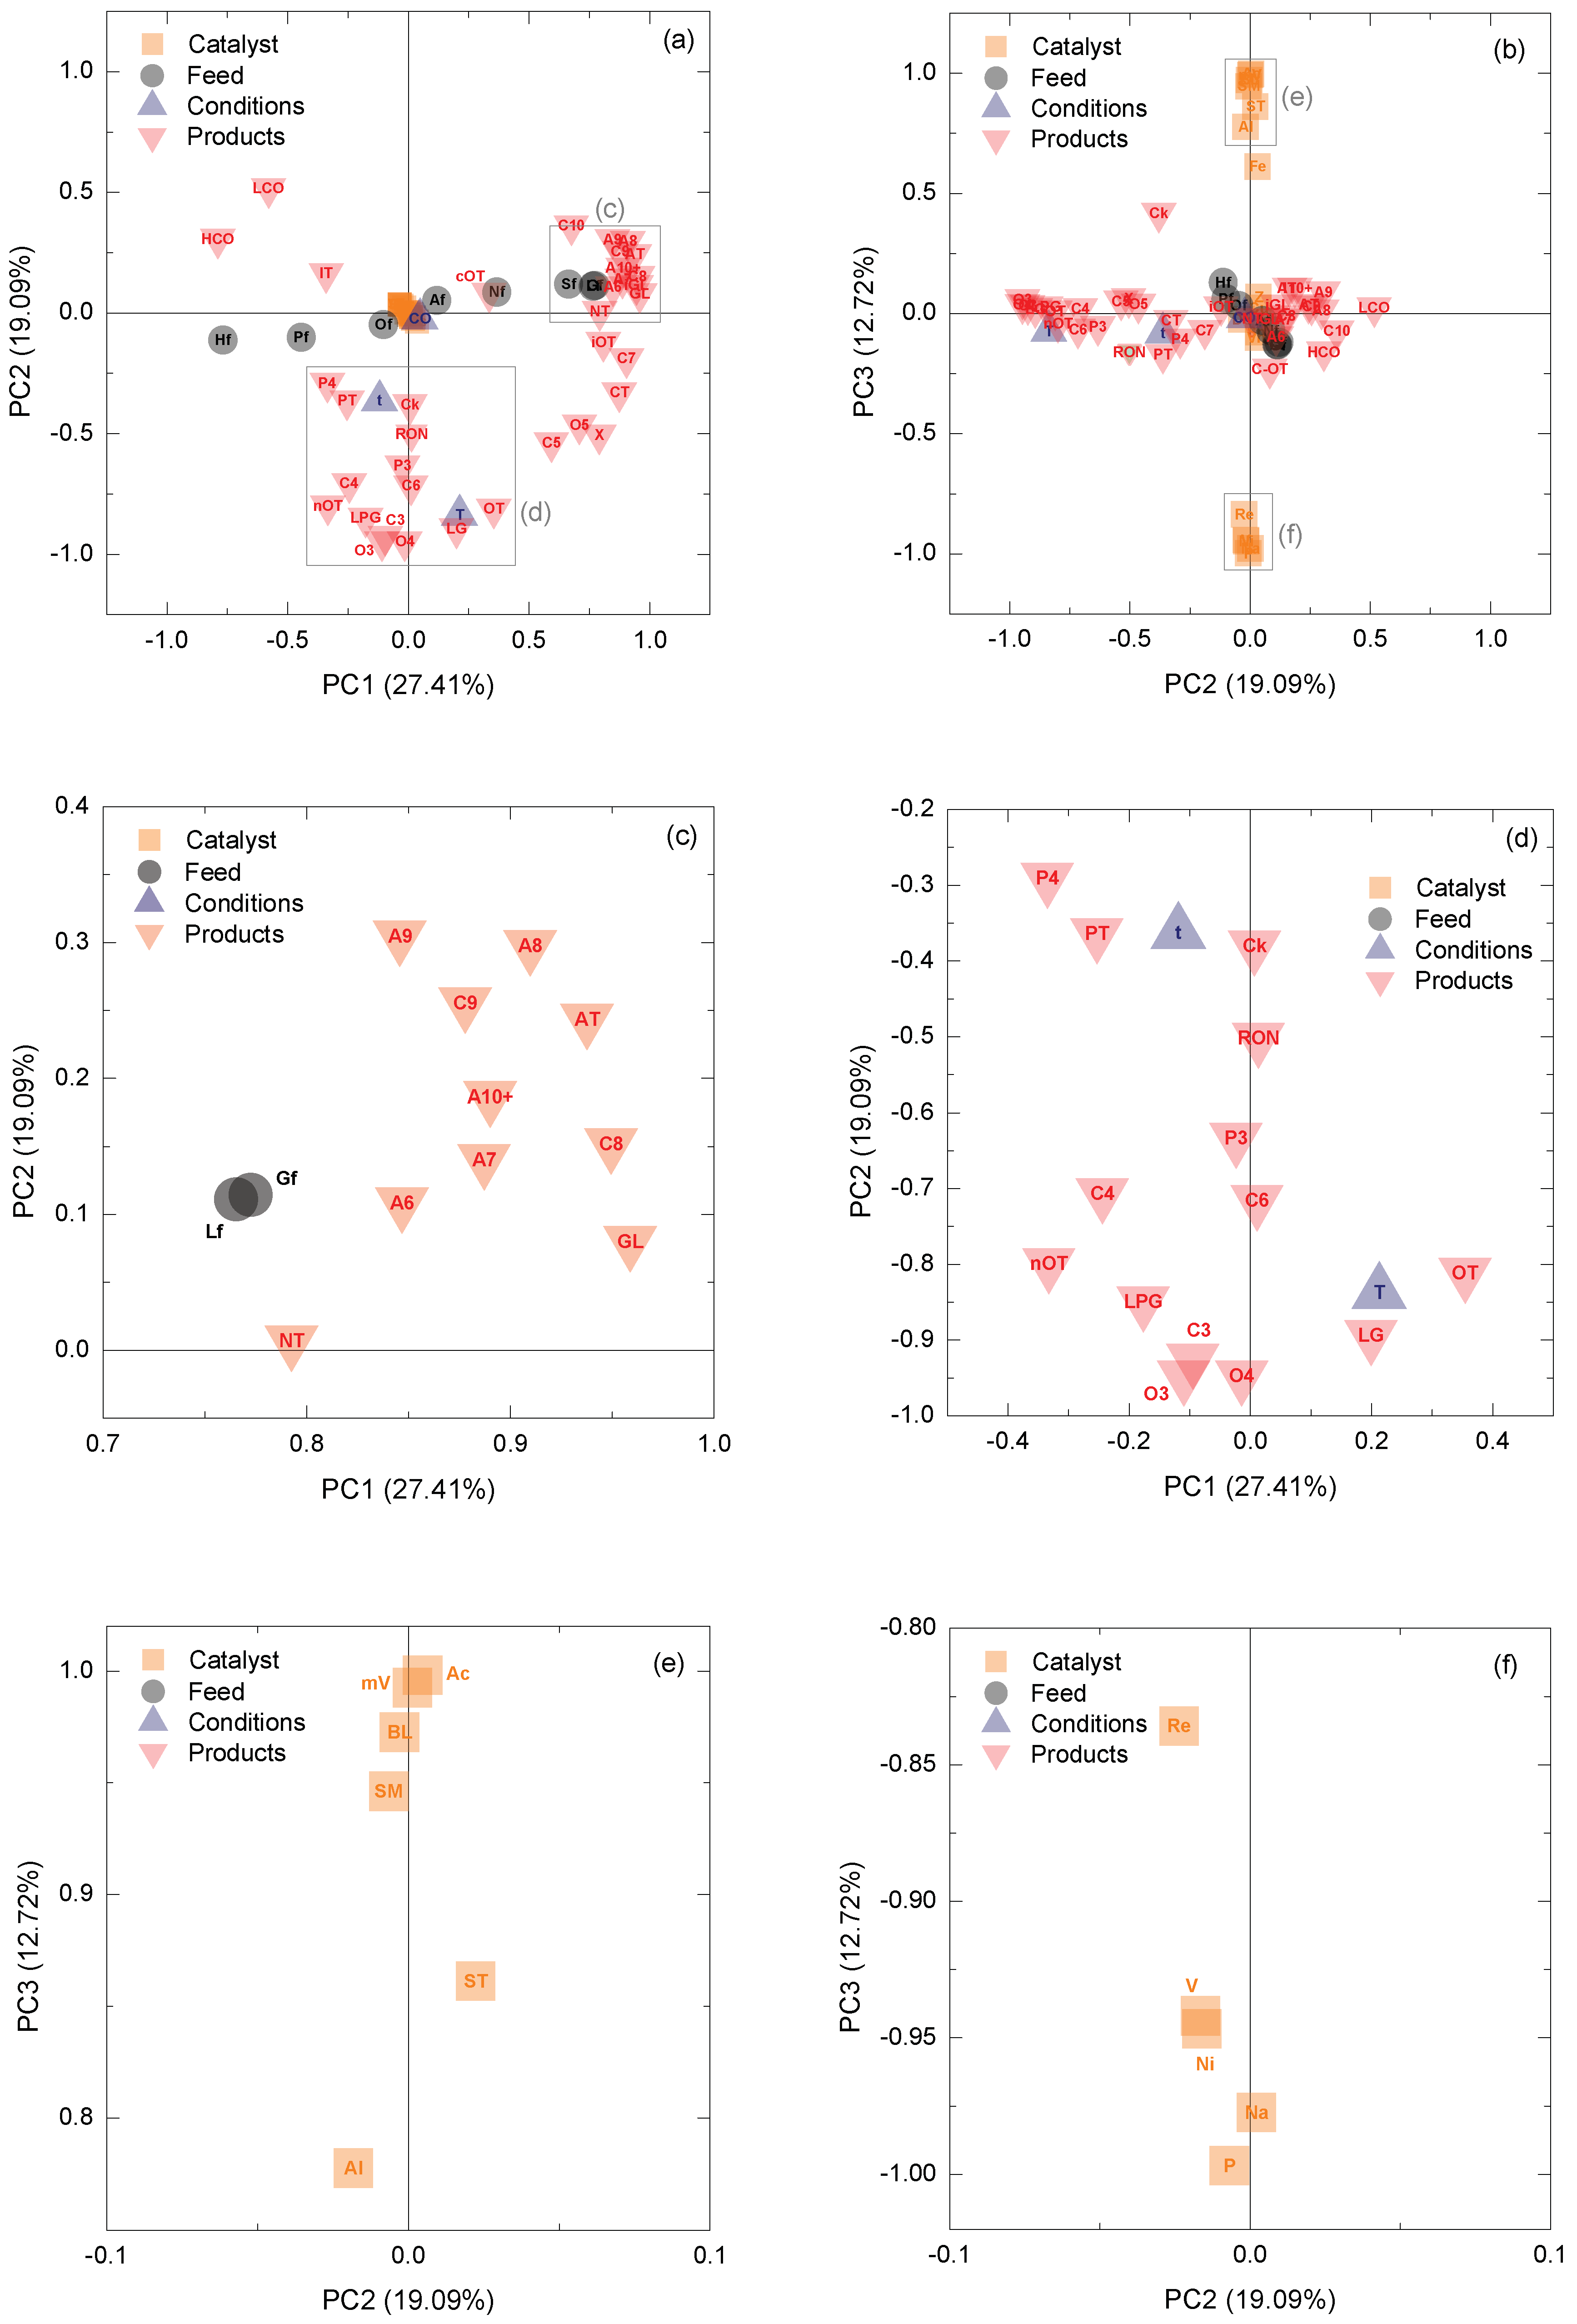
2.4. Principal Component Analysis (PCA)

A routine was developed in MATLABTM (Version 2014a, Mathworks, Natick, MA, USA, 2014) for the multivariate analysis of the experimental results. The dataset X was configured as a matrix consisting of n columns (for n variables) and m rows (for m number of independent experiments). Each of the variables is an independent or dependent one and is summarized within Table 1.
X = [ x 11 x 12 x 1 n x 21 x 22 x 2 n x m 1 x m 2 x m n ]
The data were normalized with the command normc. Then, the data matrix X was decomposed into a score vector ti and a loading vector pi with a residual error E, as:
X = t 1 p 1 T + t 2 p 2 T + + t k p k T + E
The correlations of the variables were obtained by first calculating the covariance (cov command) and then transforming it to a correlation matrix (corrcov command). The covariance matrix can also be expressed as:
R = j = 1 n p j λ j p j T = P Λ P T
where P is a mxn matrix of eigenvectors and Λ is a matrix of eigenvalues associated to those eigenvectors, as:
Λ = [ λ 1 0 0 0 λ 2 0 0 0 0 0 λ n ]
The eigenvalues and eigenvectors (calculated with eig) were used for the calculation of the principal components of the correlation matrix. To compute the loadings of each PC, the eigenvectors were multiplied by the square root of the eigenvalues diagonal matrix (Equation (4)). The eigenvalues also allowed for calculating the portion of the total variance associated with the jth eigenvalue:
ν j = λ j j λ j
In addition, the Varimax rotation was applied to facilitate the interpretation of the results and was calculated using the command rotatefactors over the loading matrix. The command pca was used to obtain the score matrix and zscore to obtain the z-score matrix.

3. Results

3.1. Properties of the Catalysts and Feeds

Some of the main properties of the catalysts are summarized in Figure 1: ST, Sm, SM, Ac and BL. The results in Figure 1 illustrate that all features of the studied catalysts correspond to those typical of the industrial FCC ones: ST of 124–190 m2 g−1; Sm of 63–139 m2 g−1; Ac of 0.04–0.12 mmol g−1; and BL of 0.6–1.56.
CAT-1 is a spent catalyst that has been discarded from an industrial FCC unit and, as such, has relatively low ST, Ac and BL values. This is due to the degradation that occurs at the severe conditions of the FCC process. CAT-2 has a relatively high content of ST due to a greater proportion of zeolite (Z), as also shown by its high Sm proportion, and intermediate values of Ac and BL, indicating that this catalyst is likely intended for the conversion of relatively “light” feeds (avoiding over cracking) and an increase in the olefin content and octane number of the products. On the other hand, CAT-3 has the lowest Sm value and the greatest Ac and BL values, which suggest that this catalyst would promote the conversion of heavier fraction by having the highest acidity and the highest mesopore area.
The elemental analysis of the catalysts shows contents of Ni (741 ppm) and V (3335 ppm) one order of magnitude higher for the CAT-1 in comparison to CAT-2 and -3, again evidencing the spent nature of CAT-1. The rest of the compositions are relatively similar (Cu, Fe, Na and Al) except for the Re concentrations that are 2.50, 0.86 and 1.35 wt % for CAT-1 to -3, respectively.
Figure 2 displays the composition of the six feeds studied. All feeds (with the exception of STPO) consist primarily of an HCO (Hf) fraction with concentrations of 82.0–95.5 wt %. STPO, on the other hand, presents a significantly higher content of LCO (Lf, 29.3 wt %) and gasoline (Gf, 15.5 wt %), as a consequence of the thermal non-selective cracking that occurs in the pyrolysis process, directing product distribution towards lighter components and a low concentration of heavy hydrocarbons [53,54].
Regarding their chemical composition, while waxes consist only of linear paraffins (32.4 wt %) and olefins (67.6 wt %), the rest of the feeds are relatively similar in their chemical nature with an overall predominance of cyclic unsaturated (50.0–62.4 wt % aromatics) and saturated compounds (23.3–34.4 wt % naphthenes).

3.2. Multivariate Analysis

From the experimental data consisting of 104 uncorrelated runs, 11 PCs were extracted. PC1, PC2 and PC3 characterize 59.22% of the variance, and therefore are mainly discussed below. Figure 3 shows the score plot of the three main PCs, which is a representation of the values derived from the score vectors computed according to Equation (2) and provide insights into potential deviations in the data or data that do not fit the PCA at a confidence level of 95%. The experimental data are homogenously distributed along PC2–PC3, and therefore clustering, outliers and other unwanted patterns in this framework can be discarded. However, when the experiments are discretized based on feed types (colored groups in Figure 3), a clustering behavior is observed along PC1 with the data being grouped at specific PC1 loading values.
The type and characteristics of the feed are observed to be strongly correlated with PC1 and PC3 and with little influence of PC2. The results of the cracking of STPO show the highest scores along PC1, whereas the experimental results of the cracking of VGO have the lowest scores along PC3 (not making a proper cluster). This observation indicates that processing STPO through the FCC approach at the different conditions will have a greater impact performance-wise than processing the VGO + STPO mixture or VGO alone. In relation with Figure 2, this trend of scores is related with the amount of HCO in the feed (Hf, which is particularly high for VGO and HDPE + VGO feeds, and lower for STPO). Indeed, the distinctive composition of the STPO (much lighter than the rest of feeds) is responsible to a certain degree for the clustering observed in the score plot of the cracking results (Figure 3). Overall, these results reveal that the composition of the feed should play an important role on the loadings of PC1.
Figure 4 displays the Varimax loading plots for PC1–PC2 (Figure 4a) and PC2–PC3 (Figure 4b). This graph also shows zooms of different sections of the PC1–PC2 (Figure 4c,d) and PC2–PC3 (Figure 4e,f) representations.
As shown in Figure 3a, the composition of the feed is strongly correlated with PC1, which describes 27.41% of the variance. The “negative” fractions of the feed (negative loadings), in PC1, are HCO (Hf) and paraffins (Pf), which are, hence, the least reactive fractions. On the contrary, gasoline (Gf) and LCO (Lf) present positive loading and are “favorable” fractions from an FCC performance perspective, being at the opposite side of the least reactive ones. Figure 4a indicates that there is a correlation (or proximity) between the HCO in the feed (Hf) and that of the products (HCO) and LCO indicating one of the main pathways of reaction: HCO (unreacted) and HCO → LCO. Paraffins in the feed (Pf) are correlated with isoparaffins (IT) indicating the participation of isomerization reactions in the cracking mechanisms. On the other side of the PC1 (Figure 4a), naphthenes in the feed (Nf) are linked with the cycloolefins (naphthenes with double bounds, cOT), indicating the partial dehydrogenation of the cyclohexane and cyclopentane rings (most likely in Nf).
Based on their loadings (highest and lowest along PC1), the distribution of boiling point fractions of the feed (Hf, Gf or Lf) has a stronger impact on process performance than its chemical composition (Pf, Of, Af or Nf). Besides, a cluster of points is observed on the left side of Figure 4a, which has been zoomed in Figure 4c. The “positive” fractions of the feed such as Lf and Gf are primarily converted into gasoline products (GL) with a high content of C79 hydrocarbons in the form of aromatics (AT). In particular, we observe relatively high loadings within PC1 for benzene (A6), toluene (A7), xylenes (A8) and C9+ alkyl aromatics, together with naphthenes (NT). These results illustrate the transformation of alkylated naphthenes (Nf) and aromatics (Af) present in the gasoline (Gf) and LCO (Lf) into partially dealkylated aromatics, contained in the produced gasoline (GL). It is worth mentioning that the variables describing process conditions and catalyst properties have very low impact, expressed as low loadings along PC1. The critical role of feed composition on the overall performance of the FCC process has been recurrently indicated before [12,24,28,55].
The process conditions are strongly correlated with PC2, which describes 19.09% of the variance. The three operational conditions (CO, t and T) are on one side of the plot because increasing each of those (and specifically T) leads to an increase of severity of operation with higher cracking conversion. Within the conditions studied here, the trend of variables in increasing order of influence (loading) in the process are: catalyst-to-oil ratio (CO) < time (t) < temperature (T). A cluster of points is observed on the lower side of Figure 4a, which has been zoomed in Figure 4d. Time (t) strongly influences the content of coke (Ck) and octane number (RON), which present zero loading along PC1 and do not seem to be significantly affected by the properties of the feed. Some paraffins (such as P4 and PT) are also linked with t, presenting very similar loadings, as a result of the higher predominance of hydrogen transfer reactions at more severe process conditions, but their loadings along PC1 suggest that also feed properties are playing a role in their formation. Specifically, and based on Figure 4a, the PC1 loadings for PT and P4 indicate that the paraffin content in the feed (Pf) is determining in this regard. Temperature (T) influences the quality of the products, in terms of olefin content and RON, and quantity of the lighter fractions such as LPG and LG. Attention should be placed on the fact that olefins (OT) and propylene (O3), which is one of the most important products in the FCC, is more influenced by process conditions (PC2) and T in particular, than feed properties (PC1). These observations were already reported by Ibarra et al. [28] for the catalytic cracking of VGO + bio-oil blends. Specifically, temperature has a greater impact in the formation of gas products (LPG and LG) by favoring cracking reactions, in particular the extent of each type of reaction (monomolecular, bimolecular, etc.) [56]. Furthermore, T is also known to heavily determine the total yield of olefins in the products as a consequence of paraffin dehydrogenation reactions being favored [57,58].
The catalyst properties are strongly correlated with PC3, which describes 12.72% of the variance, as displayed in Figure 4b. Among the dependent products, only the coke content (Ck) seems to be affected by the catalyst properties, while the rest of the variables present loadings closer to zero along PC3. At the same time, Ck has a null loading of PC1 related with feed properties (see Figure 4a,d) and significant loading of PC2 related with process conditions, in particular related with time, as observed in Figure 4d. This behavior of coke demonstrated the significant impact of reaction time on coke formation [30].
The catalyst properties show two clusters of data points along PC3, which have been zoomed in Figure 4e,f. In this case, the main correlated properties to Ck are those concerning acidity and textural features (Figure 4e), in the following order: Ac > mV > BL > SM >> SM, Fe >> Al. Thus, among the catalyst properties, acidity descriptors are the ones that should be primarily considered for the modeling of cracking reactions [59]. Inversely, on the opposite side of PC3 (Figure 4f), the variables of the catalyst found present the following loading trend: P > Na > Ni ≈ V >> Re. These elements, and specifically the first four, are then correlated with the decrease of acidity in the original catalyst or the spent one.
As an overview of the variable categorization:
  • Among the feed properties, the lump fraction with more than 20 carbons is the one affecting the most on the yields of cycle oils, whereas the fraction with less than 20 carbons is correlated with the amount and aromatic content of gasoline. The chemical composition of the feed is of lesser relevance than its boiling point distribution.
  • Among the process conditions, the key variables are predominantly time and temperature, which are strongly correlated with the amount and olefin content of the lighter fractions (dry and liquified petroleum gases, with attention to propylene).
  • Among the catalyst properties, two sets of variables have been obtained: those positively affecting the FCC performance, such as acidity and micropore area, and detrimental variables, such as the content of P, Na, V or Ni.

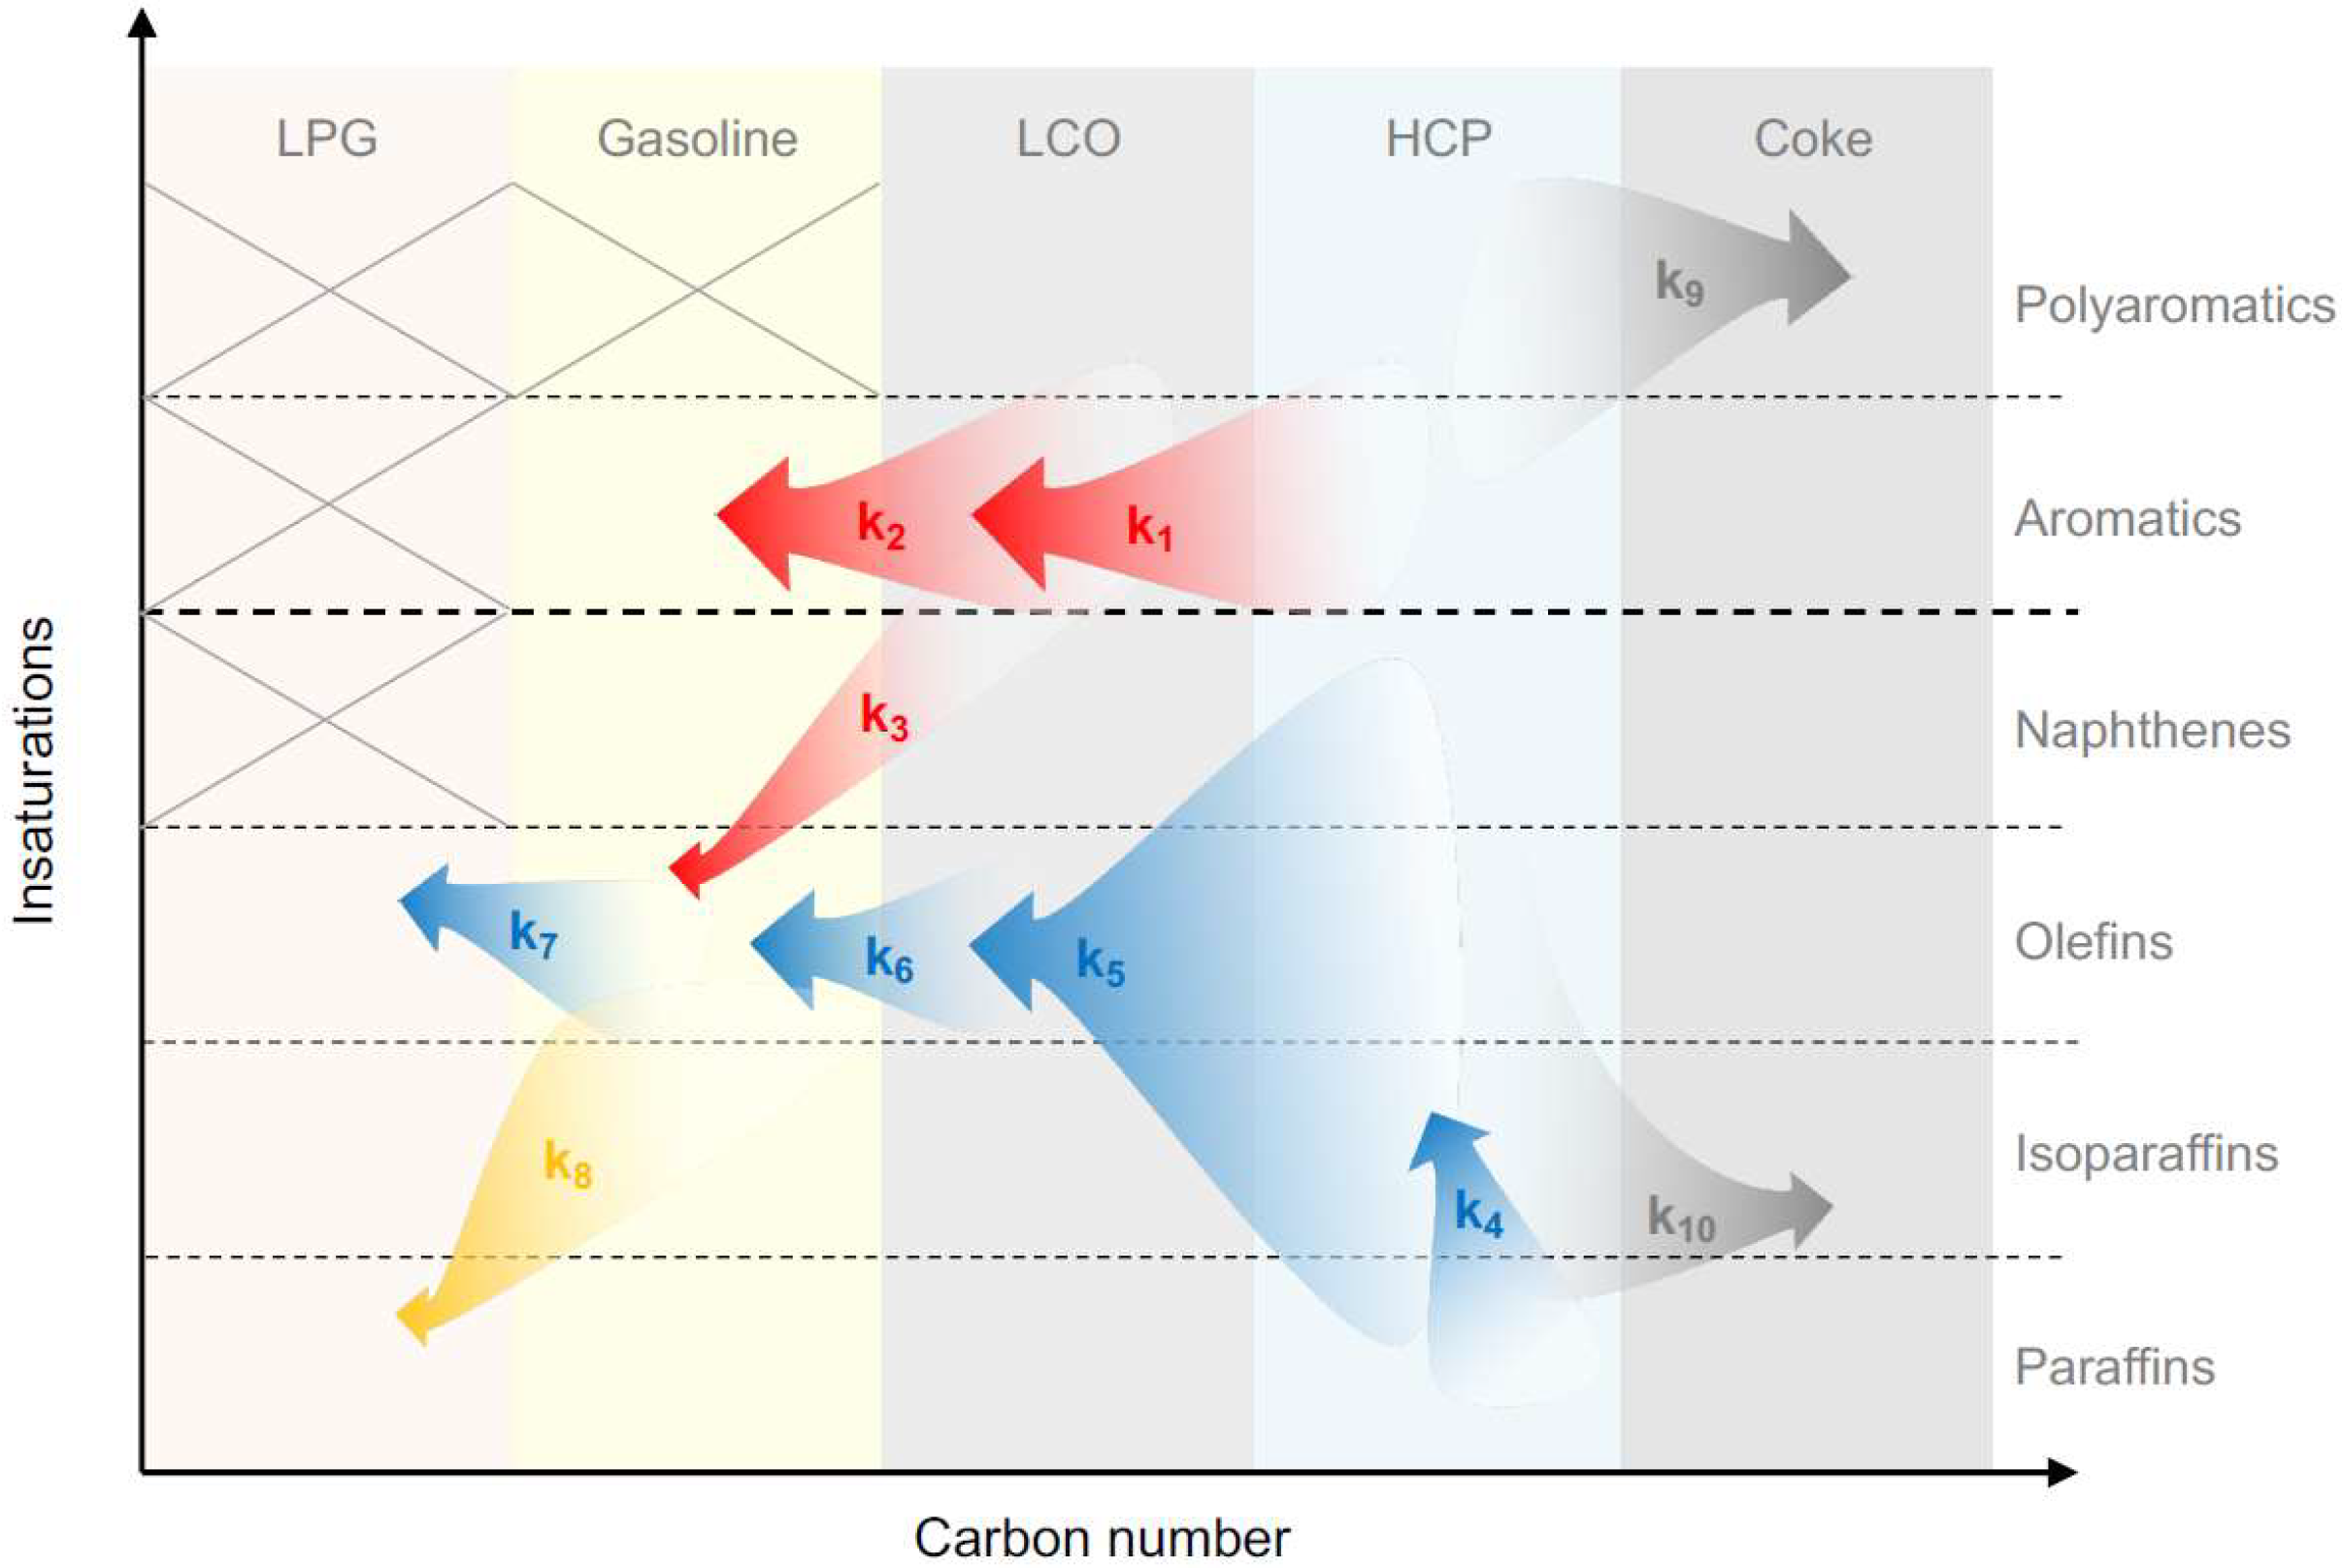
3.3. Reaction Network

The main goal of this work was to orientate the results of PCA for establishing a reaction network in the cracking of waste feeds. The most important set of parameters in the reaction were feed properties (PC1). Along with the feed composition (Table 1) and products, we have divided the reaction network into a bi-dimensional area of insaturations and carbon number to facilitate reading the reaction network described in Figure 5. Table 1 shows that all feeds have a majority of aromatic and HCO fractions, except for PW (that does not contain aromatics) and STPO (that contains a significant fraction of LCO and gasoline). The amount of HCO in the feed (Hf) is linked with unconverted HCO and LCO of products (Figure 4a), and the amount of LCO and gasoline in the feed (Lf and Gf, respectively) is correlated with different aromatics in the gasoline products (Figure 4c). Given the aromatic nature of the products of FCC [60], one of the main pathways of the reaction is the dealkylation of aromatics from the HCO and LCO fractions into lighter ones in gasoline (k1 and k2 in Figure 5). At the same time, olefins with 5–7 carbons are linked with those reactants (Gf and Hf, Figure 4a), and thus formed as dealkylated products in gasoline (k3).
Paraffins of the feed (Pf) are correlated to the observed total isoparaffins (IT) in Figure 4a, thus PCA indicates that there is a kinetic rate constant of isomerization (k4). All aliphatic molecules crack though β-scission and hydrogen transfer [17] to mainly sequentially produce olefins in the LCO (k5), gasoline (k6) and LPG (k7) range. The cracking products (mainly olefins) are poorly affected by the composition of the feed (PC1), and strongly affected by process conditions (PC2) in particular by the temperature (Figure 4d). Thus, cracking reactions (particularly k6 and k7) of aliphatic molecules seem to have the highest activation energy among the overall reaction network. Paraffins (mainly pentane and butanes) derive from hydrogen transfer reactions and, at the same time, are linked with process conditions so an additional reaction rate quantifying this reaction is required in the reaction network (k8).
The catalyst properties (PC3) do not play a significant role in the reaction network, as displayed in Figure 4b,e,f, but in coke (Ck) formation. In fact, we could establish two pathways of coke formation: one from polyaromatics and another one from paraffins (in the case of PW), as previously demonstrated [24,61]. Those two pathways would be represented in the reaction network as k9 and k10 and should depend on the HCO fraction of the feed (Hf, Figure 4b) and acid properties of the catalyst (Figure 4b,e).

4. Conclusions

We tested the principal component analysis (PCA) over a set of 104 uncorrelated fluid catalytic cracking (FCC) runs using different waste feeds, catalysts and operation conditions. This approach has proven to be suitable for assessing the impact of 64 variables categorized as feed, process, catalyst and product properties. Subsequently, we developed a simplified reaction network based on the data-driven information acquired through PCA.
The results show that each category of independent variables (feed, process and catalyst properties) has been correlated with a single principal component (PC) in such a way that the percentage of the total variance assigned to those categories results as: PC1, related with feed properties explains 27.41% of the variance; PC2, process conditions, 19.09%; and PC3, catalyst properties, 12.72%.
The PCA results show that the reaction network could be ascribed to a series of: (i) dealkylation of aromatics (k1–3) to yield lighter aromatics and olefins; (ii) isomerization reactions of paraffins to isoparaffins (k4); (iii) cracking reactions (β-scission) of aliphatics to yield light olefins in gasoline and LPG (k5–7); (iv) hydrogen transfer reactions of olefins to yield light paraffins in LPG (k8); and (v) coking reactions which depend on the amount of HCO of the feed and the acidic properties of the catalyst.
In this manner, we have proved that multivariate analysis is a powerful tool to propose a reaction network from where the succeeding reactor modeling could be embraced. At the same time, it provides analytical and compositional perspective, greatly simplifying highly complex FCC conversion processes, and thus presenting high industrial relevance.

Author Contributions

Conceptualization and project administration, P.C.; methodology and supervision, J.M.A. and P.C.; and validation, investigation, data curation and formal analysis, J.I.A, I.H. and E.R.

Funding

This research was funded by the Ministry of Economy and Competitiveness (MINECO) of the Spanish Government (CTQ2015-67425R and CTQ2016-79646-P), the European Regional Development Funds (ERDF) and the Basque Government (IT748-13). Hita is grateful for her postdoctoral grant awarded by the Department of Education, University and Research of the Basque Government (POS_2015_1_0035). Rodriguez is thankful to the University of the Basque Country UPV/EHU (Zabalduz Programme).

Conflicts of Interest

The authors declare no conflict of interest.

References

  1. Charpentier, J.C. In the frame of globalization and sustainability, process intensification, a path to the future of chemical and process engineering (molecules into money). Chem. Eng. J. 2007, 134, 84–92. [Google Scholar] [CrossRef]
  2. Gao, X.; Shang, C.; Jiang, Y.; Huang, D.; Chen, T. Refinery scheduling with varying crude: A deep belief network classification and multimodel approach. AIChE J. 2014, 60, 2525–2532. [Google Scholar] [CrossRef] [Green Version]
  3. Yang, S.; Wang, N. A P systems based hybrid optimization algorithm for parameter estimation of FCCU reactor-regenerator model. Chem. Eng. J. 2012, 211–212, 508–518. [Google Scholar] [CrossRef]
  4. Letzsch, W. Fluid Catalytic Cracking (FCC) in Petroleum Refining. In Handbook of Petroleum Processing; Treese, A.S., Pujadó, R.P., Jones, J.D.S., Eds.; Springer International Publishing: Cham, Switzerland, 2015; pp. 261–316. ISBN 978-3-319-14529-7. [Google Scholar]
  5. Chen, Y.M. Recent advances in FCC technology. Powder Technol. 2006, 163, 2–8. [Google Scholar] [CrossRef]
  6. Fogassy, G.; Thegarid, N.; Schuurman, Y.; Mirodatos, C. The fate of bio-carbon in FCC co-processing products. Green Chem. 2012, 14, 1367–1371. [Google Scholar] [CrossRef]
  7. Zhang, Y.; Brown, T.R.; Hu, G.; Brown, R.C. Techno-economic analysis of two bio-oil upgrading pathways. Chem. Eng. J. 2013, 225, 895–904. [Google Scholar] [CrossRef]
  8. Corma, A.; Corresa, E.; Mathieu, Y.; Sauvanaud, L.; Al-Bogami, S.; Al-Ghrami, M.S.; Bourane, A. Crude oil to chemicals: Light olefins from crude oil. Catal. Sci. Technol. 2017, 7, 12–46. [Google Scholar] [CrossRef]
  9. Vogt, E.T.C.; Weckhuysen, B.M. Fluid catalytic cracking: Recent developments on the grand old lady of zeolite catalysis. Chem. Soc. Rev. 2015, 44, 7342–7370. [Google Scholar] [CrossRef] [PubMed]
  10. Corma, A.; Sauvanaud, L. FCC testing at bench scale: New units, new processes, new feeds. Catal. Today 2013, 218–219, 107–114. [Google Scholar] [CrossRef]
  11. Arandes, J.M.; Torre, I.; Azkoiti, M.J.; Ereña, J.; Olazar, M.; Bilbao, J. HZSM-5 zeolite as catalyst additive for residue cracking under FCC conditions. Energy Fuels 2009, 23, 4215–4223. [Google Scholar] [CrossRef]
  12. Arandes, J.M.; Torre, I.; Azkoiti, M.J.; Ereña, J.; Bilbao, J. Effect of atmospheric residue incorporation in the fluidized catalytic cracking (FCC) feed on product stream yields and composition. Energy Fuels 2008, 22, 2149–2156. [Google Scholar] [CrossRef]
  13. García, J.R.; Falco, M.; Sedran, U. Intracrystalline mesoporosity over Y zeolites. Processing of VGO and resid-VGO mixtures in FCC. Catal. Today 2017, 296, 247–253. [Google Scholar] [CrossRef]
  14. Passamonti, F.J.; Sedran, U. Recycling of waste plastics into fuels. LDPE conversion in FCC. Appl. Catal. B Environ. 2012, 125, 499–506. [Google Scholar] [CrossRef]
  15. Odjo, A.O.; García, A.N.; Marcilla, A. Conversion of low density polyethylene into fuel through co-processing with vacuum gas oil in a fluid catalytic cracking riser reactor. Fuel Process. Technol. 2013, 113, 130–140. [Google Scholar] [CrossRef]
  16. Torre, I.; Arandes, J.M.; Castaño, P.; Azkoiti, M.J.; Bilbao, J.; de Lasa, H.I. Catalytic Cracking of Plastic Pyrolysis Waxes with Vacuum Gasoil: Effect of HZSM-5 Zeolite in the FCC Catalyst. Int. J. Chem. React. Eng. 2006, 4. [Google Scholar] [CrossRef]
  17. Arandes, J.M.; Azkoiti, M.J.; Torre, I.; Olazar, M.; Castaño, P. Effect of HZSM-5 catalyst addition on the cracking of polyolefin pyrolysis waxes under FCC conditions. Chem. Eng. J. 2007, 132, 17–26. [Google Scholar] [CrossRef]
  18. Arandes, J.M.M.; Torre, I.; Azkoiti, M.J.J.; Castaño, P.; Bilbao, J.; de Lasa, H. Effect of catalyst properties on the cracking of polypropylene pyrolysis waxes under FCC conditions. Catal. Today 2008, 133, 413–419. [Google Scholar] [CrossRef]
  19. Arandes, J.M.; Torre, I.; Castaño, P.; Olazar, M.; Bilbao, J. Catalytic cracking of waxes produced by the fast pyrolysis of polyolefins. Energy Fuels 2007, 21, 561–569. [Google Scholar] [CrossRef]
  20. Lovás, P.; Hudec, P.; Jambor, B.; Hájeková, E.; Horňáček, M. Catalytic cracking of heavy fractions from the pyrolysis of waste HDPE and PP. Fuel 2017, 203, 244–252. [Google Scholar] [CrossRef]
  21. Hita, I.; Rodríguez, E.; Olazar, M.; Bilbao, J.; Arandes, J.M.M.; Castaño, P. Prospects for Obtaining High Quality Fuels from the Hydrocracking of a Hydrotreated Scrap Tires Pyrolysis Oil. Energy Fuels 2015, 29, 5458–5466. [Google Scholar] [CrossRef]
  22. Hita, I.; Gutiérrez, A.; Olazar, M.; Bilbao, J.; Arandes, J.M.; Castaño, P. Upgrading model compounds and Scrap Tires Pyrolysis Oil (STPO) on hydrotreating NiMo catalysts with tailored supports. Fuel 2015, 145, 158–169. [Google Scholar] [CrossRef]
  23. Cordero-Lanzac, T.; Hita, I.; Veloso, A.; Arandes, J.M.; Rodríguez-Mirasol, J.; Bilbao, J.; Cordero, T.; Castaño, P. Characterization and controlled combustion of carbonaceous deactivating species deposited on an activated carbon-based catalyst. Chem. Eng. J. 2017, 327, 454–464. [Google Scholar] [CrossRef]
  24. Errekatxo, A.; Ibarra, A.; Gutierrez, A.; Bilbao, J.; Arandes, J.M.; Castaño, P. Catalytic deactivation pathways during the cracking of glycerol and glycerol/VGO blends under FCC unit conditions. Chem. Eng. J. 2017, 307, 955–965. [Google Scholar] [CrossRef]
  25. De Pinho, A.R.; de Almeida, M.B.B.; Mendes, F.L.; Ximenes, V.L.; Casavechia, L.C. Co-processing raw bio-oil and gasoil in an FCC Unit. Fuel Process. Technol. 2015, 131, 159–166. [Google Scholar] [CrossRef]
  26. Ma, W.; Liu, B.; Zhang, R.; Gu, T.; Ji, X.; Zhong, L.; Chen, G.; Ma, L.; Cheng, Z.; Li, X. Co-upgrading of raw bio-oil with kitchen waste oil through fluid catalytic cracking (FCC). Appl. Energy 2018, 217, 233–240. [Google Scholar] [CrossRef]
  27. Wang, Y.; Cao, Y.; Li, J. Preparation of biofuels with waste cooking oil by fluid catalytic cracking: The effect of catalyst performance on the products. Renew. Energy 2018, 124, 34–39. [Google Scholar] [CrossRef]
  28. Ibarra, Á.; Rodríguez, E.; Sedran, U.; Arandes, J.M.; Bilbao, J. Synergy in the Cracking of a Blend of Bio-oil and Vacuum Gasoil under Fluid Catalytic Cracking Conditions. Ind. Eng. Chem. Res. 2016, 55, 1872–1880. [Google Scholar] [CrossRef]
  29. Bertero, M.; La Puente, G.D.; Sedran, U. Products and coke from the conversion of bio-oil acids, esters, aldehydes and ketones over equilibrium FCC catalysts. Renew. Energy 2013, 60, 349–354. [Google Scholar] [CrossRef]
  30. Ibarra, A.; Veloso, A.; Bilbao, J.; Arandes, J.M.; Castaño, P. Dual coke deactivation pathways during the catalytic cracking of raw bio-oil and vacuum gasoil in FCC conditions. Appl. Catal. B Environ. 2016, 182, 336–346. [Google Scholar] [CrossRef]
  31. Bezergianni, P.S.; Dimitriadis, A.; Kikhtyanin, O.; Kubi Cka, D. Refinery co-processing of renewable feeds. Prog. Energy Combust. Sci. 2018, 68, 29–64. [Google Scholar] [CrossRef]
  32. Feital, T.; Kruger, U.; Dutra, J.; Pinto, J.C.; Lima, E.L. Modeling and performance monitoring of multivariate multimodal processes. AIChE J. 2013, 59, 1557–1569. [Google Scholar] [CrossRef]
  33. Rato, T.; Reis, M.; Schmitt, E.; Hubert, M.; De Ketelaere, B. A systematic comparison of PCA-based Statistical Process Monitoring methods for high-dimensional, time-dependent Processes. AIChE J. 2016, 62, 1478–1493. [Google Scholar] [CrossRef]
  34. Tomita, R.K.; Park, S.W.; Sotomayor, O.A.Z. Analysis of activated sludge process using multivariate statistical tools—A PCA approach. Chem. Eng. J. 2002, 90, 283–290. [Google Scholar] [CrossRef]
  35. Zhang, J.; Martin, E.B.; Morris, A.J. Process monitoring using non-linear statistical techniques. Chem. Eng. J. 1997, 67, 181–189. [Google Scholar] [CrossRef]
  36. Gregersen, L.; Jørgensen, S.B. Supervision of fed-batch fermentations. Chem. Eng. J. 1999, 75, 69–76. [Google Scholar] [CrossRef]
  37. Kashani, M.N.; Shahhosseini, S. A methodology for modeling batch reactors using generalized dynamic neural networks. Chem. Eng. J. 2010, 159, 195–202. [Google Scholar] [CrossRef]
  38. Sjögren, M.; Li, H.; Rannug, U.; Westerholm, R. A multivariate statistical analysis of chemical composition and physical characteristics of ten diesel fuels. Fuel 1995, 74, 983–989. [Google Scholar] [CrossRef]
  39. Pasadakis, N.; Yiokari, C.; Varotsis, N.; Vayenas, C. Characterization of hydrotreating catalysts using the principal component analysis. Appl. Catal. A Gen. 2001, 207, 333–341. [Google Scholar] [CrossRef]
  40. Mostad, H.B.; Riis, T.U.; Ellestad, O.H. Use of principal component analysis in catalyst characterization. Catalytic cracking of decalin over Y-zeolites. Appl. Catal. 1990, 64, 119–141. [Google Scholar] [CrossRef]
  41. Héberger, K.; Németh, A.; Cotarca, L.; Delogu, P. Principal component analysis of data on the catalytic oxidation of toluene. Appl. Catal. A Gen. 1994, 119, L7–L12. [Google Scholar] [CrossRef]
  42. Aguado, R.; Elordi, G.; Arrizabalaga, A.; Artetxe, M.; Bilbao, J.; Olazar, M. Principal component analysis for kinetic scheme proposal in the thermal pyrolysis of waste HDPE plastics. Chem. Eng. J. 2014, 254, 357–364. [Google Scholar] [CrossRef]
  43. Aguado, R.; Arrizabalaga, A.; Arabiourrutia, M.; Lopez, G.; Bilbao, J.; Olazar, M. Principal component analysis for kinetic scheme proposal in the thermal and catalytic pyrolysis of waste tyres. Chem. Eng. Sci. 2014, 106, 9–17. [Google Scholar] [CrossRef]
  44. Li, H.; Zhang, Z.; Liu, Z. Application of Artificial Neural Networks for Catalysis: A Review. Catalysts 2017, 7, 306. [Google Scholar] [CrossRef]
  45. Cheng, Z.; Yang, B.; Chen, Q.; Gao, X.; Tan, Y.; Ma, Y.; Shen, Z. A Quantitative-Structure-Activity-Relationship (QSAR) model for the reaction rate constants of organic compounds during the ozonation process at different temperatures. Chem. Eng. J. 2018, 353, 288–296. [Google Scholar] [CrossRef]
  46. Zhang, Y.; Teng, Y. Process data modeling using modified kernel partial least squares. Chem. Eng. Sci. 2010, 65, 6353–6361. [Google Scholar] [CrossRef]
  47. Tonetto, G.M.; Ferreira, M.L.; Atias, J.A.; De Lasa, H.I. Effect of steaming treatment in the structure and reactivity of FCC catalysts. AIChE J. 2006, 52, 754–768. [Google Scholar] [CrossRef]
  48. Johnson, M. Estimation of the zeolite content of a catalyst from nitrogen adsorption isotherms. J. Catal. 1978, 52, 425–431. [Google Scholar] [CrossRef]
  49. Elordi, G.; Olazar, M.; Lopez, G.; Artetxe, M.; Bilbao, J. Product Yields and Compositions in the Continuous Pyrolysis of High-Density Polyethylene in a Conical Spouted Bed Reactor. Ind. Eng. Chem. Res 2011, 50, 6650–6659. [Google Scholar] [CrossRef]
  50. Arabiourrutia, M.; Lopez, G.; Elordi, G.; Olazar, M.; Aguado, R.; Bilbao, J. Product distribution obtained in the pyrolysis of tyres in a conical spouted bed reactor. Chem. Eng. Sci. 2007, 62, 5271–5275. [Google Scholar] [CrossRef]
  51. Al-Sabawi, M.; De Lasa, H. Kinetic modeling of catalytic conversion of methylcyclohexane over USY zeolites: Adsorption and reaction phenomena. AIChE J. 2009, 55, 1538–1558. [Google Scholar] [CrossRef]
  52. Anderson, J.E.; Kramer, U.; Mueller, S.A.; Wallington, T.J. Octane Numbers of Ethanol- and Methanol-Gasoline Blends Estimated from Molar Concentrations. Energy Fuels 2010, 24, 6576–6585. [Google Scholar] [CrossRef]
  53. Arabiourrutia, M.; Olazar, M.; Aguado, R.; López, G.; Barona, A.; Bilbao, J. HZSM-5 and HY Zeolite Catalyst Performance in the Pyrolysis of Tires in a Conical Spouted Bed Reactor. Ind. Eng. Chem. Res. 2008, 47, 7600–7609. [Google Scholar] [CrossRef]
  54. Olazar, M.; Aguado, R.; Arabiourrutia, M.; Lopez, G.; Barona, A.; Bilbao, J. Catalyst Effect on the Composition of Tire Pyrolysis Products. Energy Fuels 2008, 22, 2909–2916. [Google Scholar] [CrossRef]
  55. Torre, I.; Arandes, J.M.; Azkoiti, M.J.; Olazar, M.; Bilbao, J. Cracking of coker naphtha with gas-oil. Effect of HZSM-5 zeolite addition to the catalyst. Energy Fuels 2007, 21, 11–18. [Google Scholar] [CrossRef]
  56. Li, J.; Li, T.; Ma, H.; Sun, Q.; Li, C.; Ying, W.; Fang, D. Kinetics of coupling cracking of butene and pentene on modified HZSM-5 catalyst. Chem. Eng. J. 2018, 346, 397–405. [Google Scholar] [CrossRef]
  57. He, S.; Li, J.; Wang, B.; Dai, X.; Sun, C.; Bai, Z.; Guo, Q.; Seshan, K. Metals modification of the paraffin dehydrogenation catalyst regenerated by coke combustion. Appl. Catal. A Gen. 2016, 513, 82–88. [Google Scholar] [CrossRef]
  58. Bhasin, M.M.; McCain, J.H.; Vora, B.V.; Imai, T.; Pujadó, P.R. Dehydrogenation and oxydehydrogenation of paraffins to olefins. Appl. Catal. A Gen. 2001, 221, 397–419. [Google Scholar] [CrossRef]
  59. Van Borm, R.; Reyniers, M.-F.; Marin, G.B. Catalytic cracking of alkanes on FAU: Single-event microkinetic modeling including acidity descriptors. AIChE J. 2012, 58, 2202–2215. [Google Scholar] [CrossRef]
  60. Gutiérrez, A.; Arandes, J.M.; Castaño, P.; Olazar, M.; Bilbao, J. Preliminary studies on fuel production through LCO hydrocracking on noble-metal supported catalysts. Fuel 2012, 94, 504–515. [Google Scholar] [CrossRef]
  61. Epelde, E.; Ibañez, M.; Aguayo, A.T.; Gayubo, A.G.; Bilbao, J.; Castaño, P. Differences among the deactivation pathway of HZSM-5 zeolite and SAPO-34 in the transformation of ethylene or 1-butene to propylene. Microporous Mesoporous Mater. 2014, 195, 284–293. [Google Scholar] [CrossRef]
Figure 1. Main properties of the catalysts employed (CAT-1 to -3): (a) textural properties; and (b) acidic properties. See Table 1 for abbreviations.
Processes 06 00243 g001
Figure 2. Composition (wt %) in terms of fractions (Gf, Lf and Hf) and lumps (Pf, Of, Nf and Af) for all feeds used in this study. Detailed designations for the different fractions and lumps can be found in Table 1.
Processes 06 00243 g002
Figure 3. Score plot for 104 uncorrelated runs in terms of: (a) PC1 vs. PC2; and (b) PC2 vs. PC3. The bars of the plots correspond to the histograms of the projections in each PC.
Processes 06 00243 g003
Figure 4. Varimax loading plots for: (a) PC1 vs. PC2; and (b) PC2 vs. PC3. (c,d) zoomed areas of graph (a); and (e,f) zoomed areas of graph (b).
Processes 06 00243 g004
Figure 5. Reaction network proposed for the cracking of waste feeds based on PCA results.
Processes 06 00243 g005
Table 1. List of the variables (var.) assessed by the principal component analysis.
Var.NameUnitsVar.NameUnits
Catalysts properties LPGYield of LPGb (C3–C4)wt %
STBETa surface aream2 g−1GLYield of gasoline (C5–C12)wt %
SmMicropore aream2 g−1iGLGasoline identifiedwt %
SMMatrix or mesopore aream2 g−1LCOYield of light cycle oil (C13–C20)wt %
ZZeolite percentagewt %HCOYield of heavy cycle oil (C20+)wt %
VmMicropore volumecm3 g−1CkCoke content on the catalystwt %
mVMean pore volumecm3 g−1RONOctane number (GL)
DcZeolite cell unit sizeÅA6Benzenewt %
CuContent of CuppmA7Toluenewt %
NiContent of NippmA8Xyleneswt %
VContent of VppmA9Aromatics with 9 carbonswt %
FeContent of Fewt %A10+Aromatics with 10 carbonswt %
NaContent of Nawt %ATTotal aromaticswt %
AlContent of Al2O3wt %NTTotal naphtheneswt %
ReContent of rare earths Re2O3wt %P3Propanewt %
PContent of P2O5wt %P4Butanewt %
AcTotal aciditymmol g−1PTTotal paraffinswt %
BLBrönsted-Lewis acid site ratiomol mol−1O3Propylenewt %
Feed properties O4Buteneswt %
PfParaffinswt %O5Penteneswt %
OfOlefinswt %OTTotal olefinswt %
NfNaphtheneswt %ITTotal isoparaffinswt %
AfAromaticswt %C3C3 hydrocarbonswt %
SfSulfurwt %C4C4 hydrocarbonswt %
GfGasoline (C5–C12)wt %C5C5 hydrocarbonswt %
LfLight cycle oil (C13–C20)wt %C6C6 hydrocarbonswt %
HfHeavy cycle oil (C20+)wt %C7C7 hydrocarbonswt %
Reaction conditions C8C8 hydrocarbonswt %
COCatalyst-to-oil ratiog g−1C9C9 hydrocarbonswt %
tContact timesC10C10+ hydrocarbonswt %
TTemperature°CCTTotal hydrocarbonswt %
Product properties iOTTotal isoolefinswt %
XConversionwt %nOTTotal linear olefinswt %
LGYield of light gases (C1–C2)wt %cOTTotal cycloolefinswt %
a Brunauer, Emmett and Teller theory; b Liquefied petroleum gas.

