Article

A Coupled Thermal-Hydraulic-Mechanical Nonlinear Model for Fault Water Inrush

College of Mining and Safety Engineering, Shandong University of Science and Technology, Qingdao 266590, China
*
Author to whom correspondence should be addressed.
Processes 2018, 6(8), 120; https://doi.org/10.3390/pr6080120
Submission received: 1 July 2018 / Revised: 2 August 2018 / Accepted: 2 August 2018 / Published: 7 August 2018
(This article belongs to the Special Issue Fluid Flow in Fractured Porous Media)

Abstract

:
A coupled thermal-nonlinear hydraulic-mechanical (THM) model for fault water inrush was carried out in this paper to study the water-rock-temperature interactions and predict the fault water inrush. First, the governing equations of the coupled THM model were established by coupling the particle transport equation, nonlinear flow equation, mechanical equation, and the heat transfer equation. Second, by setting different boundary conditions, the mechanical model, nonlinear hydraulic-mechanical (HM) coupling model, and the thermal-nonlinear hydraulic-mechanical (THM) coupling model were established, respectively. Finally, a numerical simulation of these models was established by using COMSOL Multiphysics. Results indicate that the nonlinear water flow equation could describe the nonlinear water flow process in the fractured zone of the fault. The mining stress and the water velocity had a great influence on the temperature of the fault zone. The temperature change of the fault zone can reflect the change of the seepage field in the fault and confined aquifer. This coupled THM model can provide a numerical simulation method to describe the coupled process of complex geological systems, which can be used to predict the fault water inrush induced by coal mining activities.

1. Introduction

Fault water inrush frequently occurs in China’s coal mines, which is a major threat to mine safety and production. The complexity of geological systems in deep mines, including high ground temperature, high ground water pressure, and high ground stress, has motivated researchers to consider the temperature (T), hydraulic flow (H), and mechanical deformation (M) coupling model for fault water inrush. The coupled THM process has been widely studied in recent years, including the TH [1,2], TM [3], and THM [4,5] coupling process. The international project DECOVALEX has promoted the research on the coupled THM process. Tsang et al. [6] summarized some studies of the project DECOVALEX III. These studies included two field experiments on coupled THM processes in a crystalline rock-bentonite system and in unsaturated tuff, three benchmark tests to evaluate the impact of coupled THM processes under different scenarios and geometries, and different approaches and computer codes for coupled THM processes. Bond et al. [7] presented a study that included 2D and 3D high-resolution coupled thermo-hydro-mechanical-chemical models to study the impact of complex physical and chemical processes on the geological formation surrounding the nuclear waste disposal facility. Graupner et al. [8] introduced and compared different THM coupling models developed by eight modelling teams to study the impact of THM processes on the properties of bentonite where all models were able to reproduce the coupled THM processes of the experiment. Sheng et al. [9] proposed a mechanical model of coupled THM processes for saturated porous media to study the impact of the coupled THM processes on the stresses of borehole wall and wellbore stability, and this model was translated into a set of partial differential equations by using COMSOL (COMSOL Co., Ltd., Shanghai, China). Zhu et al. [10] proposed a THM coupling model to study the effects of the coupled THM processes on the rock damage. Hence, the recent research in this area has mainly focused on the impact of coupled THM processes on the properties of geological environment, while very few of them have studied the hydraulic impact on temperature under the coupled THM processes.
From the aspect of predicting fault water inrush, many scholars have undertaken many studies. Some monitoring techniques have been applied to predict fault water inrush, such as the micro-seismic monitoring technique [11] and multi-field information monitoring technique [12]. Zhou et al. [13] predicted the fault water inrush under the impact of mining depth, fluid pressure, fault dip, and fault length. Xue et al. [14] predicted the water or mud inrush from a fault based on the cusp catastrophe model, and the method of risk prediction was successfully used in the Qingdao Kiaochow Bay subsea tunnel. However, the coupled THM processes has not been considered in the recent research on predicting fault water inrush.
Nonlinear flow in fractured rock has also been widely studied. Liu et al. [15] presented a fractal length distribution model to characterize hydraulic properties of rock fracture networks. Cherubini et al. [16] analyzed nonlinear flow in fractured media through hydraulic tests and numerical simulations. Liu et al. [17] developed a numerical approach to study the hydro-mechanical properties of rock fractures, and obtained the critical condition of quantifying the transition from a linear flow regime to a nonlinear flow regime in 2D fracture networks. According to Yang et al. [18], water inrush through fractured porous media experiences the Darcy flow in a confined aquifer, the non-Darcy flow in the fractured zone of a fault, and the Navier-Stokes’ turbulent flow in coal seams. The non-Darcy flow in the fractured zone in a fault can be governed by the Brinkman equation or Forchheimer equation [19,20]. However, very little of the recent research on nonlinear flow in fractured rock has considered the impact of the coupled THM processes.
The processes of the fault water inrush include the nonlinear water flow process in the fractured zone of the fault and the coupled process of complex geological systems including high ground temperature, high ground water pressure, and high ground stress. In order to predict the fault water inrush, it is necessary to establish a coupled THM model that considers the effect of nonlinear flow in the fractured zone of the fault. In light of this, a coupled thermal-nonlinear hydraulic-mechanical (THM) model for fault water inrush was established in this paper. The governing equations of the THM coupling model couples the particle transport equation, the nonlinear flow equation, the mechanical equation, and the heat transfer equation. The nonlinear flow equation consists of the Darcy-Brinkman-NS equations. By setting different boundary conditions, the mechanical model, HM coupling model, and THM coupling model were established, respectively, to study the nonlinear water flow process in the fractured zone of the fault and the impact of water velocity on the temperature in the coupled THM process. The research results can be used to predict the fault water inrush. This coupled THM model can provide a numerical simulation method to describe the coupled process of the complex geological systems, which can be used to predict the fault water inrush induced by coal mining activities.

2. Governing Equations of Coupled THM Model

The governing equations of the coupled THM model couple the particle transport equation, nonlinear flow equation, mechanical equation, and heat transfer equation. The nonlinear flow equation consists of the Darcy-Brinkman-NS equations [21].

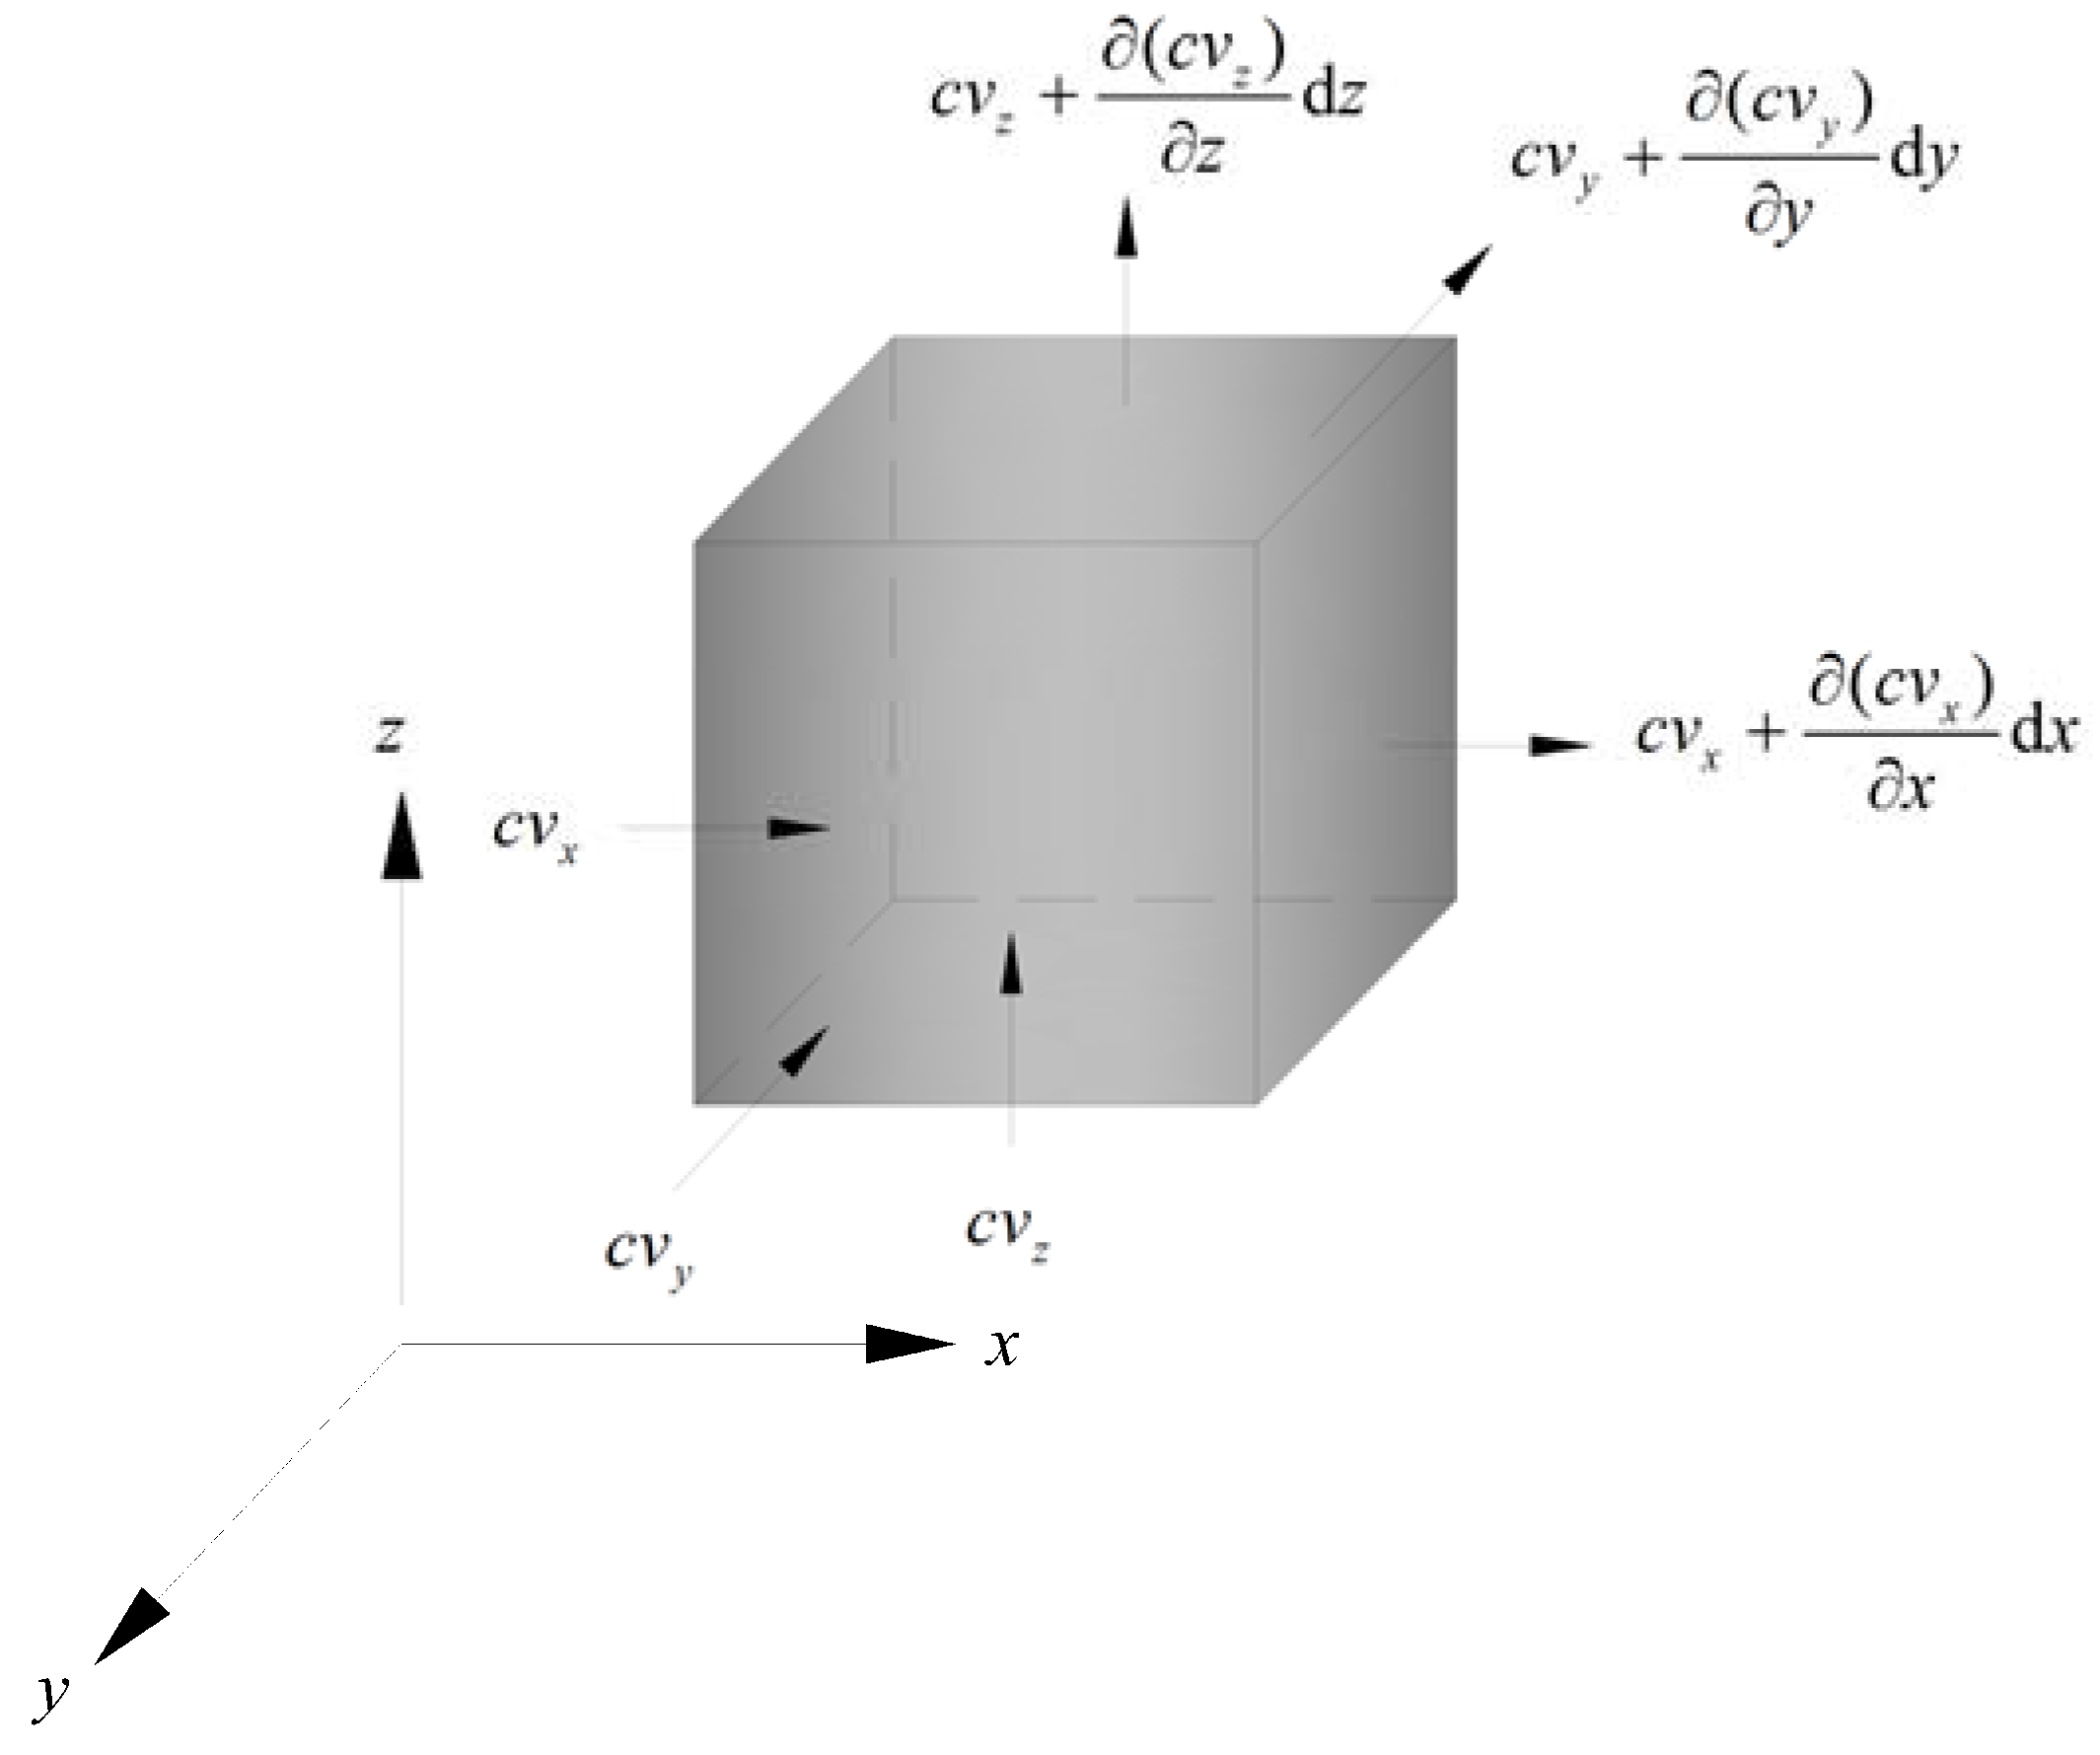
2.1. The Particle Transport Equation

The system of porous media of the fault includes fluid media, solid media, and the particles from solid According to Yao et al. [22], the convection-diffusion equation governs the particle transport. Taking the solid particles as the research object, the governing equation of particle transport was established based on the convection-diffusion equation. Figure 1 shows the micro-control volume for the particle transport equation in rectangular coordinates.
The process of particle transport in the fractured zone of the fault can be treated as the transport of solute in the porous media. As the porous media is non-continuum and the convection diffusion equation is based on fluid continuous media, only the particles and fluid are treated as continuous media, so the convection diffusion equation can be used to establish the particle transport equation. Therefore, the solid media can be treated as a fluid. Based on this assumption, the porous media becomes continuous. Therefore, the equivalent mass concentration of particles is
c = d m p a d V = d m p a d V p o / ε = ε c p a  
where m p a is the mass of particles, kg; d V is the volume of the micro-control volume, m3; d V p o is the volume of pore, m3; and c p a is the actual mass concentration of particles, kg/m3.
The net mass flux increase of particles in the x, y, and z directions is:
( c v x ) x d x d y d z ( c v y ) y d x d y d z ( c v z ) z d x d y d z = ( c v x ) x d V ( c v y ) y d V ( c v z ) z d V  
The mass flux increase can be expressed by the mass concentration increase. Therefore, the net mass flux increase of the particles expressed by the equivalent mass concentration increase of particles in the process of particle transport in unit time is:
( c + c t ) d V c d V = c t   d V  
Solving and simplifying the compatibility of Equations (2) and (3) can obtain:
c t + ( c v p ) =   0    
= x y z  
where v p is the particle velocity, m/s.
The particle transport in the continuous fluid is driven by the effect of convection and diffusion. The effect of convection drives the particles to move at fluid velocity and the effect of diffusion drives the particles to move at diffusion velocity. The diffusion velocity is the difference between the particle velocity and fluid velocity. Therefore, the particle velocity is:
v p = v + v d  
where v is the fluid velocity, m/s; and v d is the diffusion velocity, m/s.
Substituting Equation (6) into Equation (4) can obtain:
c t + ( c v ) + ( c v d ) = 0  
According to Fick’s law, the diffusion flux is:
c v d = D d c  
where D d is diffusion coefficient, m2/s.
Equation (7) is the convection diffusion equation. In fact, as mentioned previously, the process of particle transport in the porous media is non-continuum, which makes the diffusion coefficient of particles less than that in the continuous media. The effect of diffusion in the fractured zone of the fault can be replaced by the effect of hydrodynamic dispersion. Based on Fick’s law, the hydrodynamic dispersion flux is:
J = D c  
where D is the hydrodynamic dispersion coefficient, m2/s.
Substituting Equations (1) and (9) into Equation (7) can obtain:
( ε c p a ) t + ( ε c p a v ) ( D ε c p a ) = 0  
Equation (10) is the particle transport equation for the coupled THM model.

2.2. The Nonlinear Flow Equation

The nonlinear flow equation consists of the Darcy-Brinkman equation-NS equations. According to Yang et al. [20], Darcy’s law is:
[ k μ ( p d + ρ l g z ) ] = Q s  
v D = k μ p d  
where k is the permeability, m2; μ is the fluid dynamic viscosity, N·s/m2; p d is the fluid pressure in the confined aquifer, Pa; v D is the Darcy velocity in the confined aquifer, m/s; ρ l is the fluid density, kg/m3; z is a unit vector in the vertical direction; g is the gravitational acceleration, m/s2; and Q s is the volumetric flow rate, 1/s.
According to Yang et al. [19], the Brinkman equation is:
( μ ε ( v b + ( v b ) T ) ) ( μ k v b + p b ) = 0  
v b = 0  
where ε is the porosity; v b is the fluid velocity in the fault, m/s; and p b is the fluid pressure in the fault, Pa.
According to Yang et al. [19], the Navier-Stokes equation is:
μ ( v n + ( v n ) T ) + ρ v n v n p n = 0  
v n = 0  
where v n is the fluid velocity in the coal seam, m/s; and p n is the fluid pressure in the coal seam, Pa.

2.3. The Mechanical Equation

The mechanical equation is:
σ = F  
where σ is the total stress, Pa; and F is the volume forces, N/m3.

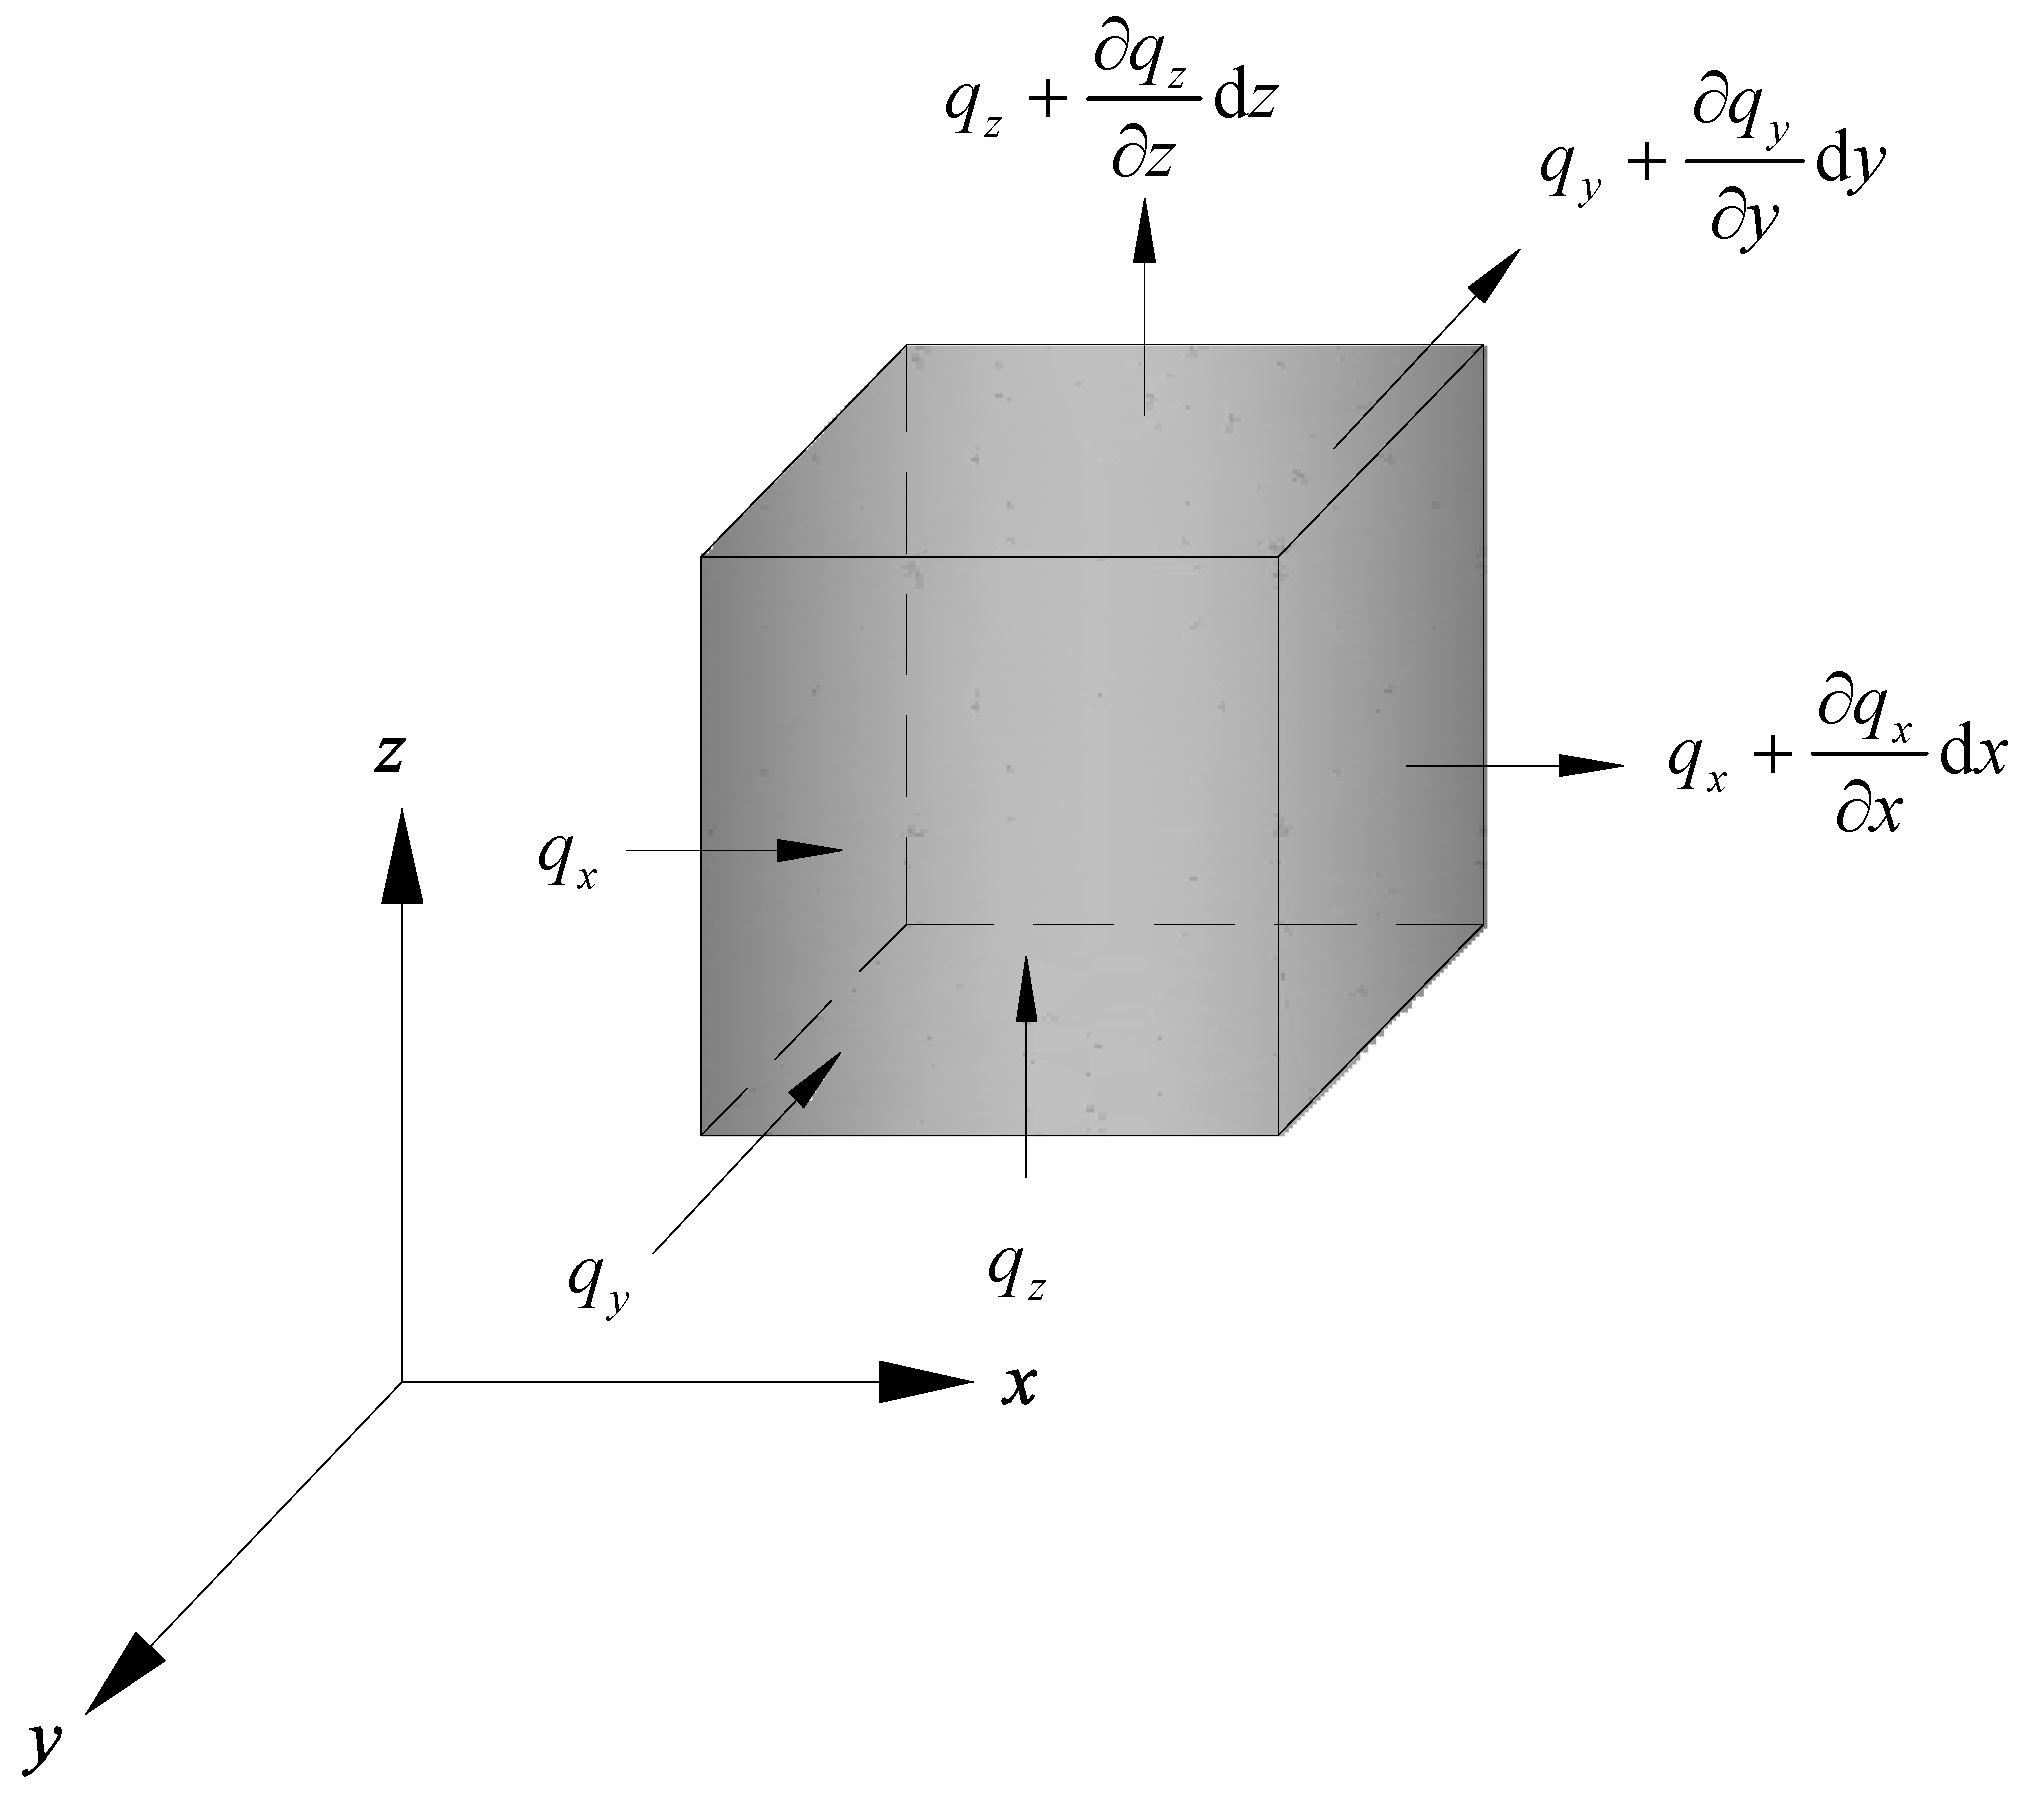
2.4. The Heat Transfer Equation

The heat transfer equation is based on the heat transport theory in porous media of Bear et al. [23]. The heat transfer equation for the coupled THM model is established by rectangular coordinates. Figure 2 shows the micro-control volume for the heat transfer equation in the rectangular coordinates.
The net heat flux increase of micro-control volume in the x, y, and z directions is:
q x x d x d y d z q y y d x d y d z q z z d x d y d z = q x x d V q y y d V q z z d V  
The net heat flux increase of micro-control volume can be also expressed as:
( ρ l c l ) e q T t d V  
( ρ l c l ) e q = θ p k p c p + ε ρ c p  
θ p + ε = 1  
where c l is the specific heat capacity of fluid at constant pressure, J/(kg·K); ρ l is the fluid density, kg/m3; ( ρ c l ) e q is the equivalent volumetric heat capacity at constant pressure, J/(m3·K); T is the temperature of porous media, K; θ p is the volume fraction of solid material; and ε is the volume fraction of fluid or equivalently the porosity.
Solving and simplifying the compatibility of Equations (18) and (19) can obtain:
( ρ l c l ) e q T t + q =   0    
= x y z  
where q is the heat flux density, J/(s·m2).
The process of heat transfer in porous media includes heat conduction, convection, and dispersion. Based on Fourier’s law, the heat flux caused by heat conduction is:
q c =   k c T  
k c = θ p k p + ε k l  
where k c is the thermal conductivity of the solid-fluid system, W/(m·K); and k p and k l are the solid and fluid thermal conductivity respectively, W/(m·K).
The heat flux caused by heat dispersion can be expressed as:
q d =   k d T  
where k d is the thermal dispersion coefficient of the solid-fluid system, W/(m·K).
The sum of the thermal conductivity coefficient and the thermal dispersion coefficient of the solid-fluid system is expressed as:
k e q = k c +   k d  
The heat flux caused by heat convection is proportional to the fluid velocity, which is expressed as:
q a =   ρ l c l v T  
Therefore, the heat flux density is:
q =   q a + q c + q d = ρ l c l v n T k e q T  
Substituting Equation (29) into Equation (22) can obtain:
( ρ l c l ) e q T t + ρ l c l v n T ( k e q T ) =   0    
Equation (30) is the heat transfer equation for the coupled THM model.

3. Model Setup

Before the model setup, some simplifying assumptions for the models are listed as follows: the rock in the models was assumed to be a porous continuous medium; the heat transfer among the solid, liquid, and gas that actually exists in coal mining was assumed to be the heat transfer between the solid and liquid; and the load of the rock above the top boundary of the model on the model was assumed to be the uniform load.
In order to study the nonlinear water flow process in the fractured zone of the fault and the impact of water velocity on the temperature in the coupled THM process, three different kinds of coupling methods were established including the mechanical model (M), nonlinear hydraulic-mechanical (HM) coupling model, and thermal-nonlinear hydraulic-mechanical (THM) coupling model.
In order to study the impact of the working face advanced distance and the water pressure on the temperature, the working face proceeded as per the following steps. At the first step, the working face was excavated to 25 m. Then, each step excavated 10 m along the coal seam, for 10 steps, which moved the working face 125 m forward. The water pressure in the confined aquifer was applied in a monotonically increasing mode with an increment of 1 MPa per step, which made the water pressure increase from 0 MPa to 10 MPa.

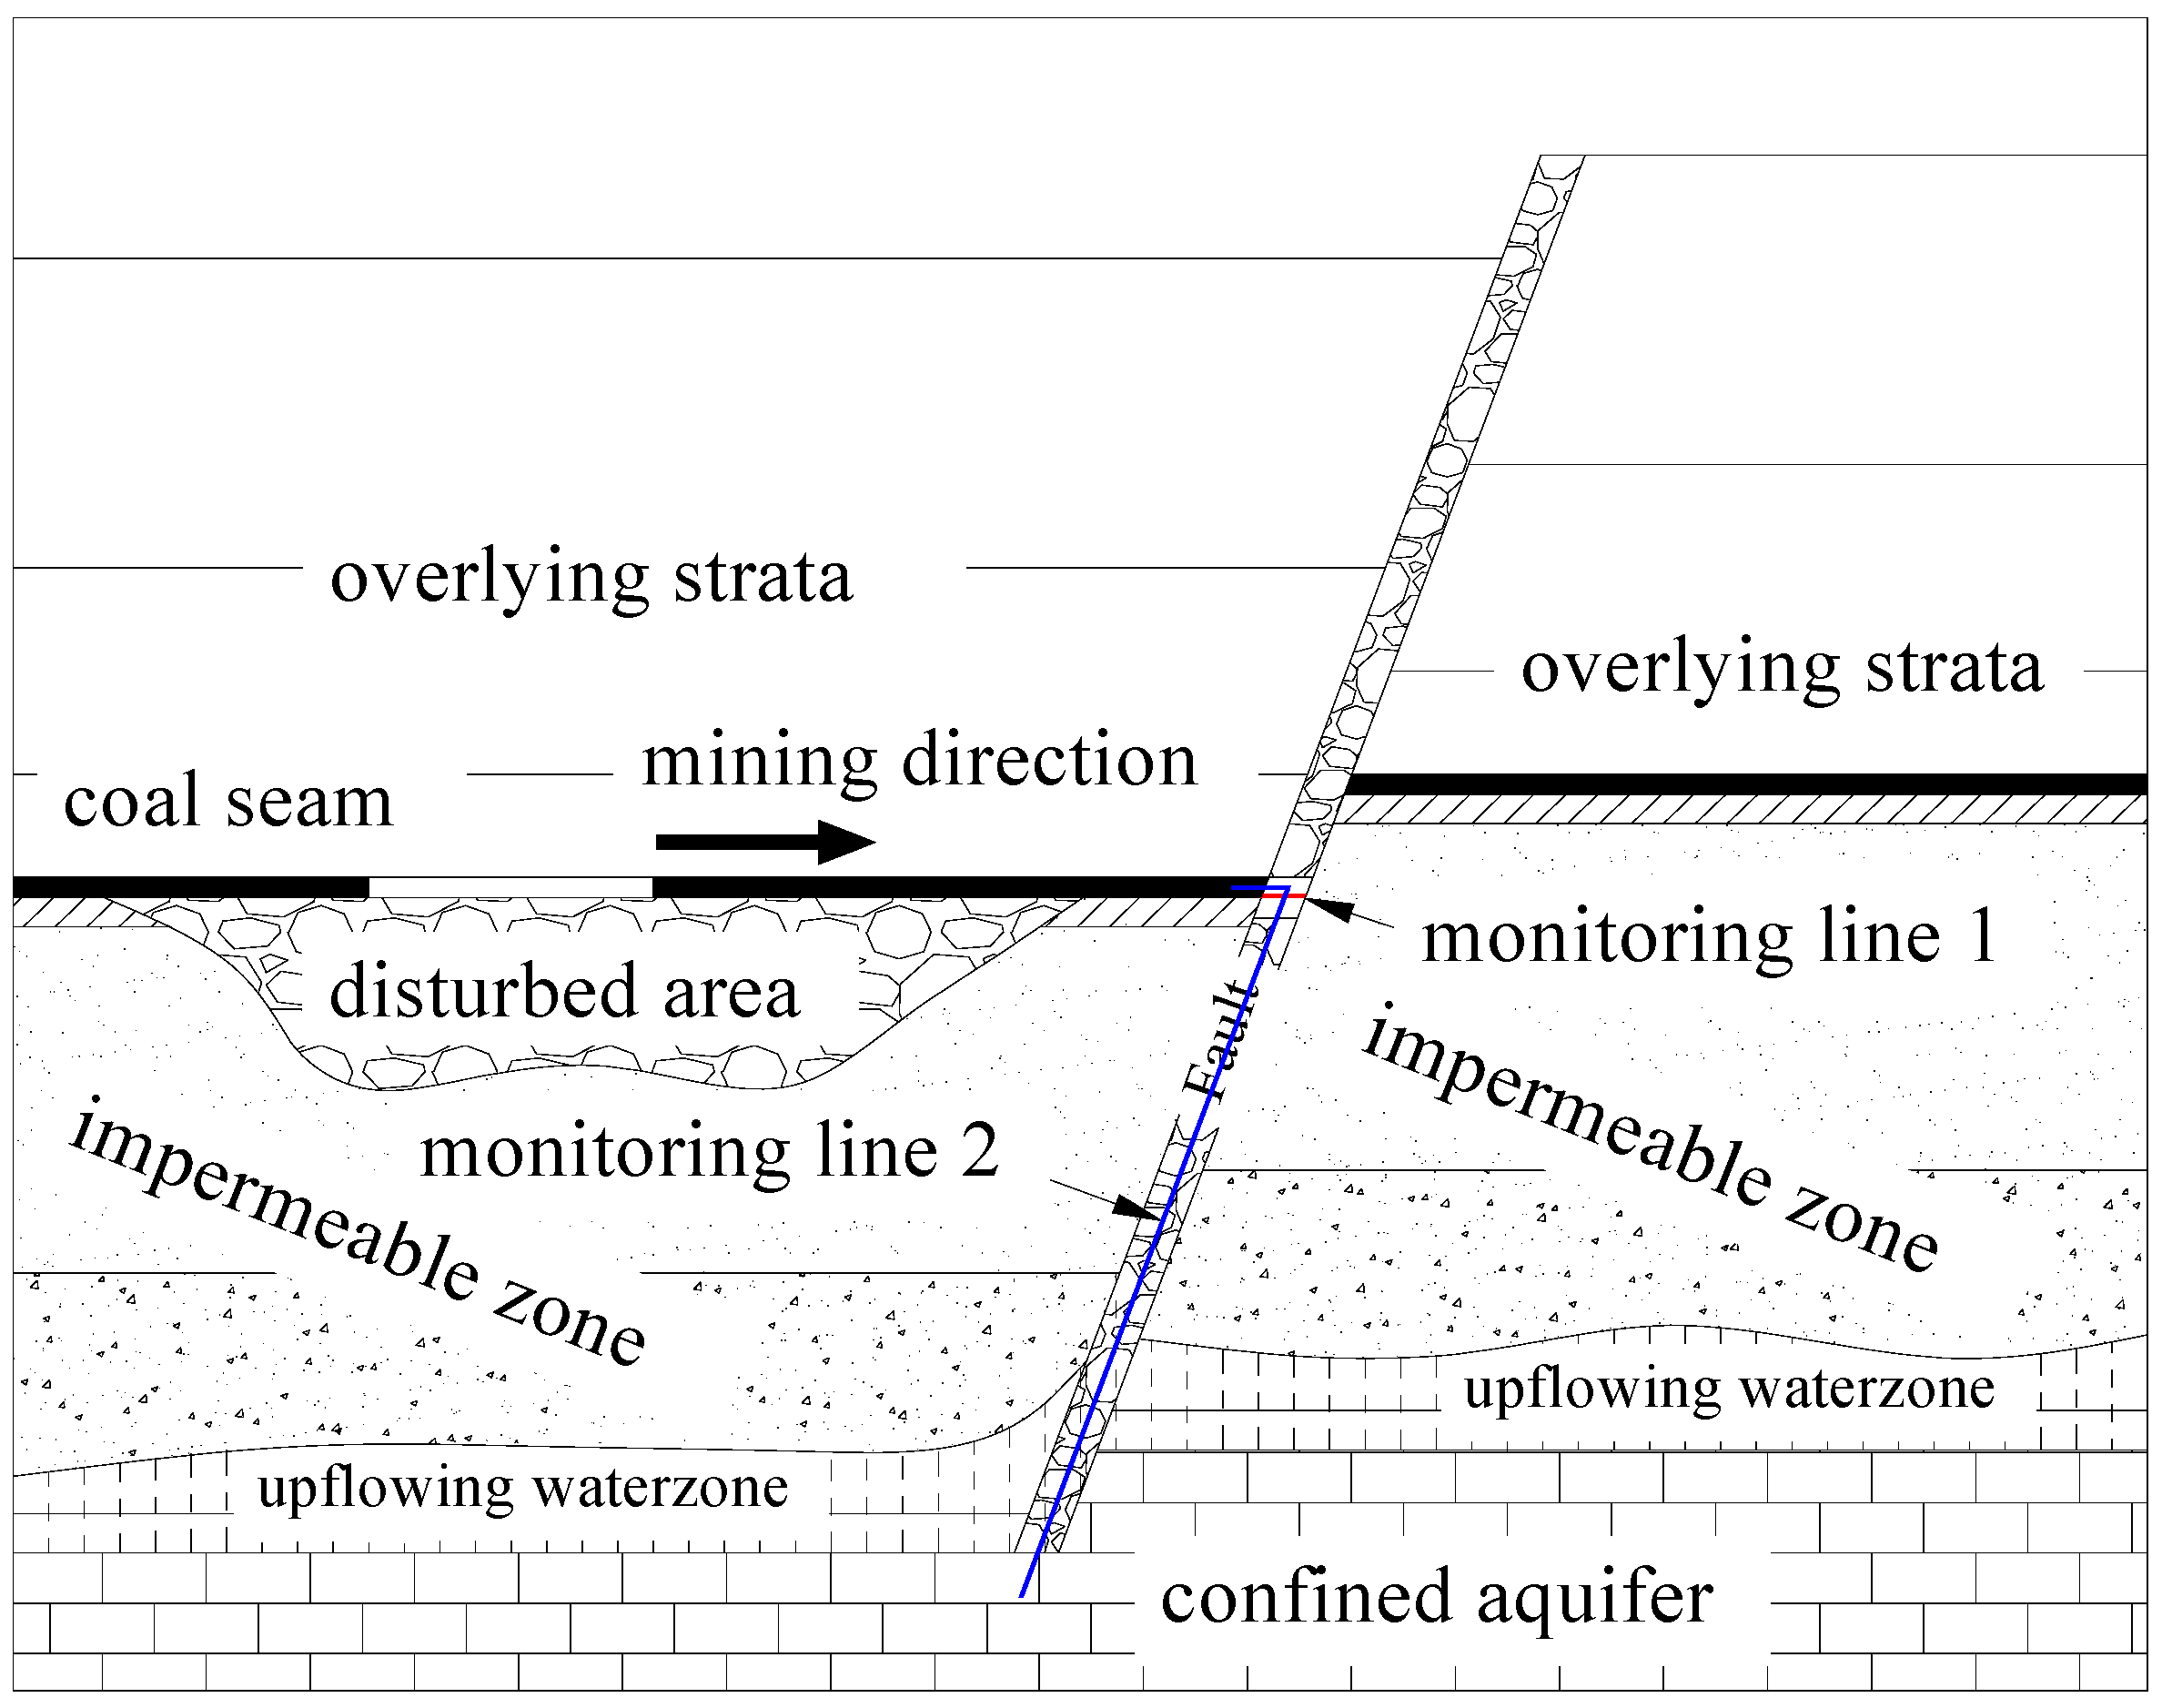
3.1. The Engineering Background and the Geologic Model

The 2307 working face of coal seam 3 in the Anju coal mine of China is at an elevation of about −980 m. The distance between the limestone aquifer and the coal floor is about 89.5 m. The water pressure is about 4 MPa. Coal Seam 3 is attached to fault F23. Advancing the working face may cause the fault to activate, thus, fault water inrush may occur. Using the Anju coal mine as the background, a numerical simulating model for the coupled THM environments was established by using COMSOL Multiphysics 5.1 (COMSOL Co., Ltd., Shanghai, China). The geometric model is shown in Figure 3 [24]. In order to study the distribution of water velocity and temperature, two monitoring lines were given, as shown in Figure 3. Monitoring line 1 was used to study the temperature and monitoring line 2 was used to study water velocity. According to the hydrogeological report of the Anju coal mine, the mechanical parameters are listed in Table 1.

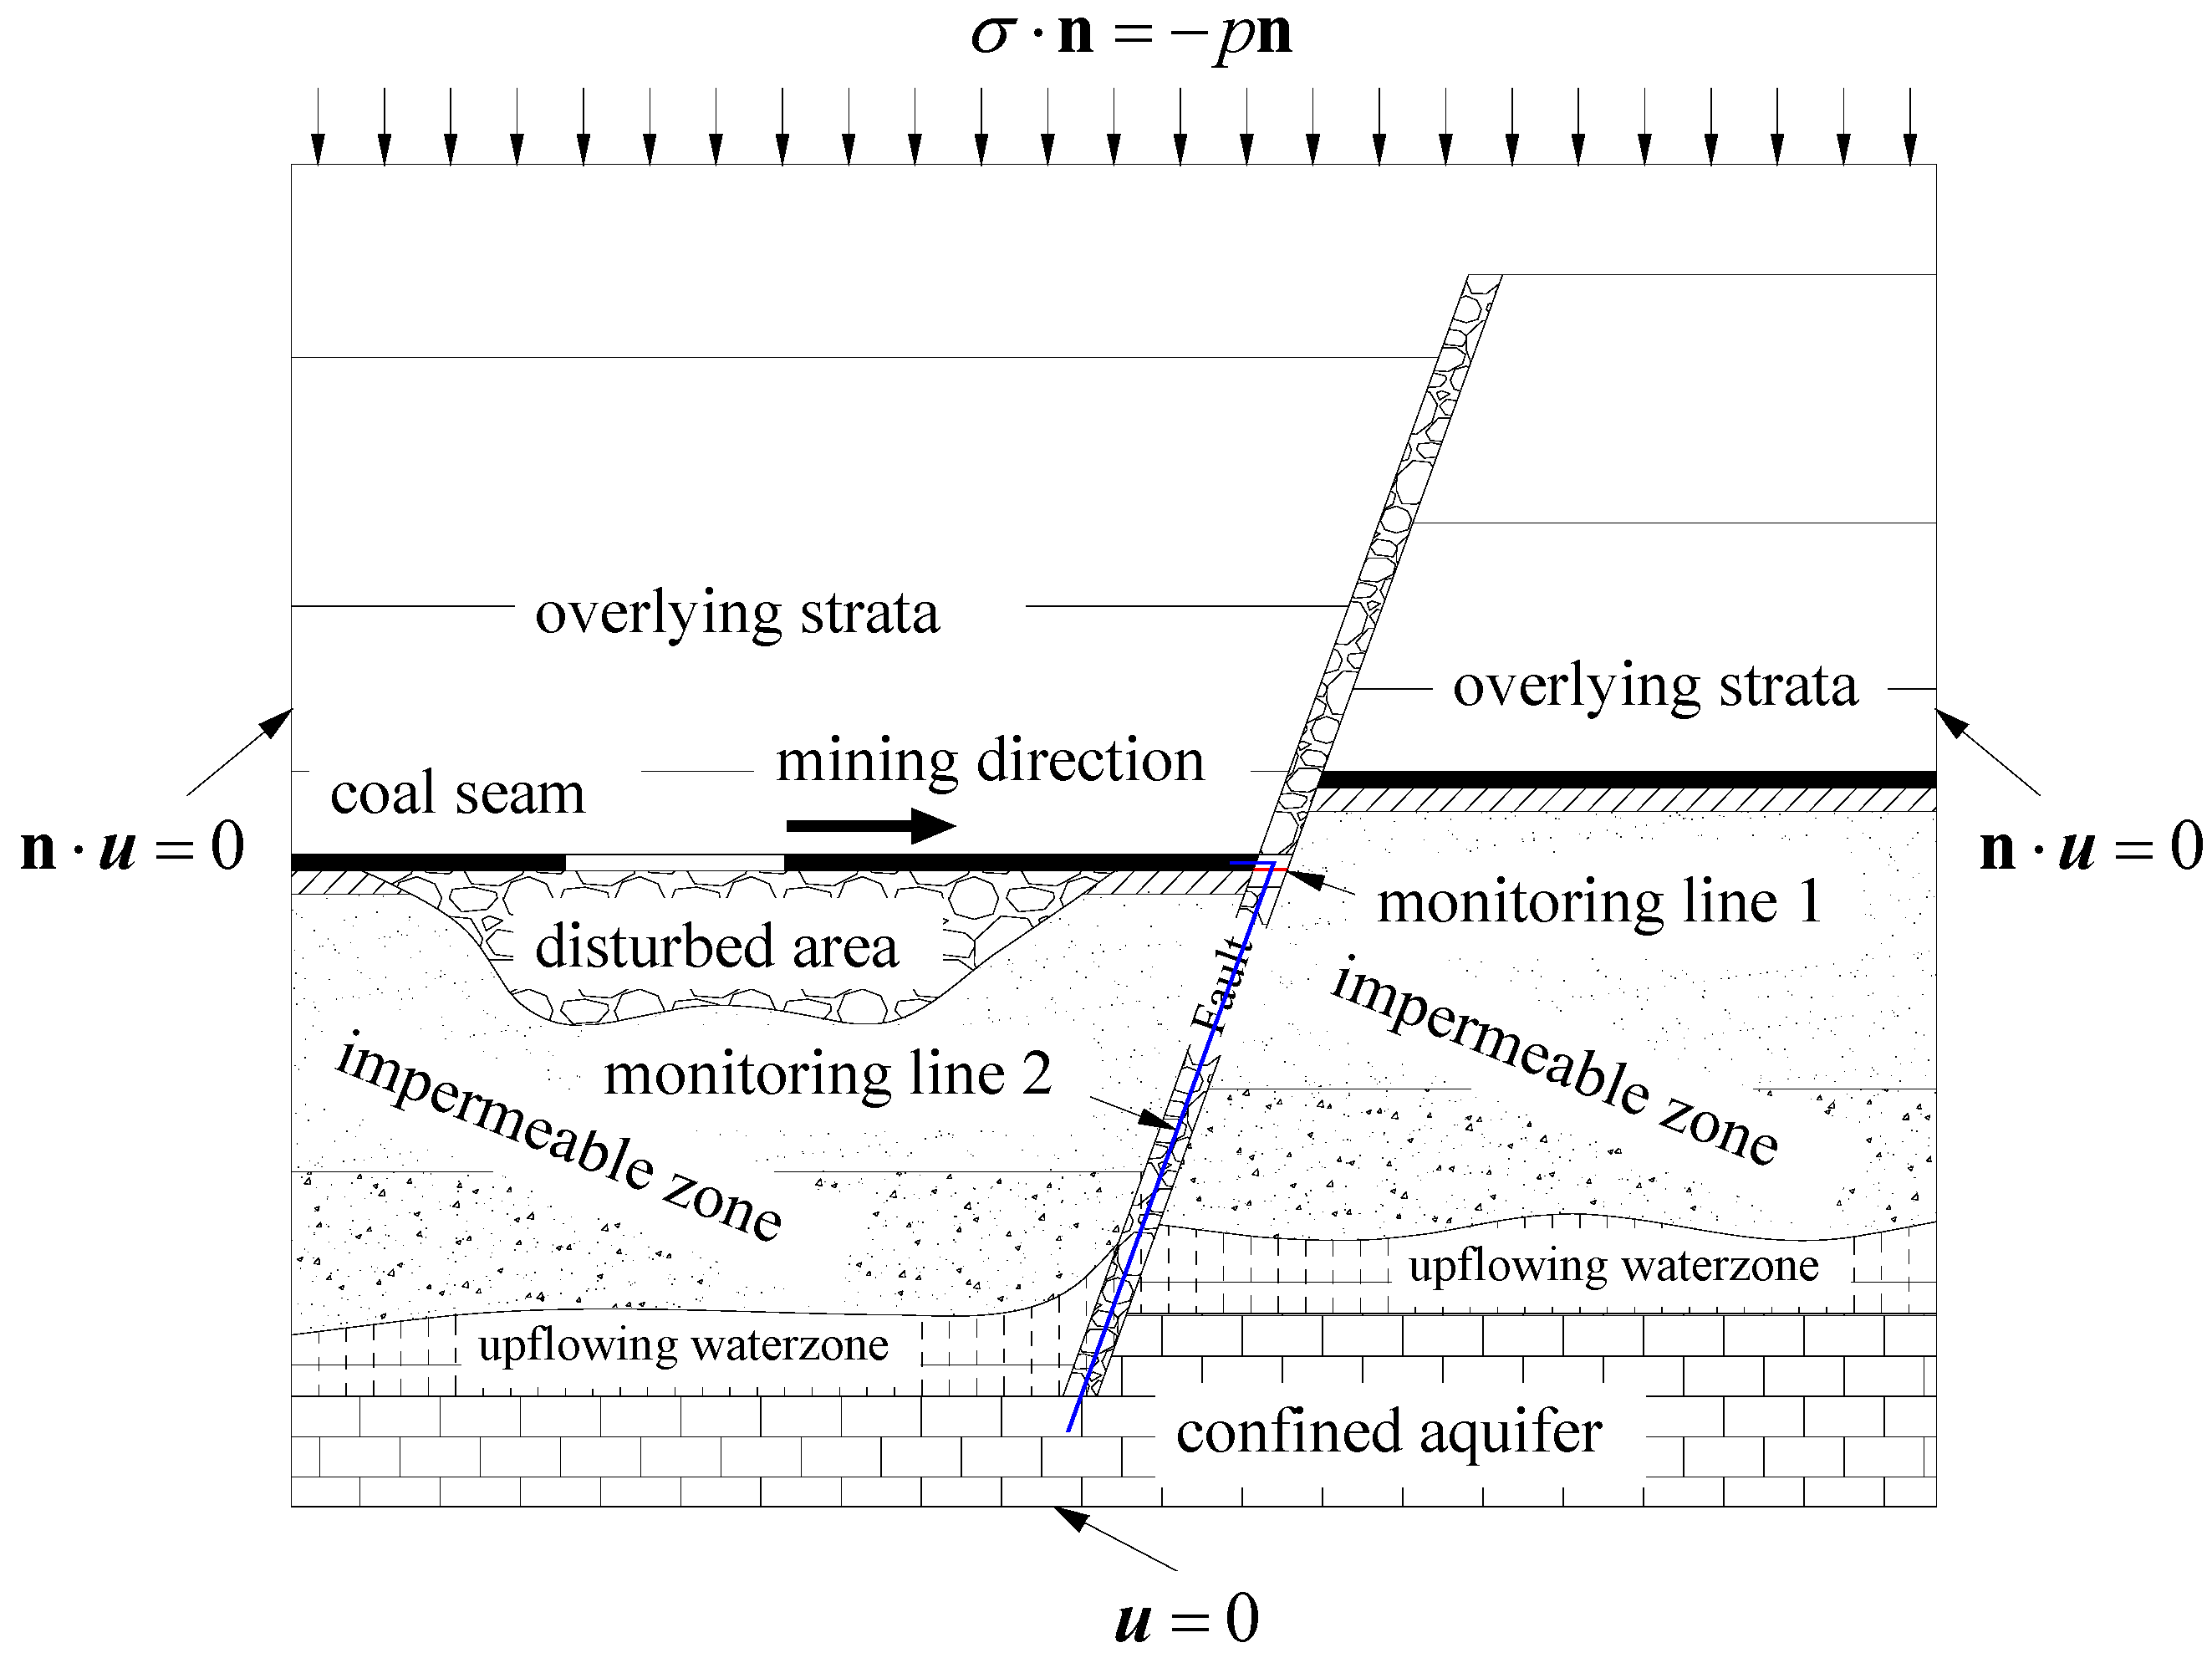
3.2. Boundary Condition Setting

3.2.1. Mechanical Model

Figure 4 shows the boundary condition setting for the mechanical model.
The boundary condition of the top boundary of the geologic model is:
σ n = p n  
where n is the unit vector normal to the boundary; and p is the pressure, Pa. The top boundary of the model was at an elevation of about −867 m, thus the thickness of the overlying strata was about 867 m, which made the boundary load of the top boundary of the model about 22 MPa.
The bottom boundary of the geologic model was set to be the fixed constraint condition:
u = 0  
where u is the displacement vector, m.
The remaining boundaries of the geologic model were set as the slipping constraint condition:
n u = 0  

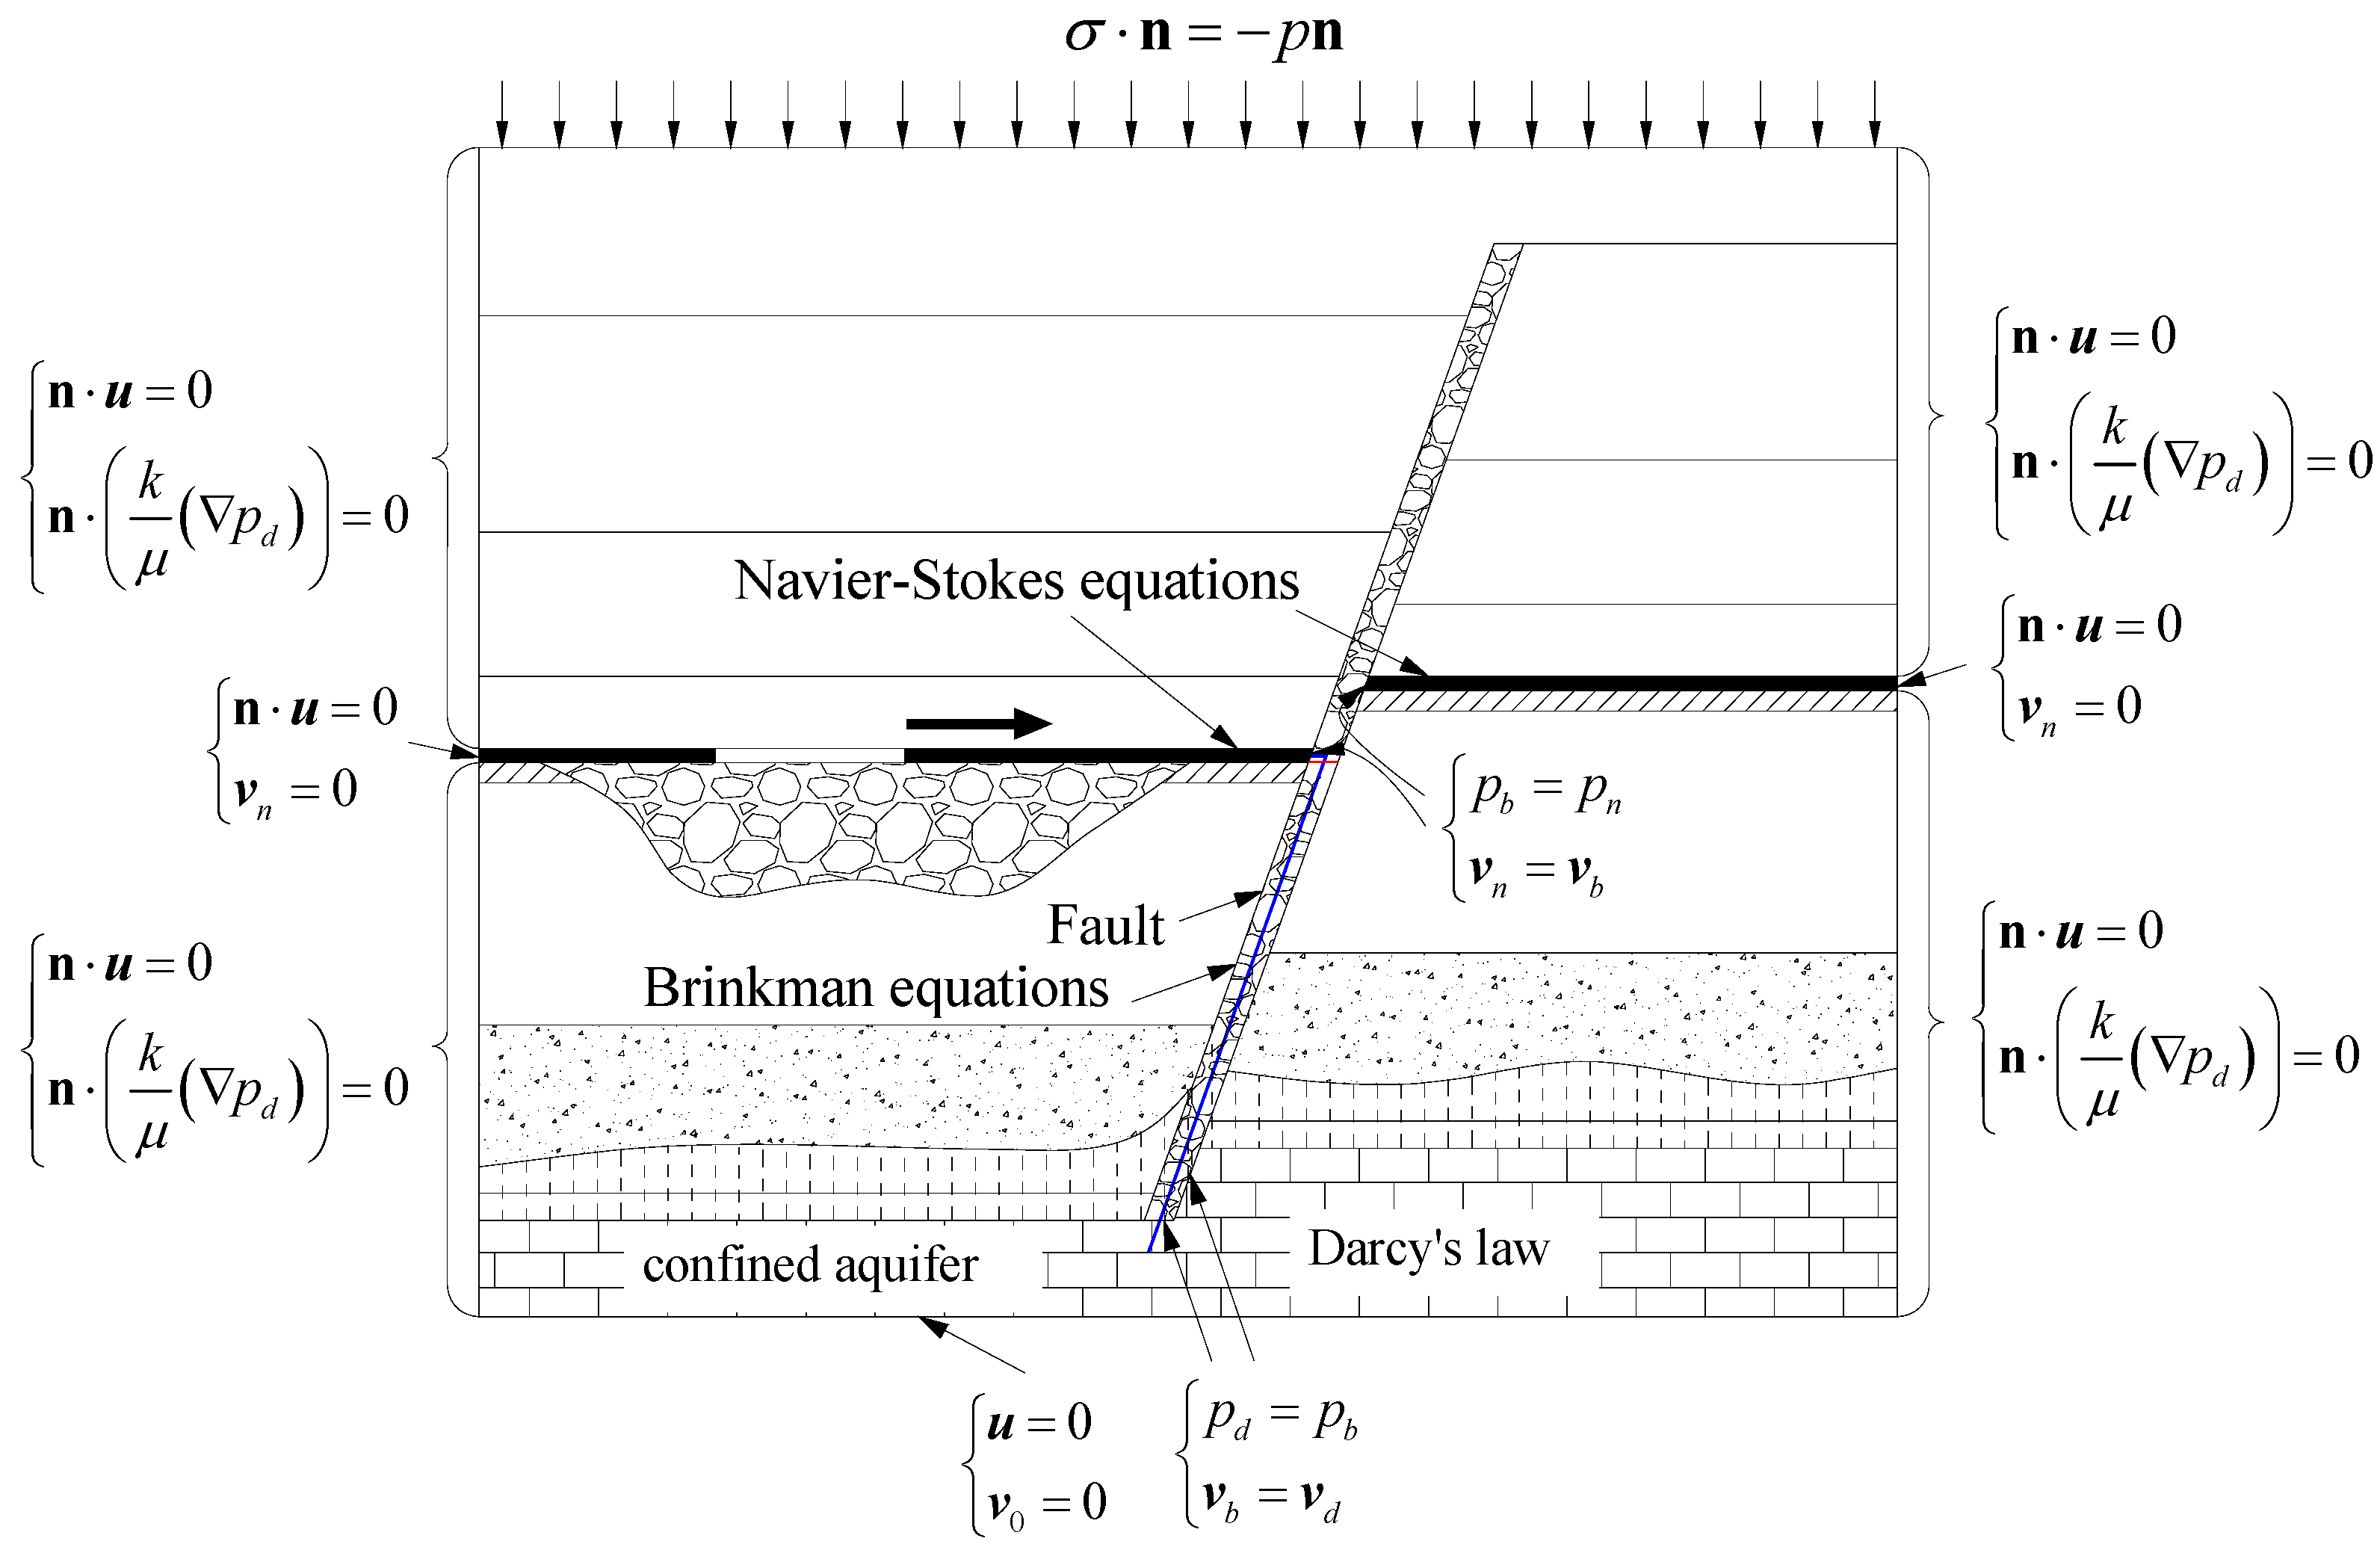
3.2.2. HM Coupling Model

The HM coupling model couples seepage field and stress field. Darcy’s law, the Brinkman equation, and the Navier-Stokes equation are used to govern the water flow in the confined aquifer, the fault, and the coal seam, respectively. Figure 5 shows the boundary condition setting for the HM coupling model.
The bottom boundary of the confined aquifer is the inlet boundary, which was set as v 0 = 1 × 10⁻⁴ m/s. The common boundaries between the confined aquifer and the fault are the outlet boundary of the confined aquifer and the inlet boundary of the fault. In order to obtain a continuous solution at the common boundaries, the pressure and the velocity from the confined aquifer must equal the pressure and velocity from the fault. Therefore, the common boundaries were set as:
p d = p b  
v b = v d  
The right and left boundaries of the geologic model, except for the boundaries of the coal seam, are no flow boundaries, which were set as:
n ( k μ ( p d ) ) = 0  
The common boundaries between the fault and the coal seam are the outlet boundary of the fault and the inlet boundary of the coal seam. The pressure and the velocity from the fault must equal the pressure and the velocity from the coal seam. Therefore, the common boundaries between the fault and the coal seam were set as:
p b = p n  
v n = v b  
The right and left boundaries of the coal seam are the outlet boundary, which were set as:
v n = 0  

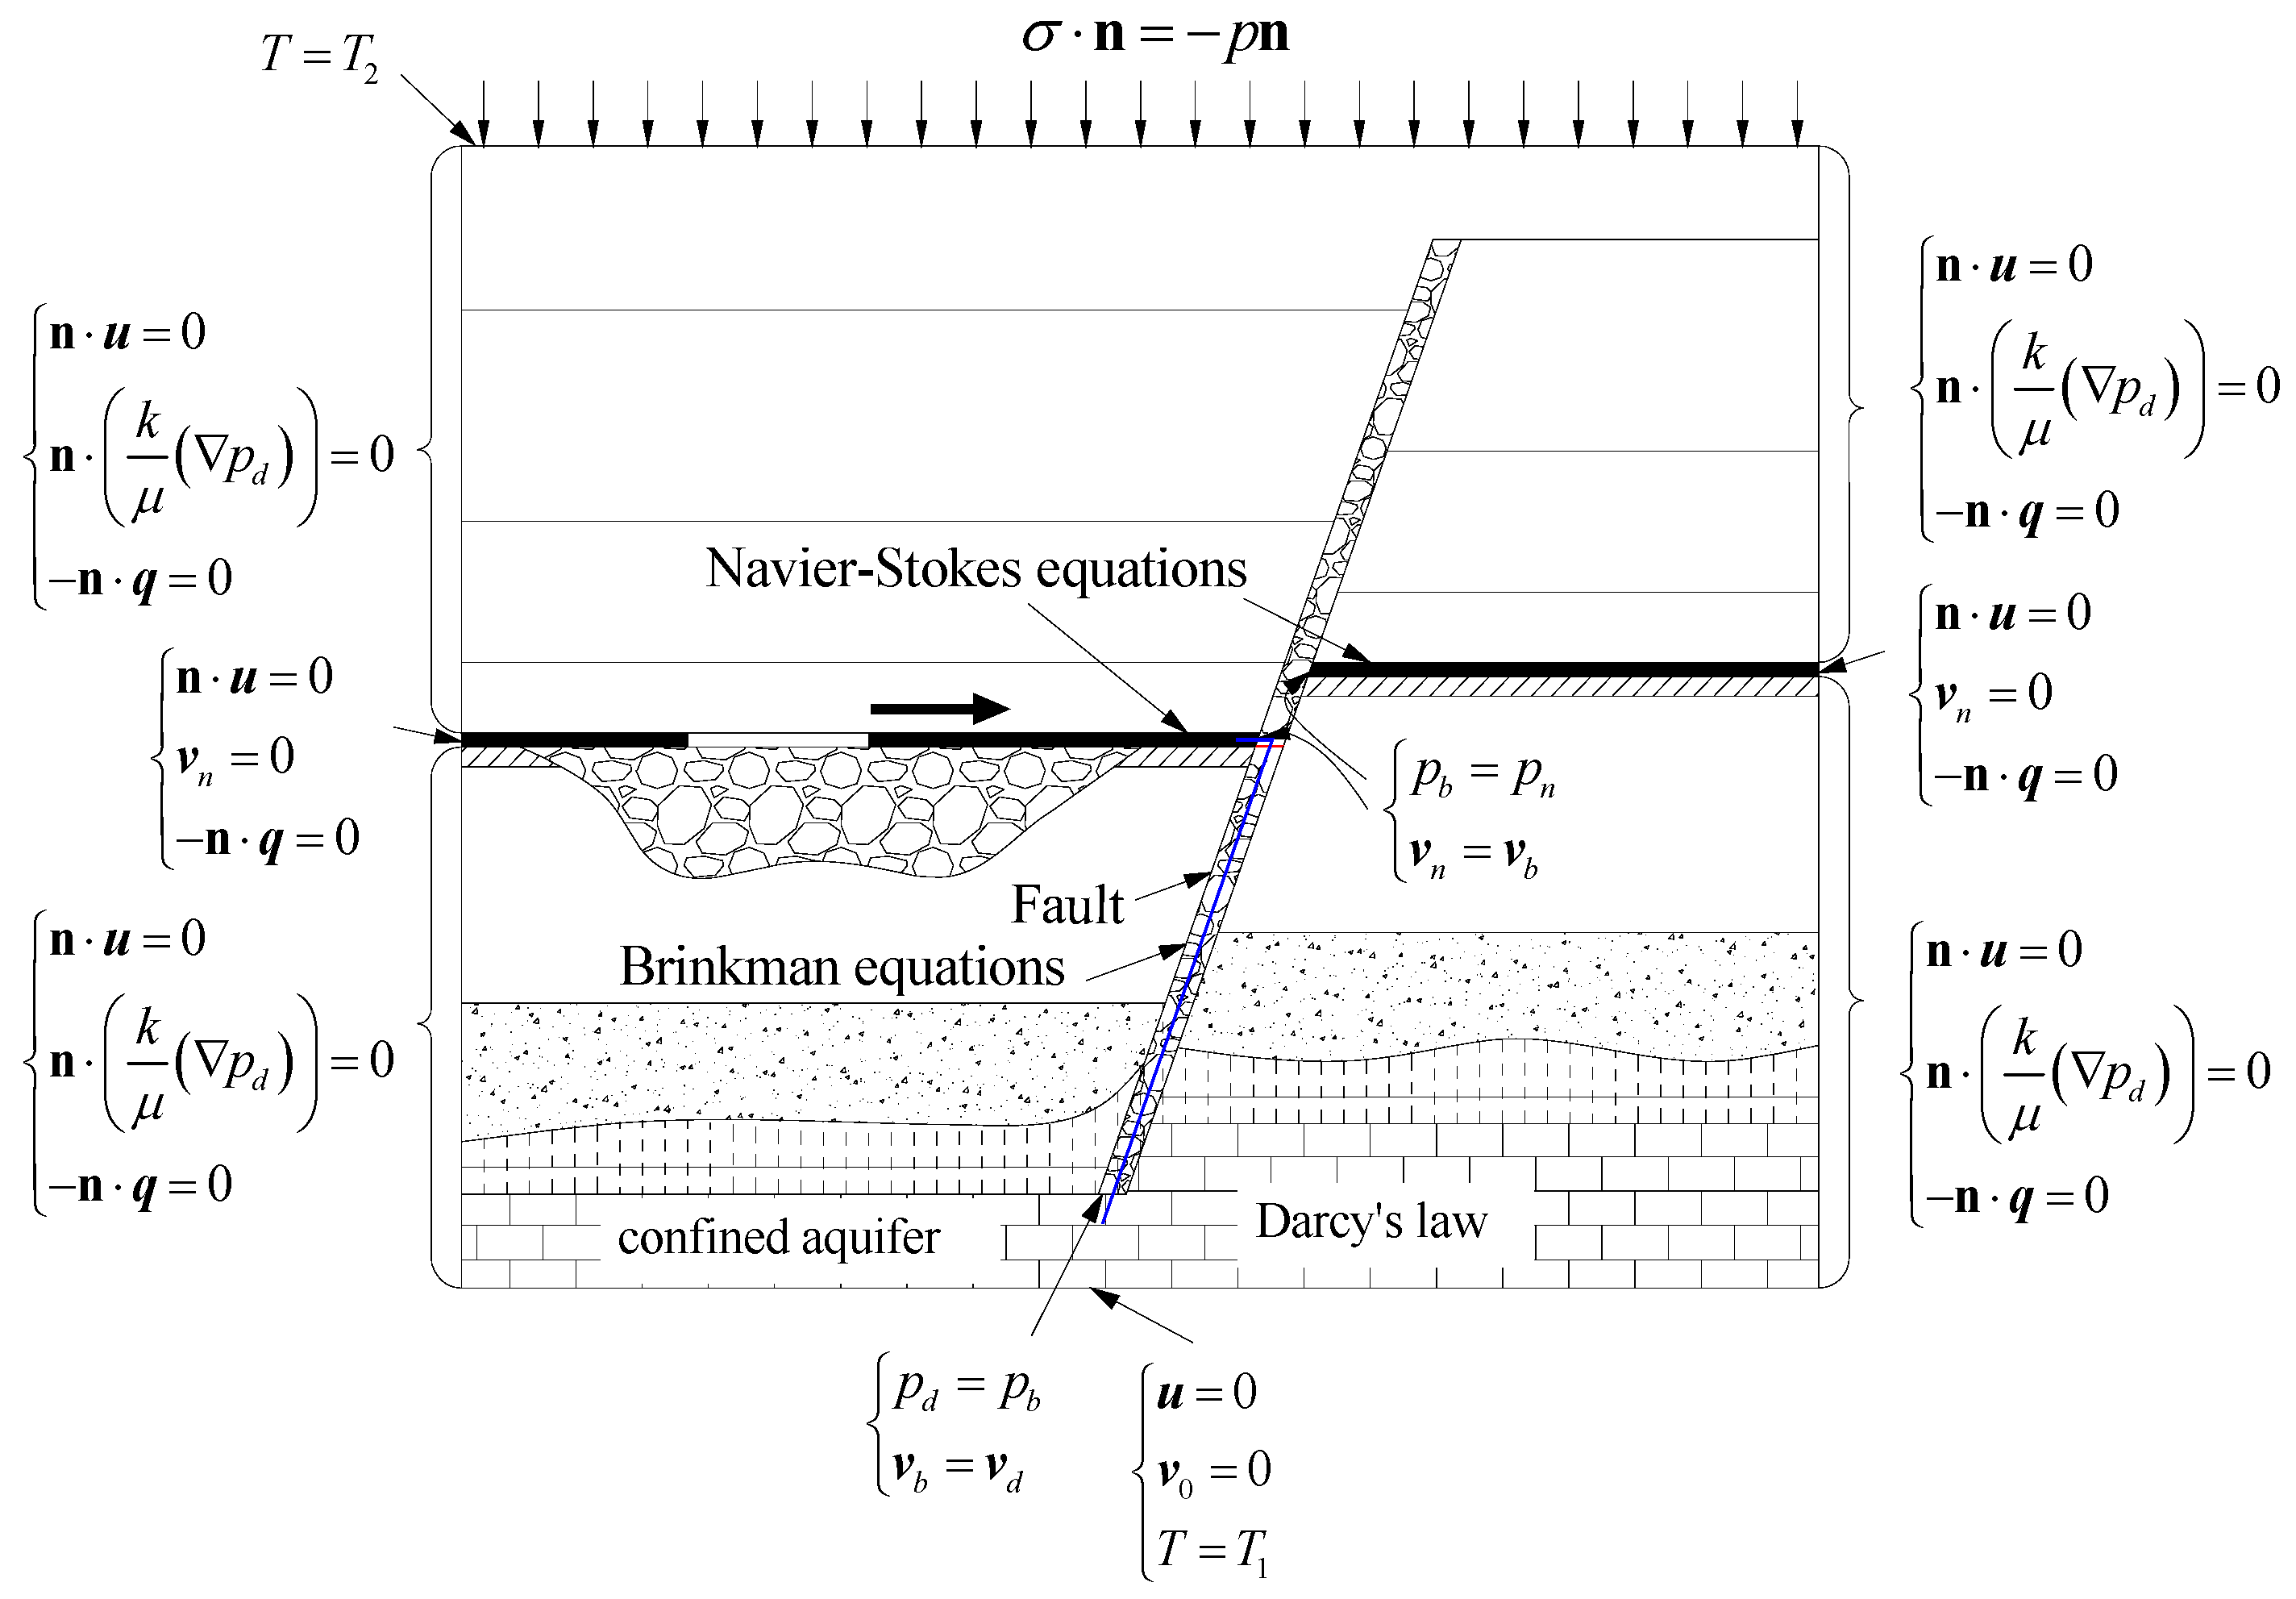
3.2.3. THM Coupling Model

Figure 6 shows the boundary condition setting for the THM coupling model.
The boundary condition of the top and bottom boundaries of the model was set as:
T = T 1  
T = T 2  
where T 1 and T 2 are the initial temperatures of the top and bottom boundary of the model respectively, K, which were set as 39 °C and 43.9 °C, respectively. In addition, the boundaries of the working face was set as 37 °C.
The remaining boundaries of the model were set as the no heat flux boundary condition:
n q = 0  

4. Results and Discussions

The change law of water velocity and the temperature were obtained. The temperature change was subjected to the interaction of the water pressure and the working face advanced distance. The change of the temperature of the water-rock environment near the fault can reflect the change of seepage field in the fault and confined aquifer, which was used to divide the warning levels of fault water inrush.

4.1. Simulation Results

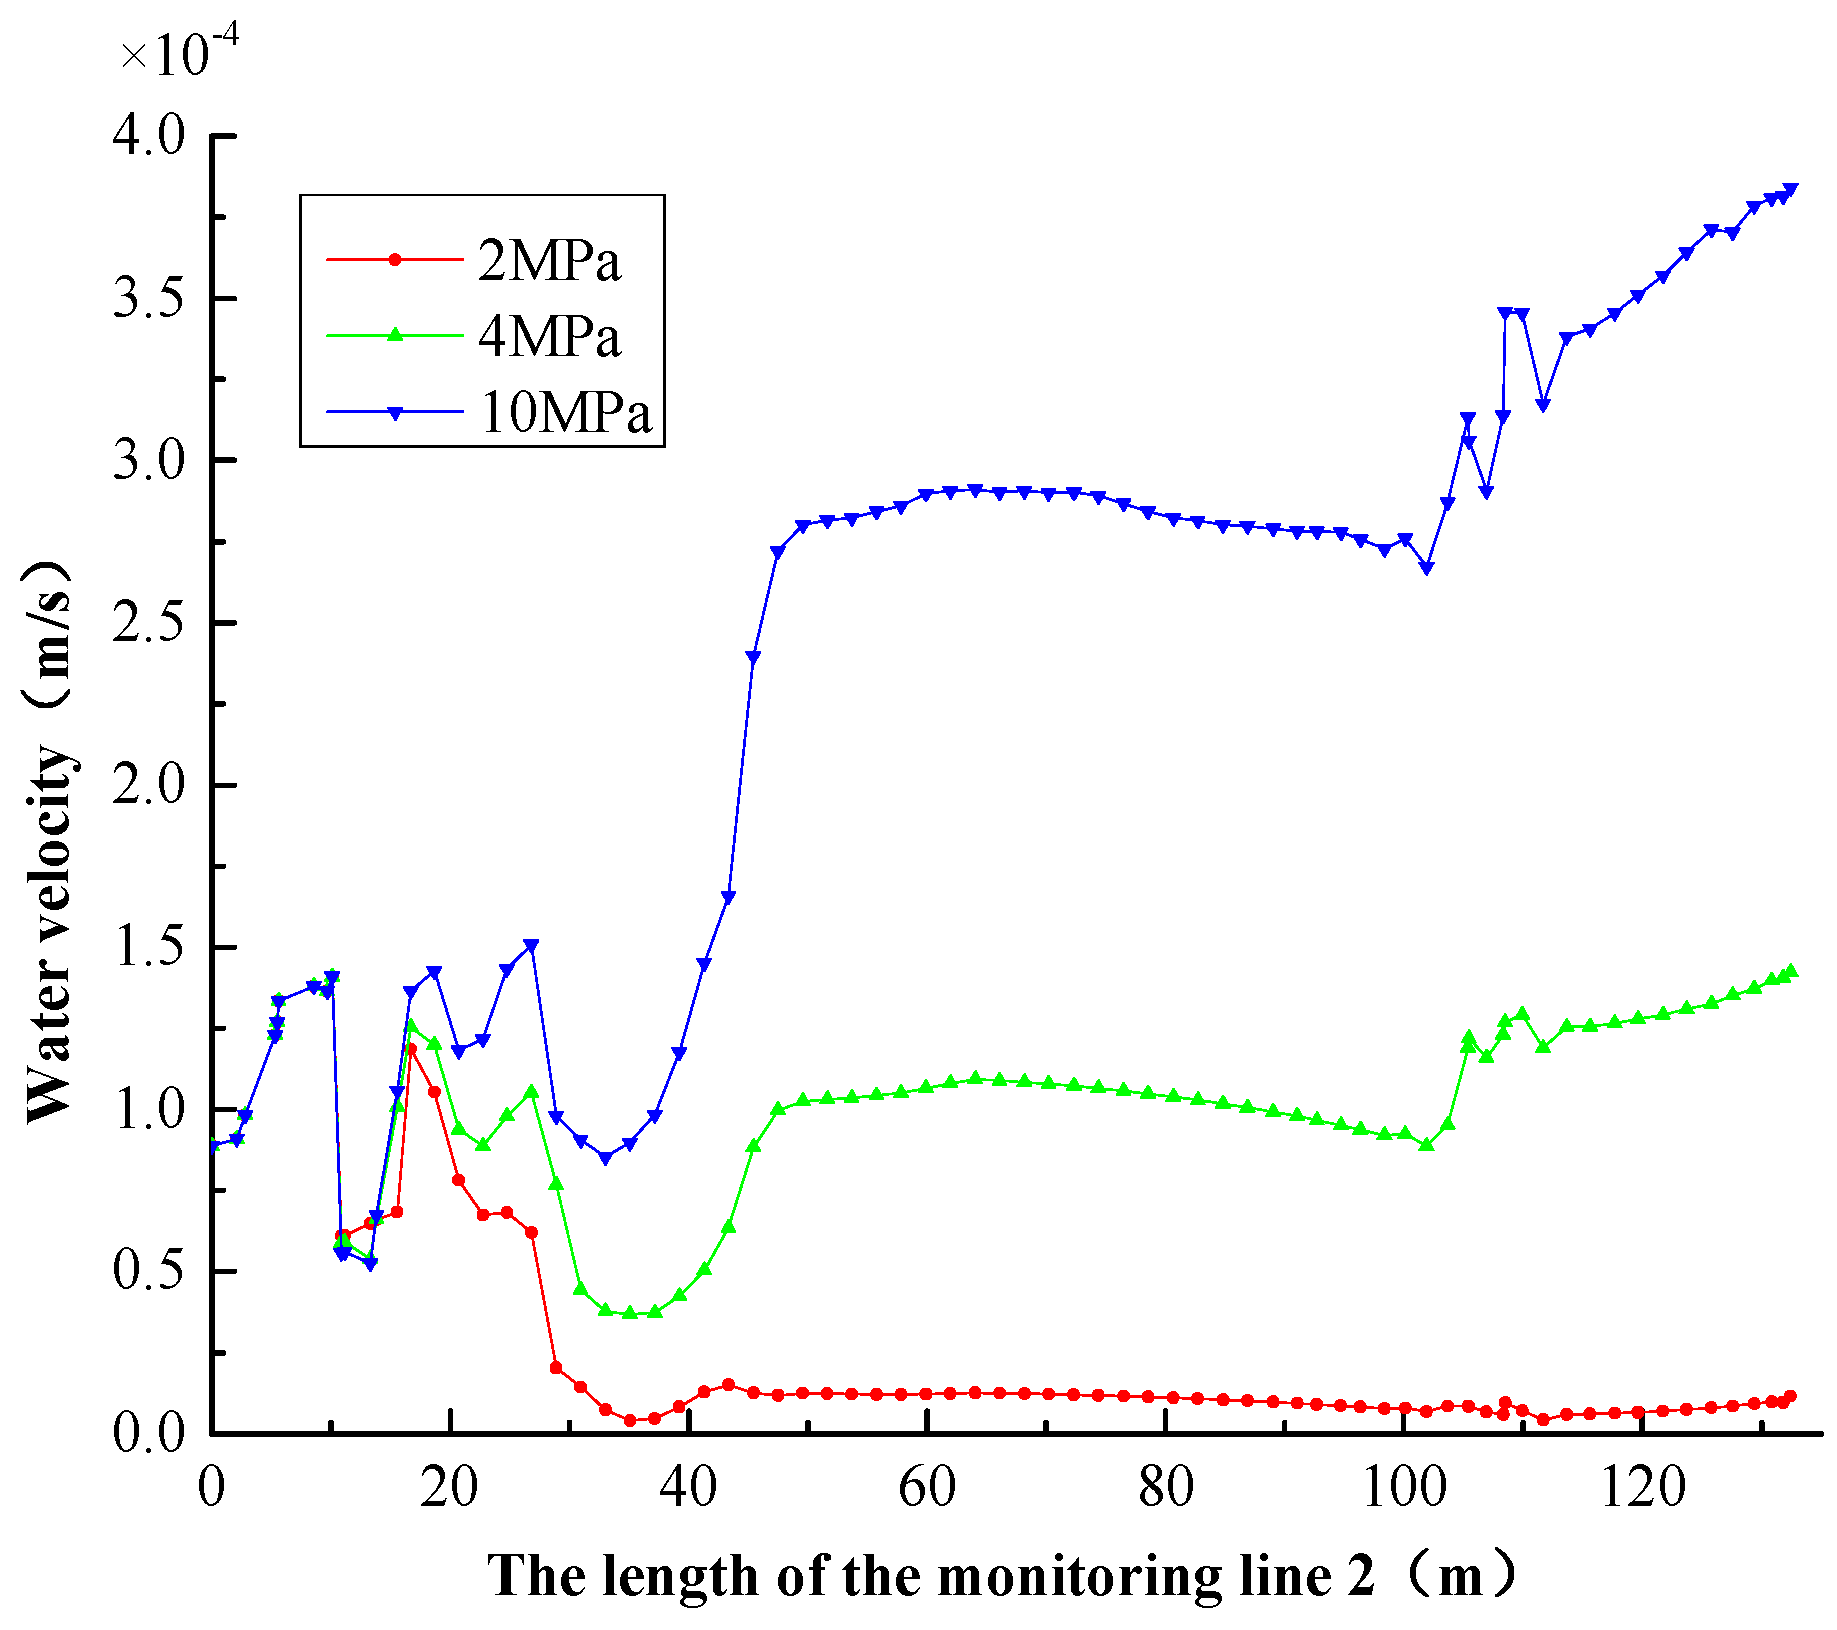
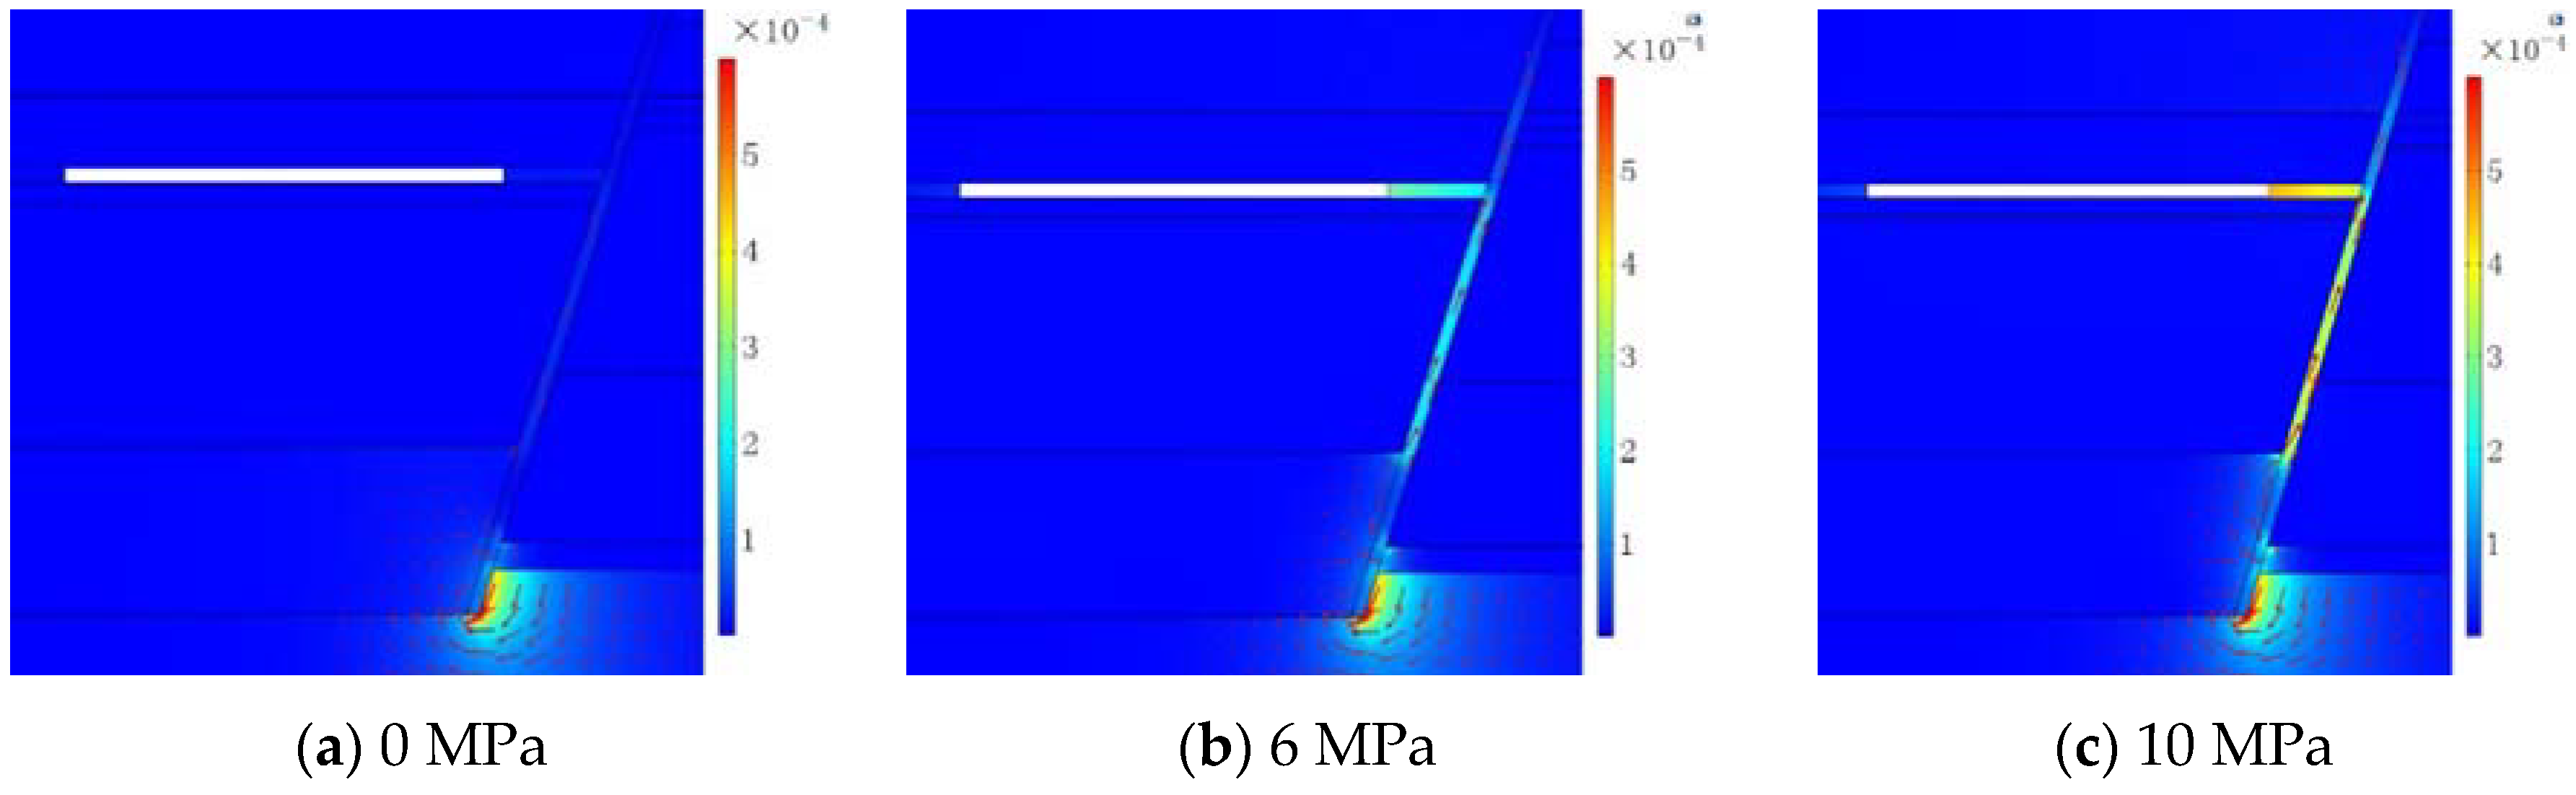
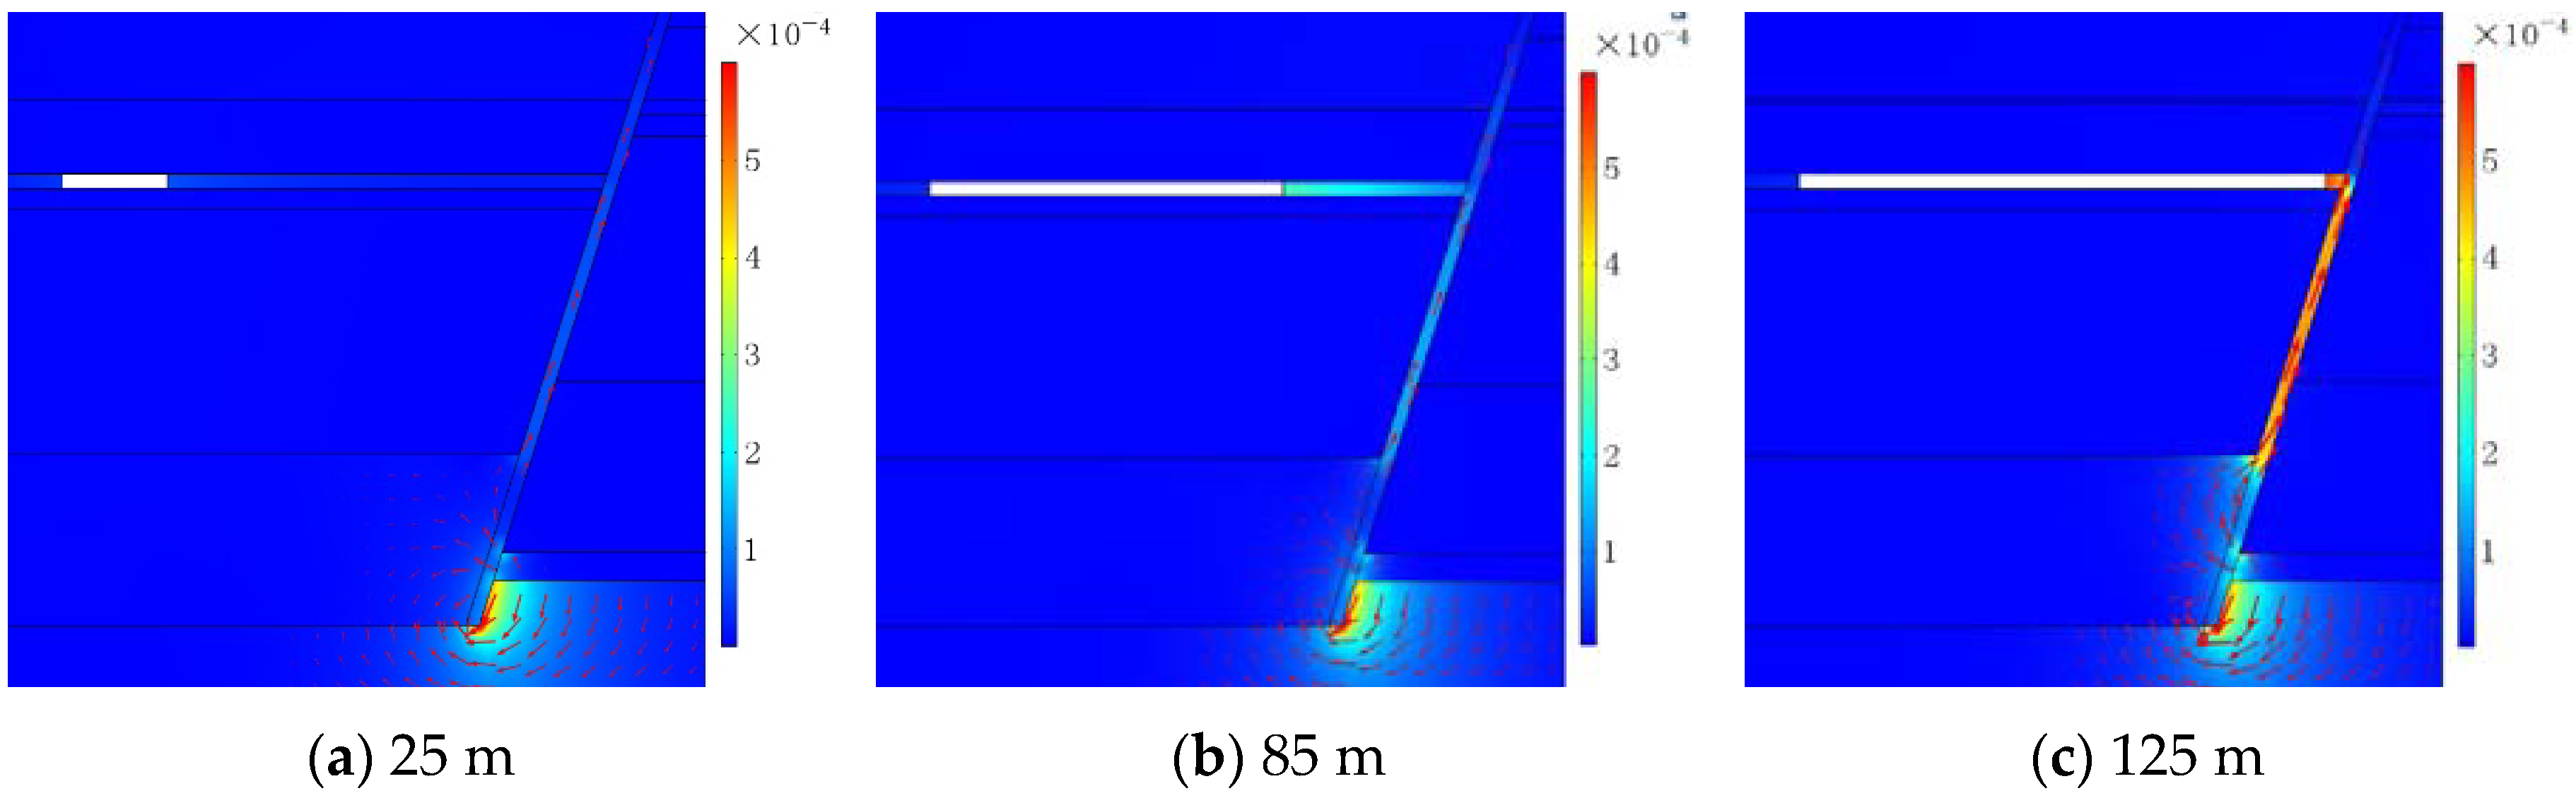
4.1.1. The Change Law of Water Velocity

Figure 7 shows the change law of water velocity when the working face was excavated to 65 m. The water velocity increased as the water pressure increased. When the water pressure was 2 MPa, there was little water in the coal seam, which indicated that the water inrush channel had not been formed. When the water pressure was 4 MPa and 10 MPa, the water velocity had a rapid increase at the junction of the confined aquifer, fault, and coal seam, which indicated nonlinear flow processes in the fractured zone of the fault.

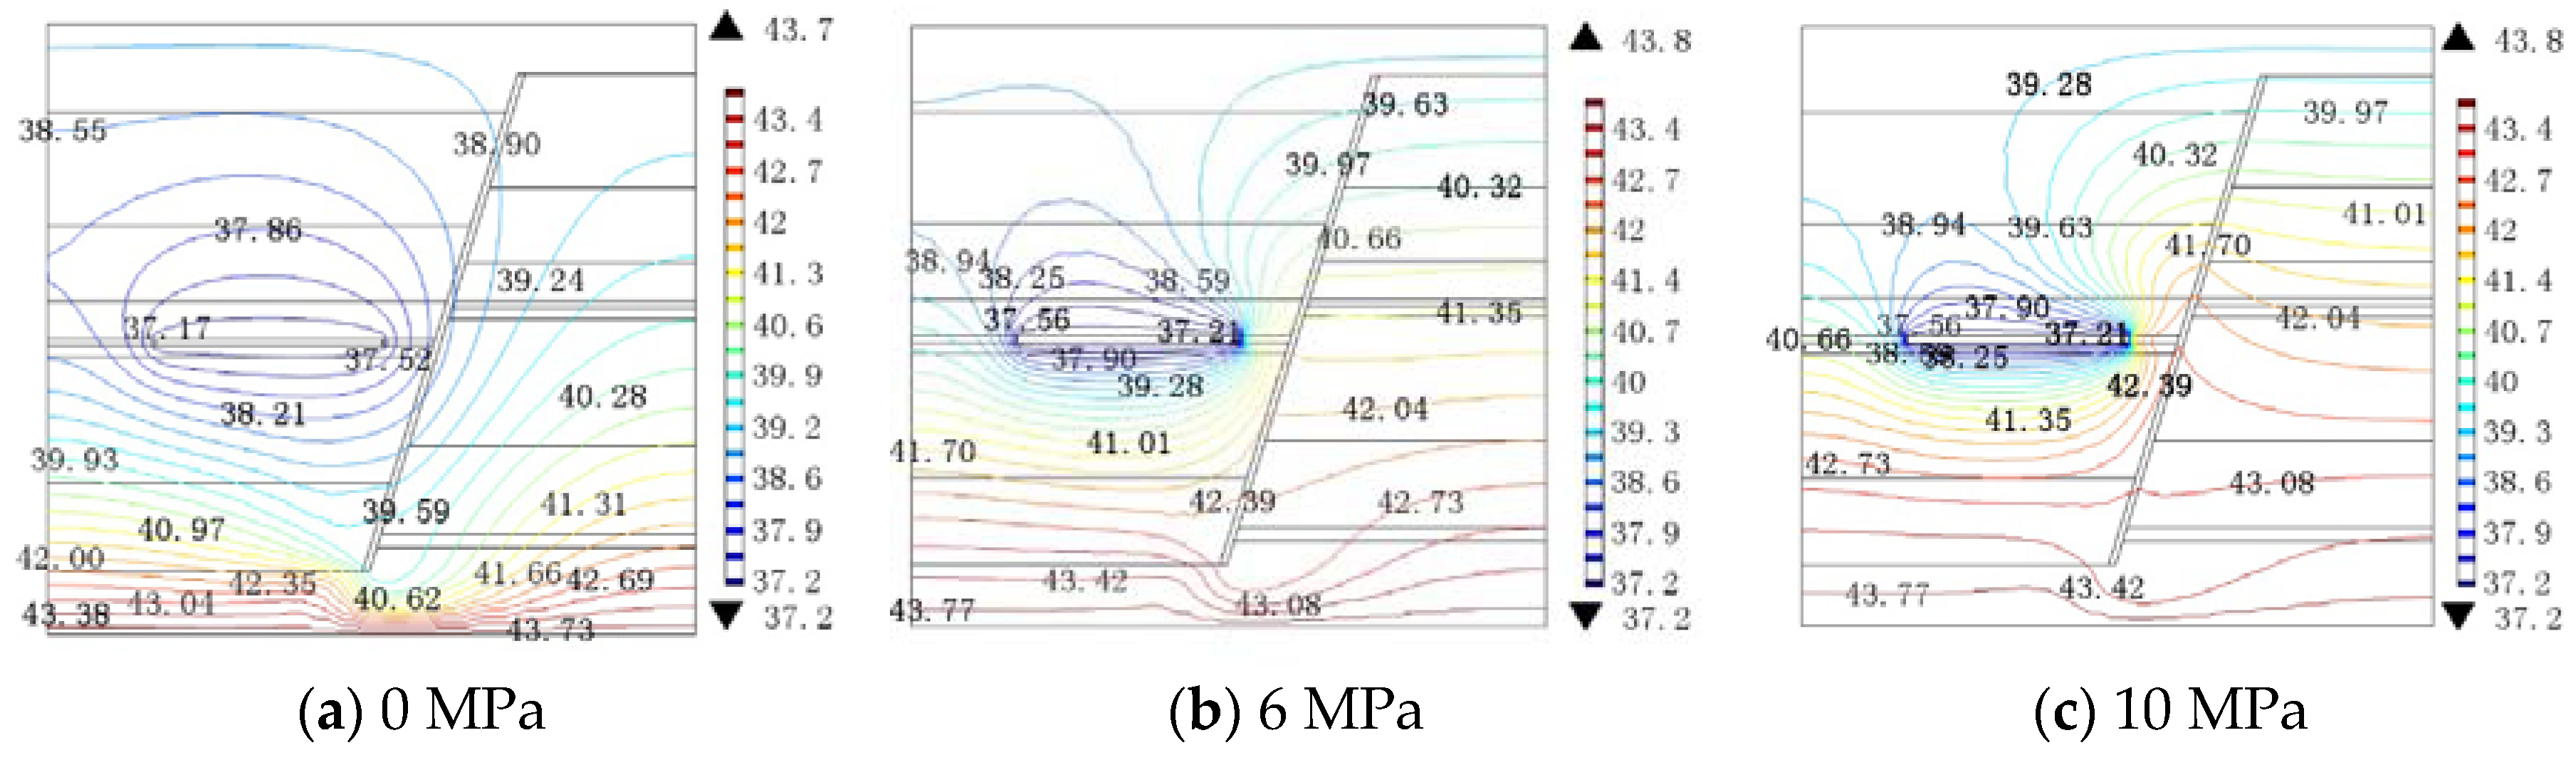
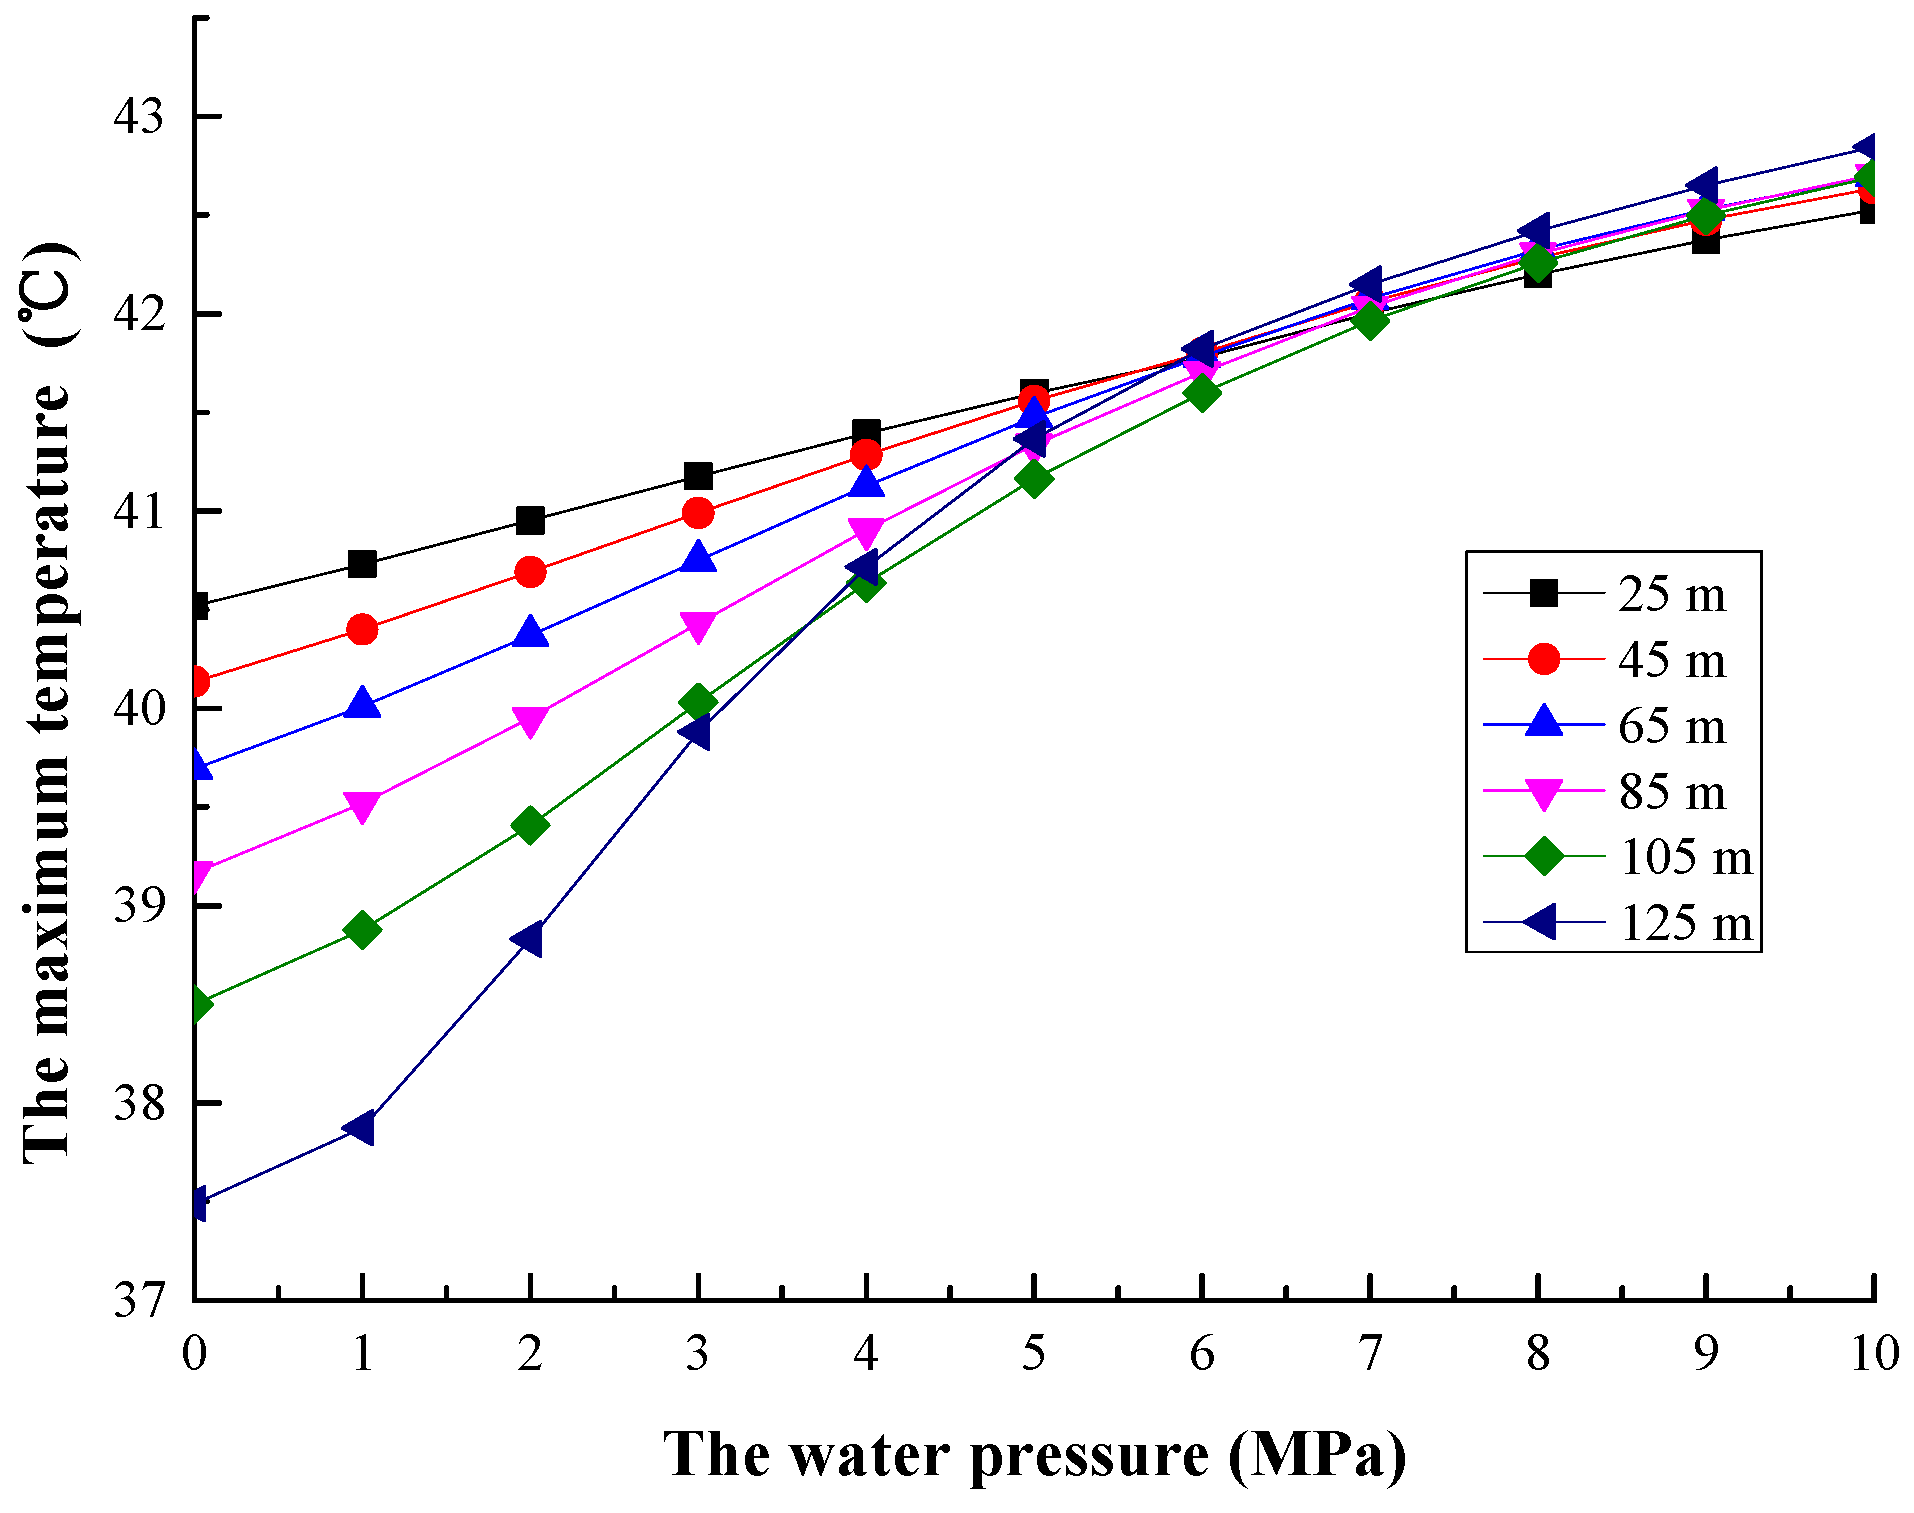
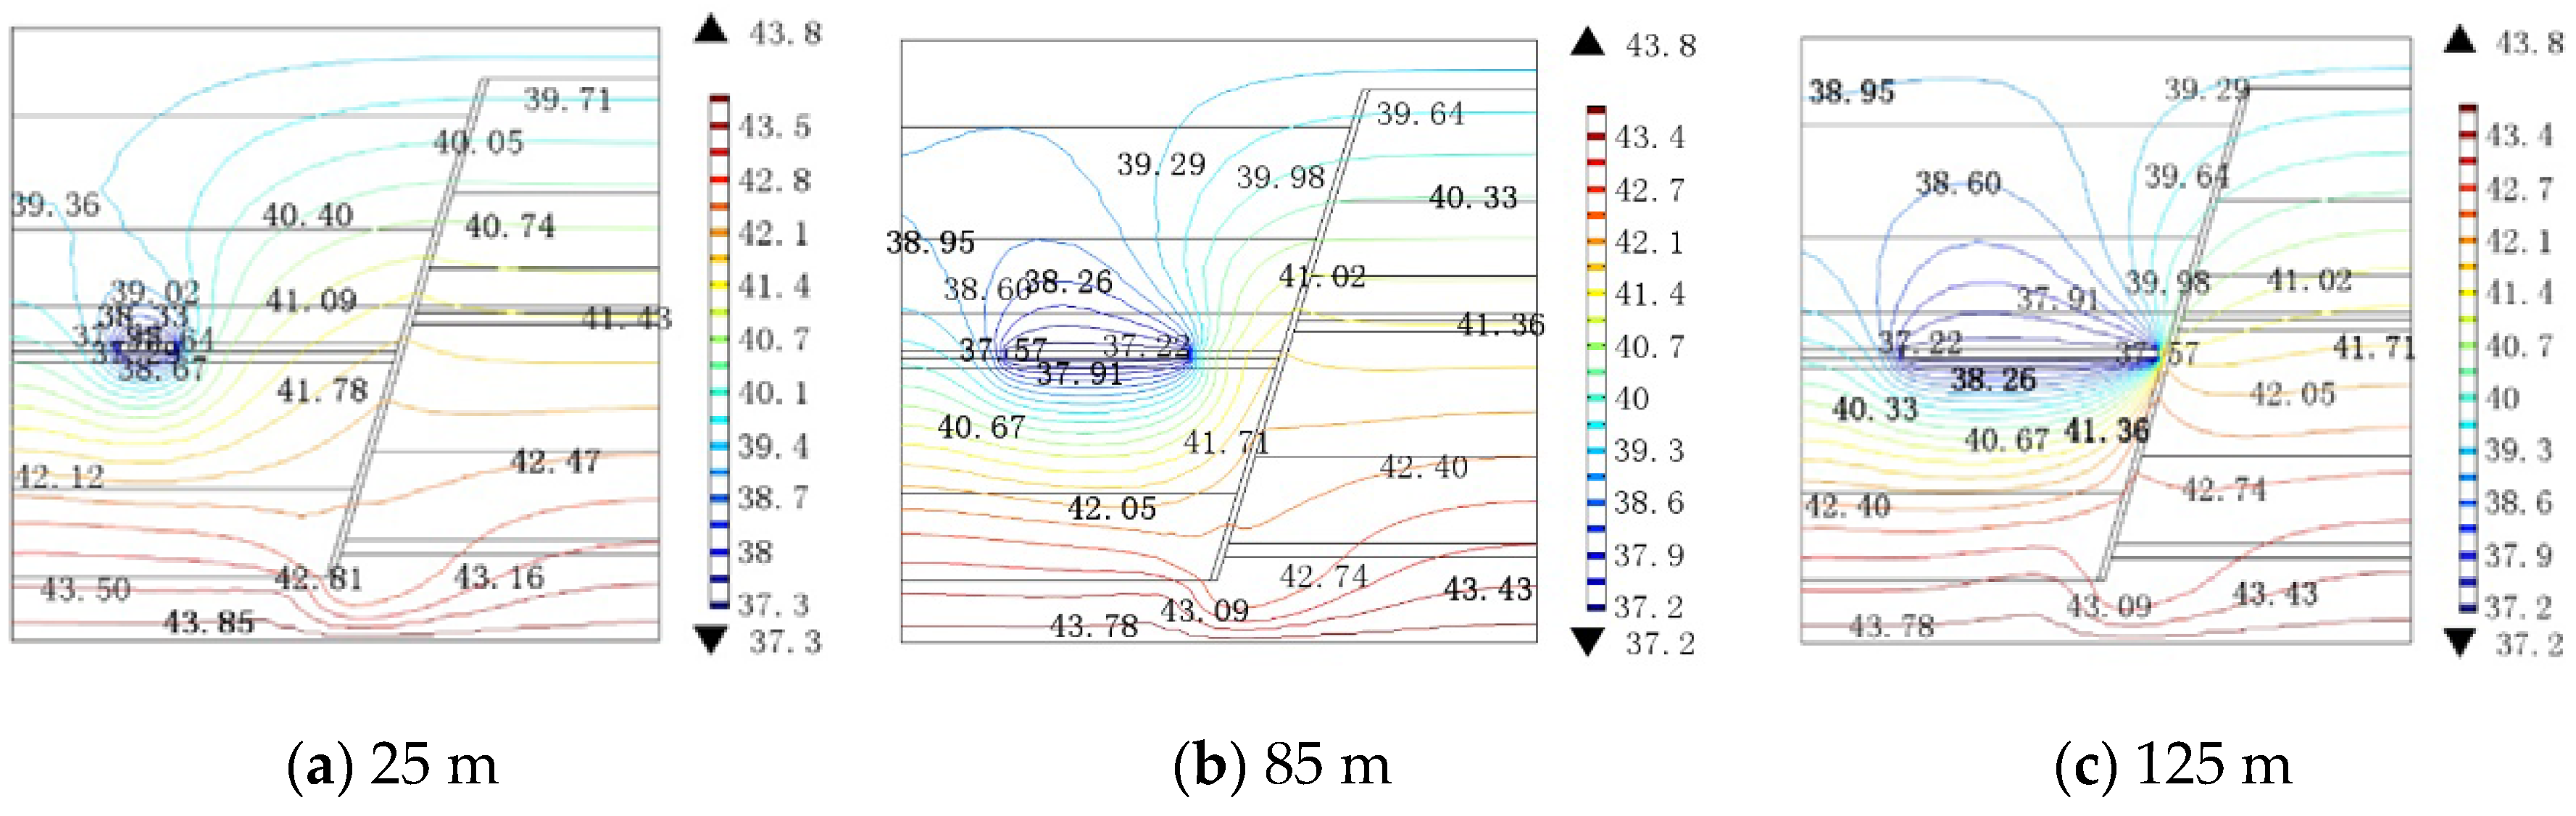
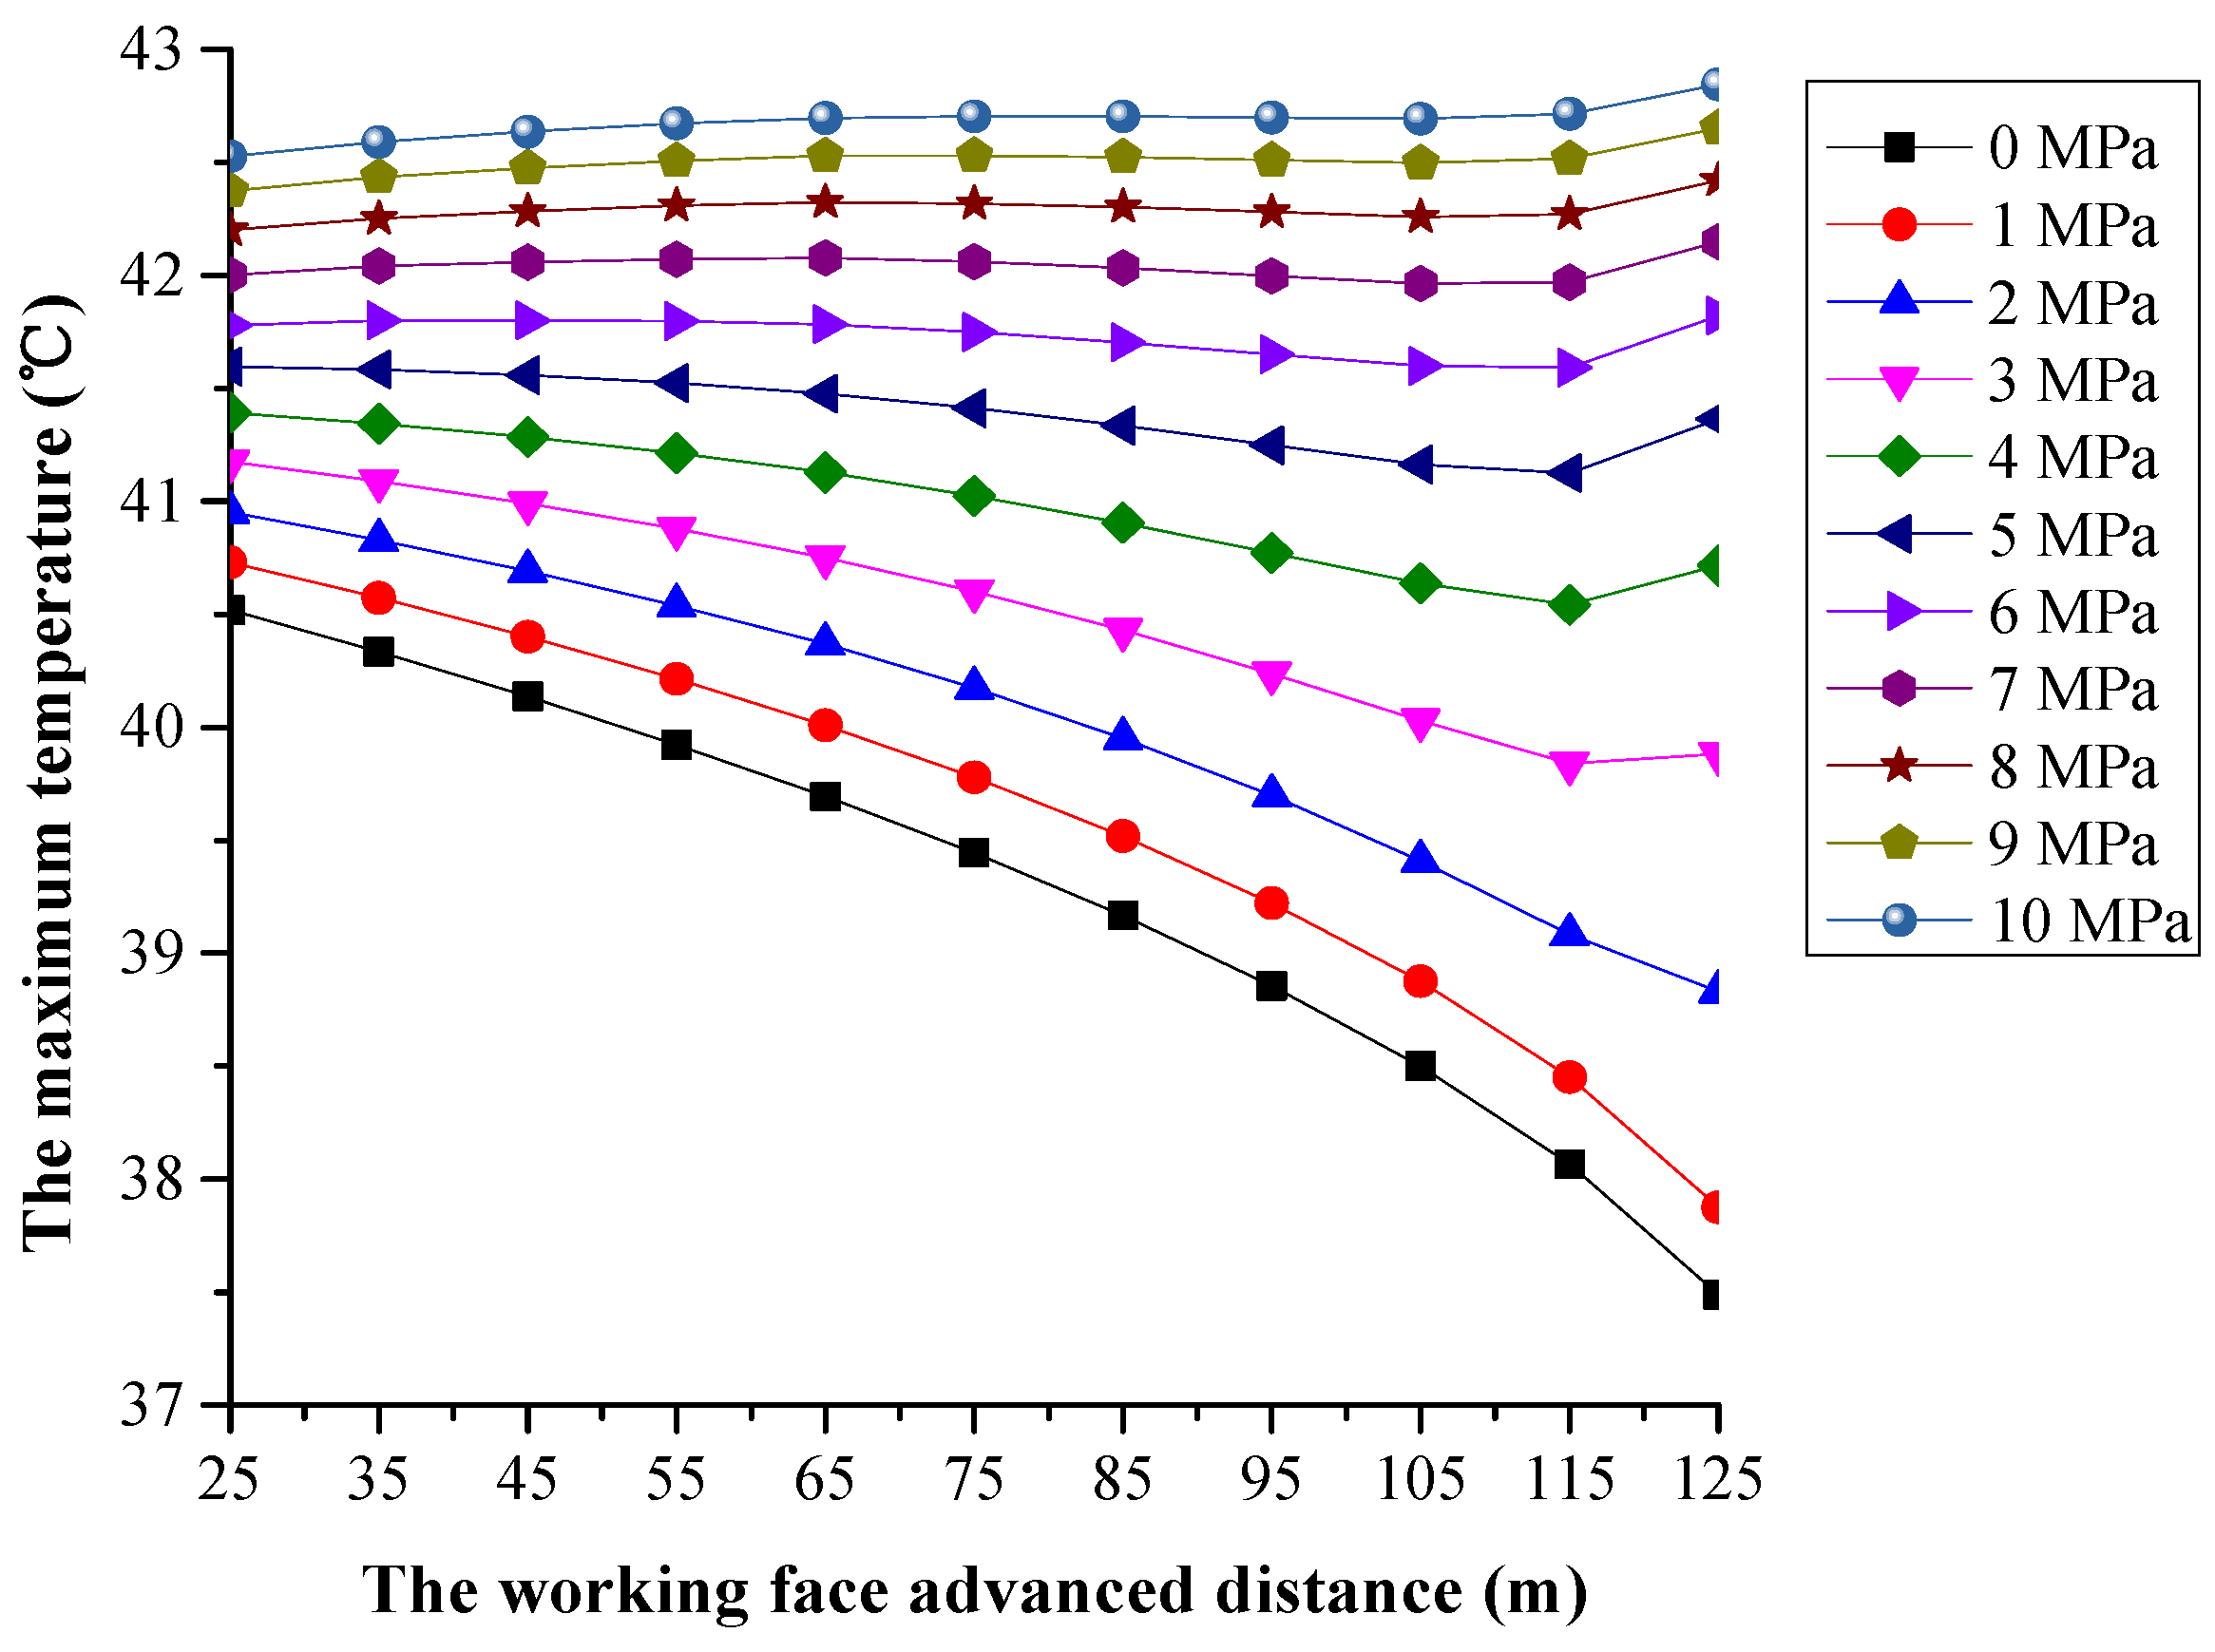
4.1.2. The Distribution of Temperature

1. The Impact of the Water Pressure on the Temperature
When the working face was excavated to 105 m, the distribution of seepage velocity and the temperature at different water pressure are shown in Figure 8 and Figure 9, respectively.
When the water pressure is 0 MPa, there is little water in the fault and the coal seam. The temperature contours have a smooth shift through the fault plane. When the water pressure is 6 MPa and 10 MPa, the water flows into the fault and the coal seam from the confined aquifer and the seepage velocity increases with the increasing water pressure. The temperature contours are a convex curve through the fault plane and the coal seam, and the convex degree increases with the increasing water pressure. Comparing the results of Figure 8 and Figure 9, the convex curve of the temperature contours and the seepage velocity had the same direction and change law. This is because, under the effect of the water pressure, the confined aquifer with higher temperature flows upwards along the fault plane, making the temperature of the water-rock environment near the fault plane increase. The higher the water pressure, the greater the seepage velocity will be, and there will be a shorter time of the heat transfer between the water and the rock in the fault, which makes the convex degree of the temperature contours increase as the water pressure increases. Therefore, the change of the temperature of the water-rock environment near the fault can reflect the change of seepage field in the fault and confined aquifer, which can be used as a new method of predicting fault water inrush.
The relationship between the maximum temperature on the monitoring line and the water pressure at different excavation steps is shown in Figure 10, from which it can be seen that the temperature increased with the increasing water pressure at every excavation step. The change range of the temperature increased as the distance between the working face and the fault plane decreased.
2. The Impact of the Working Face Advanced Distance on the Temperature
When the water pressure was 6 MPa, the distribution of seepage velocity and temperature at the different excavation steps are shown in Figure 11 and Figure 12, respectively. The seepage velocity increased as the working face advanced distance increased. The temperature contours were a convex curve through the fault plane, and the convex degree increased as the working face advanced distance increased. Comparing the results of Figure 11 and Figure 12, the convex curve of the temperature contours and the seepage velocity had the same direction and change law. This is because the damage of the fault and the coal seam induced by coal mining activities increased with the increase of the working face advanced distance, which made the seepage velocity in the fault and the coal seam increase. Then, the increase of the seepage velocity made the temperature of the water-rock environment near the fault plane increase. Therefore, the convex degree of the temperature contours increased with the increase of the working face advanced distance.
The relationship between the maximum temperature on the monitoring line and the working face advanced distance at different water pressure is shown in Figure 13.
Comparing the results of Figure 10 and Figure 13, the maximum temperature on the monitoring line decreased as the working face advanced distance increased at lower water pressure, which indicated that the influence of the working face advanced distance on the temperature was greater than that of water pressure on the temperature. The decrease of the temperature decreased with the increasing water pressure. This is because at the working face of the coal mine, it is necessary to provide ventilation to guarantee enough oxygen and proper temperature for workers, which makes the temperature lower in the working face than the surrounding area of the working face. At lower water pressure, as the working face advanced distance increased, the lower seepage velocity made the temperature in the fault increase slightly. Therefore, the increase of the working face advanced distance reduced the temperature in the fault due to the lower temperature at the working face. At higher water pressure, the maximum temperature on the monitoring line increased as the working face advanced distance increased, which indicates that at higher water pressure, the influence of water pressure on the temperature is greater than that of the working face advanced distance on the temperature. This is because at higher water pressure, the higher seepage velocity makes the temperature in the fault have a higher increase. In addition, the decrease of the temperature gradually decreases with the water pressure increasing. This is because as the water pressure increases, the difference between the decrease of the temperature caused by the increase of the working face advanced distance and the increase of the temperature caused by the increase of the water pressure will decrease. In a word, the temperature change is subjected to the interaction of the water pressure and the working face advanced distance.

4.1.3. The Warning Level of Water Inrush

As mentioned previously, the change of the temperature of the water-rock environment near the fault can reflect the change of seepage field in the fault and confined aquifer, which can be used as a new method to predict fault water inrush. In order to use the temperature to predict fault water inrush, it is necessary to find a correspondence between the temperature change and danger degree of water inrush, which is used to divide the warning level of water inrush. Two methods were used as follows to find the correspondence.
1. The Method Based on the Water Inrush Coefficient
The conception of the water inrush coefficient was proposed based on the statistical analysis of long-term water inrush data and defined in the Regulation for Coal Mine Water Prevention and Control [25], where the water inrush coefficient is expressed as an empirical formula [26]:
K = P M  
where K is the water inrush coefficient (MPa/m); P is the water pressure of the confined aquifer (MPa); and M is the thickness of the aquifuge (m). The aquifuge means the zone between the coal seam and confined aquifer. If there is a fault in the aquifuge, the water inrush will occur when the water inrush coefficient is over 0.06 MPa/m, while the water inrush will not happen when the water inrush coefficient is less than or equal to 0.06 MPa/m.
In order to take more detailed corresponding measures to predict water inrush, the warning level of water inrush was divided into three grades: safe level with water inrush coefficient less than or equal to 0.06 MPa/m, dangerous level with water inrush coefficient greater than 0.06 MPa/m and less than or equal to 0.1 MPa/m, and more dangerous level with water inrush coefficient greater than 0.1 MPa/m.
According to the hydrogeological report of the Anju coal mine, the thickness of the aquifuge is from 71.85 m to 110.19 m. To obtain the minimum critical water pressure, the thickness of the aquifuge should be 71.85 m, which was substituted into Equation (43). Then, by substituting the water inrush coefficient of 0.06 MPa/m and 0.1 MPa/m into Equation (43), the water pressure was calculated to be 4.311 MPa and 7.815 MPa, respectively.
Using the quartic polynomial to fit the curves as shown in Figure 10, the fitting polynomials for the relation curves between maximum temperature and water pressure are listed in Table 2. By substituting the water pressure of 4.311 MPa and 7.815 MPa into the fitting polynomials, respectively, the calculated results of temperature are listed in Table 2.
The original temperature of the rock is 40.09 °C before the coal seam is excavated. The differences between the maximum temperature and the original temperature are listed in Table 3. At 4.311 MPa and 7.815 MPa, the difference between the maximum temperature and the original temperature is about 1 °C and about 2 °C, respectively, which can be used as the thresholds to divide the warning level of water inrush.
2. The Method Based on the Water-Resisting Thickness of Floor
The theory of the water-resisting thickness of floor was established based on the “Down Three Zone” theory. The safe coal and rock pillars can be represented as:
h a =   h 1 +   h 2 +   h 3  
where h 1 , h 2 , and h 3 are the thickness of the disturbed area in the floor, impermeable zone, and confined upflowing waterzone, respectively, in meters. There are three kinds of empirical formulas to calculate h 1 :
h 1 = 0.7007 + 0.1079 L  
h 1 = 0.303 L 0.8  
h 1 = 0.00851 H + 0.1665 α + 0.1079 L 4.3579  
where L is the length of the working face, m; H is the mining depth, m; and α is the angle of coal seam. Substituting 253 m, 980 m, and 0° into H, L, and α of the empirical formulas, respectively, can obtain values of h 1 at 27.9994 m, 25.3478 m, and 31.2806 m. In order to ensure safe coal seam mining, h a should be as large as possible. Therefore, h 1 is 31.2806 m.
According to borehole No. AJGL3-1 of the Anju coal mine, there is no obviously confined upflowing waterzone. Therefore, h 3 is 0 m.
The h 2 can be calculated by the water-resisting coefficient:
Z c = Z i h i h c  
h 2 = P / Z c  
where P is the critical water pressure, MPa; Z i is the water-resisting coefficient of the ith rock, MPa/m; Z c is the weighted average water-resisting coefficient, MPa/m; and h i is the average thickness of the ith rock, m. According to the hydrogeological report of the Anju coal mine, the distance between coal seam No. 3 and the Shanxi Formation is from 46.30 m to 71.26 m, and the average distance is 54.5 m, and the rock is mainly medium sandstone and fine sandstone. The water-resisting coefficient of the medium sandstone and fine sandstone is 0.3 MPa/m. The distance between the Shanxi Formation and the confined aquifer is from 25.55 m to 38.93 m, and the average distance is 35 m, and the rock is mainly mudstone and siltstone. The water-resisting coefficient of the medium mudstone and siltstone is 0.1 MPa/m. Substituting the water-resisting coefficient of medium sandstone, fine sandstone, mudstone, and siltstone into Equation (48), Z c is 0.2609 MPa/m. When the distance between the coal seam and confined aquifer is more than or equal to h a , the coal seam mining is safe:
h d h a =   h 1 +   h 2 +   h 3  
where h d is the distance between the coal seam and confined aquifer, m. According to the hydrogeological report of the Anju coal mine, h d is from 71.85 m to 110.19 m. In order to obtain the minimum critical water pressure, h 2 must be the maximum, which requires h d is equal to h a and the minimum. Therefore, h d is 71.85 m. Substituting h 1 , h 3 , and h a into Equation (50), h 2 is 40.5694 m. By substituting h 2 into Equation (49), critical water pressure is 8.997 MPa.
By substituting the critical water pressure into the fitting polynomials respectively, the calculated results of the temperature are listed in Table 2. All of the differences between the maximum temperature and the original temperature were more than 2 °C. Therefore, the 2 °C of temperature rise can be used as the thresholds to divide the dangerous and more dangerous warning levels of fault water inrush. Bai et al. [12] measured the temperature of water in a fault from a confined aquifer in a coal seam roof and used the 1.5 °C and 2.4 °C of temperature change to divide the dangerous and more dangerous warning levels of fault water inrush. However, these results were not analyzed mathematically. This model can provide theoretical support for the work of Bai et al.
The temperature range calculated by this model was too narrow because the geothermal gradient of Anju coal mine was 21.54 °C/km and not high, and the temperature difference between the confined aquifer and coal seam was not large. One or two degrees Celsius is difficult to measure with such precision in practical engineering. Therefore, there is some uncertainty in using this model to deal with engineering problems with low geothermal gradients. However, in many deep engineering practices, the geothermal gradient is generally 30 °C/km to 50 °C/km. In some areas such as near a fault or with high thermal conductivity, the geothermal gradient is sometimes as high as 200 °C/km [27]. In engineering with high geothermal gradients, the temperature difference between the confined aquifer and coal seam will be large, which will make the temperature rise calculated by this model have a greater range. Using this model to deal with engineering problems with high geothermal gradients is more reliable. Whether in high or low geothermal gradient engineering, this model can be used as a single indicator for identifying the conditions for water inrush from a fault in coal mining, but this model should be combined with other approaches to predict fault water inrush.
Although this model can provide a proper numerical simulation method to study the processes of nonlinear water flow in the fractured zone of the fault and the multi-fields coupling of the complex geological systems of the fault water inrush, this model has some limitations:
  • There is some uncertainty in using this model to deal with engineering problems with low geothermal gradients.
  • The disturbed area may extend the fault zone and aggravate fault activation, which was not considered in this model.
  • The comparison between the measured results in reality and simulated results was not studied.
  • Although this model was established based on the engineering background of a coal mine, it can be applied to tunneling in the vicinity of a fault. This model can be used as a method to study the water-rock-temperature interactions in tunneling in the vicinity of a fault. However, as the water inrush coefficient and the water-resisting thickness are applicable only in coal mines, they cannot be used to find the thresholds to divide the warning levels of fault water inrush in tunneling. A new method to divide the warning levels of fault water inrush in tunneling should be found if this model is used to predict fault water inrush in tunneling.
Future research will be done to overcome the given limitations.

5. Conclusions

This paper proposed a coupled THM model to predict fault water inrush induced by coal mining activities. The main conclusions were obtained as follows:
  • The Darcy-Brinkman-NS equations can properly describe the nonlinear water flow process in the fractured zone of the fault. The water velocity increases with the increasing water pressure. The water velocity has a rapid increase at the junction of the confined aquifer, fault, and coal seam instead of a linear increase.
  • Temperature change of the fault zone is subjected to the interaction of the water pressure and the working face advanced distance. At a lower water pressure, the influence of the working face advanced distance on the temperature of the fault zone is greater than that of the water pressure on the temperature. At a higher water pressure, the influence of water pressure on the temperature of the fault zone is greater than that of the working face advanced distance on the temperature. When the working face advanced distance is constant, the temperature of the fault zone increases with the increasing water pressure. The range of the temperature of the fault zone increases with the distance between the working face and the fault plane decreasing.
  • The temperature change of the fault zone can reflect the change of the seepage field in the fault and confined aquifer. Monitoring the temperature rise of the fault zone, based on the conception of the water inrush coefficient and the water-resisting thickness of floor, the temperature increases of 1 and 2 °C were used as the thresholds to divide the warning levels of water inrush.

Author Contributions

W.L. planned the establishment step of the model. W.L. and J.Z. wrote the main manuscript. J.Z. established the mathematical model and prepared all figures and tables. R.N., Y.L., and Y.D. reviewed the manuscript. All authors contributed in the conclusion.

Funding

This research was funded by the National Natural science Foundation of China (grant 51274135), the National High Technology Research and Development Program (863 Program) of China (grant 2015AA016404-4), the State Key Research and Development Program of China (grant 2017YFC0804108), and the SDUST Research Fund (grant 2018TDJH102).

Conflicts of Interest

The authors declare no conflict of interest.

References

  1. Andrés, C.; Ordóñez, A.; Álvarez, R. Hydraulic and Thermal Modelling of an Underground Mining Reservoir. Mine Water Environ. 2017, 36, 24–33. [Google Scholar] [CrossRef]
  2. Uhlík, J.; Baier, J. Model Evaluation of Thermal Energy Potential of Hydrogeological Structures with Flooded Mines. Mine Water Environ. 2012, 31, 179–191. [Google Scholar] [CrossRef]
  3. Xi, Y.; Li, J.; Liu, G.; Tao, Q.; Lian, W. A new numerical investigation of cement sheath integrity during multistage hydraulic fracturing shale gas wells. J. Nat. Gas Sci. Eng. 2018, 49, 331–341. [Google Scholar]
  4. Rutqvist, J.; Wu, Y.S.; Tsang, C.F.; Bodvarsson, G. A modeling approach for analysis of coupled multiphase fluid flow, heat transfer, and deformation in fractured porous rock. Int. J. Rock Mech. Min. Sci. 2002, 39, 429–442. [Google Scholar] [CrossRef]
  5. Zhang, Y.J.; Yang, C.S.; Xu, G. FEM Analyses for T-H-M-M Coupling Processes in Dual-Porosity Rock Mass under Stress Corrosion and Pressure Solution. J. Appl. Math. 2012, 10, 3129–3138. [Google Scholar] [CrossRef]
  6. Tsang, C.F.; Jing, L.; Stephansson, O.; Kautsky, F. The DECOVALEX III project: A summary of activities and lessons learned. Int. J. Rock Mech. Min. Sci. 2005, 42, 593–610. [Google Scholar] [CrossRef] [Green Version]
  7. Bond, A.E.; Bruský, I.; Cao, T.; Chittenden, N.; Fedors, R.; Feng, X.T.; Gwo, J.P.; Kolditz, O.; Lang, P.; McDermott, C.; et al. A synthesis of approaches for modelling coupled thermal–hydraulic–mechanical–chemical processes in a single novaculite fracture experiment. Environ. Earth Sci. 2017, 76, 1–19. [Google Scholar] [CrossRef]
  8. Graupner, B.J.; Shao, H.; Wang, X.R.; Nguyen, T.S.; Li, Z.; Rutqvist, J.; Chen, F.; Birkholzer, J.; Wang, W.; Kolditz, O.; et al. Comparative modelling of the coupled thermal–hydraulic-mechanical (THM) processes in a heated bentonite pellet column with hydration. Environ. Earth Sci. 2018, 77, 1–16. [Google Scholar] [CrossRef]
  9. Sheng, J. Fully coupled thermo-hydro-mechanical model of saturated porous media and numerical modeling. Chin. J. Rock Mech. Eng. 2006, 25, 3028–3033. [Google Scholar]
  10. Zhu, W.C.; Wei, C.H.; Tian, J.; Yang, T.H.; Tang, C.A. Coupled thermal-hydraulic-mechanical model during rock damage and its preliminary application. Rock Soil. Mech. 2009, 30, 3851–3857. [Google Scholar]
  11. Sun, J.; Wang, L.G.; Tang, F.R.; Shen, Y.F.; Gong, S.L. Micro seismic monitoring failure characteristics of inclined coal seam floor. Rock Soil. Mech. 2011, 32, 1589–1595. [Google Scholar]
  12. Bai, J.; Li, S.; Liu, R.; Zhang, Q.; Zhang, H.; Sha, F. Multi-field information monitoring and warning of delayed water bursting in deep rock fault. Chin. J. Rock Mech. Eng. 2015, 34, 2327–2335. [Google Scholar]
  13. Zhou, Q.; Herrera, J.; Hidalgo, A. The numerical analysis of fault-induced mine water inrush using the extended finite element method and fracture mechanics. Mine Water Environ. 2018, 37, 185–195. [Google Scholar] [CrossRef]
  14. Xue, Y.; Wang, D.; Li, S.; Qiu, D.; Li, Z.; Zhu, J. A risk prediction method for water or mud inrush from water-bearing faults in subsea tunnel based on cusp catastrophe model. KSCE J. Civ. Eng. 2017, 21, 2607–2614. [Google Scholar] [CrossRef]
  15. Liu, R.; Li, B.; Jiang, Y. A fractal model based on a new governing equation of fluid flow in fractures for characterizing hydraulic properties of rock fracture networks. Comput. Geotech. 2016, 75, 57–68. [Google Scholar] [CrossRef]
  16. Cherubini, C.; Giasi, C.I.; Pastore, N. Bench scale laboratory tests to analyze non-linear flow in fractured media. Hydrol. Earth Syst. Sci. Discuss. 2012, 9, 2511–2522. [Google Scholar] [CrossRef]
  17. Liu, R.; Li, B.; Jiang, Y.; Yu, L. A numerical approach for assessing effects of shear on equivalent permeability and nonlinear flow characteristics of 2-D fracture networks. Adv. Water Resour. 2018, 111, 289–300. [Google Scholar] [CrossRef]
  18. Yang, T.; Shi, W.; Li, S.; Xin, Y.; Yang, B. State of the art and trends of water-inrush mechanism of nonlinear flow in fractured rock mass. J. China Coal Soc. 2016, 41, 1598–1609. [Google Scholar]
  19. Yang, T.; Chen, S.; Zhu, W.; Meng, Z.; Gao, Y. Water inrush mechanism in mines and nonlinear flow model for fractured rocks. Chin. J. Rock Mech. Eng. 2008, 27, 1411–1416. [Google Scholar]
  20. Yang, T.H.; Shi, W.H.; Liu, H.L.; Yang, B.; Xin, Y.; Liu, Z.B. A non-linear flow model based on flow translation and its application in the mechanism analysis of water inrush through collapse pillar. J. China Coal Soc. 2017, 42, 315–321. [Google Scholar]
  21. Liu, W.; Zhao, J.; Li, Q. A MHC–NF Coupling Model for Water Inrush from Collapse Columns and Its Numerical Simulation. Geotech. Geol. Eng. 2018, 36, 2637–2647. [Google Scholar] [CrossRef]
  22. Yao, B.; Mao, X.; Wei, J.; Wang, D. Study on coupled fluid-solid model for collapse columns considering the effect of particle transport. J. China Univ. Min. Technol. 2014, 43, 30–35. [Google Scholar]
  23. Bear, J.; Bachmat, Y. Introduction to modeling of transport phenomena in porous media. Theory Appl. Transp. Porous Med. 1990, 4, 481–516. [Google Scholar]
  24. Zhou, Q.; Herrera-Herbert, J.; Hidalgo, A. Predicting the risk of fault-induced water inrush using the adaptive neuro-fuzzy inference system. Minerals 2017, 7, 1–15. [Google Scholar] [CrossRef]
  25. State Administration of Work Safety of China. Coal Mine Water Prevention and Control Regulations; China Coal Industry Publishing House: Beijing, China, 2009; pp. 84–85. (In Chinese) [Google Scholar]
  26. Li, W.; Liu, Y.; Qiao, W.; Zhao, C.; Yang, D.; Guo, Q. An improved vulnerability assessment model for floor water bursting from a Confined Aquifer Based on the Water Inrush Coefficient Method. Mine Water Environ. 2017, 37, 11–19. [Google Scholar] [CrossRef]
  27. He, M.; Lu, X.; Jing, H. Characters of surrounding rock mass in deep engineering and its nonlinear dynamic-mechanical design concept. Chin. J. Rock Mech. Eng. 2002, 21, 1215–1224. [Google Scholar]
Figure 1. The micro-control volume for the particle transport equation.
Processes 06 00120 g001
Figure 2. The micro-control volume for the heat transfer equation.
Processes 06 00120 g002
Figure 3. Geological profile along Coal Seam 3.
Processes 06 00120 g003
Figure 4. Boundary condition setting for mechanical model.
Processes 06 00120 g004
Figure 5. Boundary condition setting for the HM coupling model.
Processes 06 00120 g005
Figure 6. Boundary condition setting for the THM coupling model.
Processes 06 00120 g006
Figure 7. The water velocity when the working face was excavated to 65 m.
Processes 06 00120 g007
Figure 8. The seepage velocity distribution at different water pressure: (a) At 0 MPa, there is little water in the fault and the coal seam; (b) At 6 MPa, the water flows into the fault and the coal seam from the confined aquifer; and (c) At 10 MPa, the seepage velocity in the fault and the coal seam is higher than at 6 MPa.
Processes 06 00120 g008
Figure 9. The temperature contours at different water pressure: (a) at 0 MPa, the temperature contours have a smooth shift through the fault plane and the coal seam; (b) at 6 MPa, the temperature contours is a convex curve through the fault plane and the coal seam; and (c) at 10 MPa, the convex degree of the temperature contours is higher than at 6 MPa.
Processes 06 00120 g009
Figure 10. The maximum temperature on the monitoring line versus the water pressure when the working face advanced distance was 25 m, 45 m, 65 m, 85 m, 105 m, and 125 m, respectively.
Processes 06 00120 g010
Figure 11. The seepage velocity distribution at different working face advanced distances: (a) At 25 m, the seepage velocity in the fault and the coal seam is very low; (b) at 85 m, the seepage velocity in the fault and the coal seam is higher than at 25 m; and (c) at 125 m, the seepage velocity in the fault and the coal seam is higher than at 85 m.
Processes 06 00120 g011
Figure 12. The temperature contours at different working face advanced distances: (a) At 25 m, the temperature contours is a convex curve through the fault plane and the coal seam; (b) at 85 m, the convex degree of the temperature contours is higher than at 25 m; and (c) at 125 m, the convex degree of the temperature contours is higher than at 85 m.
Processes 06 00120 g012
Figure 13. The maximum temperature on the monitoring line versus the working face advanced distance when the water pressure is from 0 MPa to 10 MPa, respectively.
Processes 06 00120 g013
Table 1. Rock mechanical parameters.
RockThickness (m)Density (kg/m3)Bulk Modulus (GPa)Shear Modulus (GPa)Permeability (m2)Porosity
Sandstone 12026609.8968.0511.1 × 10−140.05
Sandstone 24526509.7567.2571.2 × 10−140.06
Main roof3024808.7304.2641.8 × 10−130.12
Immediate roof1525028.8726.0311.7 × 10−140.10
Coal seam314005.4551.2956.1 × 10−130.20
Immediate floor4.224308.2174.1262 × 10−140.13
Sandstone 350.326009.5727.0292.5 × 10−140.12
Mudstone3524908.5304.1622.1 × 10−130.21
confined aquifer25262010.4175.9525.1 × 10−110.28
Fault150021.51.2 × 10−110.26
Table 2. The fitting polynomial, the maximum temperature, and the temperature difference.
The Working Face Advanced DistanceThe Fitting Polynomial4.311 MPa7.185 MPa8.997 MPa
The Maximum TemperatureThe Temperature DifferenceThe Maximum TemperatureThe Temperature DifferenceThe Maximum TemperatureThe Temperature Difference
25 my = −5 × 10⁻⁵P4 + 0.0007P3 − 0.0048P2 + 0.2279P + 40.51441.451.3642.031.9442.362.27
35 my = −1 × 10⁻⁵P4 − 0.0003P3 + 0.0025P2 + 0.2475P + 40.32941.411.3242.102.0142.472.38
45 my = 5 × 10⁻⁵P4 − 0.0018P3 + 0.0115P2 + 0.2653P + 40.13241.361.2742.102.0142.472.38
55 my = 0.0001P4 − 0.0034P3 + 0.0223P2 + 0.2793P + 39.91941.301.2142.081.9942.422.33
65 my = 0.0002P4 − 0.0052P3 + 0.0346P2 + 0.2904P + 39.69241.241.1542.172.0842.632.54
75 my = 0.0003P4 − 0.0076P3 + 0.0506P2 + 0.295P + 39.44141.151.0642.152.0642.622.53
85 my = 0.0004P4 − 0.0106P3 + 0.0701P2 + 0.295P + 39.16441.030.9442.041.9542.392.30
95 my = 0.0006P4 − 0.0144P3 + 0.0955P2 + 0.2883P + 38.85440.930.8442.112.0242.622.53
105 my = 0.0008P4 − 0.0198P3 + 0.1294P2 + 0.2769P + 38.49540.790.7041.951.8642.282.19
115 my = 0.0012P4 − 0.0284P3 + 0.18P2 + 0.2697P + 38.05140.700.6141.951.8642.232.14
125 my = 0.0022P4 − 0.0474P3 + 0.2724P2 + 0.3337P + 37.43240.900.8142.172.0842.382.29
Table 3. The identification criteria for the water inrush warning level.
The Warning LevelThe Water Inrush Coefficient (MPa/m)The Water Pressure (MPa)The Temperature Change (°C)
SafeT ≤ 0.06P ≤ 4.311ΔT ≤ 1
Dangerous0.06 < T ≤ 0.14.311 < P ≤ 7.1851 < ΔT ≤ 2
More dangerousT > 0.1P > 7.185ΔT > 2

