Article

Investigation of Deep Mine Shaft Stability in Alternating Hard and Soft Rock Strata Using Three-Dimensional Numerical Modeling

1
State Key Laboratory for Geomechanics & Deep Underground Engineering, China University of Mining & Technology, Beijing 100083, China
2
School of Mechanics and Civil Engineering, China University of Mining & Technology, Beijing 100083, China
*
Author to whom correspondence should be addressed.
Processes 2019, 7(1), 2; https://doi.org/10.3390/pr7010002
Submission received: 8 October 2018 / Revised: 29 November 2018 / Accepted: 4 December 2018 / Published: 20 December 2018
(This article belongs to the Special Issue Fluid Flow in Fractured Porous Media)

Abstract

:
The problem of shaft instability has always been a major difficulty in deep mining practices. The shaft fracture has a high probability of being located near the aquifers and the soft–hard rock contact zone. This paper describes the deformation and stress characteristics of surrounding rock and the shaft lining under the interactive geological conditions under soft and hard rock strata in Anju coal mine, Shandong Province, China. Using the Method of Geological Strength Index (GSI ) and considering the rock-softening characteristics of water, the parameters of rock mass are calibrated. By means of the 3DEC-trigon method, the variation characteristics of surrounding rock and the shaft lining are simulated. After shaft excavation, under the condition of no support, shear failure and tensile failure occur in shallow surrounding rock shafts, and a pressure relief zone is formed. Shear failure is the main destruction mode in deep surrounding rock. Because of the different strengths of the surrounding rock, the deformation of the surrounding rock is significantly different. After the surrounding rock is softened by water absorption, the difference is magnified. The maximum shear stress and plastic zone appear near the interface between soft and hard rock. Under the condition of shaft lining support, uneven deformation of surrounding rock surely leads to nonlinear variation of pressure on the shaft lining. Under the action of an inhomogeneous pressure field, partial shear failure occurs in the shaft lining, and the shear failure area increases after the surrounding rock is softened by water. Because of the nonlinear deformation of the shaft lining, it is easy to produce stress concentration and bending moment near the interface between hard and soft strata. The control methods of advance grouting and pressure relief excavation are proposed to improve the stability of the shaft, and a good effect is gained.

1. Introduction

As the coal resource has been exhausted in shallow mining areas, deep mining has become increasingly common, and the depth of the mine shaft has also increased greatly. Deep geotechnical engineering needs to face special geological conditions such as high geostress, high geotemperature and high karst water pressure, which make the engineering more difficult and dangerous [1]. The shaft is an important passageway connecting ground and underground space, as a guttural project of roadway engineering.
However, the phenomenon of shaft fracture has occurred frequently and caused serious damage and great loss to coal mine enterprises, and it has restricted deep mine mining. Through a large number of investigations on shaft rupture in the Huang Huai area, Wang J et al. [2] opined that the location of shaft fractures is mostly located near the aquifers and the contact zone of soft rock interlaced with hard rock. There are mainly five hypotheses on the mechanism of shaft failure of coal mines [3,4,5]: shaft failure by new tectonic movement, the construction of the shaft, groundwater seepage and land subsidence, temperature stress induced under variable temperature, and the vertical additional stress induced by mining and dewatering. However, the mechanism of the failure of a deep shaft in the soft–hard rock interface is still unclear and less studied.
Some experts have studied the physical and mechanical properties of alternate rock stratum. A. Yassaghi et al. [6] pointed out that the contact zone rock mass properties were significantly reduced, especially when wet. Through long-term detailed observations of the contact zone in the tunnel, it was proved that the tunnel-wall convergence in the contact zone was 3% higher than that in the normalized tunnel. Wenkai Feng et al. [7] found that deformation failure occurred many times during the Mounigou tunnel construction, and in the soft–hard rock contact zone the deformation failure was most obvious. The numerical simulation research (FLAC-3D) shows that there are obvious stress concentrations and differentiations near the interface of the soft-and-hard rock stratum, and that the surrounding rock deformation failure belongs to the type of soft rock plastic-squeezing failure.
The main and auxiliary shaft linings of the Baodian coal mine and Donghuantuo coal mine were destroyed during construction, and the destroyed location was near the interface between quaternary stratum and bedrock. The location of shaft lining failure in the Qianjiaying coal mine is near the stratum interface between sandstone and clay layers. The Chen Silou main shaft, Xinglong main shaft, Yangcun main/auxiliary shaft, Taiping main/ventilation shaft, Tongting main shaft and Pan Yidong main shaft failures occurred near the interface of strata. As shown in Figure 1, we think that because of the different mechanical parameters of the soft and hard rock, the deformation and failure characteristics of the rock are different under the effects of the ground stress and water. As a result, the pressure on the shaft lining is also different, which may cause a stress concentration phenomenon, thus causing the damage of the shaft lining.
It is hard to determine the stress and deformation failure characteristics of shaft in the soft–hard rock contact zone, depending on theoretical analysis only. Therefore, the mainly used method in our study is numerical simulation. At present, in shaft research, the applied methods on numerical analysis include the distinct element method and the finite element method [8,9]. Comparing with the results of the finite element method, the accuracy of displacement and stress given by the discrete element method of the paper is more precise and can explicitly simulate the fracture and failure process of an underground excavation [10,11]. The 3 Dimension Distinct Element Code (3DEC) is one of the most commonly used DEM software programs, and precisely reflects the stress and strain characteristics in 3D space. In the 3DEC simulation, to overcome the defects of only allowing fracture development along predefined discontinuities, the 3DEC-trigon method approach is used to research shaft stability [12,13,14].
In this thesis, 3DEC-trigon method is applied to simulate the mine shaft stability in soft–hard rock based on a case study at AN JU mine shaft. In the process of reasonable parameter selection, X-ray diffraction can be used to detect mineral content in rock samples. With the uniaxial compression testing system, the rock strength parameters can be obtained with different moisture content levels. According to the geologic description (appearance and structure of a rock mass), the method of Geological Strength Index (GSI) is adopted to evaluate the rock mass integrity and strength. In the numerical scheme, the trigon blocks are generated and bonded through contacts with predefined dimensions. The parameters of polygons and contacts in the trigon program are calibrated by the rock mass properties obtained through GSI. Based upon laboratory tests and previous research findings, a 3D calculated model of a shaft is established with the 3DEC-trigon method. The aim of this study is to understand the progressive failure mechanism of the mine shaft in the soft–hard rock stratum. The property of rock wetting that affects the shaft stability is also considered.

2. Engineering Properties of Deep Shaft-Surrounding Rock

2.1. The Engineering Status

The AN JU mine is in Jining City in China’s Shandong Province (Figure 2a). The depth of the auxiliary shaft is 1008 m and its diameter is 6 m. The surrounding rock of the shaft is mainly composed of mudstone and sandstone ranging from 900–950 m deep, and the detailed strata histogram is illustrated in Figure 3. The strata in the area can be divided into Quaternary strata, Jurassic stratum, Permian Shanxi Formation, Lower Shihezi Formation, Carboniferous–Permian Taiyuan Formation, Carboniferous Benxi Formation and Ordovician. Coal-bearing strata are Shanxi and Taiyuan Formations. There are many faults and structural fissures in this area. The larger faults include five north–south faults, 28 NE–NE faults and seven NW faults. Aquifers in this area mainly include a Quaternary aquifer, Jurassic sandstone aquifer, and deep Ordovician aquifer. In this paper, the target location is located in the Jurassic aquifer. The average thickness of the aquifer is about 690.5 m. It is mainly medium-fine sandstone and belongs to the fractured confined aquifers. According to borehole data, four parts in the Jurassic aquifer are divided, as shown in the Table 1. The C40 cast-in-situ concrete construction technique is applied in this region and the thickness of concrete is 600 mm (Figure 2b).

2.2. Rock Mass Properties

The shaft stability shows a rather pronounced variation with rock mechanical properties. Mineral component and moisture content of rocks have a dominant influence on rock mechanical properties [14]. Water is one of the important factors affecting rock strength. The interaction between water and rock includes mechanical action, physical action and chemical action. The mechanical action includes the influence of hydrostatic pressure and hydrodynamic pressure. Physical action mainly refers to the process of water softening, mudding, lubrication, drying and wetting, and freezing and thawing of rock, which change the physical and mechanical properties of rock and degrade the inherent mechanical properties of rock. Chemical actions mainly include dissolution, ion exchange, hydration and hydrolysis. The influence factors of water absorption characteristics of rocks include the influence of clay minerals, and the void structure and microstructure of clay minerals. In order to provide the parameter basis for the numerical simulation, X-ray diffraction and uniaxial compression tests are carried out for onsite rock specimens to understand the mineral components and mechanical properties of surrounding rock in the AN JU deep shaft. The X-ray diffraction (TTR III Multifunctional X-ray Diffraction Instrument, Rigaku, Tokyo City of Zhaodao, Japan) of rock samples is analyzed. The diffraction spectrums are shown in Figure 4. The analysis results are as follows: The clay mineral content of the mudstone is 50.3%, the largest proportion of clay minerals is montmorillonite; the clay mineral content of the sandstone is 10.8%, the largest proportion of clay minerals is kaolinite. In order to understand the effect of water on the mechanical properties of rock, the EHF-EG200KN-type full digital hydraulic servo test system (2000 kN Rock Uniaxial and Triaxial Test System, Changchun Testing Machine Co., Ltd, Beijing, China) is used for uniaxial test of natural-saturated-state rock samples (Figure 5).
The rock specimen properties are listed in Table 2. The average uniaxial compressive strength of mudstone under natural conditions is 12.12 MPa, and that of sandstone is 61.13 MPa. After saturated water absorption, sandstone strength is 28.52 MPa, and mudstone strength is 3.25 MPa when water absorption is 8%.
During the stability of jointed rock mass evaluation, the joint characteristics, weathering degree and roughness of rock mass should be considered. Generally speaking, the strength of jointed rock mass is less than that of intact rock mass [15]. At present, the commonly used methods for the engineering classification of rock mass include RMR (Rock Mass Rating), RQD (Rock Quality Designation), RMI (Rock Mass Index) and GSI [14]. The deformation modulus of rock mass is calculated by using the GSI (Geological Strength Index) on the basis of the study of the rock mass strength criteria for many years, such as from E. Hoek and so on. E. Hoek built the correlation model between rock mass modulus and the deformation modulus of the intact rock, and proved the rationality of the complex stability index [16]. The strength of the rock mass is calculated with the E. Hoek (2002) method [17].
E rm E i   =   ( 0.02   +   1     D / 2 1 + e ( 60   +   15 D     G S I ) / 11 )
σ cmass   =   σ c i ( m b   +   4 s     a ( m b     8 s ) ) 2 ( 1   +   a ) ( 2   +   a ) ( m b 4   +   s ) a s     1
m b   =   m i exp ( G S I     100 28     14 D )
s   =   exp ( G S I     100 9     3 D )
a   =   1 2   +   1 6 ( e G S I 15     e 20 3 )
The calculation methods of rock mass properties ( E rm : rock mass modulus; σ cmass : uniaxial compressive strength of rock mass) are based on the Geological Strength Index (GSI), the deformation modulus of the intact rock ( E i ), the uniaxial compressive strength of the intact rock ( σ c i ) and the rock mass damage factor (D = 0.5). Rock mass properties are listed and described in Table 3.

2.3. Mechanics Model of Shaft Lining Stability through Soft–Hard Rock Contact Zone

As shown in Figure 6, a simplified structural mechanics model for shaft lining forces is established. P1 represents the vertical stress of rock strata, and increases with the increase of burial depth, while P2 represents the vertical stress of the shaft lining, including the vertical component of self-weight stress and additional stress of the shaft lining. Due to the different mechanical properties of rock strata, lateral deformation produced by vertical loads is different. Under the action of vertical stress, the surrounding soft rock of the shaft would produce large lateral deformation, and the shaft lining would endure heavy load (q1). However, the lateral deformation of hard rock under vertical stress is smaller, and the lateral load on the shaft lining is also smaller (q2). As shown in Figure 6, the shaft lining produces irregular deformation near the soft–hard rock contact zone, and the stress concentration is produced under the pressure P2, which could lead to damage of the shaft lining.

3. Numerical Model Establishment

3.1. The Determination of Parameters in 3DEC-Trigon

The behavior of the rock mass is controlled by parameters that can be divided into the following two groups: (1) block model parameters—density, bulk modulus (K), shear modulus (G), cohesion (C), internal friction angle (φ), tensile strength ( σ t ); and (2) contact model parameters—normal stiffness ( K n ), shear stiffness ( K s ), cohesion ( C j ), internal friction angle ( φ j ), and tensile strength ( σ t j ). The edge length of the irregular blocks ( Δ z min ) is set to 0.1 m in the surrounding rock area of the shaft. According to the rock mechanics parameters obtained from laboratory and calculation (Table 1 and Table 2), K, G, K n and K s can be calculated as follows [18]:
K   =   E 3 ( 1     2 μ )
G   =   E 2 ( 1   +   μ )
K n   = 10 [ K   +   3 4 G Δ z min ]
K s   =   0.4 K n
Other parameters required in 3DEC were obtained from a series of simulated rock mass compression tests. If the rock mass is small—for example, it contains only one structural plane—then the mechanical properties of the rock mass in a certain direction will be significantly controlled by this structural plane. If the rock mass size continues to increase, including more structural planes, the mechanical properties of rock mass in this direction will depend on the combination of structural planes. When the rock mass size increases to a certain extent, the combination of structural planes in this direction tends to be fixed, and the influence on the mechanical properties of rock mass tends to be stable. The smallest rock mass size with a combination of structural planes that is stable is called the REV (Representative Elementary Volume) [19]. According to numerical experiments, we select REV = 4 × 4 × 8 m, when Δ z min = 0.4 . According to a series of numerical simulation experiments, the numerical simulation parameters are determined as shown in Table 4. The uniaxial experimental curve of rock mass is shown in Figure 7.

3.2. Numerical Mode and Simulation Schemes of Shaft

As shown in the Figure 8, a numerical model based on 3DEC numerical simulation software is established. The size of the model is 50 (x width) × 50 (y width) × 15 (z height) m, containing 135,210 blocks. The mudstone (7 m) and sandstone (7 m) strata traversed by the shaft in the mine were chosen to be research objects. The shaft is about 6 m in diameter, and the shaft lining thickness is about 0.6 m. According to the results of the relative crustal stress test, vertical stress mainly is compression stress in depth, the vertical stress is measured to 26 MPa, the maximum horizontal stress is 23 MPa along the x-axis, the minimum horizontal stress is 18 MPa, and the simulated depth is 905 m. The upper boundary and horizontal boundary adopt the stress boundary condition, and the bottom boundary condition is fixed z-direction displacement. The surrounding rock is divided by joints with a maximum length of 0.4 m near the shaft, and joints with a length of about 1 m are used in other parts.
Through the removal of blocks in the shaft, excavation is simulated, and the water softening of rock mass is simulated by the weakening of joints and block parameters within the range of 1.5 m surrounding the shaft lining. In order to understand the deformation and stress characteristics of surrounding rock and shaft lining at the soft–hard rock contact zone, the following numerical simulation schemes are adopted in the mining area: (1) deformation and stress characteristics of surrounding rock in the natural state of surrounding rock, without shaft lining support; (2) deformation and stress characteristics of surrounding rock and shaft lining in the natural state of surrounding rock with shaft lining support; (3) deformation and stress characteristics of surrounding rock with rock water absorption softening.

4. Simulation Result Analysis

4.1. Displacement Analysis

Figure 9 shows the displacement curves of the monitoring points after shaft excavation. The results showed that all monitoring curves increased at the beginning of a period of time, then they showed a steady trend gradually. The deformation of surrounding rock under natural conditions is shown in Figure 9b and Figure 10a. Maximum deformation of mudstone is 1.2 m, and that of sandstone is 0.2 m. Figure 9c and Figure 10b show the deformation characteristics of surrounding rock after water absorption and softening. Compared with rock in natural conditions, the deformation of mudstone increased by 0.4 m and sandstone by 0.2 m after softening. Figure 9d and Figure 10c,d respectively indicate the displacement characteristics of concrete shaft lining under natural conditions and water softening. The maximum displacement of the shaft lining is parallel to the direction of maximum principal stress. The displacement of the shaft lining in the mudstone formation (33 mm) is larger than that in sandstone stratum (28 mm). This feature is more obvious after water absorption and softening of rock, where the deformation is 34 mm and 58 mm, respectively. Because of the nonuniform deformation of the shaft lining, there will be larger bending moments at the junction between the hard rock and the weak rock.

4.2. Stress Analysis

Simulated distribution characteristics of max shear stress under unsupported and concrete supporting conditions are presented in Figure 11a–d, and water softening of surrounding rock is also considered. It can be seen in Figure 11a,b that under unsupported conditions, the pressure relief zone appears obviously in the surrounding rock of the shaft, and the maximum shear stress appears near the interface between the hard and soft rock strata. The formation of a pressure relief zone is mainly caused by plastic failure of surrounding rock. Figure 11b demonstrates that the maximum shear stress distribution of surrounding rock after water absorption softening is obviously higher than that of the natural state, and the influence of upper soft rock on hard rock is greater. The scope of the pressure relief zone also expanded obviously after water absorption softening. Figure 11c,d illustrates the max shear stress characteristics of the concrete shaft lining, which is in the natural state, and water-absorbing soft rock condition of surrounding rock, respectively. The result indicated that the shear stress of the shaft lining in the soft rock section is much greater than that in the hard rock stratum. This kind of imbalance is more prominent after water absorption and softening of the surrounding rock.

4.3. Plastic Zone Analysis

This paper assumes that the surrounding rock of the shaft is a homogeneous isotropic medium. Firstly, the stress distribution characteristics of surrounding rock before and after excavation are determined by elasticity theory. Then, according to the H-B strength criterion, the yield failure of the surrounding rock under this stress field can be judged. The H-B strength criterion is shown in Formula (10) [20],
σ 1   =   σ 3   +   σ c ( m b σ 3 σ c   +   s ) a
where σ 1 —maximum principal stress, σ 3 —minimum principal stress, σ c —uniaxial compressive strength, m a , s , a —the parameters reflecting the characteristics of rock mass. At σ 3   +   σ c ( m b σ 3 σ c   +   s ) a     σ 1   =   0 , the surrounding rock is at the critical point of elasticity and plasticity.
According to the theory of elasticity, the stress value of a point in the surrounding rock of the shaft is obtained by the polar coordinate method. The analysis diagram of the surrounding rock of the shaft is shown in Figure 12.
[ σ 1   =   σ r   +   σ θ 2   +   ( σ r     σ θ 2 ) 2   +   ( τ r θ ) 2 σ 3 = σ r   +   σ θ 2     ( σ r     σ θ 2 ) 2   +   ( τ r θ ) 2
{ σ r   =   σ y 2 [ ( 1   +   λ ) ( 1     R 0 2 r 2 )   +   ( 1     λ ) ( 1     4 R 0 2 r 2   +   3 R 0 4 r 4 ) cos 2 θ ] σ θ   =   σ y 2 [ ( 1   +   λ ) ( 1   +   R 0 2 r 2 )     ( 1     λ ) ( 1   +   3 R 0 4 r 4 ) cos 2 θ ] τ r θ   =   σ y 2 [ ( 1     λ ) ( 1   +   2 R 0 2 r 2     3 R 0 4 r 4 ) sin 2 θ ]
According to Formulas (10)–(12), where σ y , σ x is the horizontal in-situ stress, λ is the ratio of horizontal in-situ stress which is <1, and R 0 is the radius of roadway, the range of the plastic zone is related to the uniaxial compressive strength and rock integrity of rocks when the size of the shaft and in-situ stress are determined.
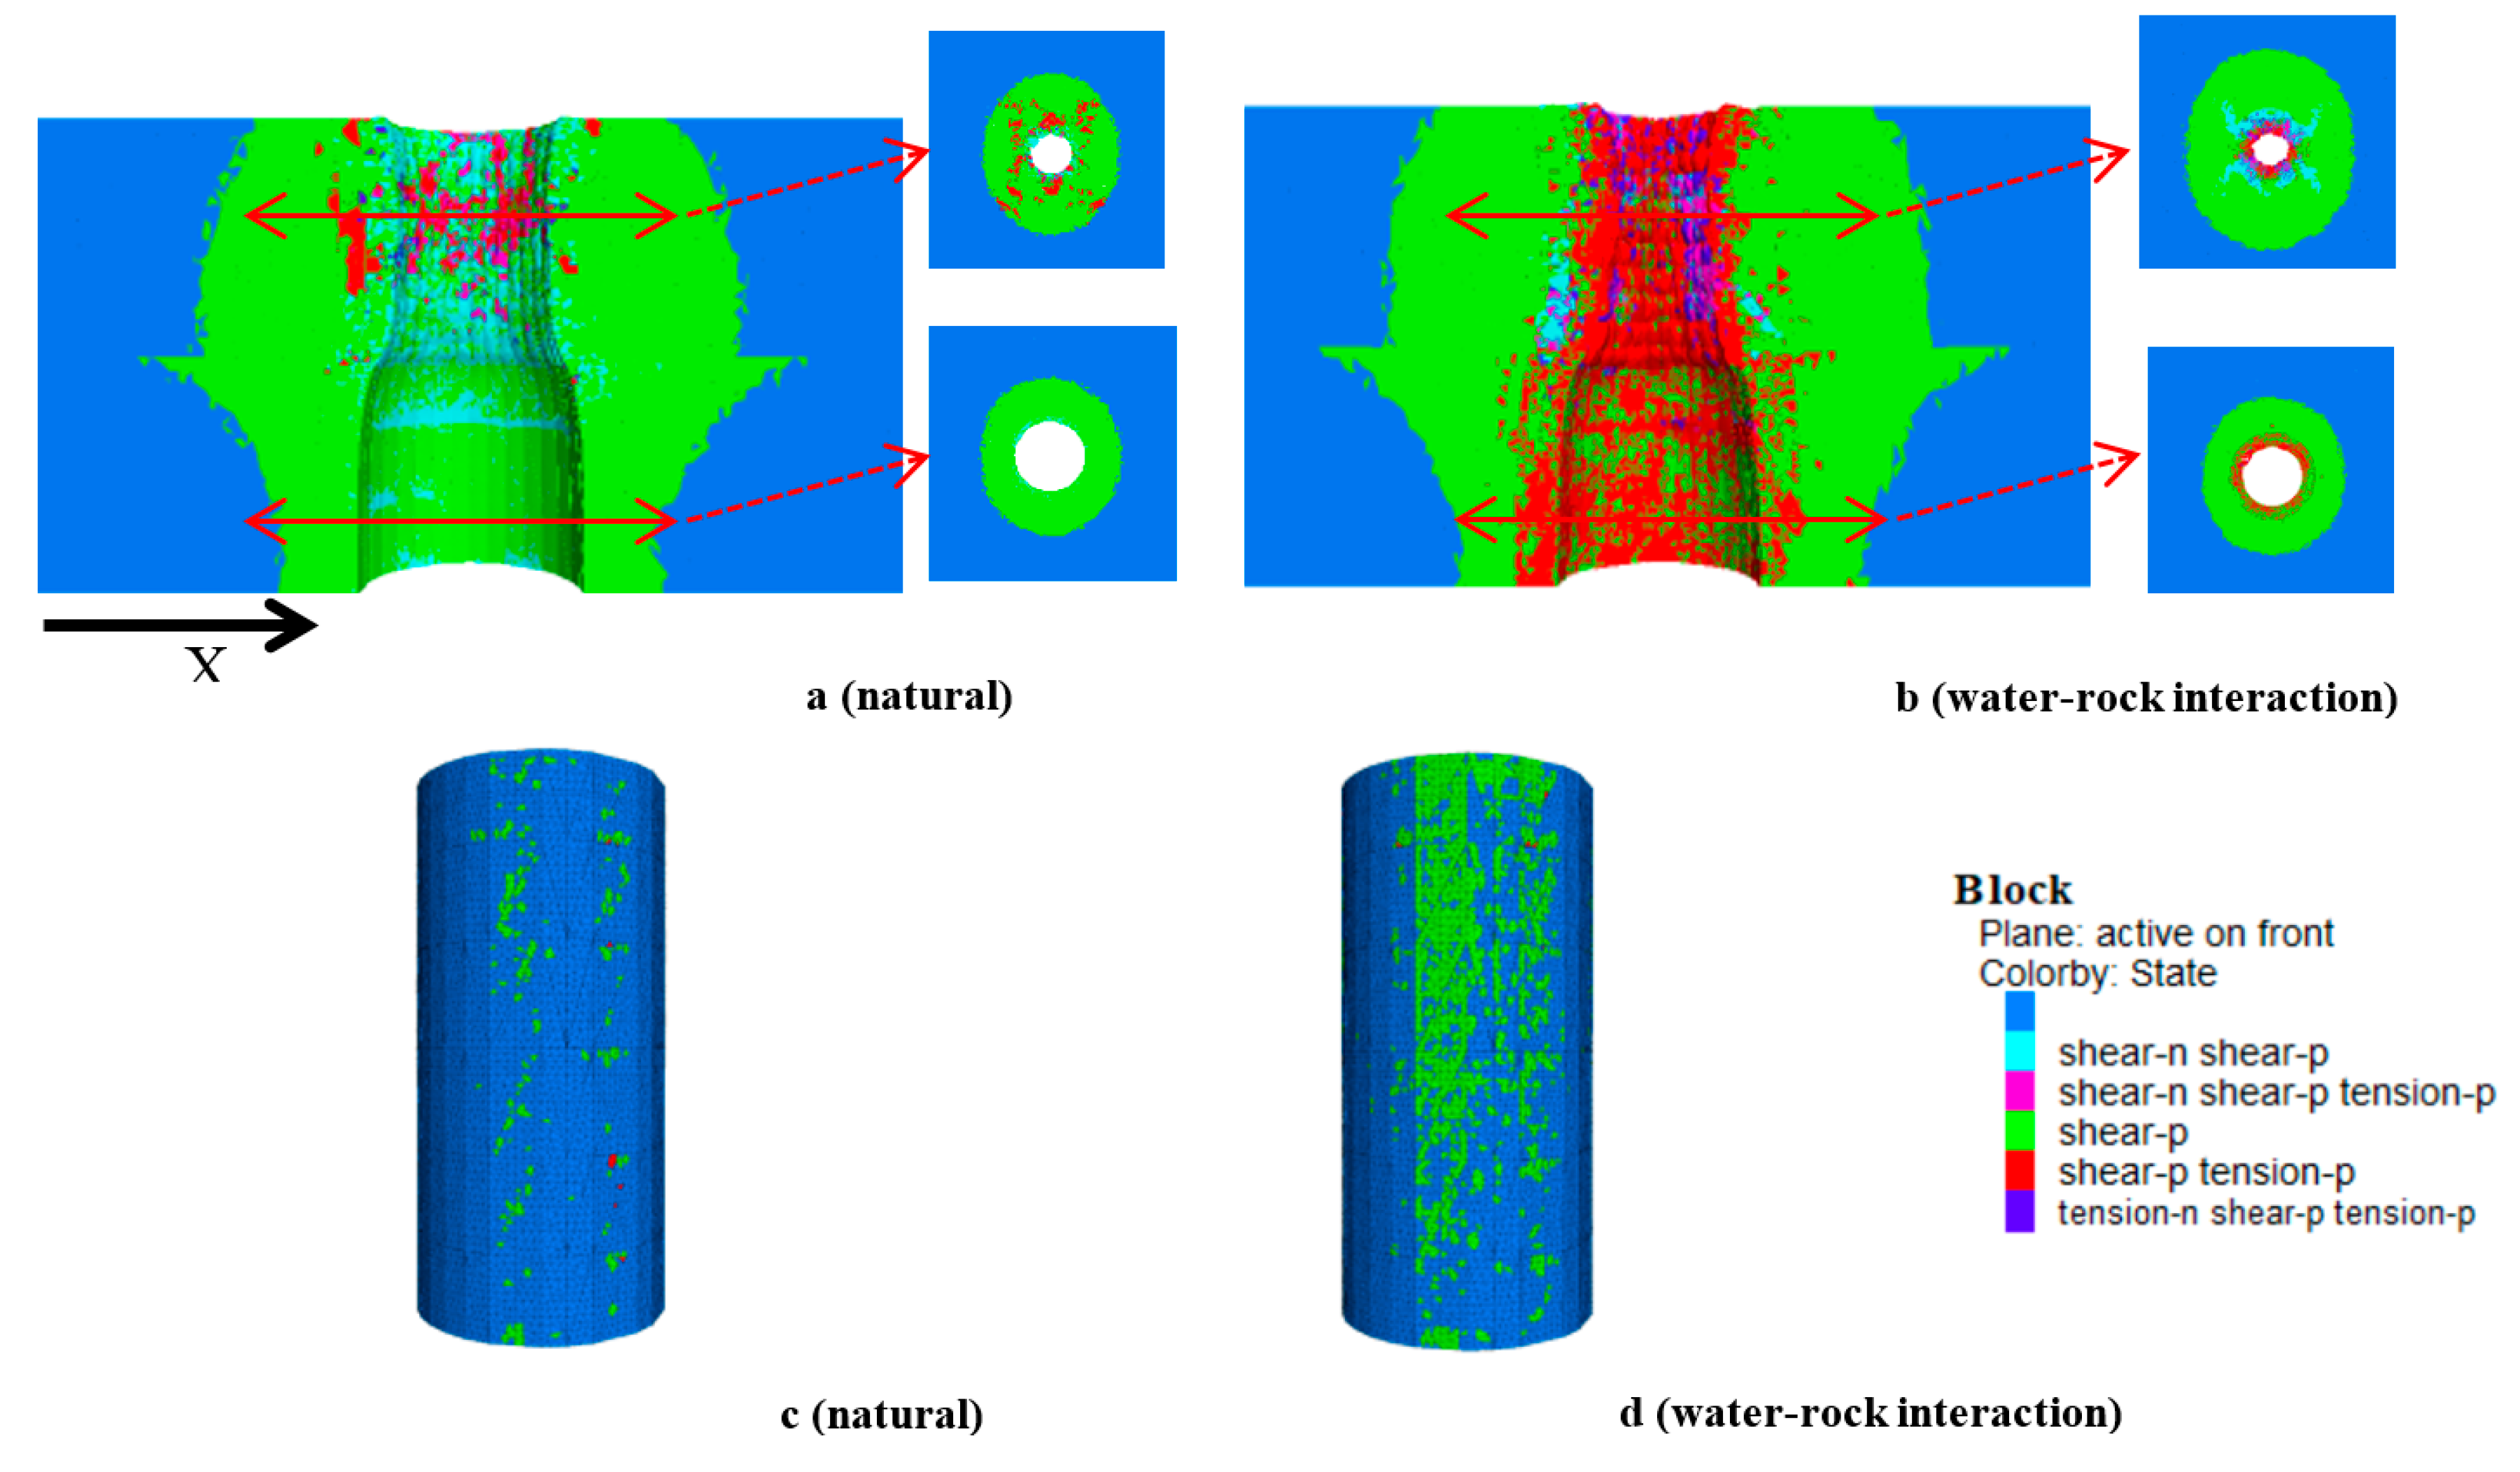
The damage modes of the shaft-surrounding rock and concrete shaft lining are mainly composed of tensile failure and shear failure. Figure 13a,b shows the failure mode of the surrounding rock of the shaft without support. The shear failure and tensile failure coexist in the 5 m range of surrounding rock. The deep surrounding rock parts are mainly shear failure. It is especially pointed out that Figure 12b takes into account the water absorption softening of surrounding rock. In the horizontal direction, the plastic zone of the surrounding rock is elliptical, and the long axis is perpendicular to the maximum principal stress direction. Under the influence of incompatible deformation of surrounding rock, the soft rock stratum produces lateral additional stress on the hard rock stratum, which makes the plastic zone expand nonlinearly at the interface between the soft and hard rock strata. After the water softening of the surrounding rock, the plastic area of the surrounding rock increases due to tensile failure. Figure 12c,d shows that the failure of the concrete shaft lining is mainly shear failure. After water absorption softening, the plastic zone of the shaft lining increases obviously.

4.4. Mechanism Analysis of the Shaft Deformation in Soft–Hard Rock Strata

The deformation and failure mechanisms of the shaft and shaft lining in alternate hard and soft rock strata are as follows:
(1) Under high stress, rock masses with different strengths have different deformation ratios. The target location of this study is deep at 900 m, and the vertical stress and horizontal stress are relatively high. After the shaft is excavated, the shallow rock mass around the shaft is destroyed under the action of shear stress and tensile stress. With the failure of rock mass, a certain range of loosened zones occur, and the stress is propagated from the surface to the interior, eventually forming a plastic zone dominated by shear failure. The destruction of rock is accompanied by the large deformation of surrounding rock, and the smaller the rock strength, the greater the deformation of surrounding rock. In addition, the surrounding rock contains a large number of clay minerals, so it will soften and expand when exposed to water.
(2) Additional stress in soft rock stratum. The soft rock stratum will produce larger shear stress than the hard rock stratum near the interface, leading to a large plastic zone near the rock interface. The numerical simulation shows that the water–rock interaction aggravates the damaging process of the rock mass.
(3) Stress concentrations due to squeezing action of surrounding rock. The uncoordinated deformation of strata will inevitably lead to asymmetric deformation of the shaft lining. The deformation of the shaft lining in the hard rock stratum decreases suddenly, which will cause the bending moment to increase and the stress concentration to increase abruptly. The deformation of the shaft lining parallel to the maximum principal stress is obviously higher than that in other directions.

5. Case Study

5.1. Control Principle of the Surrounding Rock

Numerical results show that the uncoordinated deformation of surrounding rock and the water absorption softening of rock have a significant effect on shaft stability. Therefore, advance grouting should be adopted in the water-bearing section of the shaft. On the one hand, an artificial water-isolating layer is established between the fractured rock mass and the aquifer to reduce the water absorption and softening phenomenon of surrounding rock, while on the other hand, the strength of the rock mass is enhanced. In order to reduce the pressure of the mine shaft lining, the stress of the surrounding rock should be released to utilize the utmost self-bearing capacity of the rock mass. Under these control measures of surrounding rock, the deformation of the Anju coal mine shaft is in the safe range.

5.2. Construction Technique of Deep Shaft Advance Grouting

Urea–formaldehyde resin and oxalic acid are used as grouting materials. The grouting material manufacturer is Wenchang Petrochemical Co. Ltd. of Zibo City, Shandong Province, China. The product model is U20 urea–formaldehyde resin. The grouting parameters are as follows: the range of grouting concentration is 10–50%; initial viscosity: 1.7–15 cP (20°); bond strength: 1.7–3.7 MPa; sand consolidation strength: 1.2–9.5 MPa; setting time: 1.08–35.33 min; gelling properties: 3.17–47.5 min. As shown in Figure 14, pre-grouting pipes are uniformly arranged around the shaft and the center, the inclination of grouting pipes is 80°, and the number of grouting pipes is determined according to the water gushing. In order to achieve an ideal grouting effect, technical parameters should be adjusted according to borehole detection, stability of surrounding rock, shaft water gushing and grouting observations in the actual construction.

5.3. Pressure Unloading of Surrounding Rock

The shaft passing through the deep soft rock stratum is divided into three steps, which can fully release the surrounding rock pressure and deformation of the shaft. Firstly, a small section with radius 3000 mm is used to drive 1.4 m. The process is controlled at about 16 h. The second step is to use a full section heading of 1.4 m. Finally, the construction of the concrete shaft lining is conducted by use of concrete (C40), and the thickness is 0.6 m.

6. Conclusions

This paper presents a numerical simulation study on the deformation mechanism of surrounding rock, and the stress characteristics of the shaft lining, in alternating hard and soft rock strata. With the project background of the Anju coal mine auxiliary shaft (900 m section) in Shandong Province, the research mainly focuses on the surrounding rock strength, water’s rock-softening characteristics, deformation and failure rules of the shaft-surrounding rock, and stress characteristics of the shaft lining.
The test results show that the uniaxial compressive strength of mudstone decreases by 3.72 times at 8% water content, and that of sandstone decreases by 2.15 times at the saturation state. Using the GSI evaluation index, the parameters of numerical simulation under different rock mechanics conditions were determined. Deformation and failure characteristics of surrounding rock under the natural state and water absorption softening state were studied by using the 3DEC-trigon method.
It is considered that after the excavation, the shallow surrounding rock will be destroyed and the stress relaxation zone will be formed under the condition of no support. The failure mode of shallow surrounding rock comprises the coexistence of shear failure and tensile failure. The failure mode of deep surrounding rock is mainly shear failure. The deformation of surrounding rock is closely related to the strength of rock strata, and there is obvious nonlinear change in the vertical direction. This phenomenon is more obvious after water absorption softening of rock strata. Soft rock strata will produce larger lateral additional stress on hard rock strata near the interface of strata. It shows that the surrounding rock pressure will cause the shearing failure of the shaft lining. After the water softening effect on the surrounding rock, the plastic area increases obviously in the shaft lining. In the area where the shaft lining displacement changes abruptly, significant bending moments and stress concentration will be generated. In addition, the swelling of clay minerals in the surrounding rock will be a threat to the shaft.
In order to reduce the threat of water–rock coupling to the shaft lining and improve rock mass strength, a pre-grouting control system was adopted near the aquifer section. The method of surrounding rock pressure relief is adopted to improve the bearing capability of surrounding rocks, reduce the uneven deformation of the shaft lining and improve the stability of the shaft. The case study can provide reference for the failure process and control technology of the shaft under deep alternating hard and soft rock strata.

Author Contributions

Conceptualization, X.S. and G.L.; Methodology, X.S.; Software, G.L.; Validation, C.Z., Y.L.; Formal Analysis, C.M.; Investigation, G.L.; Resources, X.S.; Data Curation, G.L.; Writing-Original Draft Preparation, X.S.; Writing-Review & Editing, G.L.; Visualization, C.Z.; Supervision, X.S.; Project Administration, X.S.; Funding Acquisition, X.S.

Funding

This work was supported by the National Key Research and Development Plan of China (Grant No. 2016YFC0600901), the National Natural Science Foundation of China (Grant No. 51874311), the Special Fund of Basic Research and Operating of China University of Mining & Technology, Beijing (Grant No. 2009QL03), and the Yueqi Outstanding Scholar Award Program of China University of Mining and Technology, Beijing.

Conflicts of Interest

The authors declare no conflicts of interest.

References

  1. He, M.C.; Xie, H.P.; Peng, S.P.; Jiang, Y.D. Study on rock mechanics in deep mining engineering. Chin. J. Rock Mech. Eng. 2005, 24, 2803–2813. [Google Scholar]
  2. Wang, J.; Luo, N.; Bai, Z. On the relation between interlayer glide caused by coal extraction and the shaft rupture occurring in coal mines in huanghuai area. Chin. J. Rock Mech. Eng. 2003, 22, 1072–1077. [Google Scholar]
  3. Zhang, W.Q.; Lu, Y.-H.; Gong, H.Y.; Meng, X.J.; Guan, Y.Z. Causes analysis of shaft wall damage inYan-Teng Mining District and its prevention and contyolling method. Rock Soil Mech. 2004, 25, 1977–1980. [Google Scholar]
  4. Jing, L.; Liu, F.; Gao, Q.; Yang, R. Rupture stress of shaft wall in mine due to ground subsidence. Chin. J. Rock Mech. Eng. 2004, 23, 3274–3280. [Google Scholar]
  5. Liu, J.L.; Chen, L.W.; Wang, J.L. Characteristic analysis of temperature stresses of shaft wall. Rock Soil Mech. 2011, 32, 2386–2390. [Google Scholar]
  6. Yassaghi, A.; Salari-Rad, H. Squeezing rock conditions at an igneous contact zone in the Taloun tunnels, Tehran-Shomal freeway, Iran: A case study. Int. J. Rock Mech. Min. Sci. 2005, 42, 95–108. [Google Scholar] [CrossRef]
  7. Feng, W.; Huang, R.; Li, T. Deformation analysis of a soft–hard rock contact zone surrounding a tunnel. Tunn. Undergr. Space Technol. Inc. Trenchless Technol. Res. 2012, 32, 190–197. [Google Scholar] [CrossRef]
  8. Wang, L.; Cheng, Y.P.; Ge, C.G.; Chen, J.X.; Li, W.; Zhou, H.X.; Wang, H.F. Safety technologies for the excavation of coal and gas outburst-prone coal seams in deep shafts. Int. J. Rock Mech. Min. Sci. 2013, 57, 24–33. [Google Scholar] [CrossRef]
  9. Walton, G.; Kim, E.; Sinha, S.; Sturgis, G.; Berberick, D. Investigation of shaft stability and anisotropic deformation in a deep shaft in Idaho, United States. Int. J. Rock Mech. Min. Sci. 2018, 105, 160–171. [Google Scholar] [CrossRef]
  10. Bai, Q.S.; Tu, S.H.; Zhang, C.; Zhu, D. Discrete element modeling of progressive failure in a wide coal roadway from water-rich roofs. Int. J. Coal Geol. 2016, 167, 215–229. [Google Scholar] [CrossRef]
  11. Gao, F.; Stead, D. Discrete element modelling of cutter roof failure in coal mine roadways. Int. J. Coal Geol. 2013, 116–117, 158–171. [Google Scholar] [CrossRef]
  12. Chen, W.; Konietzky, H.; Abbas, S.M. Numerical simulation of time-independent and -dependent fracturing in sandstone. In Proceedings of the ACM/IEEE International Conference on Software Engineering, Florence, Italy, 16–24 May 2015; pp. 129–138. [Google Scholar]
  13. Gao, F.Q.; Stead, D. The application of a modified Voronoi logic to brittle fracture modelling at the laboratory and field scale. Int. J. Rock Mech. Min. Sci. 2014, 68, 1–14. [Google Scholar] [CrossRef]
  14. Yang, S.Q.; Chen, M.; Jing, H.W.; Chen, K.F.; Meng, B. A case study on large deformation failure mechanism of deep soft rock roadway in Xin’An coal mine, China. Eng. Geol. 2017, 217, 89–101. [Google Scholar] [CrossRef]
  15. Lu, S.; Xu, M. Determination and application of modulus of deformation of rock masses based on GSI system. Chin. J. Rock Mech. Eng. 2009, 28, 2736–2742. [Google Scholar]
  16. Hoek, E.; Diederichs, M.S. Empirical estimation of rock mass modulus. Int. J. Rock Mech. Min. Sci. 2006, 43, 203–215. [Google Scholar] [CrossRef]
  17. Hoek, E.; Carranza-Torres, C.; Curkum, B. Hoek-Brown failure criterion—2002 Edition. In Proceedings of the Fifth North American Rock Mechanics Symposium, Toronto, ON, Canada, 7–10 July 2002; Volume 1, pp. 267–273. [Google Scholar]
  18. Itasca Consulting Group, Inc. 3DEC User Manual; Itasca Consulting Group, Inc.: Minneapolis, MN, USA, 2016. [Google Scholar]
  19. Kulatilake, P.H.S.W.; Panda, B.B. Effect of Block Size and Joint Geometry on Jointed Rock Hydraulics and REV. J. Eng. Mech. 2000, 126, 850–858. [Google Scholar] [CrossRef]
  20. Wu, L.; Adoko, A.C.; Li, B. An Illustration of Determining Quantitatively the Rock Mass Quality Parameters of the Hoek–Brown Failure Criterion. Rock Mech. Rock Eng. 2018, 51, 1063–1076. [Google Scholar] [CrossRef]
Figure 1. Schematic image of stress in shaft.
Processes 07 00002 g001
Figure 2. (a) The location of the An JU coal mine. (b) Plan view of the shaft.
Processes 07 00002 g002
Figure 3. Lithological descriptions of the shaft.
Processes 07 00002 g003
Figure 4. X-ray diffraction analysis of mudstone and sandstone specimens.
Processes 07 00002 g004
Figure 5. The whole stress–strain curve of rock.
Processes 07 00002 g005
Figure 6. Simplified structural mechanics model for shaft lining forces.
Processes 07 00002 g006
Figure 7. Simulated uniaxial compressive test for the rock mass.
Processes 07 00002 g007
Figure 8. Numerical model for the surrounding rock of the shaft.
Processes 07 00002 g008
Figure 9. Displacement curves of the monitoring points after shaft excavation.
Processes 07 00002 g009
Figure 10. Simulated displacement map of the surrounding rock under unsupported conditions and under concrete supporting (C40) conditions.
Processes 07 00002 g010
Figure 11. Simulated distribution characteristics of max shear stress under unsupported and concrete supporting conditions.
Processes 07 00002 g011
Figure 12. The analysis diagram of the surrounding rock of the shaft.
Processes 07 00002 g012
Figure 13. Distribution of plastic zone.
Processes 07 00002 g013
Figure 14. Layout of shaft pre-grouting construction.
Processes 07 00002 g014
Table 1. Hydrogeologic nature of rock mass.
AquifersShaft DepthLithologyJoint Distribution
I355–505 mJurassic sandstoneFracture density and openness lower
II639–759 mSandstoneDense vertical joints
III736–871 mSandstoneHigh degree of openness, more filler
IV850–1005 mSandstone/mudstoneHigh degree of openness, strong connectivity
Table 2. The table of uniaxial compression experiment calculation.
Lithologyσc/MPaσc/MPa
(Average)
E/GPaE/GPa
(Average)
u
Mudstone
(8%)
2.253.250.80.840.34
3.960.86
3.470.86
Mudstone
(natural)
12.3812.122.992.940.29
12.192.94
11.802.89
Sandstone
(saturated)
28.72028.517.727.50.27
26.7347.91
30.1017.10
Sandstone
(natural)
64.14961.3312.2212.590.21
60.50512.74
59.35012.82
Table 3. Intact rock properties and rock mass properties.
LithologyIntact RockGSIConstantRock Mass
σ c i (MPa) E i (GPa) m i m b s a σ cmass (MPa) E rm (GPa)
Mudstone
(8%)
3.250.843750.2490.0002250.5140.840.055
Mudstone
(natural)
12.122.943750.2490.0002250.5143.140.189
Sandstone
(saturated)
28.517.5940191.0910.0003350.5117.390.58
Sandstone
(natural)
61.3312.5940191.0910.0003350.51115.890.96
Table 4. Parameters for the rock mass.
LithologyBlock PropertiesContact Properties
Density
(kg/m3)
K
(GPa)
G
(GPa)
Cb
(MPa)
φbσbt
(MPa)
Kn
(GPa)
Ks
(GPa)
Cj
(MPa)
φjσjt
(MPa)
Mudstone
(8%)
23200.080.020.6150.168.383.280.5150.09
Mudstone
(natural)
19000.150.0730.9210.420.508.212.94210.69
Sandstone
(saturated)
27300.420.2301.6210.559.1723.673.15253.07
Sandstone
(natural)
25500.550.4002.2321.085.21346.63326.32
Concrete
(C40)
25000.530.422.1311.287.23336.75316.43

