Textile Wastewater Treatment for Water Reuse: A Case Study
by
 ,
,
Hua Yin
1,2,* ,
,
Peiwen Qiu
3,
Yuange Qian
3,
Zhuwen Kong
3,
Xiaolong Zheng
3,
Zhihua Tang
1,2 and
Huafang Guo
1,2,* 1
Key Laboratory of Renewable Energy, Guangzhou Institute of Energy Conversion, Chinese Academy of Science, No. 2 Nengyuan Road, Wushan, Tianhe District, Guangzhou 510640, China
2
Guangdong Key Laboratory of New and Renewable Energy Research and Development, No. 2 Nengyuan Road, Wushan, Tianhe District, Guangzhou 510640, China
3
Foshan City Jialida Environmental Protection Technology Corporation, No. 10 Xingtang Road, Datang Industrial Park, Sanshui Distrct, Foshan 528143, China
*
Authors to whom correspondence should be addressed.
Processes 2019, 7(1), 34; https://doi.org/10.3390/pr7010034
Submission received: 11 December 2018
/
Revised: 30 December 2018
/
Accepted: 3 January 2019
/
Published: 11 January 2019
(This article belongs to the Special Issue Wastewater Treatment Processes)
Abstract
:The reduced natural waters and the large amount of wastewater produced by textile industry necessitate an effective water reuse treatment. In this study, a combined two-stage water reuse treatment was established to enhance the quality and recovery rate of reused water. The primary treatment incorporated a flocculation and sedimentation system, two sand filtration units, an ozonation unit, an ultrafiltration (UF) system, and a reverse osmosis (RO) system. The second treatment included an ozonation unit, a sand filtration unit, and UF and RO systems. The color removal rate increased with the increasing ozone dosage, and the relational expression between the ozone dosage and color removal rate was fitted. Ozonation greatly reduced the color by 92.59 and 97.27 times during the primary and second ozonation stages, respectively. RO had the highest removal rate. The combined processes showed good performance in water reuse treatment. The treated, reused water satisfied the reuse standard and surpassed the drinking water standard rates for chemical oxygen consumption (CODcr), color, NH3-N, hardness, Cl−, SO42−, turbidity, Fe3+, and Cu2+. The operating cost of reuse water treatment was approximately 0.44 USD·m−3.
1. Introduction
The decrease in natural water resources caused by drought and population growth has incited authorities to establish and encourage wastewater reuse. Industries are not immune to this water shortage. The increase in water costs and the obligation to respect the standards of wastewater disposal in the environment have compelled manufacturers, such as those from the textile industry, to rethink their management of residual waters [1]. Residual water has thus become a water resource, especially for high water consumers. Water consumption, wastewater treatment, and effluent reuse potential have become crucial factors for sustainable production [2].
The textile industry uses large quantities of water in stages, such as pretreatment, bleaching, dyeing, and printing, which demand approximately 100–200 L of high-quality water per kilogram of textile product and consequently generate huge amounts of dye wastewater [3]. The wastewater produced by textile industry contains organic matter, toxic chemicals derived from fixing agents, detergents, dyes, and salts and therefore is the most polluting among all industrial wastes [4]. The recalcitrant substances in the water are harmful to aquatic life because they reduce light penetration. Therefore, searching an effective method of treating and reusing wastewater from the textile industry is highly challenging.
In combined treatment systems, pH adjustment, coagulation–flotation [5], and sedimentation are usually employed as pre-treatment phases; biological processes (aerobic and anaerobic) are appropriate for organic removal [6,7]. However, textile wastewater also exhibits high color and low biodegradability [8], thus making it difficult to treat with physio-chemical and biological treatment methods [9]. Advanced oxidation processes have emerged as an effective water treatment technology for oxidation of various organic contaminants, including those not treatable by conventional techniques [10]. Zhu et al. [11] pointed out that ultrasonic oxidation technology is very efficient for the complete decolorization and mineralization of dyes. Oppong et al. [12] came to a conclusion that visible-light-driven photocatalytic activity of Gd-TiO2-GO nanocomposites presents better visible light photocatalytic performance and degradation efficiency over pure TiO2. Musmarra et al. [13] discovered that hydrodynamic cavitation is valid in the removal of ibuprofen. Iovino et al. [14] found that combined treatments based on UV light compared to other advanced treatment technologies are more eco-friendly for the removal of Ibuprofen from synthetic water streams. Therein the advanced oxidation processes, ozonation is one of the best options to treat wastewater containing non-biodegradable organic contaminants and to satisfy the reuse standard [15,16]. It has proved effective on water disinfection and micropollutants removal [17]. In addition to chemical oxygen consumption (CODcr) and biochemical oxygen demand (BOD5) removal, ozonation attains a high level of color removal, which is advantageous over conventional methods [3]. The potential of ozonation makes it widely used in water reuse systems [16]. On the contrary, one of its disadvantages is the high investment costs and energy consumption [18]. Furthermore, effluent salinity must be removed for textile wastewater reuse. Lin et al. [19] pointed out that typical textile wastewater may contain 6.0 wt% NaCl or 5.6 wt% Na2SO4. Membrane separations may help achieve the water quality for recycling [6] and allows contaminant removal and water reuse for certain applications [20]. Lin et al. [19] designed ultrafiltration (UF)–diafiltration to separate a dye/Na2SO4 aqueous mixture and has achieved 98% desalination efficiency and >97% dye recovery. Lara et al. [21] used a UF ceramic membrane for the removal of a reactive dye, Reactive Black 5, which was removed by up to 95.2%. Lafi et al. [22] pointed out that primary treated textile wastewater with combined UF–electrodialysis presents similar parameter values to those of normal feed water. Amar et al. [1] researched the integrating of activated sludge treatment with either nanofiltration (NF) or reverse osmosis (RO) to reclaim wastewater from denim fabric production. NF allows a high yield while maintaining the Tunisian standard of water reuse (CODcr < 90 mg L−1). Jager et al. [23] pointed out that the residual color in the UF permeate can be reduced from an average of 660 ADMI (color standard used by American Dye Manufacturer’s Institute) units to 12 ADMI units in the RO permeate; this value is lower than that required for potable water. Although NF shows better CODcr removal efficiency than RO, its salinity removal efficiency is dissatisfactory [24]. The yield of RO is lower than that of other systems [1], and its concentrate is difficult to treat due to its high concentration of organic matter, inorganic matter, ammonia nitrogen, and salt [25]. Thus, integrating membrane technique with conventional techniques or with other membrane-based techniques in a combined system is necessary to achieve technical and economic objectives [26].
There are many wastewater treatments for textile wastewater reuse, such as constructed wetland [27,28], activated carbon [29,30], ion exchange [31,32]. However, the constructed wetland has poor removal effect on color and the occupation area of it is very large. Activated carbon has a high removal rate on water-soluble dyes, but it cannot adsorb suspended solid (SS) and insoluble dyes. Besides, the activated carbon is difficult to regenerate and thus the operating cost of it is high. Although ion exchange treatment has great removal rate on some specific dissolved pollutants, it is not suitable for the treatment of a large number of multi-component textile wastewater. UF is a good pretreatment process [19]. RO has great effects on the residual color and remaining salt [23]. Ozone is one of the best treatment method in advanced oxidation methods [33], and it is a suitable alternative specially when integrated with biological treatments [10]. However, the industrial application of O3/UV or O3/UV/H2O2 is not recommended because the investment and operating costs are too high [33]. Therefore, in this research, ozonation + UF + RO combination sequence was developed to treat and reuse textile wastewater. The ozonation process mainly aimed to reduce follow-up membrane pollution. Furthermore, specific preprocesses, such as flocculation precipitation, sand filtration, self-cleaning filter, and security filter, were added before ozonation and membrane processing to reduce the operating costs. Additionally, the reuse rate of recycled water was subsequently increased through the secondary water reuse system.
The objective of this research is to find an effective method of treating and reusing wastewater from the textile industry, and analyze its elimination effect and operation cost in different stages with the best operative conditions. Although the ability of ozonation and membrane technologies for the treatment of textile wastewater is well known, most studies focused on synthetic wastewater prepared in laboratories and used laboratory-scale plants over limited periods. Comparing to the existing work, this research used detailed field studies, pollutants monitoring and electricity log processing to investigate the elimination effect and operation cost in different stages. To the best of our knowledge, this is the first time to analyze the operation cost of two-stage ozonation + UF + RO combination sequence with engineering data.
2. Materials and Methods
2.1. Setup and Operational Details of the Combined Systems
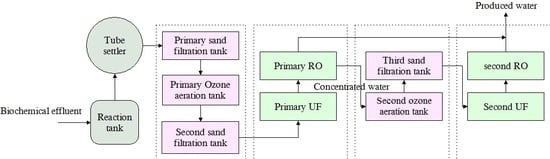
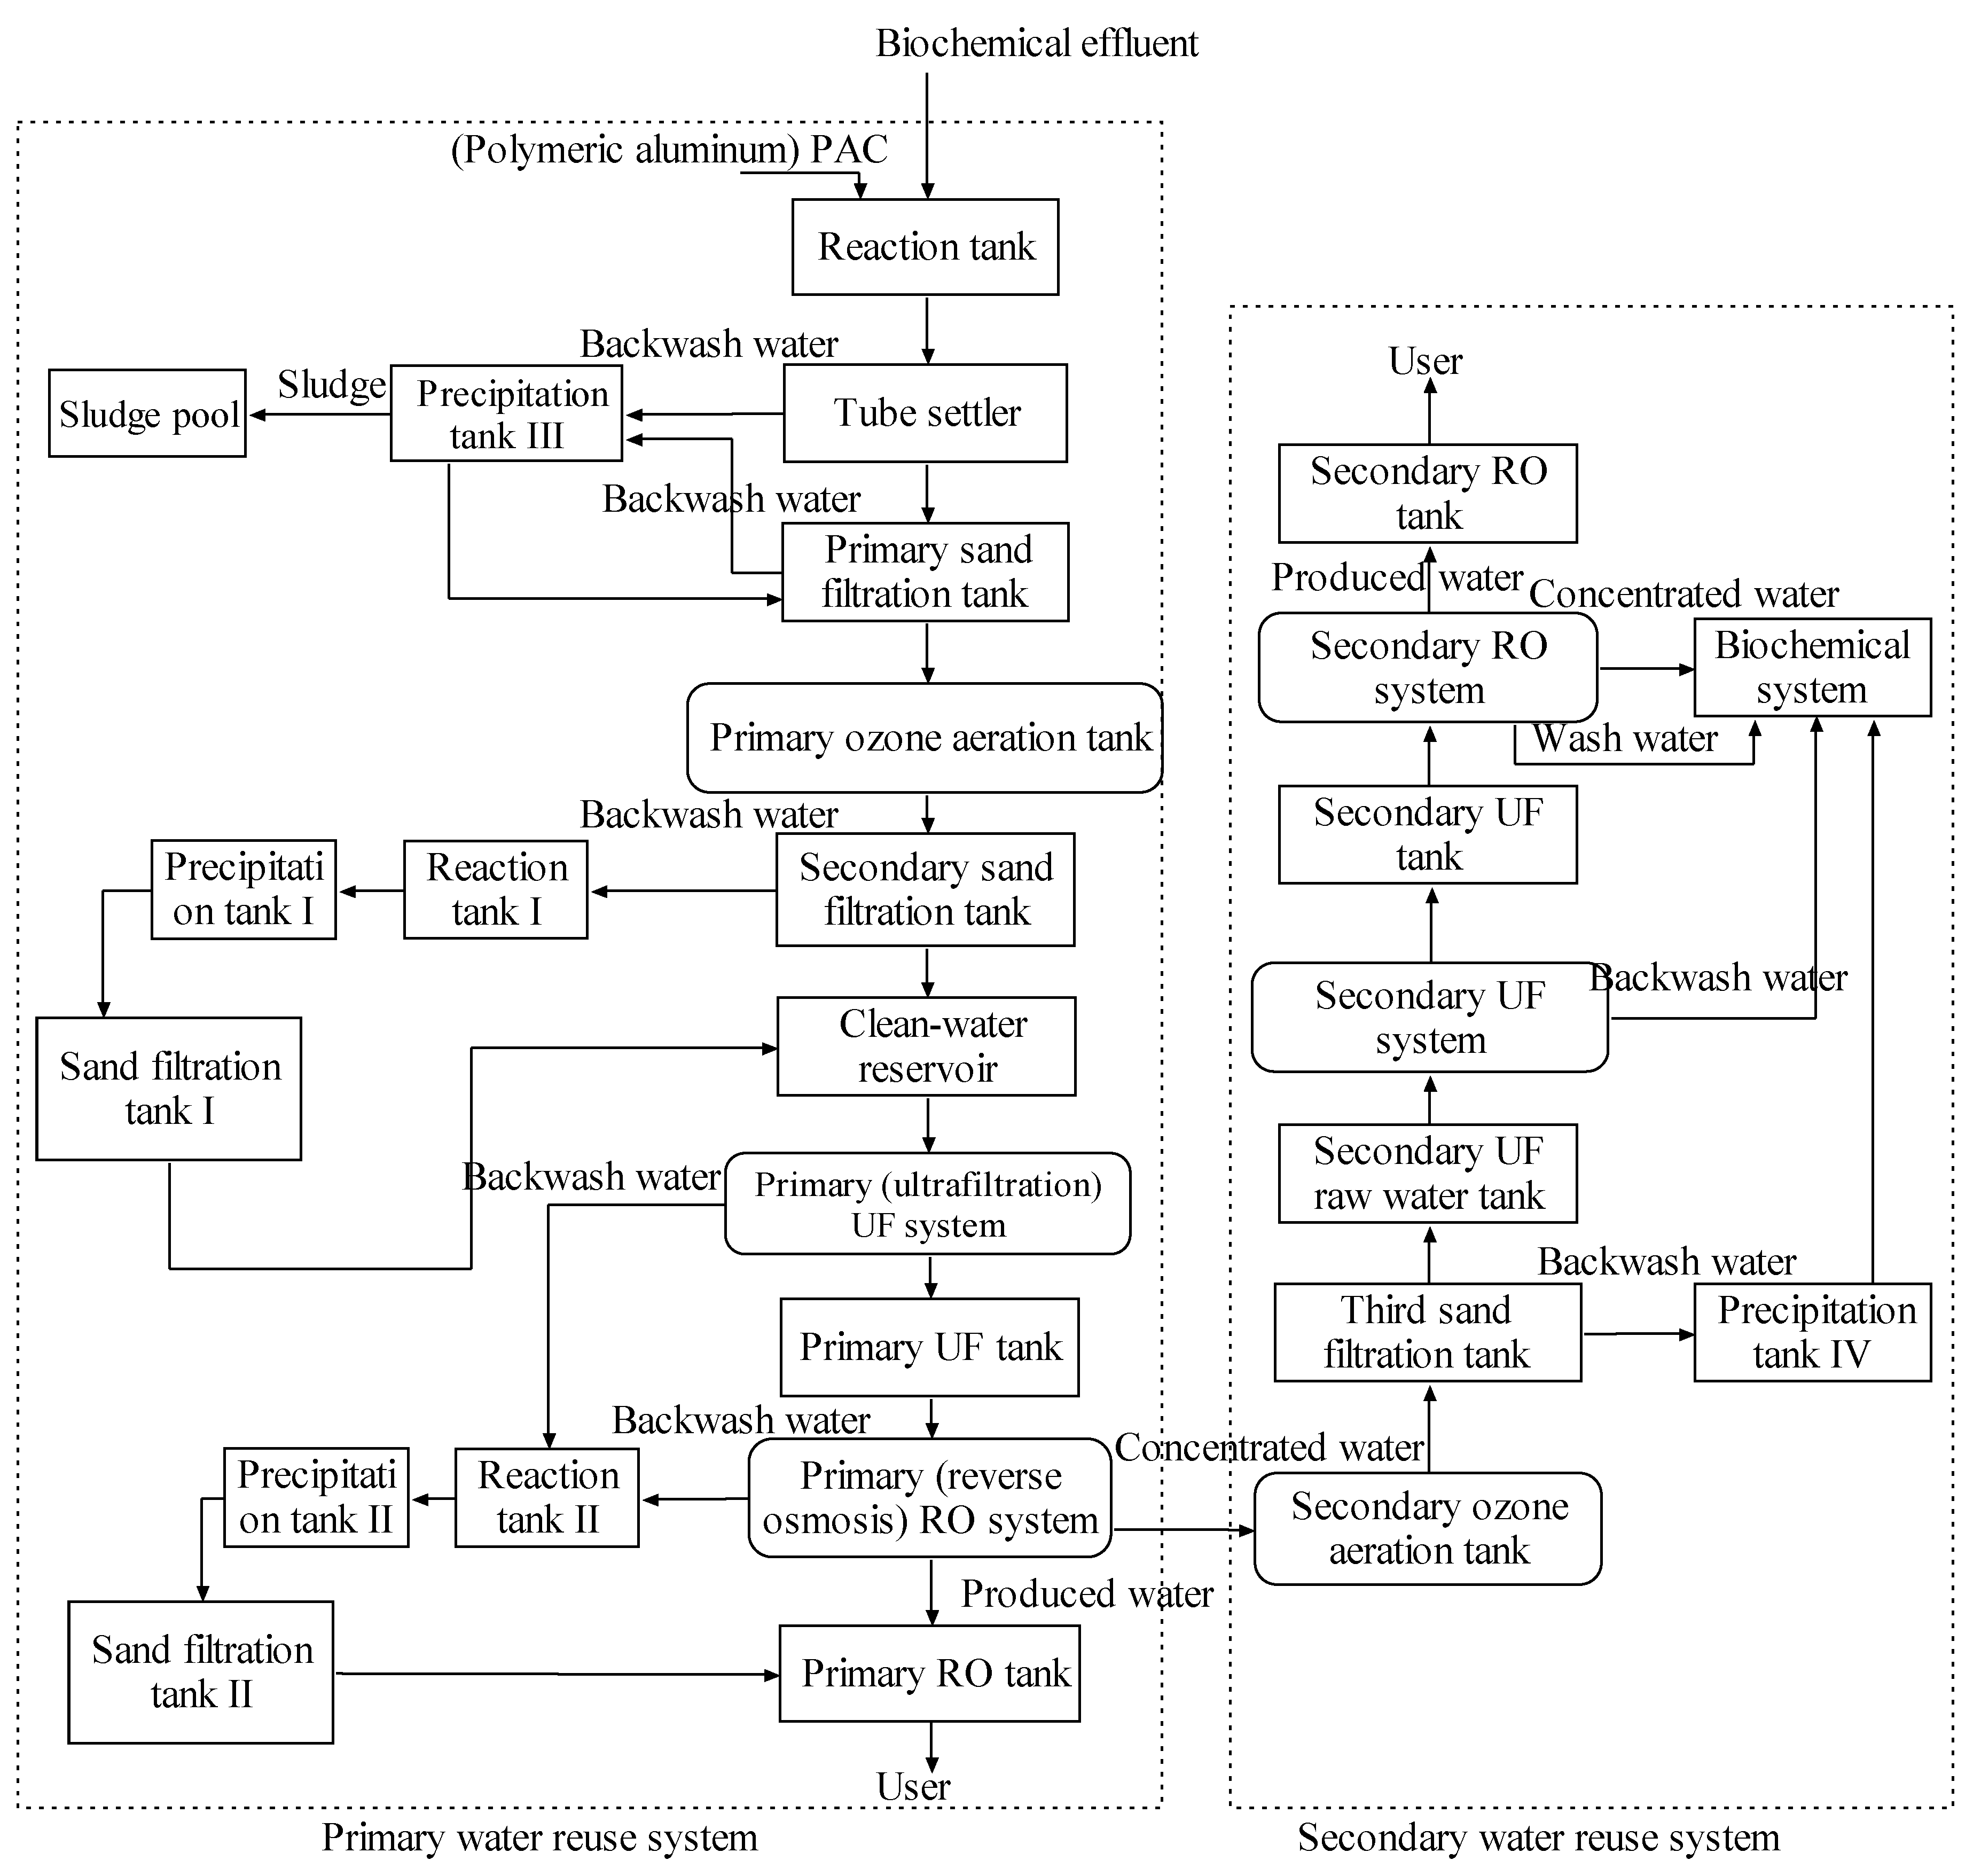
The schematics of the water reuse treatment processes are shown in Figure 1. Pretreatment and biological treatment techniques have been introduced in [3]. Therefore, the treatment technology of recycled water from textile wastewater was introduced in this study after biochemical treatment.
2.1.1. Reactive Precipitation + Primary Sand Filtration + Primary Ozonation + Second Sand Filtration
As a type of strong oxidant, ozone exhibits the following significant characteristics: (1) in addition to its decolorization, deodorization, and removal of organic matters, ozone also shows outstanding sterilizing effect; (2) ozone produces no sludge; and (3) ozone can be prepared on site to avoid storage and transportation problems. However, ozone consumption must be reduced to save the reuse cost of recycled water because ozone preparation consumes considerable electricity resources. Suspended matter, colloid, color, turbidity, and organic matter in water shall be eliminated partially to reduce follow-up ozone consumption. The biochemical effluent was first adsorbed and precipitated in the reaction tank and tube settler and then filtered by the primary sand filtration tank to remove part of residual pollutants (e.g., SS and CODcr). The processed water was subsequently decolorized in the primary ozone aeration tank. Effluents of the primary ozone aeration tank were sent to the clean-water reservoir after being filtered by the secondary sand filtration tank. The second sand filtration tank mainly aimed to eliminate the suspended matters, which generate in the ozone aeration, and some residues falling from the ozone aeration tank.
The hydraulic retention time of processing water in the tube settler was 6.4 h. In the sand filtration tank, wastewater was uniformly distributed to layers of filtering materials by using the water distributor. The filtering surfaces in the primary and secondary sand filters were approximately 450 m2 and 700 m2, respectively. The proposed treatment technology aimed to reuse recycled water and thus required higher ozone dosage than the methods previously described [3]. The ozone dosage and oxidation time were approximately 80–100 g·m−3 and 3.20–3.29 h, respectively. The hydraulic retention time of effluent was 0.98 h. The sand filtration tank was cleaned regularly through backwash assisted with air scrubbing. The backwash water in the primary sand filtration tank and tube settler was precipitated in precipitation tank III to eliminate sludge and was then sent to the primary sand filtration tank. The backwash water in the secondary sand filtration tank was processed in the reaction tank I + precipitation tank I + sand filtration tank I and then flowed to the clean water reservoir. The sand filtration tank was cleaned for 0.5 h every 8 h. Water consumption in the primary and secondary sand filtration tanks was approximately 1500 m3·d−1. Polymeric aluminum (PAC) was used as the flocculants in the reaction tank and reaction tank I.
2.1.2. Primary UF System
In order to remove part of the turbidity and CODcr and then protect the follow-up RO system, primary UF system was set. The procedure involved water production in the clean water reservoir → primary self-cleaning filters → feed pumps → primary UF devices → primary UF tank. The self-cleaning filters were used to purify water and protect normal operation of other equipment in the system. The filters intercepted impurities (e.g., suspended matters and particles) in the water by sieves, thus reducing turbidity and decreasing the productions of dirt and bacteria and the corrosion of the system. The filtering accuracy of the primary self-cleaning filters was approximately 100 μm. The UF membranes were composed of compressive modified polypropylene hollow fiber (PP) membrane. The operation pressure of primary UF was lower than 0.15 MPa. The UF device applied the full-automatic continuous operation mode composed of compressive dead-end filtering and gas-water backwash. Intercepted materials were eliminated through backwash or chemically enhanced backwash (CEB). The UF device performed 2 min of backwash every 1 h of the operation. Pollutants that could not be eliminated by backwash required online CEB at an interval of 24 h. Backwash water in the primary UF system entered the RO tank after being treated in the reaction tank II, precipitation tank II, and sand filtration tank II. The primary UF system provided approximately 350 m3·d−1 of backwash water. PAC was also used as the flocculants in the reaction tank II.
2.1.3. Primary RO System
The primary RO system was mainly composed of booster pumps, security filters, high-pressure pumps, RO membrane elements, wash-water pumps, valves, pressure pipes, and meters. The procedure included the primary UF tank → RO booster pumps → primary security filters → high-pressure pumps → primary RO devices → primary RO tank. The security filters aimed to prevent the blockage of the RO membrane by small particulate impurities and to maintain RO’s stable water yield. PP filter bags with a pore size of 5 µm were used in the security filter. Each RO device was equipped with one security filter. The operating pressure of the primary RO membrane was approximately 1.0–1.2 MPa. One backwash pump was installed in the RO system for regular backwash of the RO membrane, and the RO device was backwashed for 5 min after 3 h of operation. Some pollutants (e.g., organic matters and inorganic salt scaling) that were difficult to be washed away were cleaned by chemicals. Water produced by the primary RO system entered the RO tank and was then reused in enterprises in the industrial park. The primary RO concentrated water was processed in the secondary ozone aeration tank and then treated in the third sand filter + secondary UF + secondary RO system. The primary RO backwash water of approximately 130 m3·d−1 ran through the reaction tank II + precipitation tank II + sand filtration tank II, and finally entered into the RO tank.
2.1.4. Secondary Ozone Aeration Tank
In order to increase the reuse rate of recycled water, a secondary water reuse system, which included secondary ozone aeration tank, third sand filtration tank, secondary UF system and secondary RO system, was set to treat the primary RO concentrated water. So, a secondary ozone aeration tank was set behind the primary RO system. The reaction time and ozone dosage in this secondary ozone aeration tank were 1.5 h and 100–120 g·m−3 of wastewater, respectively.
2.1.5. Third Sand Filtration Tank
The third sand filtration tank mainly aimed to eliminate suspended matters and some residues falling from the tank during ozone aeration to maintain the stability of follow-up procedures. Backwash water of approximately 750 m3·d−1 in the third sand filtration tank was precipitated in the precipitation tank IV and then sent to the biochemical system. The filtering surface in the third sand filtration tank was 280 m2.
2.1.6. Secondary UF System
Effluent from the third sand filtration tank first entered into the secondary UF raw water tank, was filtered in the secondary self-cleaning filters, and finally entered into the secondary UF films and then the secondary UF tank. The filtering accuracy of the secondary self-cleaning filters was approximately 100 μm. Backwash water of approximately 130 m3·d−1 from the secondary UF tank entered into the biochemical system.
2.1.7. Secondary RO System
Water in the secondary UF tank ran through the RO booster pumps, filtered by the secondary security filters, and successively entered the secondary RO membranes through high-pressure pumps. The filtering accuracy of filter bags in the secondary security filters was approximately 5 μm, and the operating pressure of the secondary RO membranes was approximately 1.5–2.5 MPa. Treated water in the secondary RO system entered the secondary RO tank, whereas the concentrated water and wash water entered the biochemical system. The wash water volume in the secondary RO system was approximately 350 m3·d−1.
2.2. Sewage Quality
A sampling program was conducted in a selected textile company with a production capacity of 75,000 t·d−1 located at Foshan, China. The sewage parameters and corresponding standards are listed in Table 1. The CODcr in the effluent of biological treatment was similar to that previously described [3], but the color value was slightly higher due to the increased color in the raw water.
2.3. Analytical Methods and Instruments
The pH was measured according to the glass-electrode method, using 420A + pH meter (Orion, Beijing, China). CODcr analyses were performed by the fast digestion spectrophotometric method with DR890 chromometer (HACH, Shanghai, China). BOD5 analyses were determined by the dilution and inoculation method with YSI5100 dissolved oxygen meter (YSI, Beijing, China). Color was measured according to the dilution times method. NH3-N was performed by the Nessler’s reagents spectrophotometric method with 722 spectrophotometer (Juchuang, Qingdao, China), while total phosphorus (TP) was performed by the ammonium molybdate spectrophotometry with 722 spectrophotometer. Total nitrogen (TN) was determined by the alkaline potassium persulfate digestion UV spectrophotometry with UV-1800 ultraviolet spectrophotometer (Aucy, Shanghai, China). SS was measured according to the gravimetric method, using electronic scales (Sanxinheng, Shenzhen, China). Turbidity, hardness, conductivity, total alkalinity and Cl− were determined by turbidity meter (PTURB-202,Tiandishouhe, Beijing, China), hardness tester (CHCM-210, Changhong, Shenzhen, China), conductivity meter (GTCON-400C, GeneTest, Shanghai, China), total alkalinity meter (CHTA-211, Changhong, Shenzhen, China) and portable chlorometer (CLS-10A, Haiheng, Shanghai, China), respectively. SO42− was performed by the gravimetric method with electronic scales. Fe3+ and Cu2+ were determined by the flame atomic absorption spectrometric method with flame atomic absorption photometer (AA320N, Shangfen, Shanghai, China).
2.4. Mathematical Model
The over standard rates were formulated using Equation (1):
where Ei is the over standard rate for the ith parameter, Ci is the monitoring value of the ith parameter in each sample, and Si is the standard value for the ith parameter in each sample. Each sample was determined in triplicate.
The percentage removal of the parameters evaluated was determined using the following equation:
where Ci,in and Ci,out are the inlet and outlet concentration of the ith parameter. Each sample was determined in duplicate.
The unit operating cost of the reuse water can be calculated as
where TOC is the total operating cost of the reuse water treatment process and P is the inlets of the primary RO tank and the secondary RO tank. The total operating cost TOC includes electricity cost of ozone and oxygen production, electricity cost of pumps, agentia cost, machine maintenance cost, PAC cost, cost of UF and RO membrane replacement, employee cost and cost of filter-bag replacement.
3. Results and Discussion
3.1. Performance of Individual Process for the Removal of Various Contaminants
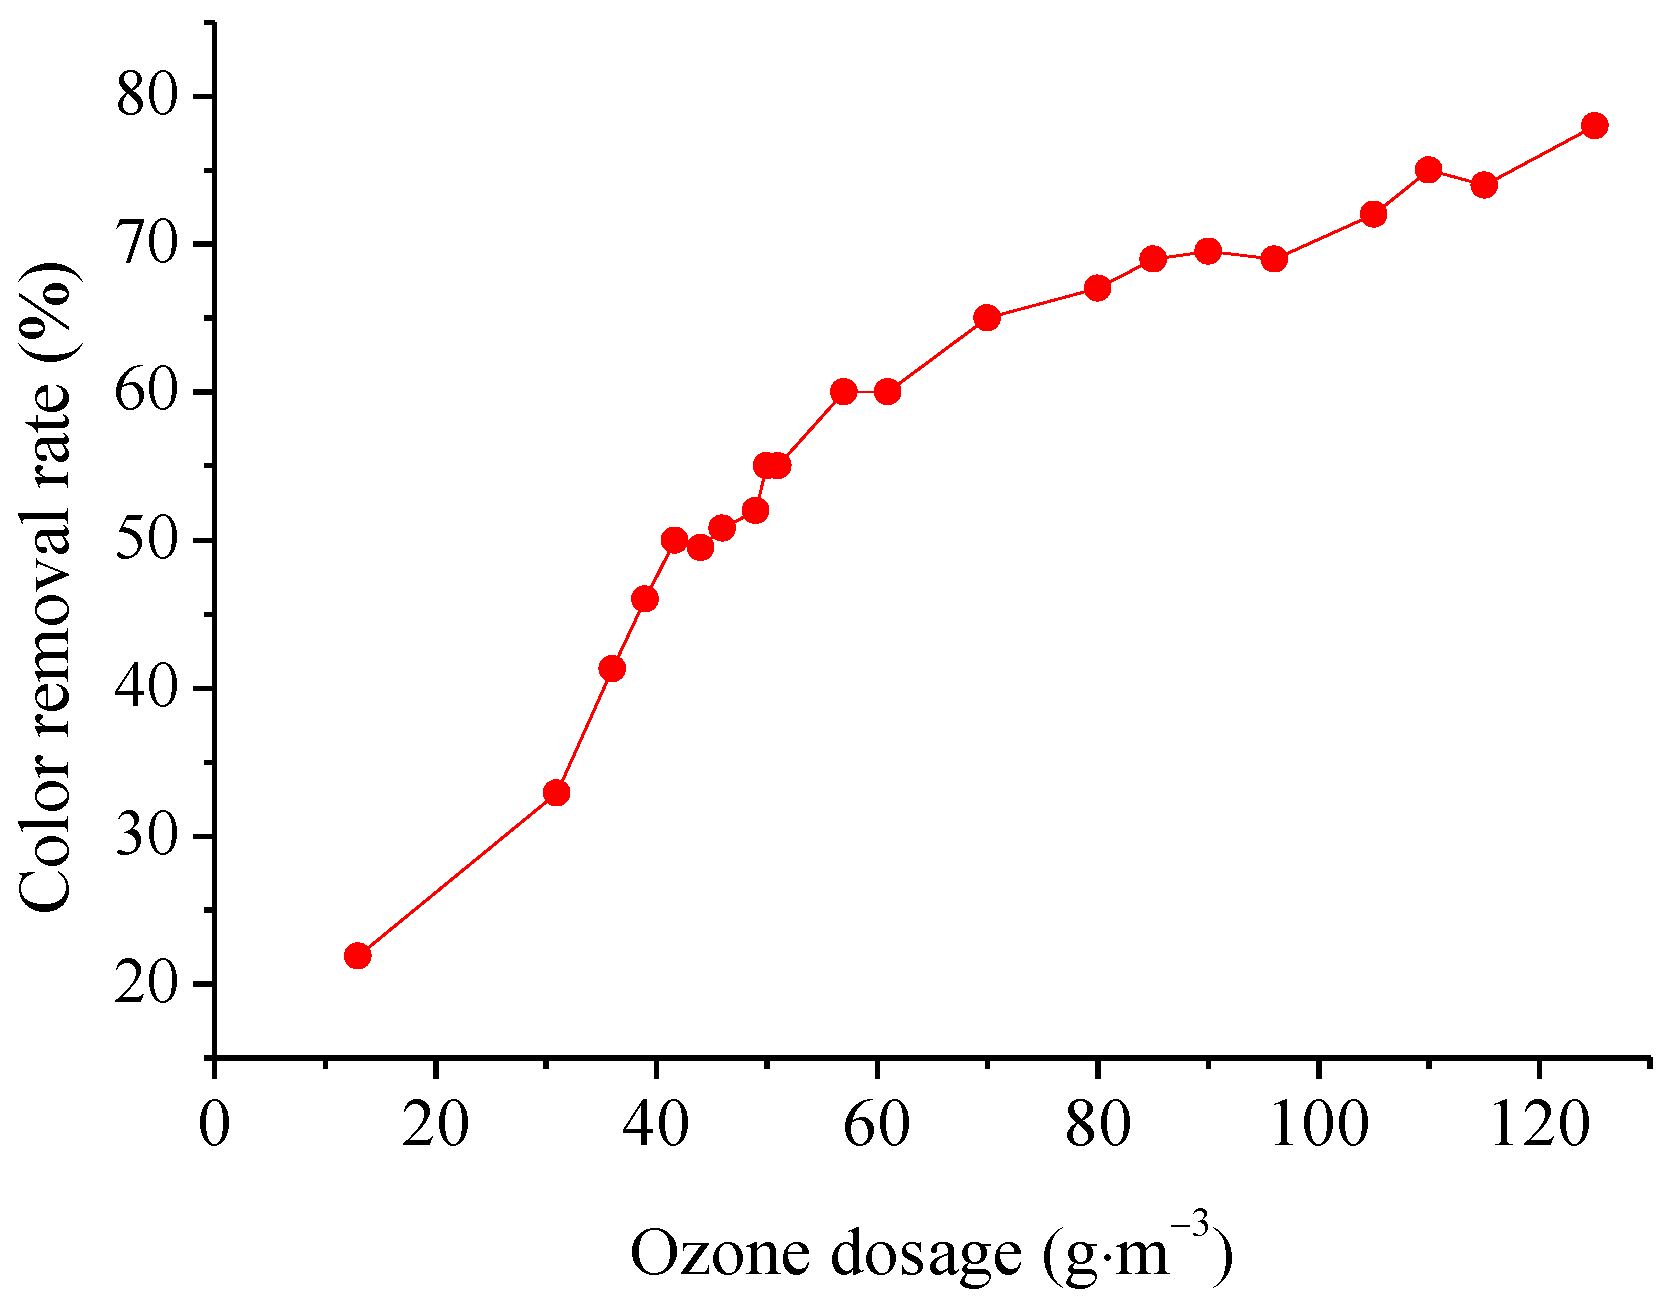
Ozonation and sand filtration have been well practiced for water treatment—the former in the destruction of chemical and biological contaminants, and the latter in the removal of particulate matter [37]. Sand filtration is a good pretreatment for UF because it removes the organic foulants from the secondary effluent and significantly increases the UF water flux [38]. Therefore, wastewater was preprocessed by primary sand filte–ozone–secondary sand filter technique before membrane treatment. Moreover, PAC was added for the flocculation of wastewater and then precipitated before sand filtration to reduce ozone consumption. As shown in Figure 2, the removal rate of SS was the highest (99.34 ± 0.92%), followed by color (74.01 ± 8.68%), CODcr (39.85 ± 7.51%), NH3-N (27.35 ± 31.78%), TP (13.25 ± 15.94%), and TN (−4.39 ± 25.02%) after treatment by the reaction, precipitation, primary sand filtration, ozonation oxidation and secondary sand filtration. SS was mainly eliminated during sand filtration. In addition, turbidity can also be eliminated during sand filtration, and the average removal rate of turbidity in the secondary sand filtration was about 37.42 ± 5.21%. The ozone dosage in the primary ozone aeration tank was approximately 90 g·m−3 of wastewater. The average removal rates of CODcr, color, NH3-N, TP, and TN were 27.6 ± 7.03%, 69.4 ± 6.98%, 23.8 ± 33.33%, −18.05 ± 19.30%, and −5.63 ± 28.54%, respectively, in the primary ozone aeration tank. The color removal rate was proportional to the ozone dosage (Figure 3). The relational expression between the ozone dosage x and color removal rate y was fitted with software CurveExpert 1.3 [39] (Equation (4): correlation coefficient = 0.9957).
y = 1.32 + 1.30 x − 1.30 × 10−3 x2 − 1.02 × 10−4 x3 + 5.46 × 10−7 x4
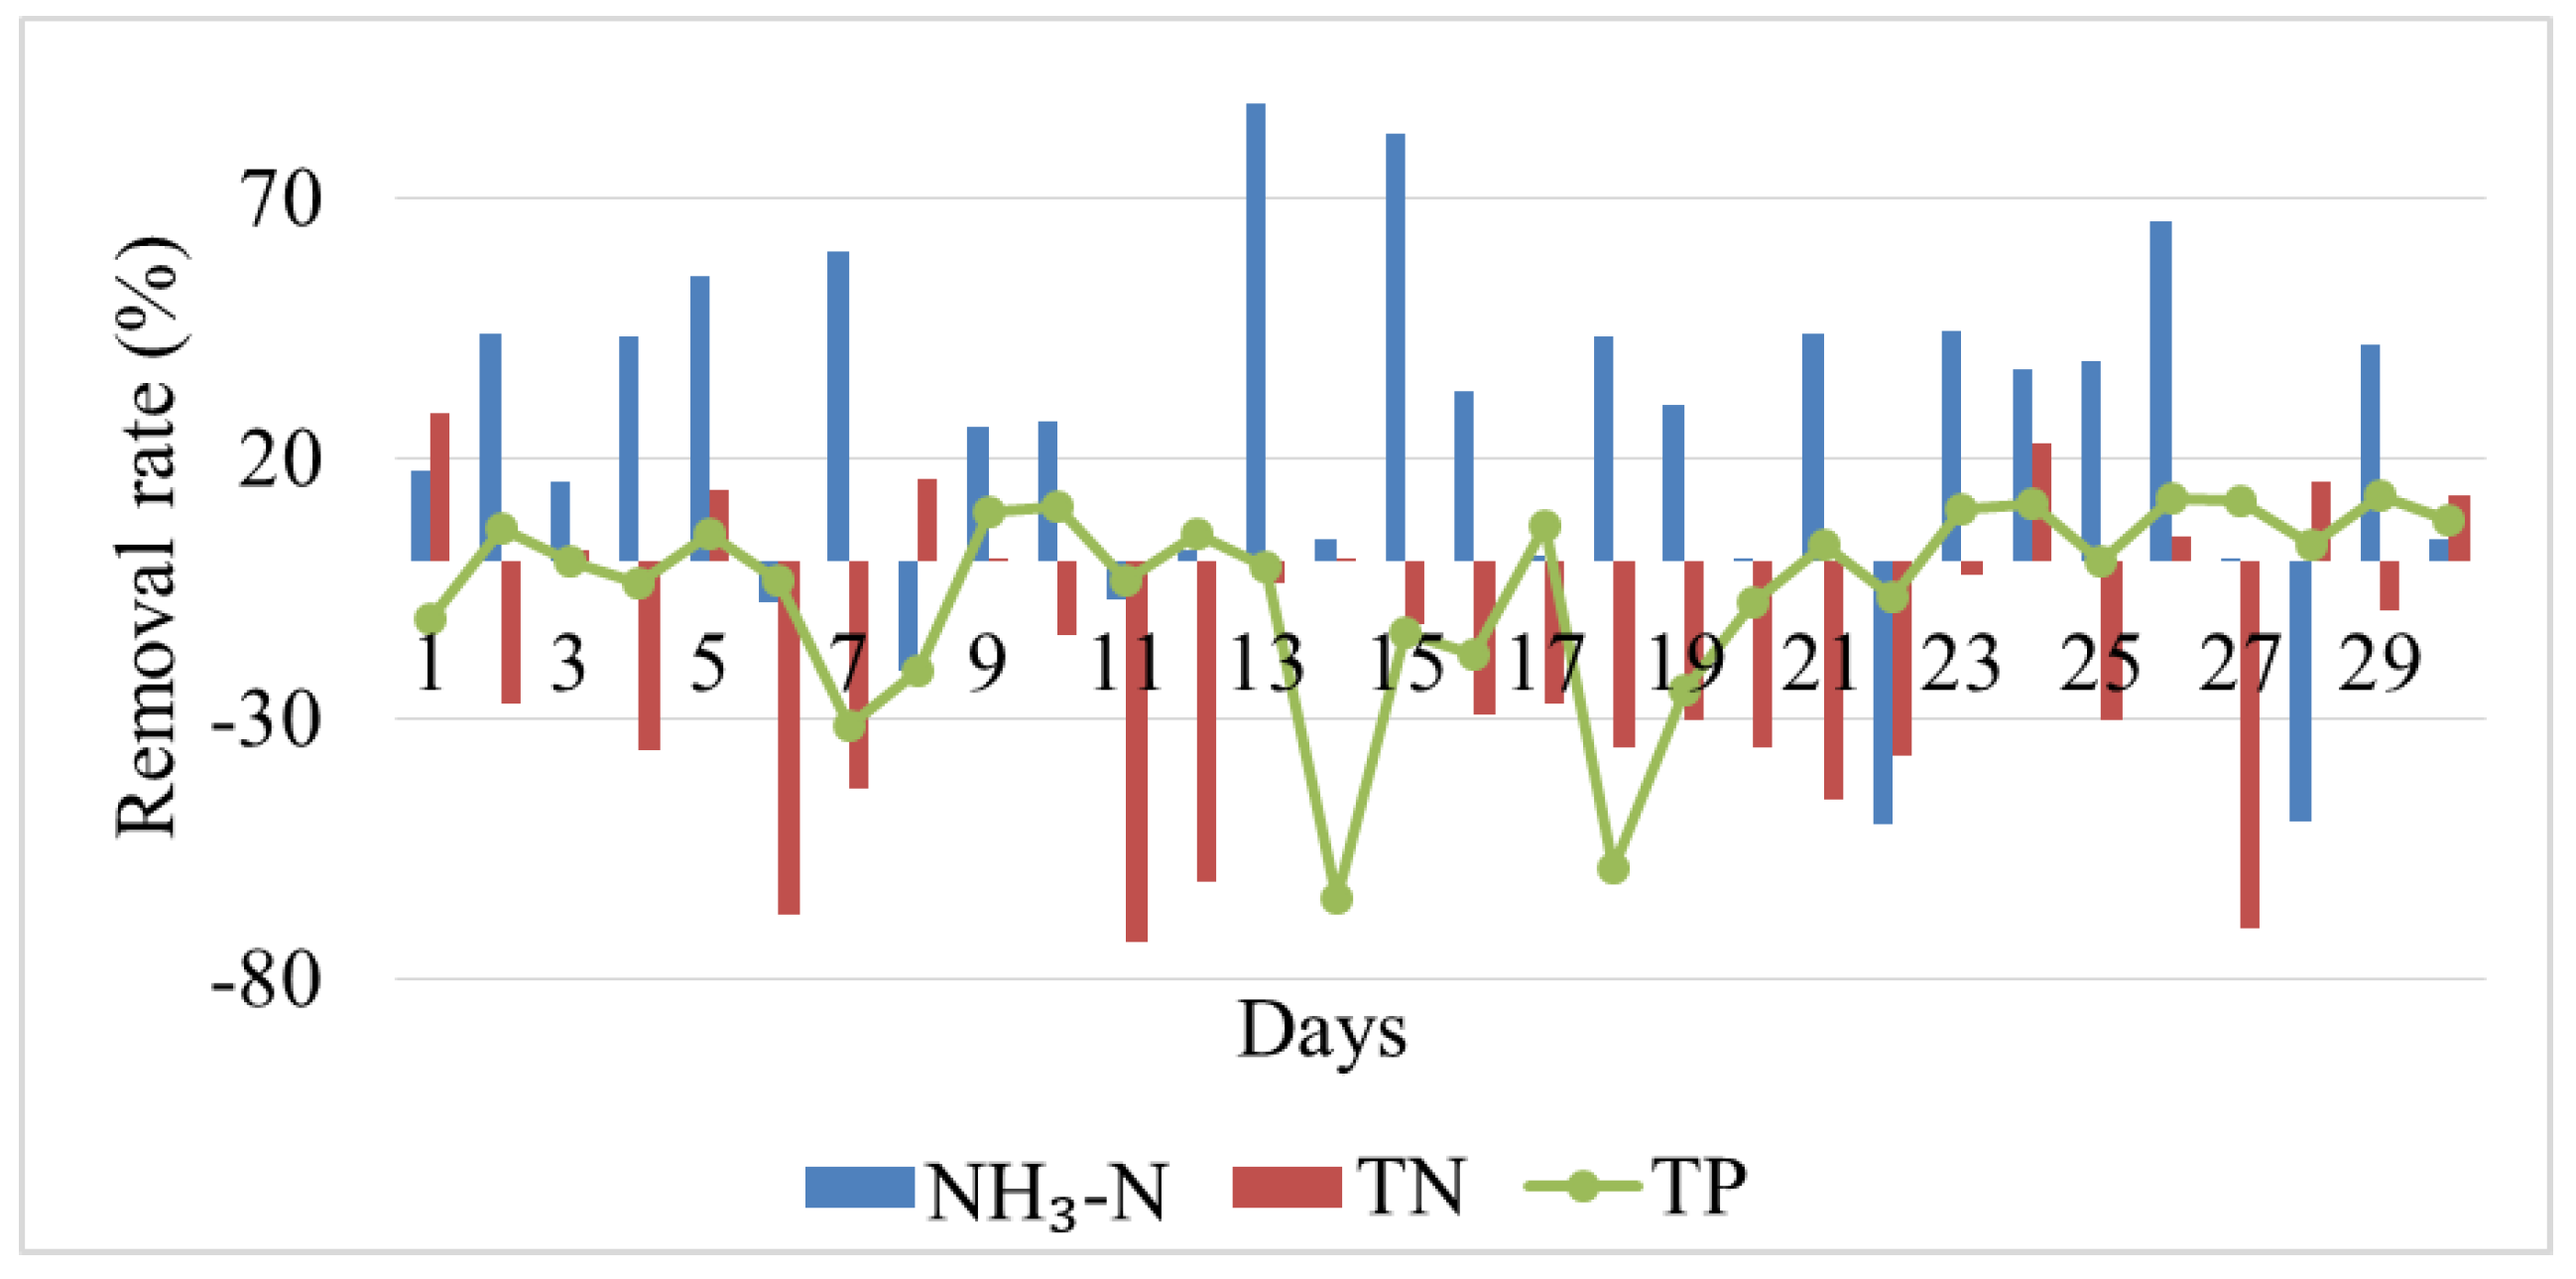
Figure 4 shows that the removal rates of NH3-N, TP, and TN fluctuated violently during ozonation. The maximum removal rates of NH3-N, TP, and TN were 87.99%, 28.65%, and 12.86%, respectively, whereas their minimum rates were −50.39%, −72.73%, and −64.40%, respectively. On the one hand, during the reaction between ozone and wastewater, either ozone oxidized some NH3-N into NO2-N [40], or the supply of ozone formed bubbles that drove NH3-N spillover in the form of NH3. On the other hand, ozone degraded some organic nitrides in wastewater into NH3-N through oxidation [41]. The production of NH3-N was accelerated when a high content of organic nitrides formed in the wastewater, thus increasing the concentration of NH3-N in wastewater. Therefore, the removal rate of NH3-N was negative. The removal rate of TN fluctuated for two reasons. On the one hand, some organic nitrogen particles were oxidized into inorganic nitrogen or entered into liquid phase or spillover in the form of N2/NH3 [42]. On the other hand, some byproducts (e.g., NO2) were produced during ozone preparation and were then dissolved in the wastewater [43,44]. Nevertheless, only a small proportion of NO2 was produced during ozone oxidation [43]. The removal rates of NH3-N and TN were mainly positive and negative, respectively. This finding indicates that the organic nitrogen in wastewater slowly oxidized into N2/NH3. Fluctuation of TP content in wastewater could be mainly interpreted from the following two aspects. First, soluble inorganic phosphorus that mainly exist in PO43− combined with metal ions (e.g., Ca2+, Mg2+, and Fe3+) and then formed sediments. Second, parts of macromolecular organic matter in wastewater were degraded into soluble phosphorus through ozonation [45].
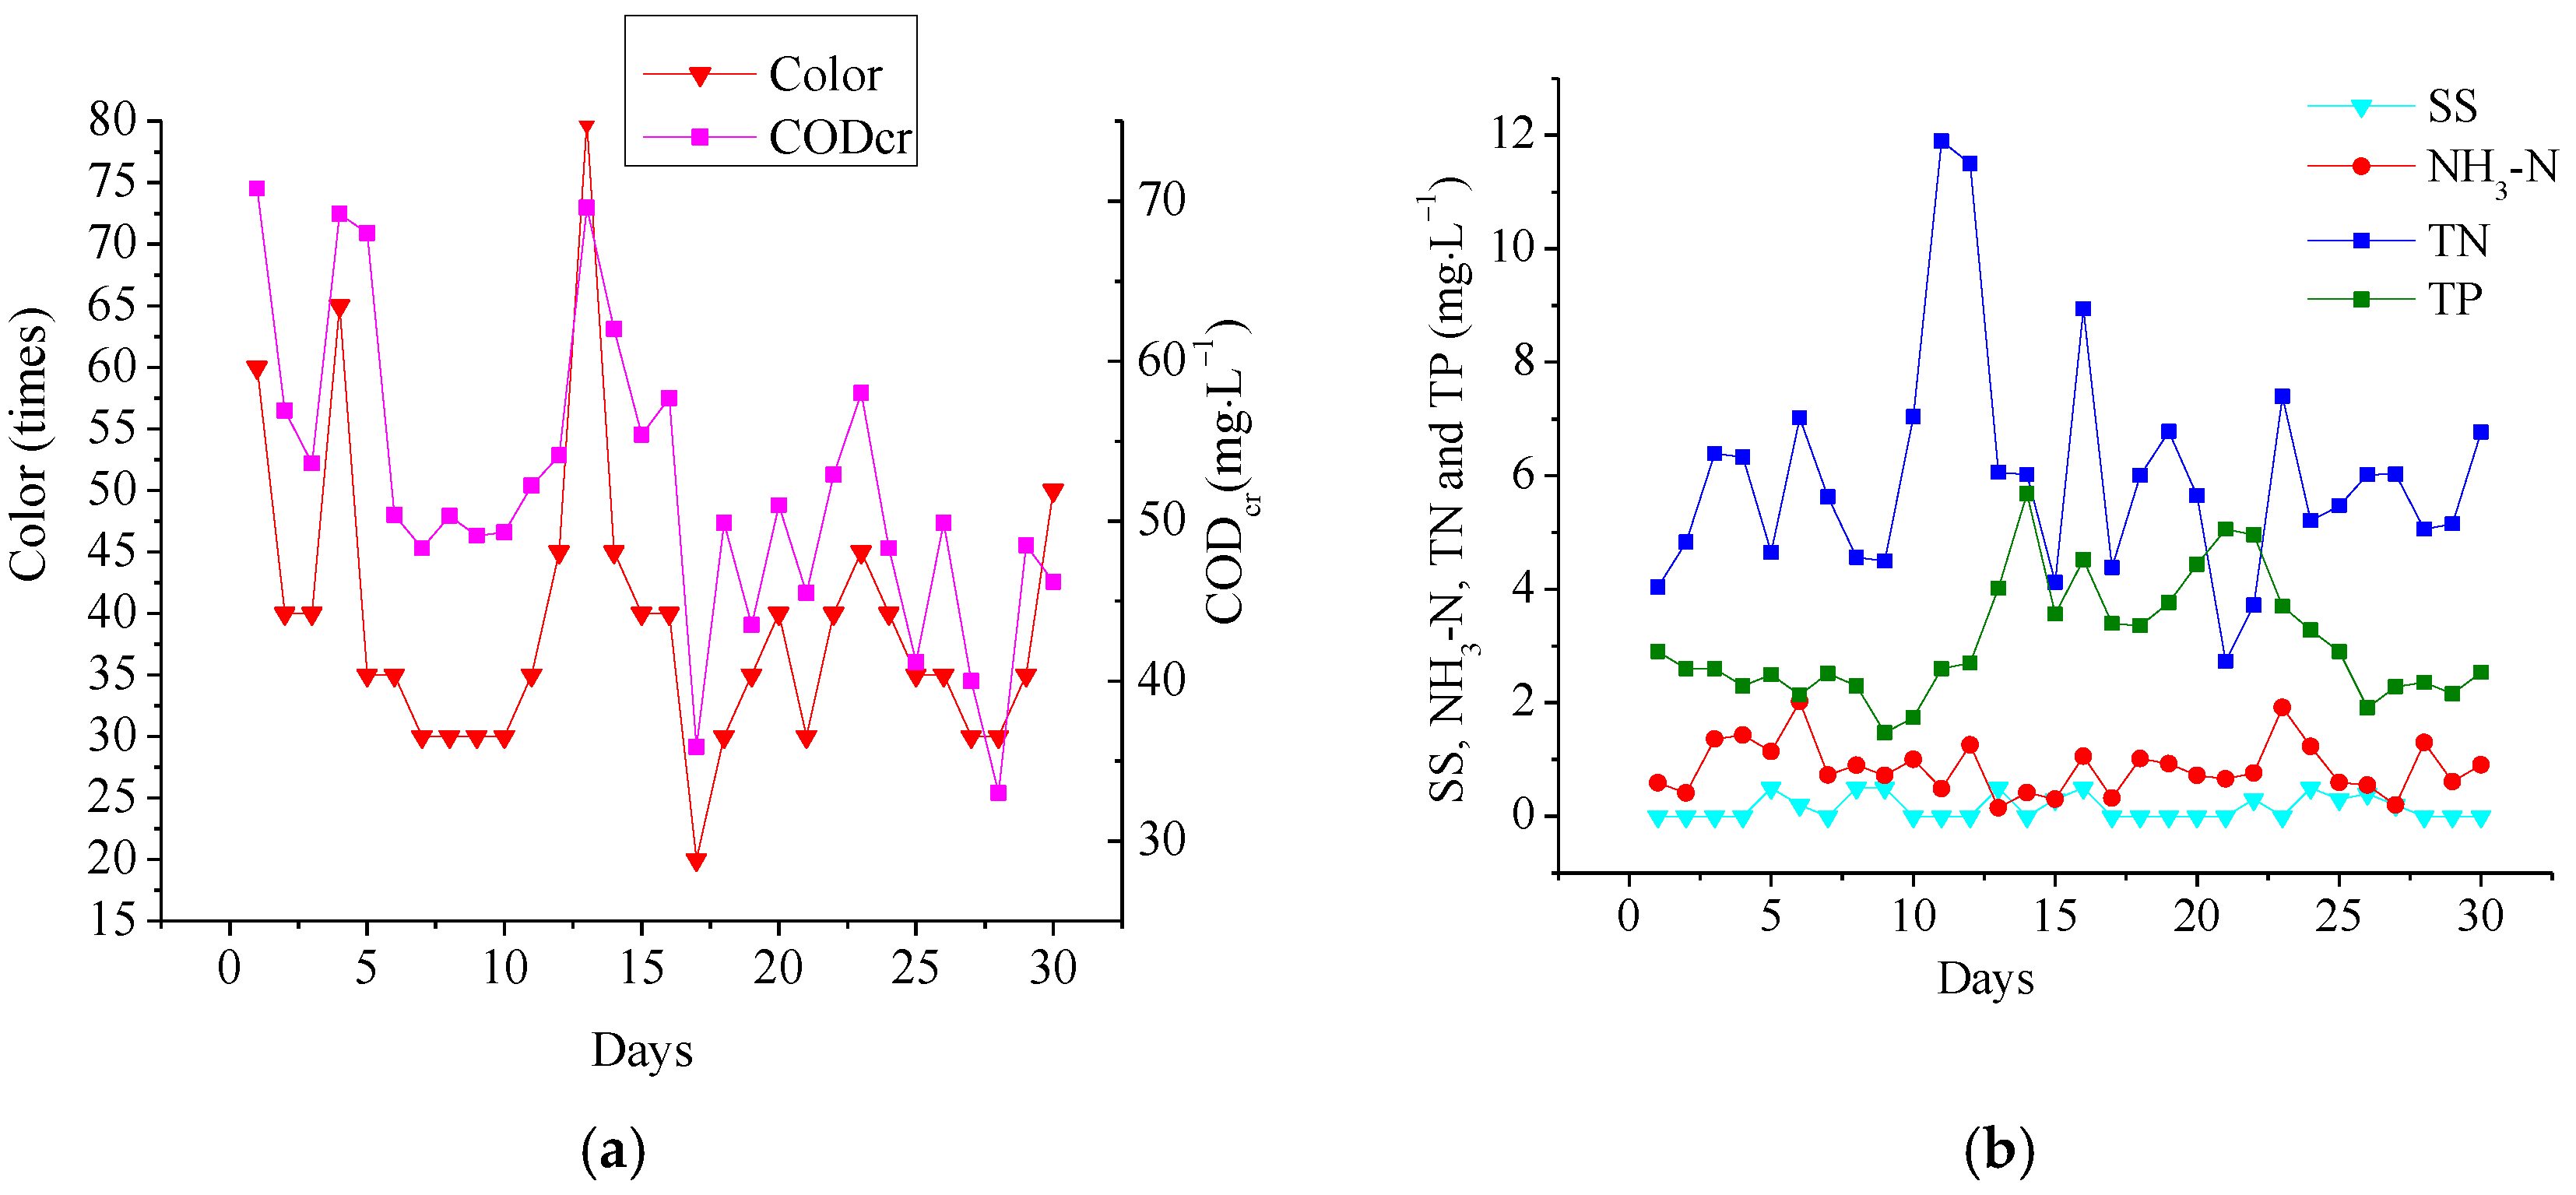
Figure 5 shows that after all the treatments, the value of the wastewater attained 33–70.8 mg·L−1 CODcr (average of 52.02 mg·L−1), 20–80 times color (average of 39 times), 0.15–2.02 mg·L−1 NH3-N (average of 0.86 mg·L−1), 0–0.5 mg·L−1 SS (average of 0.16 mg·L−1), 2.73–11.9 mg·L−1 TN (average of 6.00 mg·L−1), and 1.47–5.68 mg·L−1 TP (average of 3.08 mg·L−1).
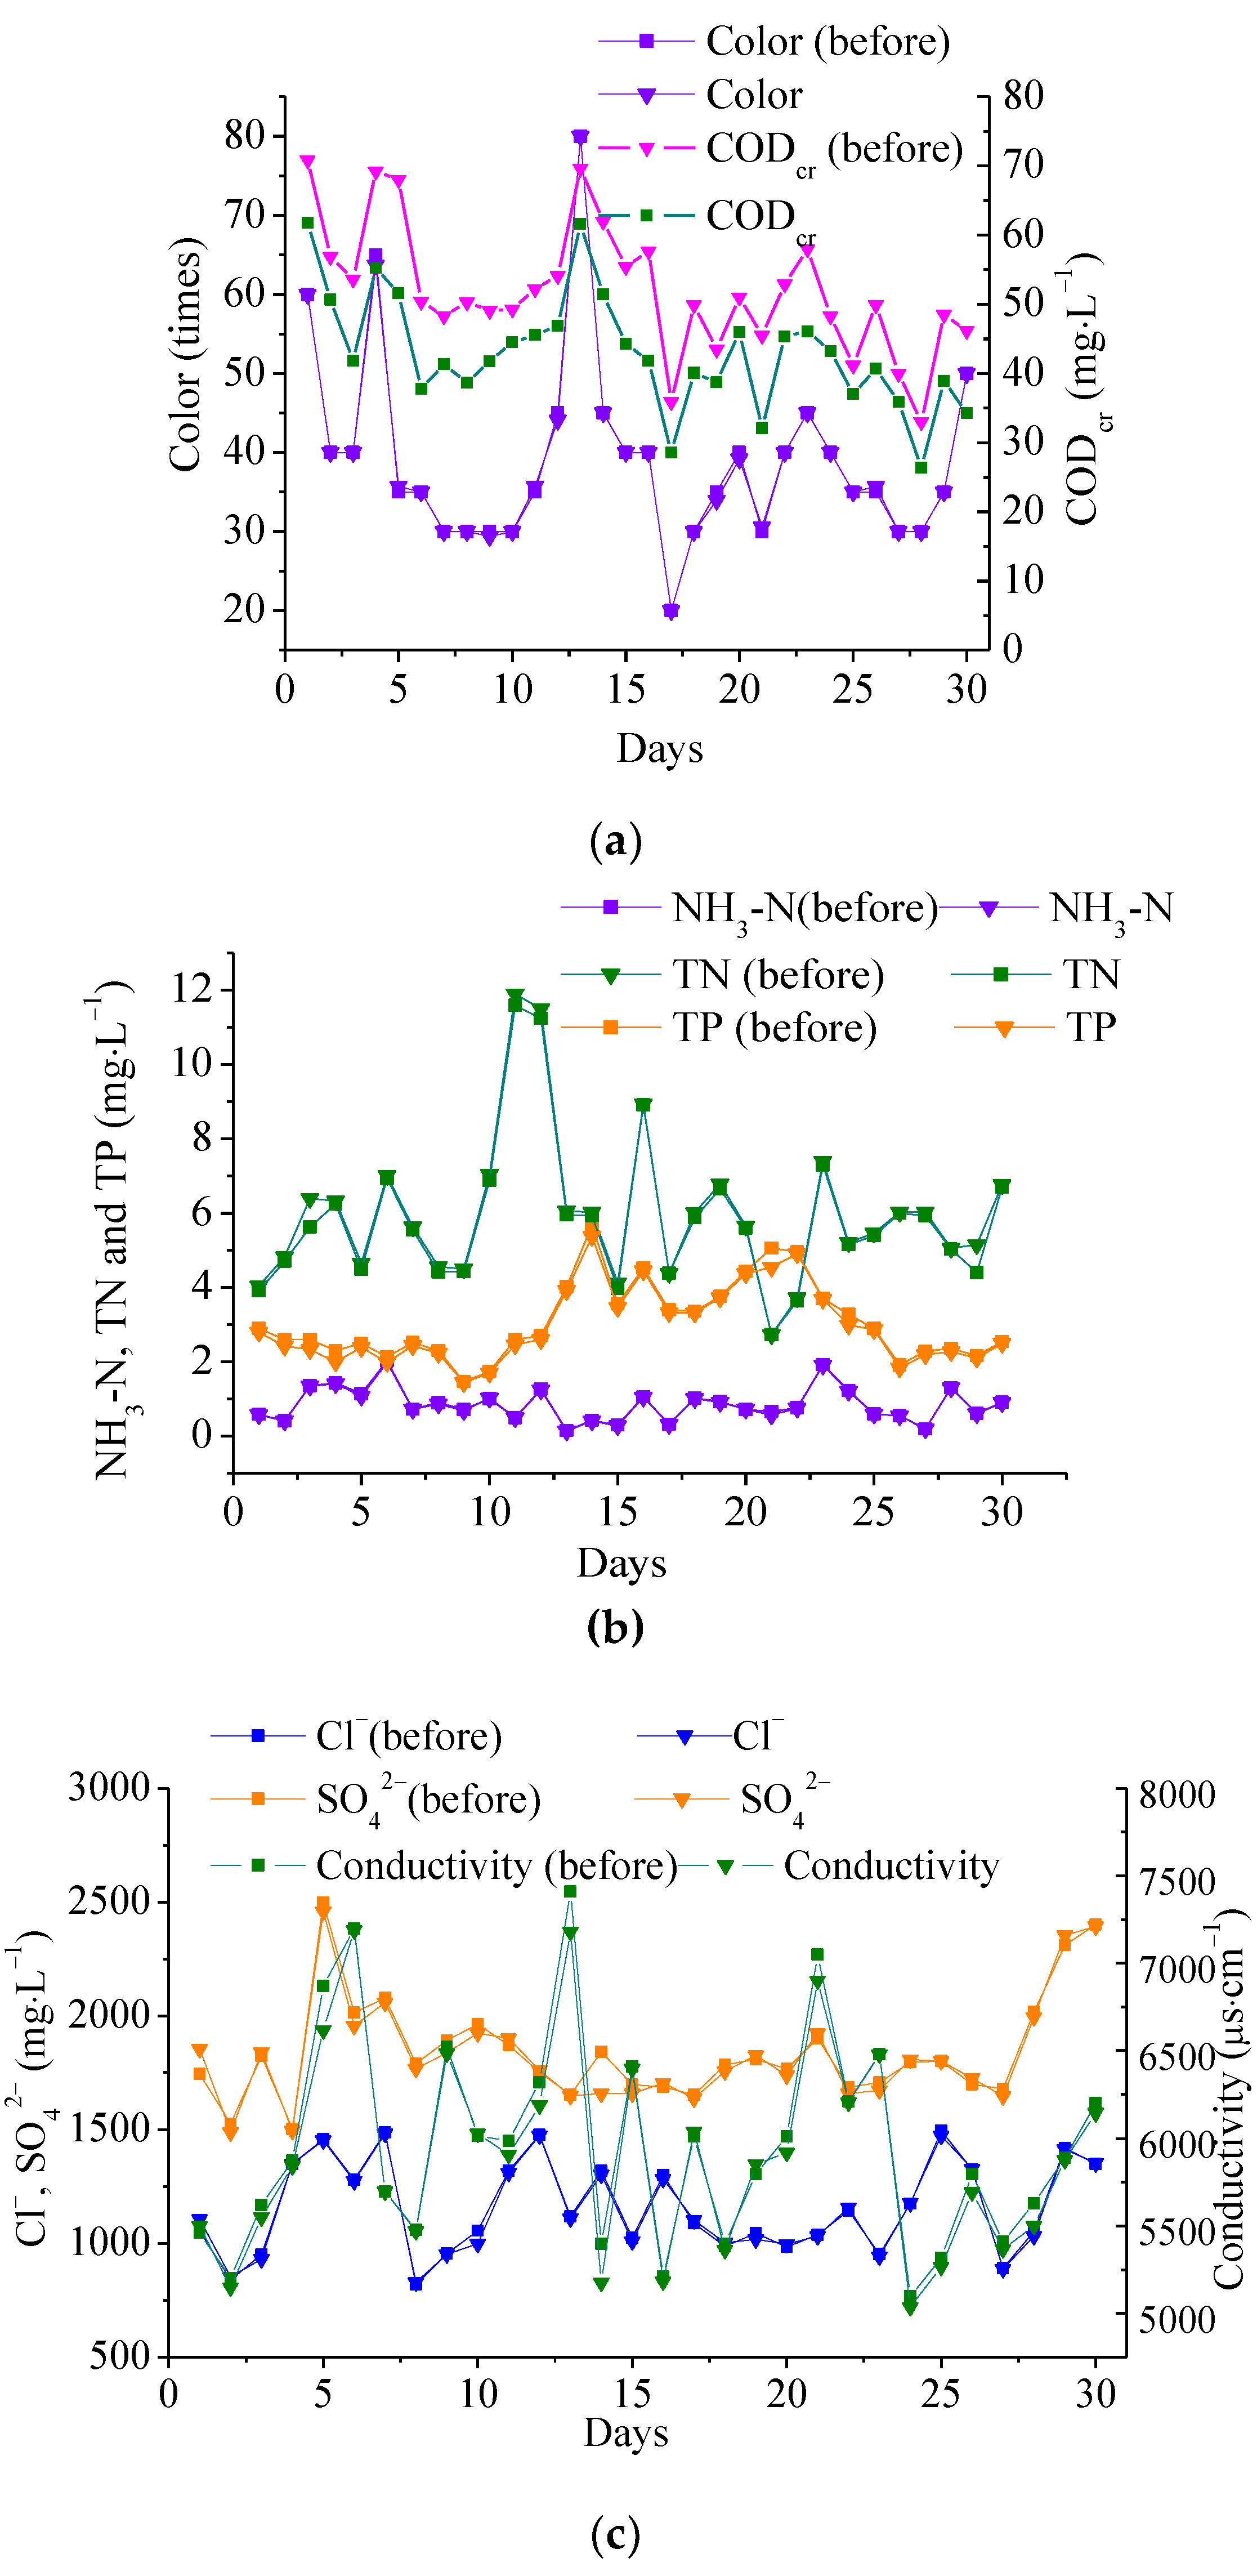
UF retains suspended particles and macromolecules. The major constituents of effluent organic matter are biopolymers, mainly soluble microbial products [46]. Therefore, UF can eliminate CODcr and TP to some extent but performs poorly in removing color, ammonia nitrogen, and TN [24] (Figure 6a,b). UF could effectively reduce turbidity but hardly influence hardness, total alkalinity, Cl−, SO42−, and conductivity (Figure 6c,d). After UF treatment, the respective removal rates of CODcr, TP, and turbidity were 17.34 ± 5.86%, 4.03 ± 3.13%, and 52.18 ± 18.07% (Figure 7), which were lower than previously described [24]. This finding reflected that the contents of suspended matter and macromolecular organics in wastewater might be relatively low after sand filtration + ozonation + sand filtration.
The primary RO pressure was controlled between 1.0–1.2 MPa to protect stable water yield. Pressure gradually increased upon the blockage of the RO membrane by dirt. Water yield and desalinization rate of primary RO treatment slightly changed with the increase in inlet pressure (Table 2). The average removal rates of CODcr, color, TP, Cl−, SO42−, and conductivity in the primary RO were 99.17 ± 0.88%, 99.11 ± 1.60%, 98.09 ± 1.55%, 92.02 ± 1.87%, 99.17 ± 0.81%, and 92.94 ± 2.49%, respectively. The average removal rates of total alkalinity, NH3-N, TN, hardness, and turbidity were 87.74 ± 2.64%, 91.39 ± 2.45%, 85.07 ± 6.69%, 82.83 ± 5.19%, and 76.98 ± 5.46%, respectively (Figure 8). The removal rate of conductivity was lower than that previously described [47], which might have occurred because an old RO membrane was used in the primary RO system. This RO membrane had been used for 2 years. Contents of different pollutants in effluent of primary RO treatment are shown in Table 3. CODcr, BOD5, SS, color, Fe3+, and Cu2+ were generally undetectable in RO effluent. All water quality indexes of RO effluent satisfied the reuse standards of recycled water. CODcr, color, NH3-N, hardness, Cl−, SO42−, turbidity, and contents of Fe3+ and Cu2+ all satisfied the standards of domestic drinking water.
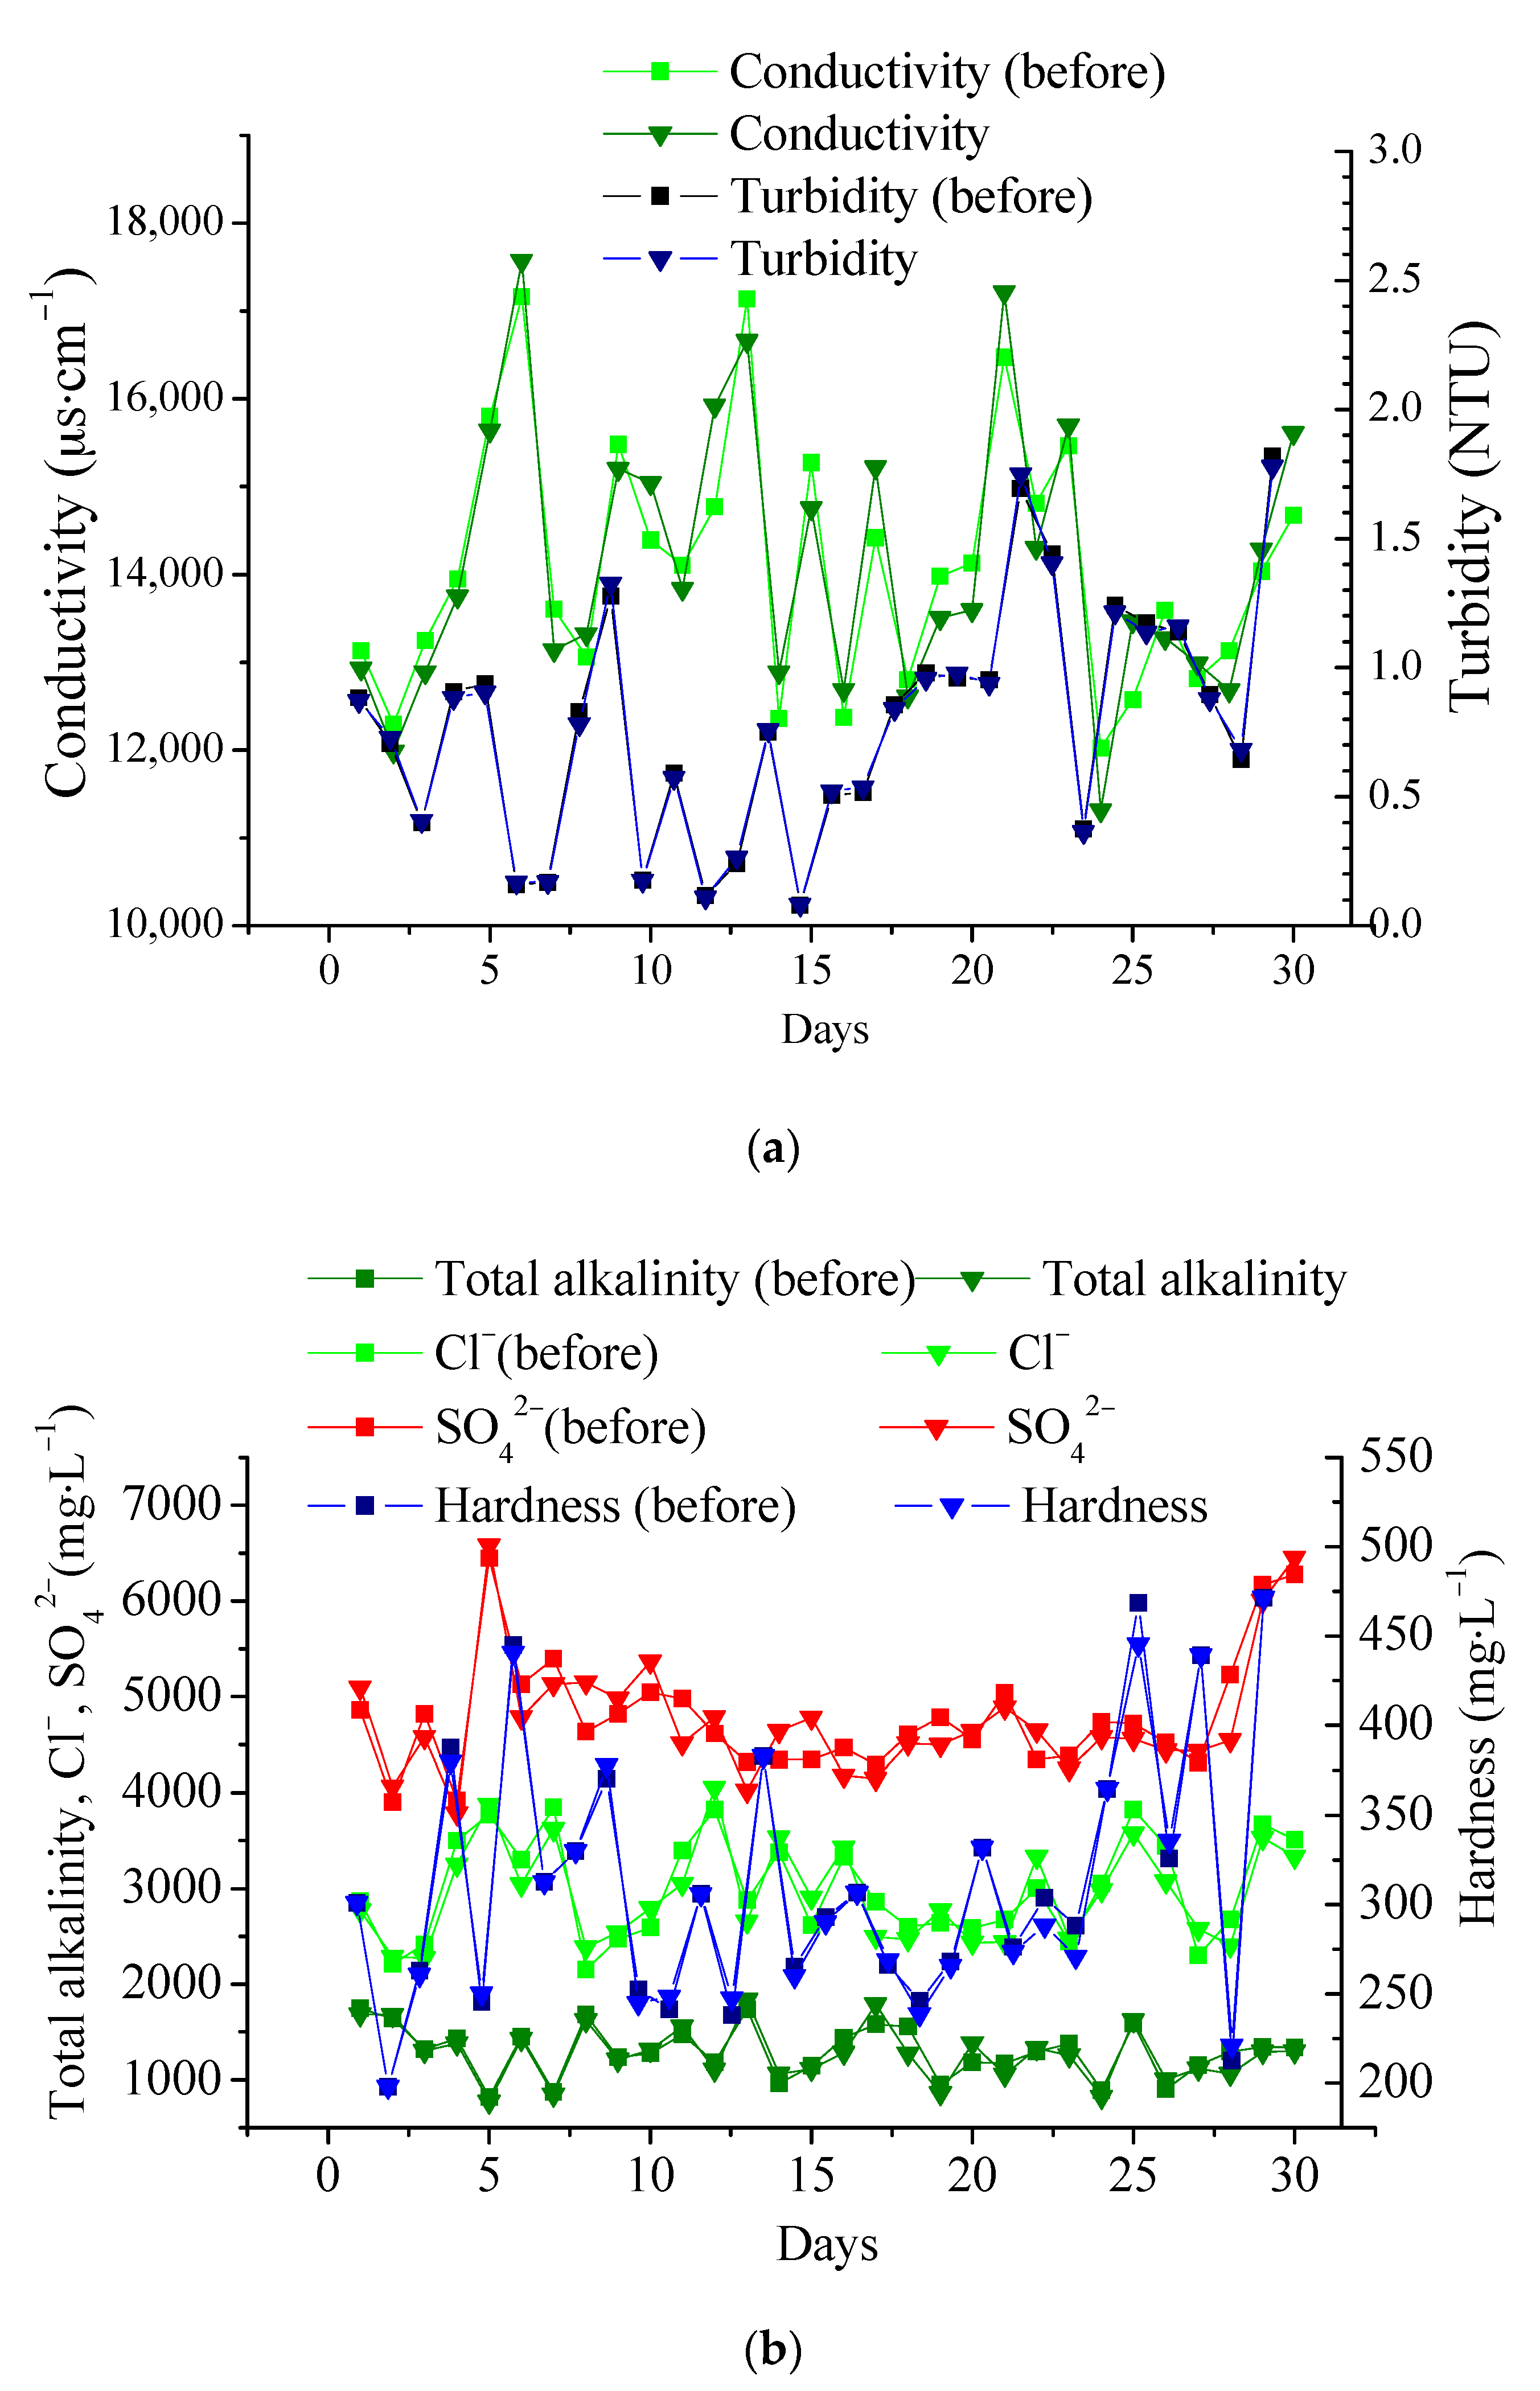
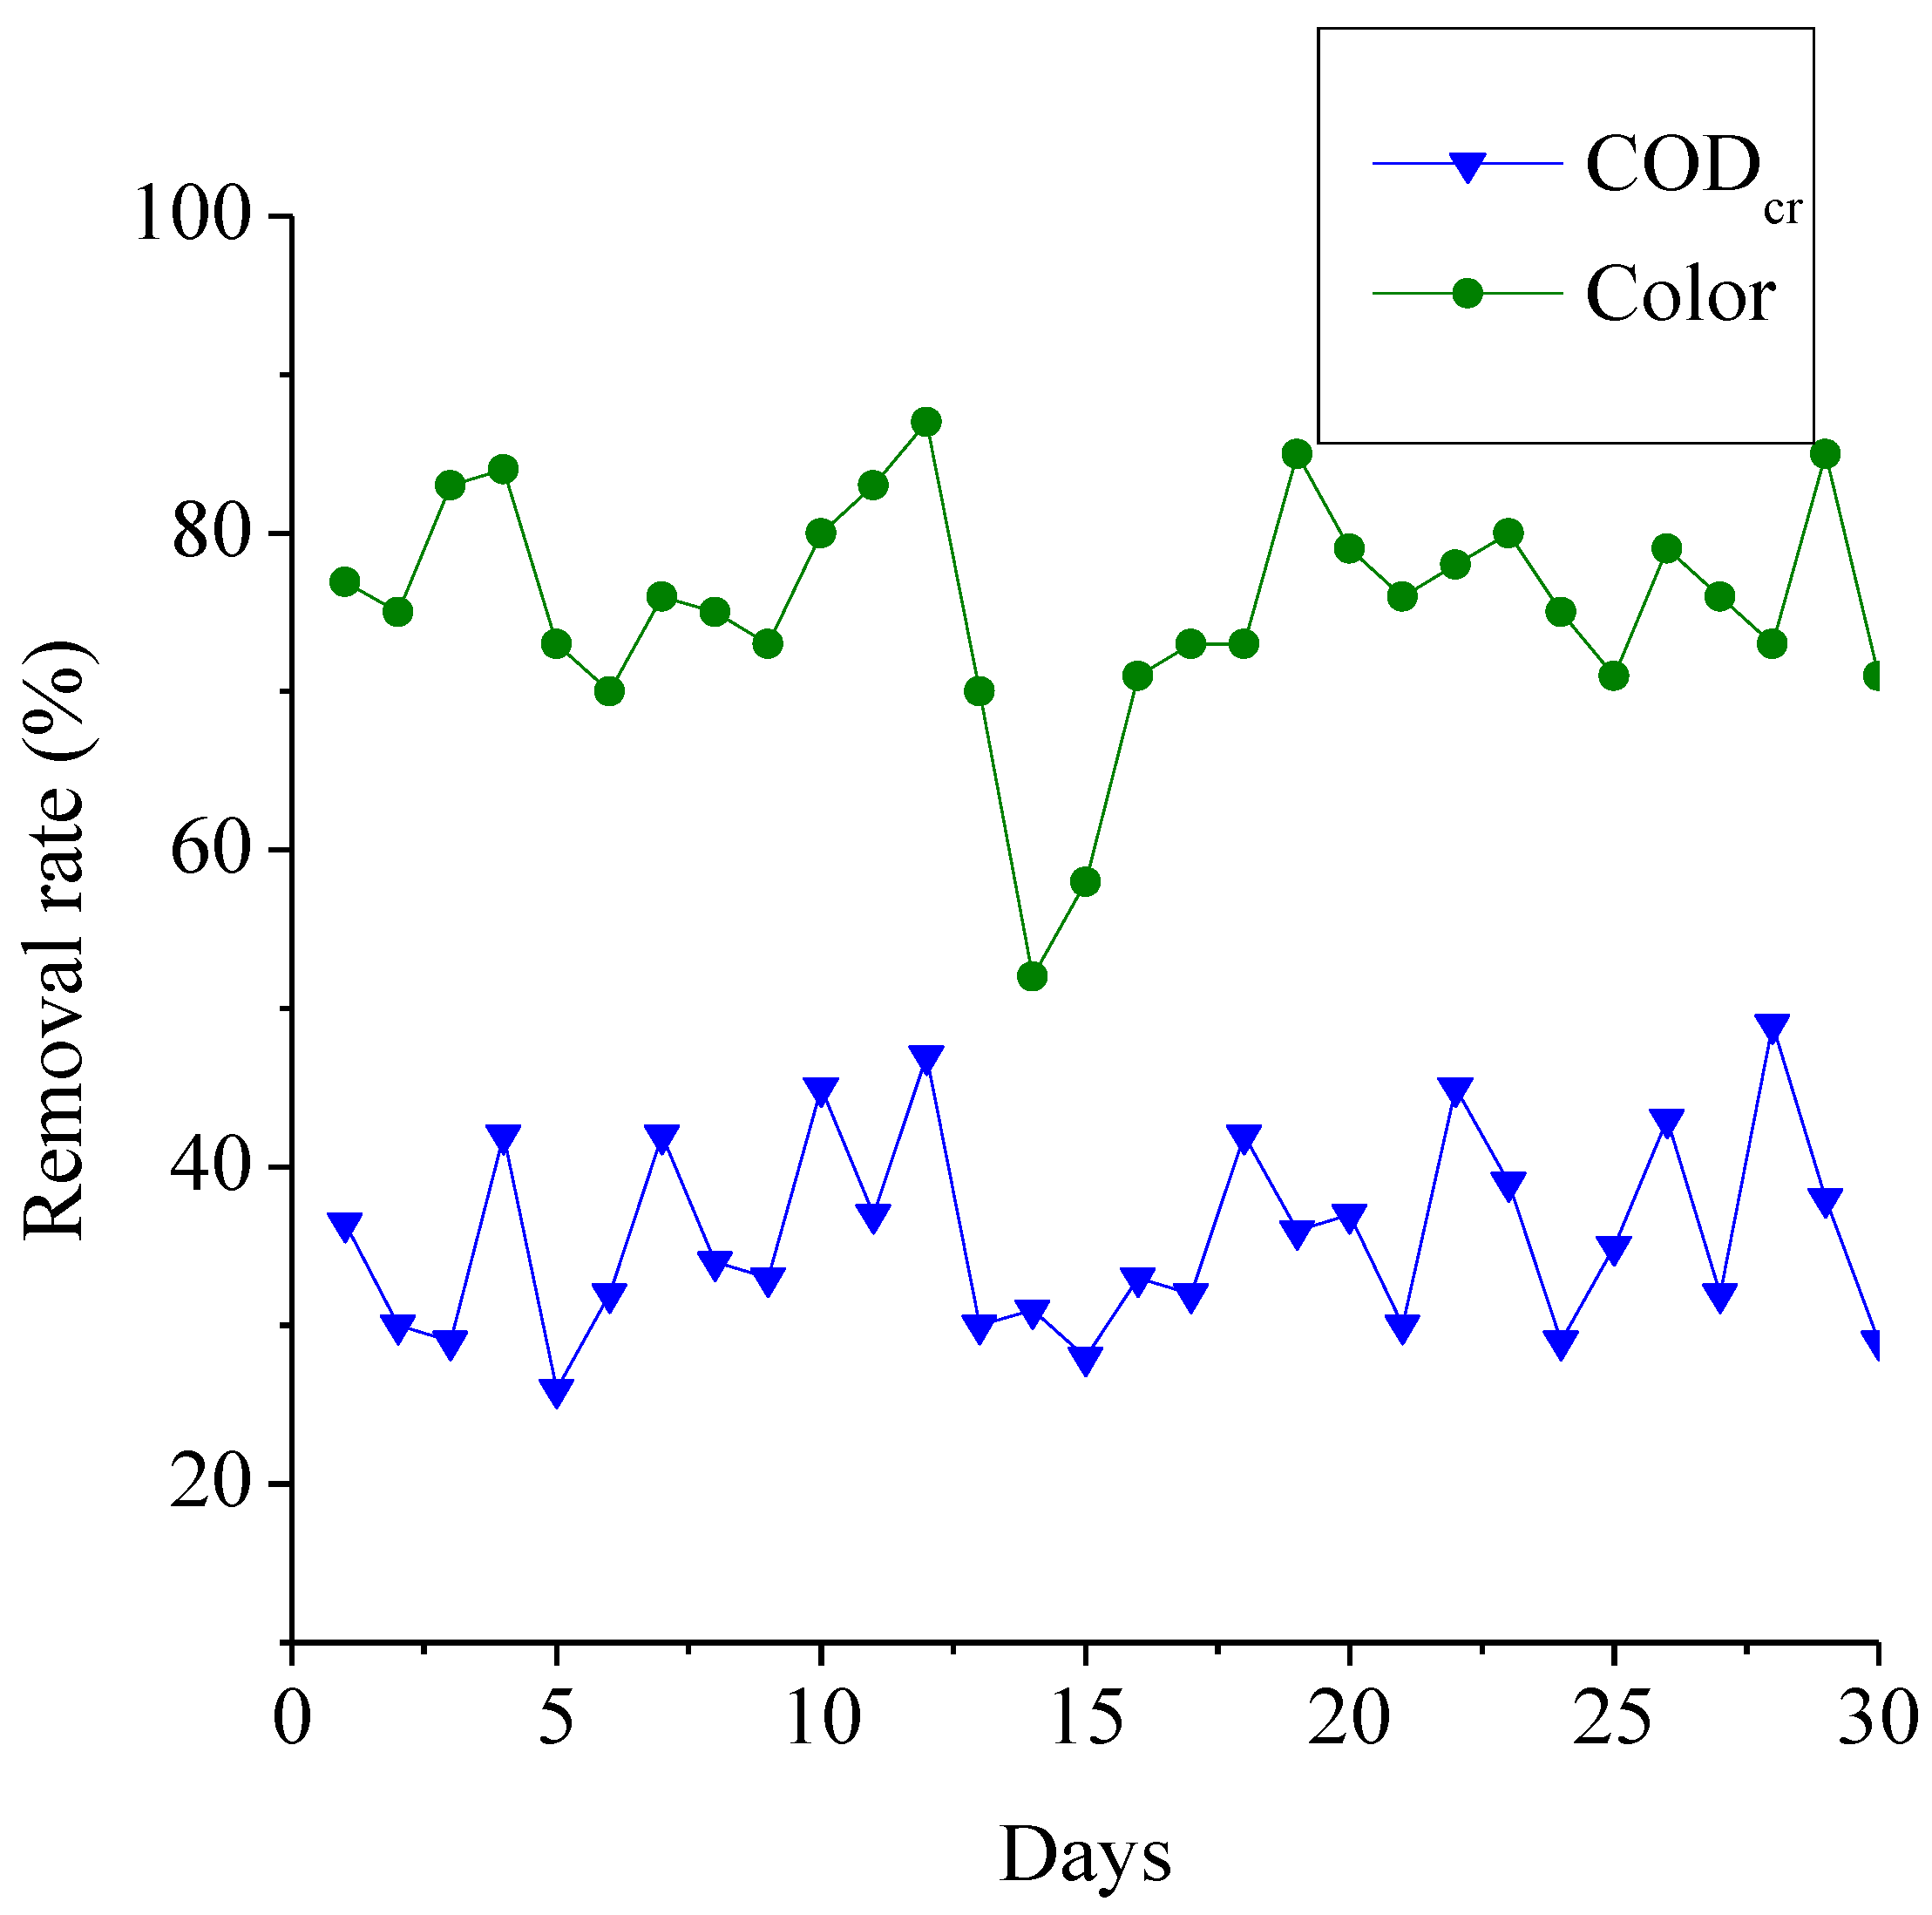
To further increase the reuse rate of recycled water, we continuously purified the RO-concentrated water. Given the high contents of pollutants (CODcr and color) in the RO-concentrated water, ozone dosage was adjusted to approximately 118 g·m−3 of wastewater to relieve membrane blockage in the future. Contents of pollutants fluctuated slightly before and after ozone was added, indicating that ozone could hardly affect hardness, total alkalinity, Cl−, SO42−, and conductivity (Figure 9). The removal rates of CODcr and color were higher than those in the primary ozone aeration tank. The average removal rates of CODcr and color in the secondary ozone aeration tank were 35.72 ± 6.26% and 75.36 ± 7.39%, respectively (Figure 10). The removal rates of COD and color in the primary and secondary ozone aeration tanks were all lower than those of electrocoagulation-O3 process, during which the ozone dose was 280 g·m−3 and the color removal rate was close to 100% [48].
RO concentration water was further treated by sand filtration, UF, and RO after ozonation. Given that the conductivity of RO concentrated water was very high (average of 28,236 μs·cm−1, Figure 10), inlet pressure of the secondary RO system was 1.5 MPa. The average removal rates of pollutants are shown in Figure 11. The average removal rates of CODcr, color, NH3-N, TN, TP, hardness, total alkalinity, Cl−, SO42−, conductivity, and turbidity were 99.41 ± 0.63%, 99.01 ± 1.65%, 93.52 ± 2.08%, 89.11 ± 4.95%, 99.00 ± 0.79%, 98.89 ± 1.18%, 94.77 ± 2.64%, 96.34 ± 1.29%, 99.48 ± 0.41%, 97.99 ± 1.31%, and 90.17 ± 4.41%, respectively. Contents of different pollutants in effluent of the second RO treatment are listed in Table 4. Although conductivity, total alkalinity, hardness, and contents of Cl− and SO42− in inflow were relatively high, the water quality indexes of the secondary RO effluent were no poorer than those of the primary RO effluent due to the use of a new RO membrane and high inlet pressure. Water quality indexes of the secondary RO effluent all satisfied the reuse standards of recycled water. Color, CODcr, hardness, and contents of Cl− and SO42− all satisfied the standards of domestic drinking water.
3.2. Overall Efficiency
The combined processes showed good performance in water reuse treatment. After treatment, the overall standard rates of the CODcr, color, NH3-N, hardness, Cl−, SO42−, turbidity, Fe3+, and Cu2+ were −0.88, −0.98, −0.86, −0.95, −0.63, −0.94, −1 and −1, respectively, for the output water of the primary RO system and −0.85, −0.98, −0.88, −0.99, −0.57, −0.90, −0.91, −1, and −1, respectively, for the output water of the second RO system compared with the drinking water standard. The overall removal rate of CODcr, color, NH3-N, TN, TP, hardness, total alkalinity, Cl−, SO42−, conductivity, and turbidity reached 99.57%, 99.79%, 94.65%, 84.53%, 98.36%, 82.54%, 87.68%, 92.05%, 99.17%, 93.03%, and 93.18%, respectively, for the primary water reuse system and 99.62%, 99.75%, 94.75%, 88.26%, 99.12%, 98.90%, 94.83%, 96.40%, 99.48%, 97.95%, and 88.64%, respectively, for the second water reuse system (Table 5). The RO system achieved the highest removal rate of pollutants. However, color was decreased dramatically during ozonation (92.59 and 97.27 times). The removal rate of the conductivity with new RO membranes was higher than those during UF-electrodialysis process [22] and UF ceramic membrane [21], and close to that during UF–diafiltration process [19].
3.3. Energy and Chemicals Costs
Data on energy and chemicals costs for the water reuse treatment at a flow rate of 7.5 × 10⁴ m3·d−1 (working time 24 h day−1) are summarized in this section. Water yields in the primary RO system and secondary RO system were 50,250 and 14,850 m3·d−1, respectively. The reuse rate of recycled water in the whole system was 86.8%, higher than that during forward osmosis (FO)-RO system by 31.8% [49].
For the primary ozone reaction tank, ~90 g O3·m−3 wastewater was consumed on average, whereas approximately 118 g O3·m−3 wastewater was consumed for the second ozone reaction tank. The electricity consumption of the ozone and oxygen production was 12 kWh·kg−1 O3 power [3]. Thus, an operating cost of approximately 0.11 USD·m−3 wastewater (approximately 8100 USD·d−1 for 7.5 × 10⁴ m3·d−1 wastewater) was calculated for a power price of 0.1 USD·kWh−1 for the primary zone reaction tank and 0.14 USD·m−3 wastewater (approximately 3505 USD·d−1 for 24,750 m3·d−1 wastewater) for the second ozone reaction. Powers of inlet pumps in the primary UF and primary RO system were 340 kW and 2155 kW, respectively. The total power consumption of primary self-cleaning filter, sand filter, UF, and RO backwash pump was approximately 17 kW. Then, the power consumption of the pumps in the primary water reuse system was 60,288 kWh·d−1, and the electricity cost of the pumps in the primary water reuse system was 6029 USD·d−1. The total electricity cost in the primary water reuse system was 14,129 USD·d−1. The power consumptions of inlet pumps in the secondary UF and secondary RO system were 110 and 770 kW, respectively. The total power consumption of secondary self-cleaning filter, sand filter, UF, and RO backwash pump was approximately 11 kW. Then, the power consumption of the pumps in the second water reuse system was 21,384 kWh·d−1, and the electricity cost of the pumps in the second water reuse system was 2138 USD·d−1. The total electricity cost in the second water reuse system was 5643 USD·d−1.
The PAC dosage was approximately 80 g·m−3 of wastewater and thus the PAC cost was approximately 644 USD·d−1. The number of RO membrane and UF membrane were 5280 and 1224, respectively, and the prices of them were 500 and 2167 USD, respectively. So the costs of UF and RO membranes replacement were 53.04 × 10⁴ and 88 × 104 USD·a−1. The number of workers in the sewage plant were 50, and the annual salary was 25,000 USD·person−1. So the employee cost was 125 × 104 USD·a−1. The Machine maintenance cost was approximately 21.91 × 10⁴ USD·a−1. The cost of the agentia and the filter-bag were 11.42 × 10⁴ and 3.96 × 10⁴ USD·a−1, respectively.
The total operating cost of treating textile wastewater is displayed in Table 6, reaching 0.44 USD·m−3 reuse water, wherein the cost of the ozone production was 0.18 USD·m−3 (40%), that of sand filtration, UF and RO system was 0.19 USD·m−3 (43%), and that of machine maintenance, employee cost, agentia, and PAC was 0.08 USD·m−3 (17%) (Figure 12). In the filtering system, RO claimed the highest cost (0.14 USD·m−3 reuse water), followed by UF (0.04 USD·m−3). In RO system, the electricity cost and membrane cost were 0.11 and 0.04 USD·m−3, respectively. The operating cost of secondary reuse system was approximately 0.086 USD·m−3 higher than that in the primary system, which was caused by the increased ozone dosage and operating pressure of RO. Based on the above analysis, the electricity cost for ozonation and RO treatment accounted for 64.84% of the total cost. Therefore, the key to reducing the operating cost for reuse of recycled water is decreasing the electricity consumption in ozonation and RO. The operating cost of the proposed sequential system in this research was lower than that of FO-RO system in literature [49] by 0.06 USD·m−3 reuse water. It was also much lower than that of electrocoagulation-O3 process, which was 5.80 USD·m−3 treated wastewater [48].
4. Conclusions
A combined two-stage water reuse treatment was developed to obtain quality water for reuse in industrial processes. The elimination effect and operation cost of the combined two-stage water reuse treatment were investigated.
SS is mainly eliminated in the sand filtration process. Ozone can thoroughly eliminate color. The removal rates of the primary and secondary ozone aeration tanks were 69.4 ± 6.98% and 75.36 ± 7.39%, respectively. The removal rate of color is proportional to ozone dosage. UF mainly eliminates CODcr, TP, and turbidity. RO treatment shows the highest removal rate. The removal rates of CODcr, color, and SO42− by RO treatment were higher than 99%. The removal rate of the secondary reuse system of recycled water is higher than that of the primary system due to the high ozone dosage and usage of a new RO membrane.
The proposed sequential system is extremely effective. Effluents of the primary and secondary recycled water processing systems satisfy the reuse standards of recycled water. CODcr, color, NH3-N, hardness, Cl−, SO42−, turbidity, Fe3+, and Cu2+ satisfy the standards of domestic drinking water. The removal rate of the conductivity with new RO membrane was higher than those during UF-electrodialysis process and UF ceramic membrane, and close to that during UF–diafiltration process. The reuse rate of recycled water in the whole system was 86.8%, higher than that during FO-RO system by 31.8%.
The total operating cost of treating textile wastewater reached 0.44 USD m−3 reuse water, wherein the cost of sand filtration, UF and RO system was maximum (approximately 0.19 USD·m−3), followed by that of the ozone production (approximately 0.18 USD·m−3). In the filtration system, RO claimed the highest cost (0.14 USD·m−3 reuse water), followed by UF (0.04 USD·m−3). In RO system, the electricity cost and membrane cost were 0.11 and 0.04 USD·m−3, respectively. The operating cost of secondary reuse system was approximately 0.086 USD·m−3 higher than that of the primary system. Electricity cost for ozonation and RO treatment accounted for 64.84% of the total cost.
The operating cost of the proposed sequential system in this research was lower than that of FO-RO system by 0.06 USD·m−3 reuse water. Although the color removal rate of the electrocoagulation-O3 process was close to 100%, the operating cost of it was much higher than that in this research, 5.80 USD·m−3 treated wastewater.
Author Contributions
Conceptualization, H.Y. and H.G.; Writing—Original Draft Preparation, H.Y., P.Q., Y.Q., Z.K., X.Z., and Z.T.; Writing—Review and Editing, H.Y. and H.G.
Funding
The authors would like to acknowledge the financial support of the Natural Science Foundation of Guangdong (No. 2018A030310084).
Conflicts of Interest
The authors declare no conflict of interest.
Abbreviations
| Ei | over standard rate for ith parameter |
| Ci | monitoring value of ith parameter, (mg·L−1, times, μs·cm−1, NTU) |
| Si | standard value for ith parameter, (mg·L−1, times, μs·cm−1, NTU) |
| Ci,in, Ci,out | inlet and outlet concentration, (mg·L−1, times, μs·cm−1, NTU) |
| cos t | unit operating cost of the reuse water, (USD·m−3) |
| TOC | total operating cost, (USD·d−1) |
| P | output of reuse water, (m3·d−1) |
References
- Amar, N.B.; Kechaou, N.; Palmeri, J.; Deratani, A.; Sghaier, A. Comparison of tertiary treatment by nanofiltration and reverse osmosis for water reuse in denim textile industry. J. Hazard. Mater. 2009, 170, 111–117. [Google Scholar] [CrossRef] [PubMed]
- Wang, R.; Jin, X.; Wang, Z.; Gu, W.; Wei, Z.; Huang, Y.; Qiu, Z.; Jin, P. A multilevel reuse system with source separation process for printing and dyeing wastewater treatment: A case study. Bioresour. Technol. 2018, 247, 1233–1241. [Google Scholar] [CrossRef] [PubMed]
- Yin, H.; Guo, H.; Qiu, P.; Yi, L.; Li, J. Case analysis on textile wastewater subjected to combined physicochemical–biological treatment and ozonation. Desalin. Water Treat. 2017, 66, 140–148. [Google Scholar] [CrossRef]
- Munagapati, V.S.; Kim, D.S. Adsorption of anionic azo dye Congo Red from aqueous solution by Cationic Modified Orange Peel Powder. J. Mol. Liq. 2016, 220, 540–548. [Google Scholar] [CrossRef]
- Verma, A.K.; Dash, R.R.; Bhunia, P. A review on chemical coagulation/flocculation technologies for removal of colour from textile wastewaters. J. Environ. Manag. 2012, 93, 154–168. [Google Scholar] [CrossRef] [PubMed]
- Katheresan, V.; Kansedo, J.; Lau, S.Y. Efficiency of various recent wastewater dye removal methods: A review. J. Environ. Chem. Eng. 2018, 6, 4676–4697. [Google Scholar] [CrossRef]
- Paz, A.; Carballo, J.; Pérez, M.J.; Domínguez, J.M. Biological treatment of model dyes and textile wastewaters. Chemosphere 2017, 181, 168–177. [Google Scholar] [CrossRef] [PubMed]
- De, C.M.; Da, F.S.; De, T.P. Treatment of wastewater from a cotton dyeing process with UV/H2O2 using a photoreactor covered with reflective material. Water Sci.Technol. 2011, 64, 460–468. [Google Scholar]
- Punzi, M.; Anbalagan, A.; Aragão Börner, R.; Svensson, B.-M.; Jonstrup, M.; Mattiasson, B. Degradation of a textile azo dye using biological treatment followed by photo-Fenton oxidation: Evaluation of toxicity and microbial community structure. Chem. Eng. J. 2015, 270, 290–299. [Google Scholar] [CrossRef]
- Oller, I.; Malato, S.; Sánchez-Pérez, J.A. Combination of Advanced Oxidation Processes and biological treatments for wastewater decontamination—A review. Sci. Total Environ. 2011, 409, 4141–4166. [Google Scholar] [CrossRef]
- Zhu, C.; Jiang, C.; Chen, S.; Mei, R.; Wang, X.; Cao, J.; Ma, L.; Zhou, B.; Wei, Q.; Ouyang, G.; et al. Ultrasound enhanced electrochemical oxidation of Alizarin Red S on boron doped diamond (BDD) anode: Effect of degradation process parameters. Chemosphere 2018, 209, 685–695. [Google Scholar] [CrossRef] [PubMed]
- Oppong, S.O.-B.; Opoku, F.; Govender, P.P. Tuning the electronic and structural properties of Gd-TiO2-GO nanocomposites for enhancing photodegradation of IC dye: The role of Gd3+ ion. Appl. Catal. B Environ. 2019, 243, 106–120. [Google Scholar] [CrossRef]
- Musmarra, D.; Prisciandaro, M.; Capocelli, M.; Karatza, D.; Iovino, P.; Canzano, S.; Lancia, A. Degradation of ibuprofen by hydrodynamic cavitation: Reaction pathways and effect of operational parameters. Ultrason. Sonochem. 2016, 29, 76–83. [Google Scholar] [CrossRef] [PubMed]
- Iovino, P.; Chianese, S.; Canzano, S.; Prisciandaro, M.; Musmarra, D. Degradation of Ibuprofen in Aqueous Solution with UV Light: The Effect of Reactor Volume and pH. Water Air Soil Pollut. 2016, 227, 1–9. [Google Scholar] [CrossRef]
- Turhan, K.; Durukan, I.; Ozturkcan, S.A.; Turgut, Z. Decolorization of textile basic dye in aqueous solution by ozone. Dyes Pigment. 2012, 92, 897–901. [Google Scholar] [CrossRef]
- Gomes, J.; Costa, R.; Quinta-Ferreira, R.M.; Martins, R.C. Application of ozonation for pharmaceuticals and personal care products removal from water. Sci. Total Environ. 2017, 586, 265–283. [Google Scholar] [CrossRef] [PubMed]
- Gunten, U.V. Ozonation of drinking water: Part II. Disinfection and by-product formation in presence of bromide, iodide or chlorine. Water Res. 2003, 37, 1469–1487. [Google Scholar] [CrossRef]
- Nadeem, K.; Guyer, G.T.; Dizge, N. Polishing of biologically treated textile wastewater through AOPs and recycling for wet processing. J. Water Process Eng. 2017, 20, 29–39. [Google Scholar] [CrossRef]
- Lin, J.; Ye, W.; Baltaru, M.-C.; Tang, Y.P.; Bernstein, N.J.; Gao, P.; Balta, S.; Vlad, M.; Volodin, A.; Sotto, A.; et al. Tight ultrafiltration membranes for enhanced separation of dyes and Na2SO4 during textile wastewater treatment. J. Membr. Sci. 2016, 514, 217–228. [Google Scholar] [CrossRef]
- Hinkle, K.; Wang, X.; Gu, X.; Jameson, C.; Murad, S. Computational Molecular Modeling of Transport Processes in Nanoporous Membranes. Processes 2018, 6, 124. [Google Scholar] [CrossRef]
- Alventosa-deLara, E.; Barredo-Damas, S.; Alcaina-Miranda, M.I.; Iborra-Clar, M.I. Ultrafiltration technology with a ceramic membrane for reactive dye removal: Optimization of membrane performance. J. Hazard. Mater. 2012, 209–210, 492–500. [Google Scholar] [CrossRef] [PubMed]
- Lafi, R.; Gzara, L.; Lajimi, R.H.; Hafiane, A. Treatment of textile wastewater by a hybrid ultrafiltration/electrodialysis process. Chem. Eng. Process. 2018, 132, 105–113. [Google Scholar] [CrossRef]
- Jager, D.D.; Sheldon, M.S.; Edwards, W. Colour removal from textile wastewater using a pilot-scale dual-stage MBR and subsequent RO system. Sep. Purif. Technol. 2014, 135, 135–144. [Google Scholar] [CrossRef]
- Liu, M.; Lü, Z.; Chen, Z.; Yu, S.; Gao, C. Comparison of reverse osmosis and nanofiltration membranes in the treatment of biologically treated textile effluent for water reuse. Desalination 2011, 281, 372–378. [Google Scholar] [CrossRef]
- Maeng, S.K.; You, S.H.; Nam, J.Y.; Ryu, H.; Timmes, T.C.; Kim, H.C. The growth of Scenedesmus quadricauda in RO concentrate and the impacts on refractory organic matter, Escherichia coli, and trace organic compounds. Water Res. 2018, 134, 292. [Google Scholar] [CrossRef]
- Luis, P. Chapter 8—Hybrid processes based on membrane technology. In Fundamental Modelling of Membrane Systems; Luis, P., Ed.; Elsevier: New York, NY, USA, 2018; pp. 301–343. [Google Scholar]
- Hussain, Z.; Arslan, M.; Malik, M.H.; Mohsin, M.; Iqbal, S.; Afzal, M. Integrated perspectives on the use of bacterial endophytes in horizontal flow constructed wetlands for the treatment of liquid textile effluent: Phytoremediation advances in the field. J. Environ. Manag. 2018, 224, 387–395. [Google Scholar] [CrossRef]
- Hussain, Z.; Arslan, M.; Malik, M.H.; Mohsin, M.; Iqbal, S.; Afzal, M. Treatment of the textile industry effluent in a pilot-scale vertical flow constructed wetland system augmented with bacterial endophytes. Sci. Total Environ. 2018, 645, 966–973. [Google Scholar] [CrossRef]
- GilPavas, E.; Dobrosz-Gómez, I.; Gómez-García, M.-Á. Optimization and toxicity assessment of a combined electrocoagulation, H2O2/Fe2+/UV and activated carbon adsorption for textile wastewater treatment. Sci. Total Environ. 2019, 651, 551–560. [Google Scholar] [CrossRef]
- Wong, S.; Yac’cob, N.A.N.; Ngadi, N.; Hassan, O.; Inuwa, I.M. From pollutant to solution of wastewater pollution: Synthesis of activated carbon from textile sludge for dye adsorption. Chin. J. Chem. Eng. 2018, 26, 870–878. [Google Scholar] [CrossRef]
- Lin, S.H.; Chen, M.L. Purification of textile wastewater effluents by a combined Fenton process and ion exchange. Desalination 1997, 109, 121–130. [Google Scholar] [CrossRef]
- Chou, C.; Yu, Y.; Chang, C.; Lin, C.; Shang, N. The combination of ozonation and ion exchange processes for treatment of a municipal wastewater plant effluent. In Proceedings of the International Conference on Electric Technology and Civil Engineering, Lushan, China, 22–24 April 2011; pp. 6961–6964. [Google Scholar]
- Bilińska, L.; Gmurek, M.; Ledakowicz, S. Textile wastewater treatment by AOPs for brine reuse. Process Saf. Environ. Prot. 2017, 109, 420–428. [Google Scholar] [CrossRef]
- Discharge Standards of Water Pollutants for Dyeing and Finishing of Textile Industry (GB 4287-2012). Environmental Protection Department (EPD): Inspection and Quarantine of the PRC, 2012. Available online: https://www.sgs.com/en/news/2015/07/safeguards-12115-china-discharge-standards-of-water-pollutants-for-dyeing-and-finishing-of-textile (accessed on 16 July 2015).
- The Reuse of Urban Recycling Water—Water Quality Standard for Industrial Uses (GB/T-19923-2005). Inspection and Quarantine of the PRC, 2005. Available online: https://wenku.baidu.com/view/4c8a6200cc1755270722087f.html (accessed on 6 February 2013).
- Standards for Drinking Water Quality (GB 5749-2006). Ministry of Health of the PRC, 2006. Available online: https://food.chemlinked.com/expert-article/ebook/gb-5749-2006-standards-drinking-water-quality (accessed on 26 January 2015).
- Hong, P.K.; Xiao, T. Treatment of oil spill water by ozonation and sand filtration. Chemosphere 2013, 91, 641–647. [Google Scholar] [CrossRef] [PubMed]
- Racar, M.; Dolar, D.; Špehar, A.; Košutić, K. Application of UF/NF/RO membranes for treatment and reuse of rendering plant wastewater. Process Saf. Environ. Prot. 2017, 105, 386–392. [Google Scholar] [CrossRef]
- Gómez, J.L.; Bódalo, A.; Gómez, E. Experimental behaviour and design model of a fluidized bed reactor with immobilized peroxidase for phenol removal. Chem. Eng. J. 2007, 127, 47–57. [Google Scholar] [CrossRef]
- Wang, H.; Zheng, Y.; Zhu, J.; Chen, H.; Zhang, Q.; Ding, L. Ozone Dosage of Advanced Treatment Processes for Raw Water from Huangpu River. Water Purif. Technol. 2010, 29, 73–79. [Google Scholar]
- Deng, Y. Experimental Study of the Ozone Oxidation Sludge. Master’s Thesis, Chongqing University, Chongqing, China, 2013. [Google Scholar]
- Wan, J.; Wu, S.; Wang, R.; Zeng, H. Effects of Ozone Treatment on Activated Sludge Characters. Environ. Chem. 2009, 28, 233–237. [Google Scholar]
- Ke, Z.; Yanping, C.; Tianli, H.; Hongchao, Z.; Lijun, H. Nitrogen Transformation in Ozonation of Effluent from a Paper-mill Wastewater Treatment Plant. Environ. Sci. Technol. 2014, 12, 5. [Google Scholar]
- Yagi, S.; Tanaka, M. Mechanism of ozone generation in air-fed ozonisers. J. Phys. D Appl. Phys. 1979, 12, 1509. [Google Scholar] [CrossRef]
- Wang, F.; Zhang, Y.; Xue, C.; Shi, Y.; Zhang, K.; Zhang, L. Influence of Ozone Disinfection on Phosphorus Form Transformation in Anaerobic Swine Wastewater. Trans. Chin. Soc. Agric. Mach. 2014, 45, 151–155. [Google Scholar]
- Michael-Kordatou, I.; Michael, C.; Duan, X.; He, X.; Dionysiou, D.D.; Mills, M.A.; Fatta-Kassinos, D. Dissolved effluent organic matter: Characteristics and potential implications in wastewater treatment and reuse applications. Water Res. 2015, 77, 213–248. [Google Scholar] [CrossRef]
- Cristóvão, R.O.; Botelho, C.M.; Martins, R.J.E.; Loureiro, J.M.; Boaventura, R.A.R. Fish canning industry wastewater treatment for water reuse—A case study. J. Clean. Prod. 2015, 87, 603–612. [Google Scholar] [CrossRef]
- Bilińska, L.; Blus, K.; Gmurek, M.; Ledakowicz, S. Coupling of electrocoagulation and ozone treatment for textile wastewater reuse. Chem. Eng. J. 2019, 358, 992–1001. [Google Scholar] [CrossRef]
- Korenak, J.; Hélix-Nielsen, C.; Bukšek, H.; Petrinić, I. Efficiency and economic feasibility of forward osmosis in textile wastewater treatment. A case study. J. Clean. Prod. 2019, 210, 1483–1495. [Google Scholar] [CrossRef]
Figure 1.
Schematics of the water reuse treatment processes.

Figure 2.
Removal rate of the pollutants during reactive precipitation + primary sand filtration + primary ozonation + second sand filtration.
Figure 2.
Removal rate of the pollutants during reactive precipitation + primary sand filtration + primary ozonation + second sand filtration.

Figure 3.
Effect of ozone dosage on the color removal rate (initial color at 125 times).

Figure 4.
Removal rate of the NH3-N, TP, and TN in primary ozonation.

Figure 5.
Pollutants of the effluent after treatment by the reaction, precipitation, primary sand filtration, primary ozone oxidation, and secondary sand filtration (a) chemical oxygen consumption (CODcr) and color, (b) suspended solid (SS), NH3−N, TN and TP.
Figure 5.
Pollutants of the effluent after treatment by the reaction, precipitation, primary sand filtration, primary ozone oxidation, and secondary sand filtration (a) chemical oxygen consumption (CODcr) and color, (b) suspended solid (SS), NH3−N, TN and TP.

Figure 6.
Pollutant changes in the primary ultrafiltration (UF) (a) CODcr, color, (b) NH3-N, TN, and TP, (c) conductivity, SO42−, Cl−, and (d) hardness, total alkalinity, turbidity.
Figure 6.
Pollutant changes in the primary ultrafiltration (UF) (a) CODcr, color, (b) NH3-N, TN, and TP, (c) conductivity, SO42−, Cl−, and (d) hardness, total alkalinity, turbidity.


Figure 7.
Removal rate of TP, turbidity, and CODcr in the primary UF process.

Figure 8.
Removal rate of pollutants in the primary RO process.

Figure 9.
Pollutants change in the second ozonation process (a) conductivity and turbidity, (b) hardness, total alkalinity, Cl−, SO42−.
Figure 9.
Pollutants change in the second ozonation process (a) conductivity and turbidity, (b) hardness, total alkalinity, Cl−, SO42−.

Figure 10.
Removal rate of the CODcr and color in the second ozonation process.

Figure 11.
Average removal rates of pollutants for the RO concentrated water by the third sand filtration + second UF + second RO.
Figure 11.
Average removal rates of pollutants for the RO concentrated water by the third sand filtration + second UF + second RO.

Figure 12.
Cost breakdown analysis of water reuse treatment.


Table 1.
Pollutant contents of influents from a textile wastewater treatment plant and corresponding standards (CODcr: chemical oxygen consumption; BOD5: biochemical oxygen demand; TP: total phosphorus; TN: total nitrogen; SS: suspended solid).
Table 1.
Pollutant contents of influents from a textile wastewater treatment plant and corresponding standards (CODcr: chemical oxygen consumption; BOD5: biochemical oxygen demand; TP: total phosphorus; TN: total nitrogen; SS: suspended solid).
| Parameter | Unit | Raw Wastewater Value | Wastewater after Biological Treatment | Discharge Standard [34] | Reuse Standard [35] | Drinking Water Standard [36] |
|---|---|---|---|---|---|---|
| pH | - | 8.96–12.50 | 7.7–8.16 | 6–9 | 6.5–8.5 | 6.5–8.5 |
| CODcr | mg·L−1 | 400–1000 | 70.2–108 | 80 | 60 | 3 |
| BOD5 | mg·L−1 | 200–450 | 1–9 | 20 | 10 | None |
| Color | times | 400–1500 | 110–250 | 50 | 30 | 15 |
| NH3-N | mg·L−1 | 4–21 | 0.21–3.64 | 10 | 10 | 0.5 |
| TP | mg·L−1 | 1–20 | 1.97–6.34 | 0.5 | 1 | None |
| TN | mg·L−1 | 7–46 | 2.14–8.88 | 15 | None | None |
| SS | mg·L−1 | 50–250 | 12.9–49 | 50 | 30 | None |
| Turbidity | NTU | Uncertainty | 0.42—1.33 | None | 5 | 1 |
| Hardness | mg·L−1 | Uncertainty | 82—190 | None | 450 | 450 |
| Conductivity | μs·cm−1 | Uncertainty | 5098—7410 | None | None | None |
| Total alkalinity | mg·L−1 | Uncertainty | 323—696 | None | 350 | None |
| Cl− | mg·L−1 | Uncertainty | 820—1496 | None | 250 | 250 |
| SO42− | mg·L−1 | Uncertainty | 1504—2498 | None | 250 | 250 |
| Fe3+ | mg·L−1 | Uncertainty | Uncertainty | None | 0.3 | 0.3 |
| Cu2+ | mg·L−1 | Uncertainty | Uncertainty | None | None | 1.0 |
Table 2.
Operating conditions and results from the test carried by the primary reverse osmosis (RO).
Table 2.
Operating conditions and results from the test carried by the primary reverse osmosis (RO).
| Pressure (MPa) | Water Production Rate (%) | Conductivity Removal Rate (%) |
|---|---|---|
| 1.00 | 67.05 | 92.95 |
| 1.05 | 66.19 | 92.84 |
| 1.10 | 67.25 | 92.96 |
| 1.15 | 67.5 | 92.99 |
| 1.20 | 67.15 | 92.96 |
Table 3.
Pollutants of the effluent after the primary RO treatment.
| Unit | Average | Max | Min | |
|---|---|---|---|---|
| pH | - | 7.90 | 8.15 | 7.74 |
| CODcr | mg·L−1 | 0.37 | 1.65 | 0.00 |
| Color | times | 0.33 | <5.00 | 0.00 |
| NH3-N | mg·L−1 | 0.07 | 0.15 | 0.01 |
| TN | mg·L−1 | 0.91 | 2.26 | 0.10 |
| TP | mg·L−1 | 0.06 | 0.29 | 0.00 |
| Hardness | mg·L−1 | 22.04 | 50.78 | 8.10 |
| Total alkalinity | mg·L−1 | 64.19 | 104.90 | 31.24 |
| Cl− | mg·L−1 | 92.09 | 148.90 | 46.60 |
| SO42− | mg·L−1 | 15.23 | 70.62 | 0.19 |
| Conductivity | μs·cm−1 | 415.84 | 712.69 | 127.94 |
| Turbidity | NTU | 0.06 | 0.14 | 0.01 |
| BOD5 | mg·L−1 | Not detectable | Not detectable | Not detectable |
| SS | mg·L−1 | Not detectable | Not detectable | Not detectable |
| Fe3+ | mg·L−1 | Not detectable | Not detectable | Not detectable |
| Cu2+ | mg·L−1 | Not detectable | Not detectable | Not detectable |
Table 4.
Pollutants of the effluent after the second RO treatment.
| Unit | Average | Max | Min | |
|---|---|---|---|---|
| pH | - | 7.90 | 8.15 | 7.74 |
| CODcr | mg·L−1 | 0.44 | 1.75 | Not detectable |
| Color | times | 0.32 | 5.00 | Not detectable |
| NH3-N | mg·L−1 | 0.06 | 0.19 | Not detectable |
| TN | mg·L−1 | 1.57 | 6.75 | 0.12 |
| TP | mg·L−1 | 0.08 | 0.27 | Not detectable |
| Hardness | mg·L−1 | 3.45 | 18.22 | 0.16 |
| Total alkalinity | mg·L−1 | 67.31 | 154.95 | 7.26 |
| Cl− | mg·L−1 | 107.75 | 246.54 | 31.30 |
| SO42− | mg·L−1 | 25.03 | 66.04 | 0.5 |
| Conductivity | μs·cm−1 | 288.60 | 941.95 | 89.64 |
| Turbidity | NTU | 0.09 | 0.26 | Not detectable |
| BOD5 | mg·L−1 | Not detectable | Not detectable | Not detectable |
| SS | mg·L−1 | Not detectable | Not detectable | Not detectable |
| Fe3+ | mg·L−1 | Not detectable | Not detectable | Not detectable |
| Cu2+ | mg·L−1 | Not detectable | Not detectable | Not detectable |
Table 5.
Summary of results of combined process as indicated by average drop and removal rate.
| Treatment | Reaction + Sand Filtration | Ozonation | Sand Filtration | UF | RO | Total | ||
|---|---|---|---|---|---|---|---|---|
| Primary water reuse system | CODcr | (mg·L−1) | 9.26 (10.7%) | 21.33 (27.6%) | 3.91 (7.00%) | 9.03 (17.34%) | 42.64 (99.17%) | 86.18 (99.57%) |
| Color | (times) | 22.26 (14.3%) | 92.59 (69.4%) | 0.41 (1.00%) | -- | 38.77 (99.11%) | 155.34 (99.79%) | |
| SS | (mg·L−1) | 24.2 (99.34%) | -- | Not detectable | 24.39 (100%) | |||
| NH3-N | (mg·L−1) | 0.5 (27.35%) | -- | 0.77 (91.39%) | 1.27 (94.65%) | |||
| TN | (mg·L−1) | −0.1 (−4.39%) | -- | 4.49 (85.07%) | 4.99 (84.53%) | |||
| TP | (mg·L−1) | 0.5 (13.25%) | 0.12 (4.03%) | 2.90 (98.09%) | 3.50 (98.36%) | |||
| Hardness | mg·L−1) | Uncertainty | -- | 103.91 (82.83%) | 104.23 (82.54%) | |||
| Total alkalinity | (mg·L−1) | Uncertainty | -- | 456.67 (87.74%) | 456.71 (87.68%) | |||
| Cl− | (mg·L−1) | Uncertainty | -- | 1063 (92.02%) | 1067 (92.05%) | |||
| SO42− | (mg·L−1) | Uncertainty | -- | 1816 (99.17%) | 1829 (99.17%) | |||
| Conductivity | (μs·cm−1) | Uncertainty | -- | 5491 (92.94%) | 5550 (93.03%) | |||
| Turbidity | NTU | Uncertainty | 0.33 (37.42%) | 0.28 (52.18%) | 0.21 (76.98%) | 0.82 (93.18%) | ||
| Second water reuse system | CODcr | (mg·L−1) | None | 41.15 (35.72%) | 73.94 (99.41%) | 115.09 (99.62%) | ||
| Color | (times) | None | 97.27 (75.36%) | 32.58 (99.02%) | 129.85 (99.75%) | |||
| NH3-N | (mg·L−1) | None | -- | 0.83 (93.68%) | 1.01 (94.75%) | |||
| TN | (mg·L−1) | None | -- | 12.16 (88.57%) | 11.80 (88.26%) | |||
| TP | (mg·L−1) | None | -- | 7.97 (99.06%) | 8.50 (99.12%) | |||
| Hardness | (mg·L−1) | None | -- | 308.22 (98.89%) | 309.87 (98.90%) | |||
| Total alkalinity | (mg·L−1) | None | -- | 1212.21 (94.74%) | 1234.45 (94.83%) | |||
| Cl− | (mg·L−1) | None | -- | 2838 (96.34%) | 2888 (96.40%) | |||
| SO42− | (mg·L−1) | None | -- | 4743 (99.48%) | 4775 (99.48%) | |||
| Turbidity | NTU | None | -- | 0.68 (88.61%) | 0.69 (88.64%) | |||
| Conductivity | (μs·cm−1) | None | -- | 13,845 (97.96%) | 13,813 (97.95%) | |||
Note: ‘--’ means that the removal rate is very small.
Table 6.
Operating cost of the combined process.
| Unit | Data | |
|---|---|---|
| Electric rate (USD·kWh−1) | 0.1 | |
| Primary water reuse system | Reclaimed water (m3·d−1) | 50,250 |
| Power consumption for ozone and oxygen production (kWh·d−1) | 81,000 | |
| Power consumption of the pumps (kWh·d−1) | 60,288 | |
| Electricity cost (USD·d−1) | 14,129 | |
| Polymeric aluminum (PAC) (kg·d−1) | 6098 | |
| PAC cost (USD·d−1) | 644 | |
| Second water reuse system | Reclaimed water (m3·d−1) | 14,850 |
| Power consumption for ozone production (kWh·d−1) | 35,046 | |
| Power consumption of the pumps (kWh·d−1) | 21,384 | |
| Electricity cost (USD·d−1) | 5643 | |
| Agentia | Anti-scalant (kg·d−1) | 114 |
| Reducing agents (kg·d−1) | 114 | |
| Sterilizing agent (kg·d−1) | 6.65 | |
| Agentia cost (104 USD·a−1) | 11.42 | |
| Machine maintenance cost (104 USD·a−1) | 21.91 | |
| Ultrafiltration (UF) membrane (104 USD·a−1) | 53.04 | |
| RO membrane (104 USD·a−1) | 88 | |
| Filter-bag of the precision filter(104 USD·a−1) | 3.96 | |
| Employees cost (104 USD·a−1) | 125 | |
| Unit water reuse treatment cost (USD·m−3) | 0.44 | |
Notes: (1) UF membrane was replaced every 5 years, RO membrane was replaced every 3 years, and security filter bag was replaced every 10 years. (2) The cost for filter-bag of the precision filter was 0.0017 USD·m−3 produced water. (3) Working days in one year were 365 days.
© 2019 by the authors. Licensee MDPI, Basel, Switzerland. This article is an open access article distributed under the terms and conditions of the Creative Commons Attribution (CC BY) license (http://creativecommons.org/licenses/by/4.0/).
Share and Cite
MDPI and ACS Style
Yin, H.; Qiu, P.; Qian, Y.; Kong, Z.; Zheng, X.; Tang, Z.; Guo, H. Textile Wastewater Treatment for Water Reuse: A Case Study. Processes 2019, 7, 34. https://doi.org/10.3390/pr7010034
AMA Style
Yin H, Qiu P, Qian Y, Kong Z, Zheng X, Tang Z, Guo H. Textile Wastewater Treatment for Water Reuse: A Case Study. Processes. 2019; 7(1):34. https://doi.org/10.3390/pr7010034
Chicago/Turabian StyleYin, Hua, Peiwen Qiu, Yuange Qian, Zhuwen Kong, Xiaolong Zheng, Zhihua Tang, and Huafang Guo. 2019. "Textile Wastewater Treatment for Water Reuse: A Case Study" Processes 7, no. 1: 34. https://doi.org/10.3390/pr7010034
Note that from the first issue of 2016, this journal uses article numbers instead of page numbers. See further details here.