Effective Dye Degradation by Graphene Oxide Supported Manganese Oxide


1
Laboratory of Chemical Technology, Department of Chemistry, Aristotle University of Thessaloniki, 54124 Thessaloniki, Greece
2
Hephaestus Advanced Laboratory, Eastern Macedonia and Thrace Institute of Technology, 65404 Kavala, Greece
*
Author to whom correspondence should be addressed.
Processes 2019, 7(1), 40; https://doi.org/10.3390/pr7010040
Submission received: 1 December 2018
/
Revised: 28 December 2018
/
Accepted: 11 January 2019
/
Published: 14 January 2019
(This article belongs to the Special Issue Wastewater Treatment Processes)
Abstract
:Graphene oxide (GO) was used as a support for manganese oxide (MnO2) for the preparation of a nanocomposite catalyst for the degradation of an azo dye, Reactive Black 5 (RB5). The nanocomposite was characterized for the structure by XRD, for the morphology with SEM, and for the surface chemistry with FTIR and potentiometric titration measurements. The GO-MnO2 nanocomposite presented a high catalytic activity for the degradation/oxidation of RB5 at ambient conditions, which was higher than that of the pure MnO2 and could be attributed to the beneficial contribution of the manganese oxide and the graphene oxide.
1. Introduction
It is widely known that an important problem of environmental science is the existence of high toxic compounds in effluents. In particular, a special class of pollutants that can cause carcinogenetic problems is dyes. The synthetic dyes that exist in wastewaters are considered to be a big hazard due to the pollution of the water resources. Among the huge variety of dyes in wastewaters, synthetic azo dyes, which are extensively applied in industry (dyeing and textile processes), are highly persistent in the aquatic environment and have possible mutagenic and carcinogenic effects [1]. Azo dyes are organic molecules/compounds with one or more azo group (–N=N–) that is directly united with aromatic rings (benzene and/or naphthalene) as well as some other functional groups (amino, hydroxyl, carboxyl, chlorine, sulfonate, etc.) with excellent solubility in the water.
The recent research contains various methods for reducing the impact of azo dyes on public health and environmental quality. Common classes of techniques are physical-based (adsorption, ion exchange, membrane filtration [2,3,4,5,6]), chemical-based (ozonation, electrochemical degradation, advanced oxidation processes), and biological-based (biodegradation, bioaccumulation, biosorption using fungi, algae, yeast, and bacteria) [7,8,9,10]. Due to the many drawbacks presented in conventional wastewater treatment technologies (high operation costs, energy consumption, reduced efficiency due to the chemical stability of dyes and/or the complexity of their degradation), the recent trend is to combine the techniques for sustainability, as oxidation/catalysis or adsorption/catalysis, etc.
In the last decades, a huge number of catalysts were synthesized using oxides of Ti, Zn, and Mn [9,11,12,13] as the bases. Manganese dioxide (MnO2) is a promising material because of it is low cost, it presents high stability, and it has environmental compatibility as well as abundant availability [14]. Nano-manganese dioxide have been studied as adsorbents [15,16] and oxidants/degradants [17,18,19,20] for a great variety of organic pollutants and dyes due to its octahedral crystal structure (MnO6) and its high redox potential [21]. MnO2 is usually synthesized at nanoscale in order for more reaction sites to be obtained [22,23], presenting difficulties in separation from aquatic solutions. An alternative method for solving this problem is the preparation of composites with graphite and/or graphene oxide (GO). GO contains reactive oxygen functional groups (hydroxyl, carboxyl, epoxy groups) attached to an sp2/sp3 hybridized carbon network that provides hydrophilic character and chemical reactivity [24,25,26]. It is a fact that GO has an important impact on many applications nowadays, such as batteries [27], nanofiltration [28], electrodialysis [29], imaging [30], etc. GO-MnO2 nanocomposites are easier to separate from water, and their high conductivity can accelerate electron transfer [31,32], which is beneficial for the oxidation of organic molecules. Therefore, GO is an important and promising support for MnO2 nanoparticles as an effective catalyst for the adsorption and degradation improvement. In the present study, a GO-MnO2 nanocomposite was prepared and applied as the catalyst for Reactive Black Five (RB5) oxidation, which was selected as a model organic molecule. RB5 was selected as a model azo-dye. The aim of our study was to examine the possible synergetic effect of adsorption and oxidative degradation. Adsorption of RB5 was previously examined from our team as a model azo-dye pollutant for the adsorption method (with various adsorbent materials). For this reason, RB5 was selected as a solute. The nanocomposite (catalyst) was characterized for the structure by XRD, for the morphology with SEM, and for the surface chemistry with FTIR and potentiometric titration measurements. The full series of degradation experiments (pH, ionic strength, kinetics) was performed in order to examine the degradation ability of GO-MnO2 for RB5. The GO-MnO2 nanocomposite exhibited high potential in RB5 degradation.
2. Materials and Methods
2.1. Materials
RB5 and KMnO4 were purchased from Chem-Lab NV (Zedelgem, Belgium), graphite, H2O2, and NaCl were purchased from Sigma Aldrich (St. Louis, MO, USA), and MnSO4 was purchased from Merck (Darmstadt, Germany). All reagents were of analytical grade ≥98.5%.
2.2. Synthesis of GO, MnO2, and GO-MnO2
The GO was prepared by oxidation of graphite according to the modified Hummers method [33]. Briefly, graphite powder (10 g) was added in sulfuric acid (230 mL, 0 °C) under stirring, followed by potassium permanganate (30 g) addition. Finally, hydrogen peroxide (100 mL, 30 wt% solution) was added, and the GO particles formed were separated by decantation and transferred to dialysis tubes (D9402-100FT Sigma-Aldrich (St. Louis, MO, USA), until sulfate ions were removed. When the solution was clear, the wet form of graphite oxide was separated by filtration, freeze-dried, and denoted as GO.
In the case of manganese oxide (MnO2) preparation, a 30 mL solution of KMnO4 (0.21 mol L−1) was added dropwise to a 0.2 mol L−1 solution of MnSO4 under stirring. MnO2 was formed according to the reaction in Equation (1) [34]:
2KMnO4 + 3MnSO4 + 2H2O → 5MnO2 + K2SO4 + 2H2SO4.
For the synthesis of GO-MnO2 composite, 2 g of graphite oxide was dispersed in 175 mL of deionized water and then ultra-sonicated for 1 h. A solution of KMnO4 (0.8 g of KMnO4 dissolved in 100 mL deionized water) was slowly added into the above dispersion under vigorous stirring and kept in darkness under ambient conditions for 12 h. The product was collected by centrifugation, washed with deionized water and absolute ethanol, and freeze-dried [35]. The resulted material was denoted as GO-MnO2.
2.3. Characterizations
XRD measurements were conducted at a PW1820 X-ray diffractometer (Philips, New York, NY, USA) with a Cu Kα radiation for crystalline phase identification at a scan rate of 2° min−1. SEM images were performed with an electron microscope (JEOL JSM-840A, Tokyo, Japan) with an energy dispersive X-ray (EDX) micro-analytical system. EDX analysis was done at magnification 10 K and led to the maps of elements for the determination of Mn distribution on the surface. FTIR spectra were taken with a Nicolet 560 (Thermo Fisher Scientific Inc., Madison, WI, USA) FTIR spectrometer. Potentiometric titration measurements were carried out with a T50 automatic titrator (Mettler Toledo, Columbia, SC, USA) [36].
2.4. Degradation Activity
2.4.1. Effect of pH
The effect of pH was tested by dispersing 0.01 g of MnO2 and/or GO-MnO2 in 20 mL (V) of RB5 solution (C0 = 60 mg L−1) in capped vials. The pH value was adjusted between 3 and 9 by additions of HNO3 (0.01 mol L−1) or NaOH (0.01 mol L−1). The suspensions were shaken for 24 h (agitation rate: N = 160 rpm) in a water bath at 25 °C. After, they were centrifuged in order to separate the solid catalysts, and the residual dye concentration was detected by UV-vis spectrophotometer (model U-2000, Hitachi, Tokyo, Japan) at 603 nm. The RB5 removal percentage (R%) was calculated by Equation (2):
where C0 and Ce (mg L−1) are the initial and equilibrium concentrations of RB5, respectively.
2.4.2. Effect of Ionic Strength
The effect of ionic strength was examined by dispersing 0.01 g of MnO2 and/or GO-MnO2 with 20 mL (V) of RB5 solution (C0 = 60 mg L−1) with an addition of NaCl concentrations from 0.01 and 1 M. The suspensions were shaken for 24 h (agitation rate: N = 160 rpm) into a water bath to control the temperature at 25 °C at pH = 3.
2.4.3. Kinetics
For decolorization experiments, 0.01 g of adsorbent was dispersed in 20 mL (V) of RB5 solution (C0 = 20, 40 or 100 mg L−1) in capped vials. After shaken for 24 h at 25 °C at 160 rpm for different times (5 min–24 h), the dispersions were centrifuged, and the residual dye concentration was measured by UV-vis at 603 nm. The kinetic results were fitted to pseudo-first order [37] (Equation (3)) and pseudo-second order [38] (Equation (4)) kinetic models:
where k1, k2 (min−1) are the rate constants for the pseudo-first and -second order kinetic equations; C0, Ct, Ce (mg/L) are the initial, transient, and equilibrium concentrations of dye in the aqueous solution, respectively.
3. Results and Discussion
3.1. Characterizations
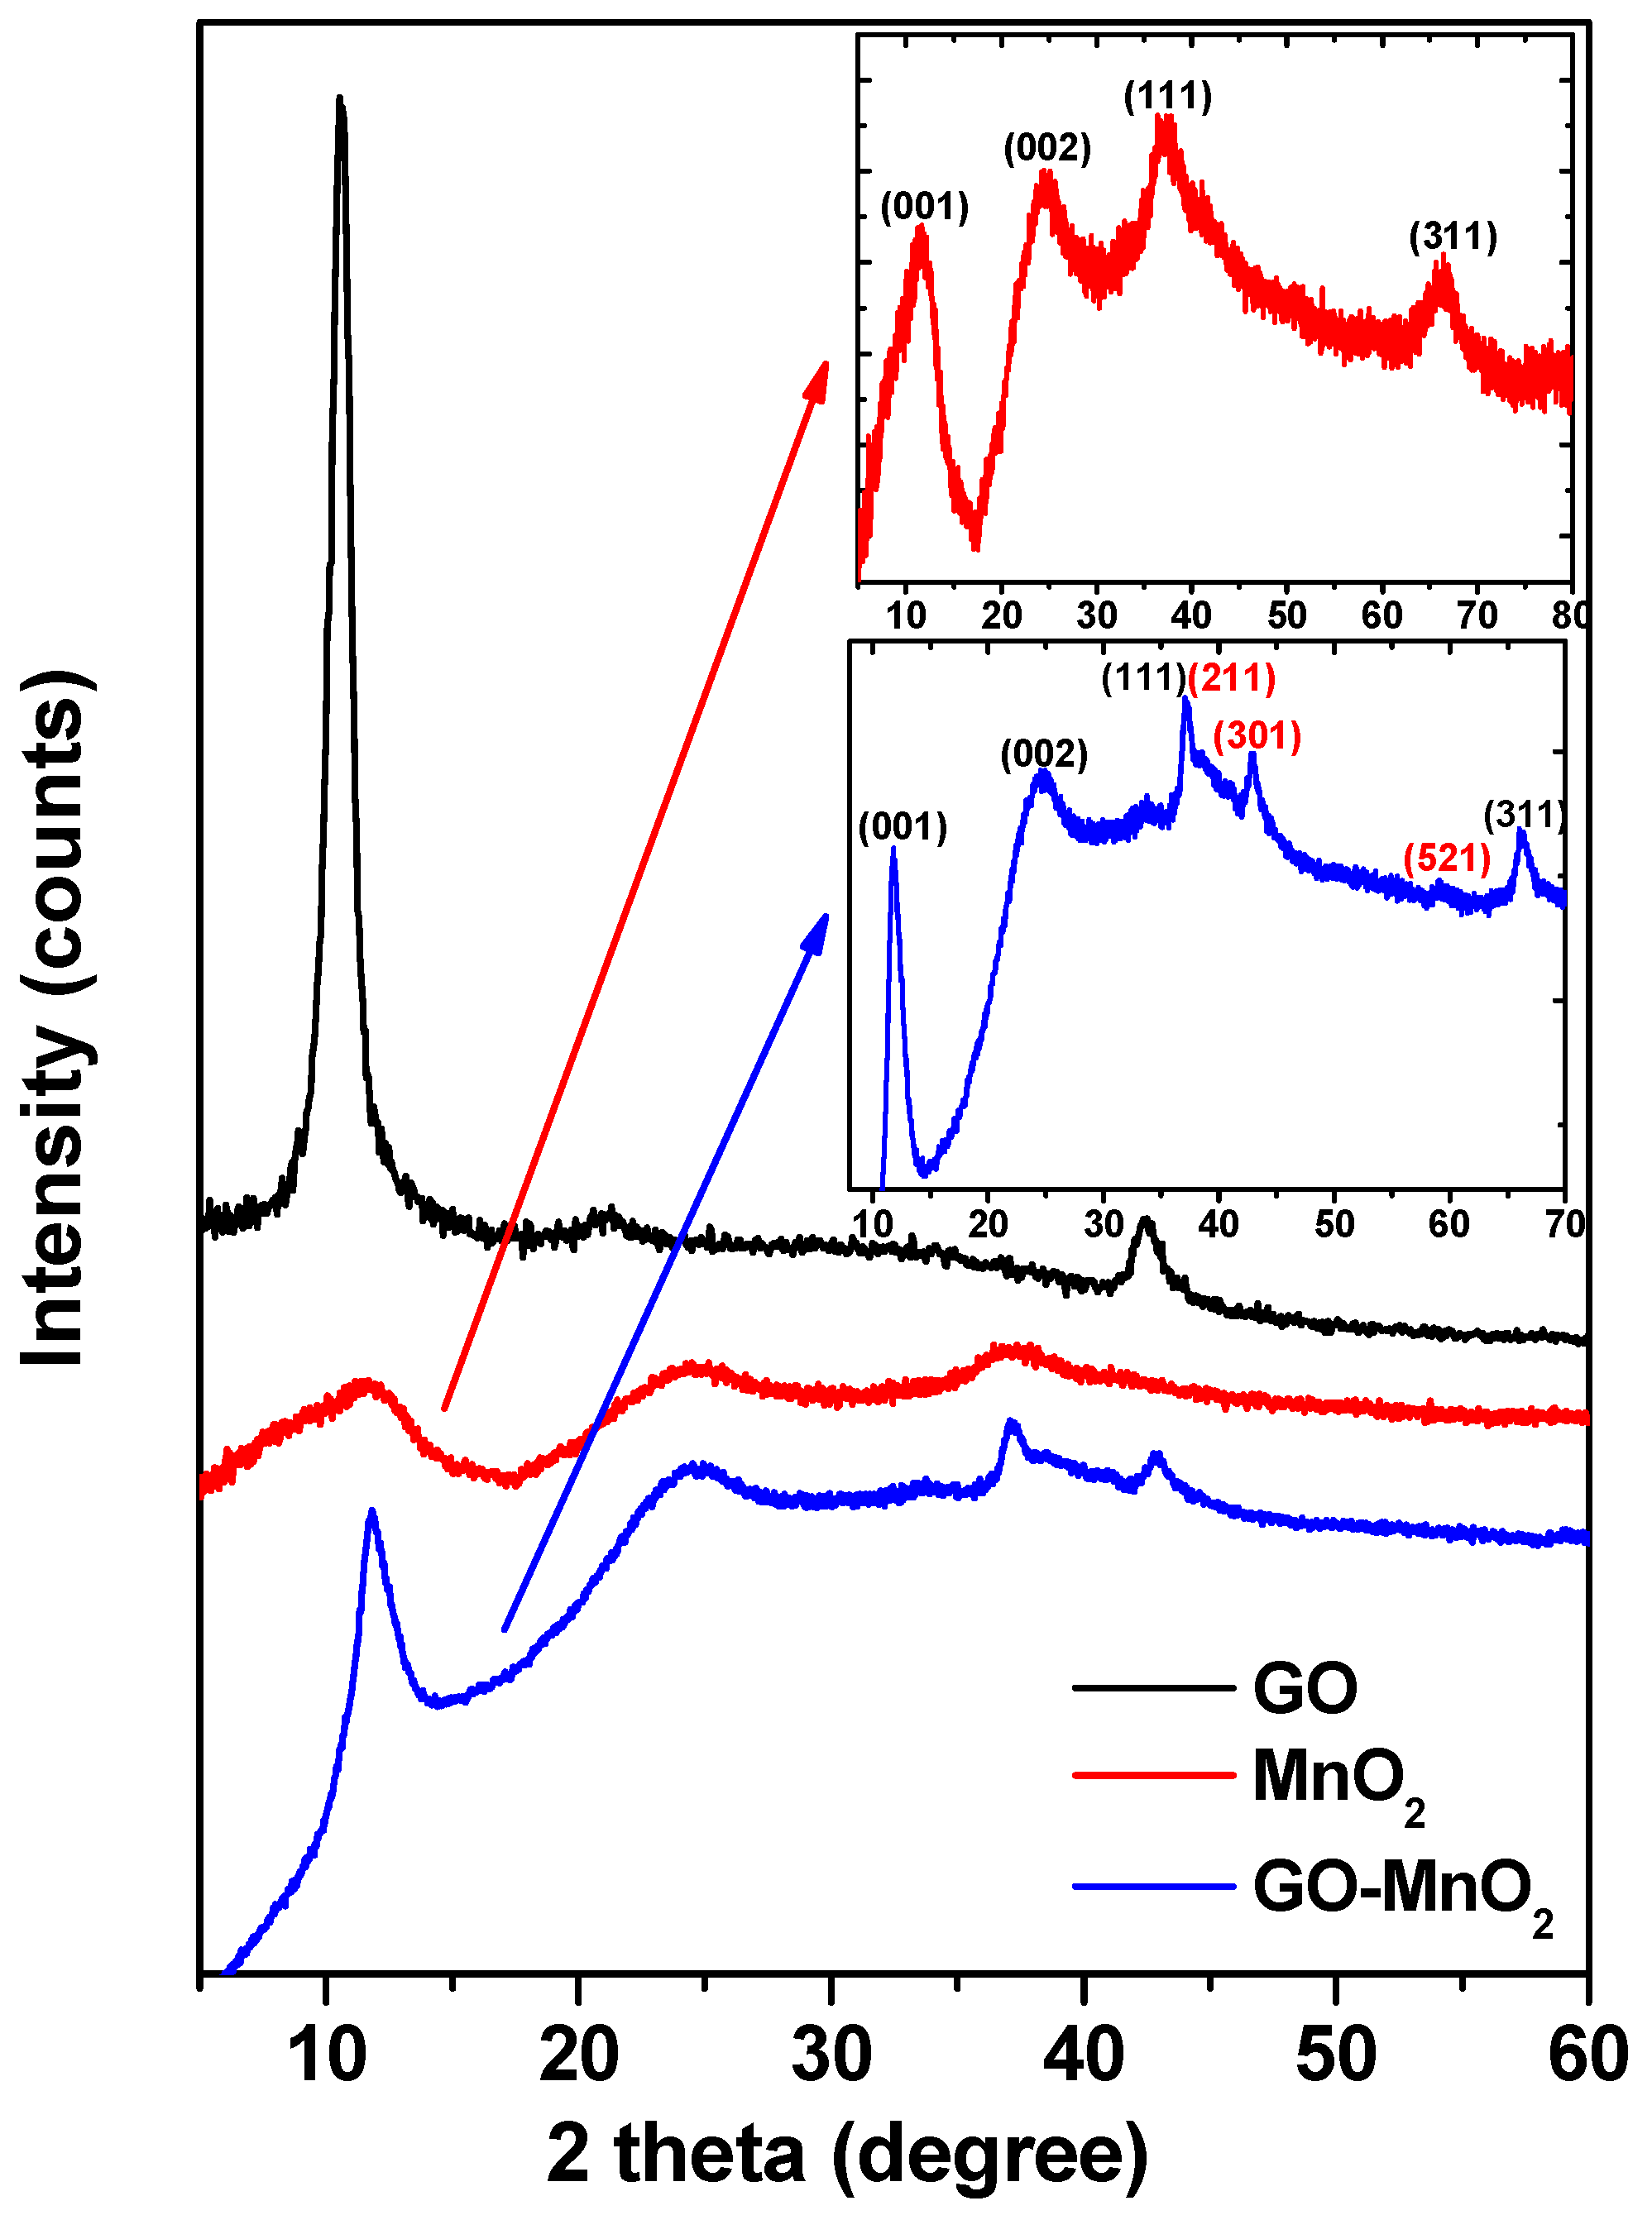
The XRD patterns of GO, MnO2, and GO-MnO2 are presented in Figure 1. The characteristic (001) peak of graphite oxide centered at 2θ = 10.3° is indicative of the successful oxidation of graphite into graphite oxide [39].
In the diffraction pattern for MnO2, the basal reflections at 2θ = 11.4°, 25°, 37.2°, and 66.7° (inset in Figure 1) could be attributed to the (001), (002), (111), and (311) basal reflections diffraction bands of δ-MnO2 (birnessite JCPDS 80-1098), respectively [40,41]. The broadness of the peaks indicated the low crystallinity of the manganese oxide. The average crystallite size (D) of MnO2 was estimated by applying the Debye Scherrer’s equation for the (111) peak. The crystallite size of MnO2 was found to be about 65 nm. The XRD spectra for GO-MnO2 composite presented a diffraction peak at around 11°, which was attributed to the (001) of GO. The peak appeared at a slightly higher reflection angle with a lower intensity than in GO, demonstrating that GO in GO-MnO was partially exfoliated. Furthermore, the diffraction peaks could be indexed to δ-MnO2 (birnessite JCPDS 80-1098). The peaks were less broad than those of MnO2, indicating the poor crystallinity and the high dispersion of the inorganic phase around the graphitic layers in the obtained composite. The diffraction patterns resembled those referenced in literature that were assigned the peaks to birnessite type MnO2 [42]. This result agreed well with the reported MnO2 on graphene [43,44]. The crystallite size was calculated from the major (211) diffraction peak using the Debye Scherrer approximation and was found to be about 205 nm. The total Mn content for the GO-MnO2 nanocomposite, calculated by atomic absorption spectroscopy (AAS) measurement, was found to be 200 mg Mn per gram of nanocomposite.
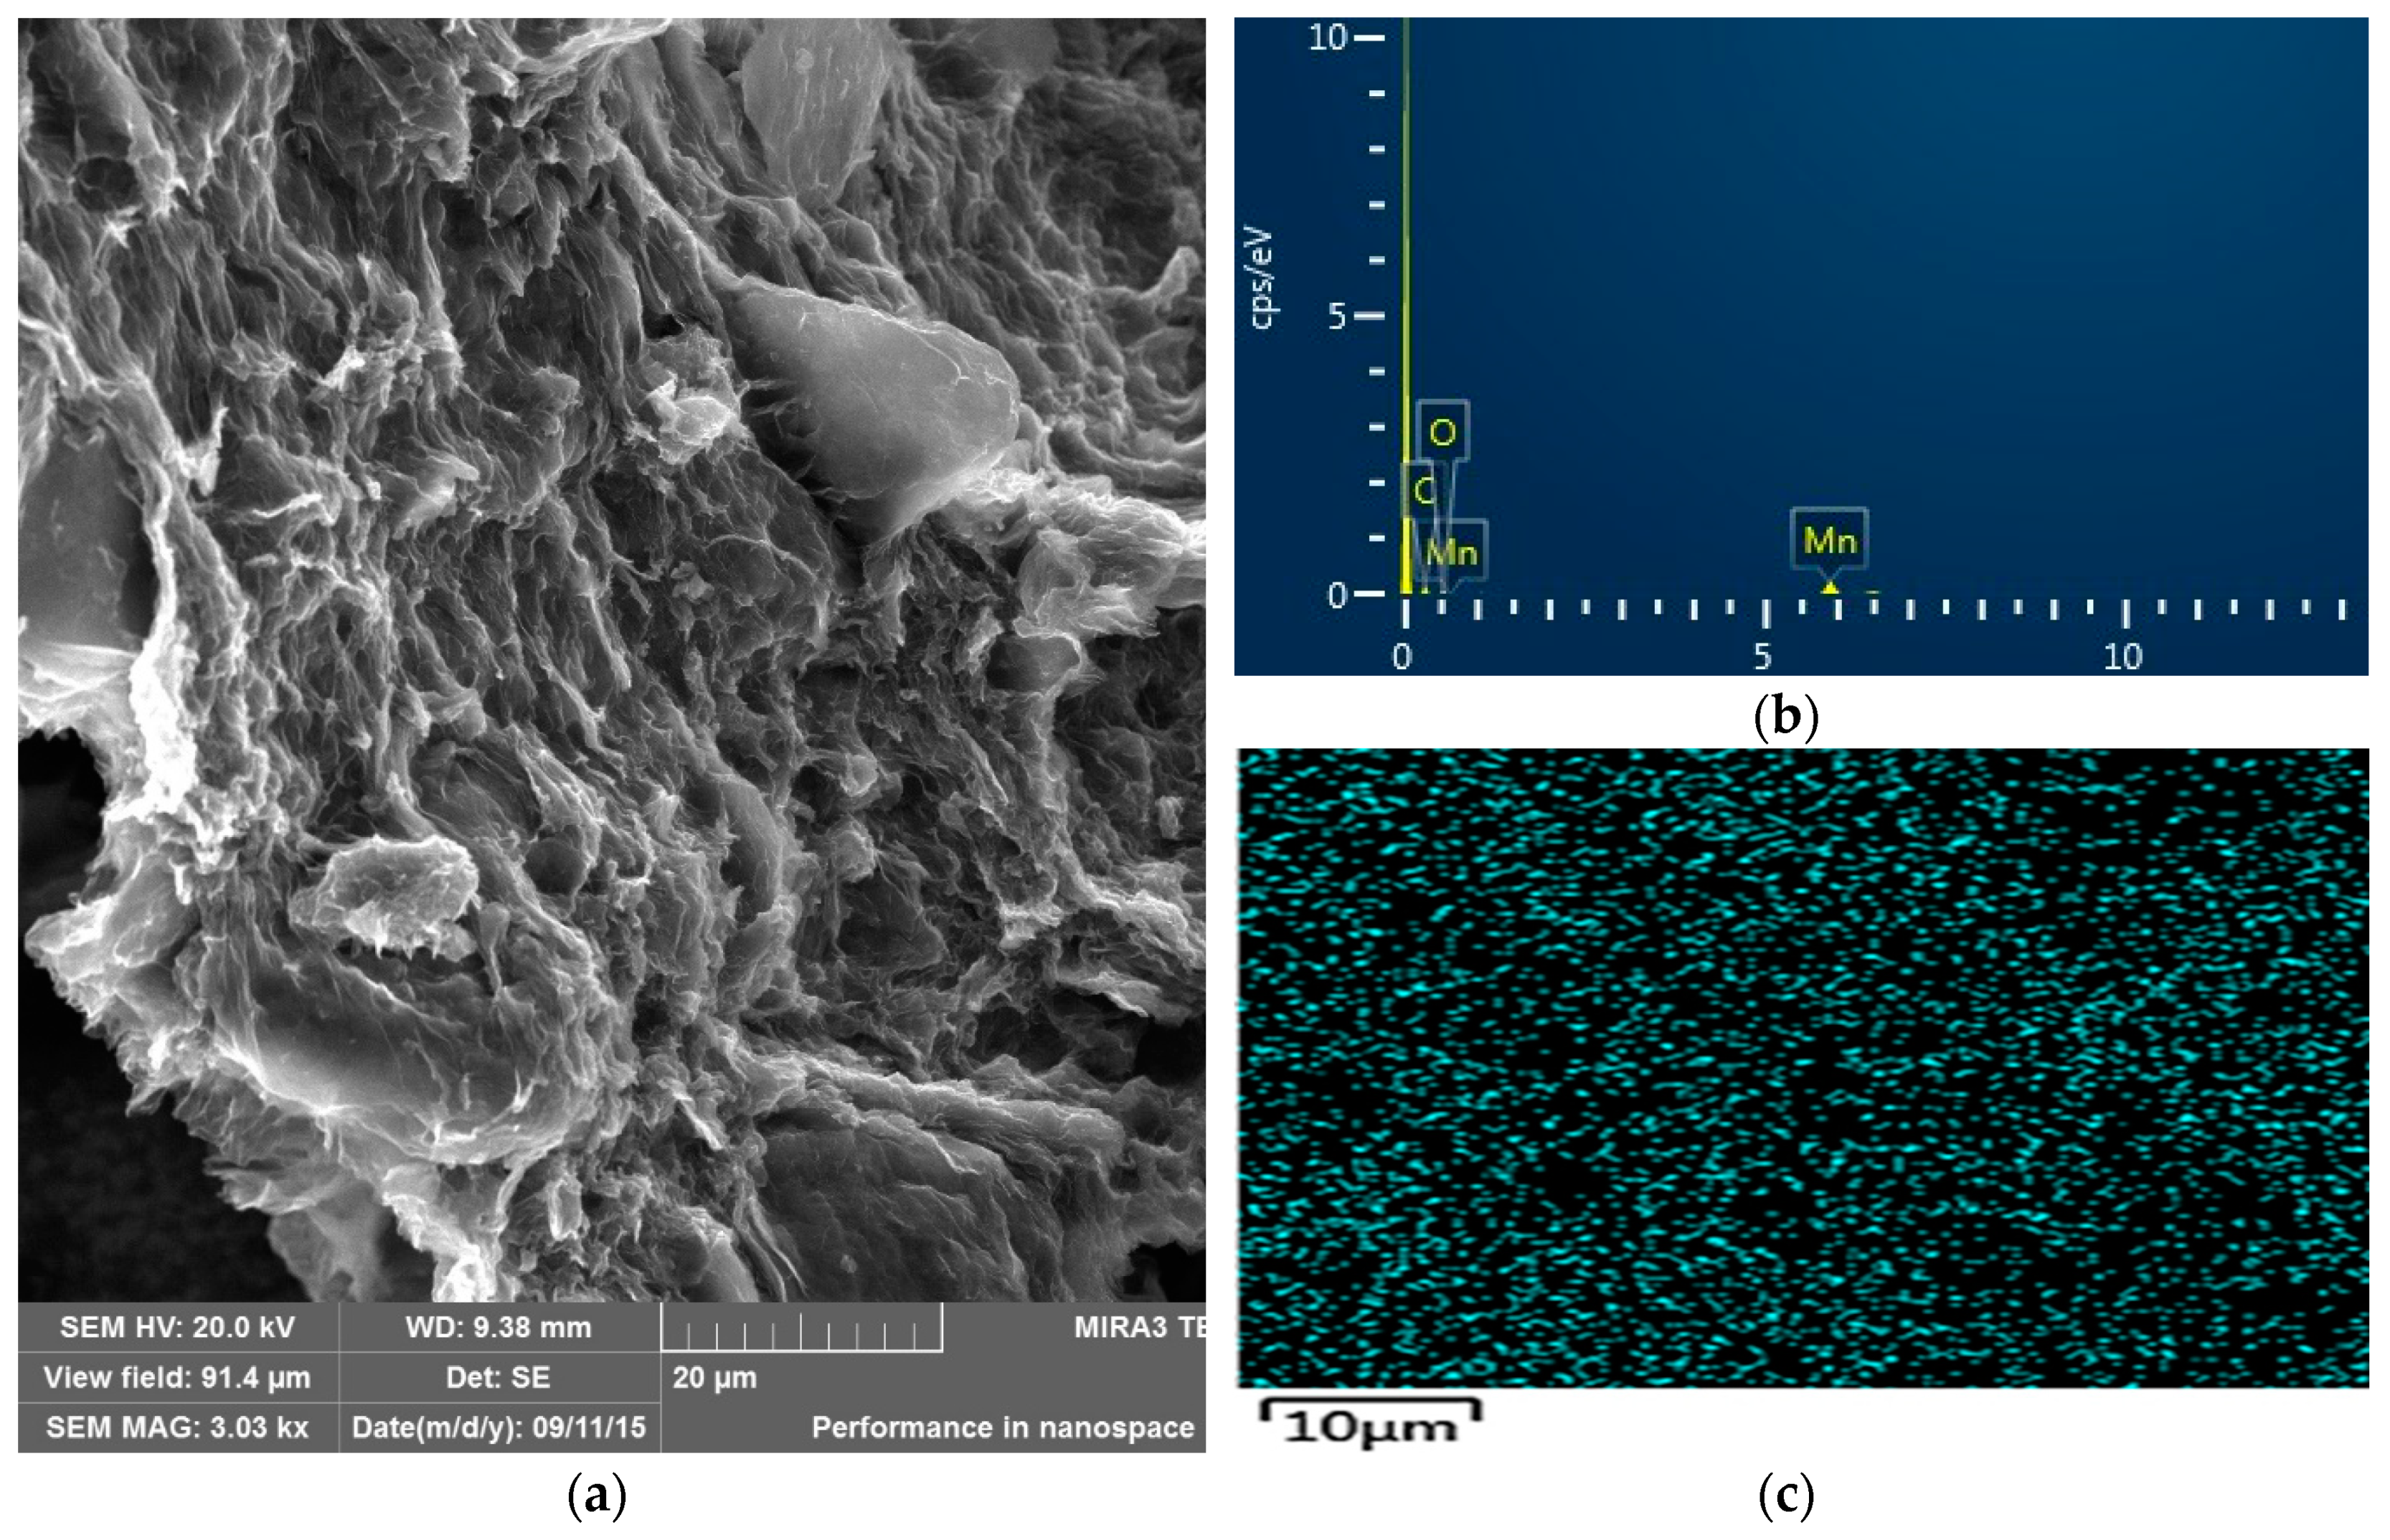
The morphology, size, and microstructure of the nanocomposite catalyst were also characterized by SEM, and the results are presented in Figure 2. SEM images of the GO-MnO2 nanocomposite revealed a partially layered structure of this nanocomposite, which was indicative of the partial exfoliation of GO in the composite. The energy dispersive spectroscopy (EDS) spectra of GO-MnO2 revealed that the detectable elements were manganese, carbon, and oxygen, with the carbon originating from the GO nanosheets, the oxygen from GO and MnO2, and the manganese from MnO2. The uniform distribution of MnO2 nanoparticles was testified in the SEM-elemental maps of the manganese for the nanocomposite (Figure 2c), which revealed MnO2 nanoparticles to be uniformly distributed on the surface of GO nanosheets.
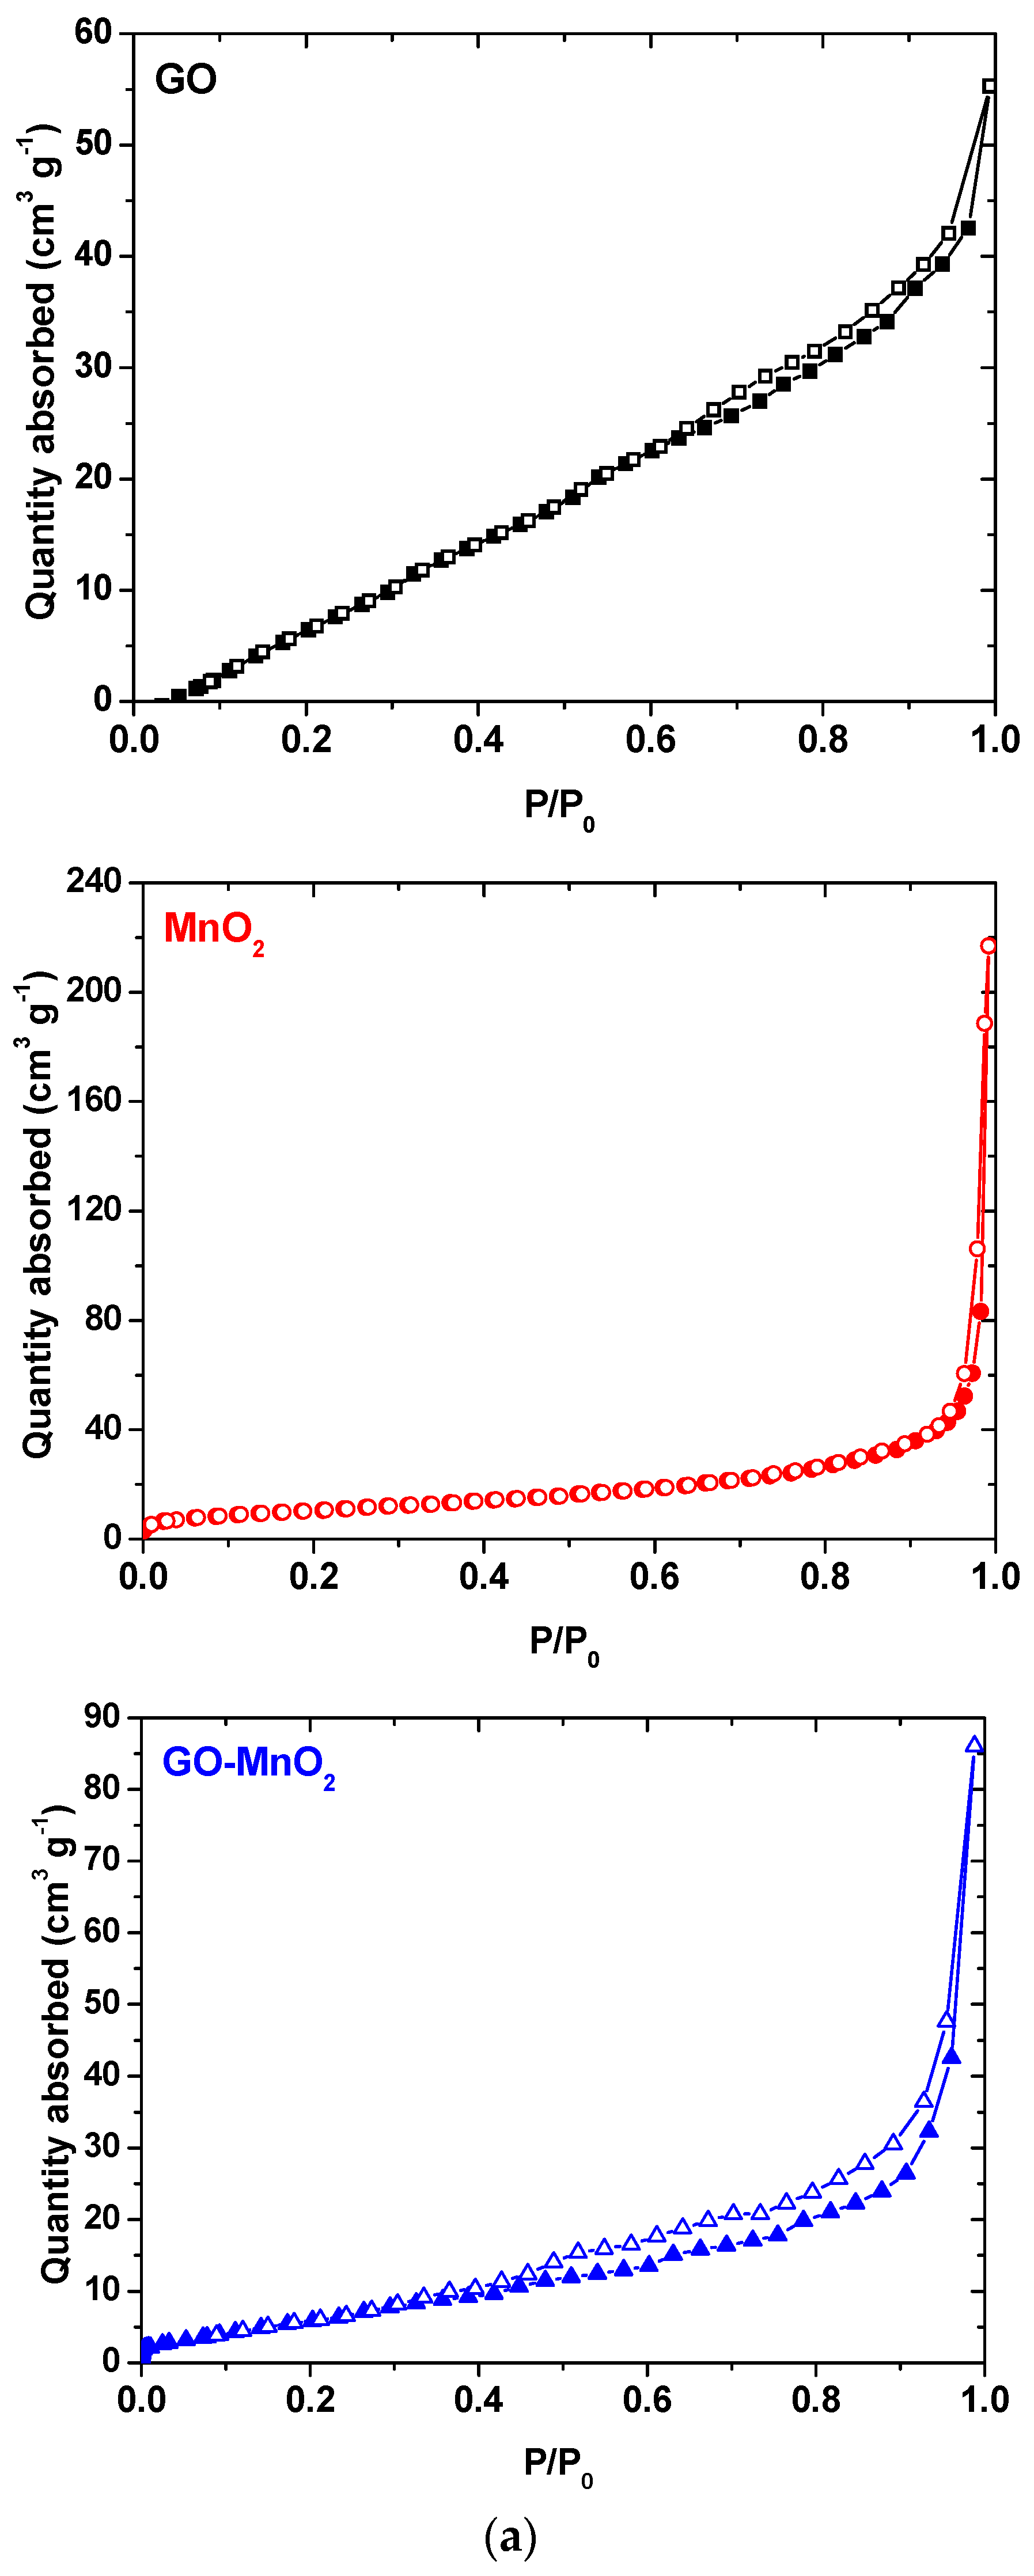
The N2 adsorption isotherms for MnO2 and GO-MnO2 are seen in Figure 3a, and the pore size distribution is seen in Figure 3b. The N2 adsorption isotherms for MnO2 indicated a lack of micropores and an increased nitrogen uptake at P/P0 > 0.95, which is indicative of external surface area. The isotherm for the GO-MnO2 composite did not present a variation in nitrogen uptake in the initial part of the isotherm—indicative of a lack of micropores. The textural parameters of the GO, MnO2, and the GO-MnO2 nanocomposite are seen in Table 1. Table 1 conveys that the specific surface area for the GO-MnO2 composite was 25.85 m2 g−1. It is seen that the specific surface area and the total pore volume of GO support increased slightly after impregnation with MnO2.
The textural changes, illustrated by the pore size distribution curves derived from density functional theory (DFT) calculations, are presented in Figure 3b. The GO-MnO2 composite was more porous than the parent GO and less porous than MnO2. During the composite formation, GO was oxidized, and defects that were created in the graphene layers contributed to the increase in porosity. MnO2 prepared could be considered a porous oxide with a surface area comparable to those previously reported [45,46].
From the textural results, we concluded that the small surface area and the volume of pores of GO-MnO2 could not be the main parameters for the high performance of the composite. For this reason, the surface chemistry was further investigated.
Differential thermogravimetric (DTG) curves (measured in nitrogen atmosphere) for MnO2, GO-MnO2, and GO are presented in Figure 4 for the sake of comparison. For all materials, the peaks at about 100 °C represented the removal of adsorbed water, while for MnO2, the peak at about 200 °C represented the dehydration of crystal water of manganese oxide [47,48]. For GO-MnO2, the peak at about 200–250 °C was due to the mass loss from the removal of the oxygen-containing functional surface groups. For the GO-MnO2 composite, a decrease in the peak intensity was seen and was due to the decrease in the oxygen containing surface groups after the composite formation. The complex peaks between 300 and 600 °C may represent the reduction of Mn(IV) to Mn(II) with a loss of oxygen [49]. MnO2 was reduced to Mn2O3 [30] and then to Mn3O4 and MnO. Then, Mn(II) was reduced between 750 and 800 °C.
3.2. Dye Degradation
The influence of several parameters—such as pH, ionic strength, and contact time—on the removal of RB5 by MnO2 and GO-MnO2 nanocomposite was initially investigated in order for the best performance conditions to be testified.
3.2.1. Effect of pH and Ionic Strength
The effect of the solution pH in a range of 3–9 on RB5 removal by MnO2 and GO-MnO2 is shown in Figure 5a. With an increase in the pH value, the RB5 removal of GO-MnO2 decreased from about 85% at pH 3.0 to about 60% at pH 9.0 with the maximum uptake at pH 3.0. These results suggested that RB5 removal from the aqueous solution by GO-MnO2 was facilitated in acidic solutions. The same trend was observed for the other materials. The oxidation of organic pollutants by MnO2 is usually pH-dependent [50] because of the pH-dependent redox potential of MnO2/Mn2+ and the speciation of organic pollutants [51]. The pH-dependence of RB5 removal by GO-MnO2 may be connected to either the degree of RB5 elimination (due to the oxidizing ability of MnO2 and thereby the pH of the solution, since reduction of MnO2 to Mn2+ requires the participation of protons), or to the fact that the RB5 oxidation by GO-MnO2 is considered a surface reaction connected to the surface chemical nature and charge.
Solution pH is important for adsorption as well as for degradation because it influences the surface charge of the adsorbent. Thus, we concluded that RB5 sorption on GO-MnO2 depends on the surface charge of GO-MnO2 at different pH values and also on the surface charge of RB5 species. Potentiometric titration results indicated that the total surface charge (Qsurf) of GO-MnO2 was negative for the pH range > 5 (Figure 5b) due to oxygen-containing surface functional groups. At pH values > 5, these groups were deprotonated, and negative surface charges were formed that resulted in electrostatic repulsions with the negatively charged surface groups of RB5 molecules. Consequently, there was a decrease in the adsorption ability of GO-MnO2 at this pH range. At pH values < 5, these oxygen-containing functional groups were protonated, and positive surface charges were formed that resulted in electrostatic attractions with the negatively charged surface groups of RB5 molecules. Consequently, there was an increase in the adsorption ability of GO-MnO2 at this pH range. For pH values < 5, since the pKa of RB5 is 10.16, at these pH values (pH < pKa), the interactions between RB5 molecule and the composite’s surface were between –OH2+ surface groups of the composite and the molecular form of the dye molecule. Garcia et al. [52] calculated the partial negative charges of the RB5 molecule, as sulfonate (−0.8677), sulfate (−0.8641), sulfonic (−0.8294), and hydroxyl (−0.2496). The adsorption of the dye onto a positively charged surface could be attributed to the sulfonate groups it possesses due to the larger density of electronic charges [53]. Since the maximum removal for GO-MnO2 was attained at a pH of 3.0, equilibrium and kinetic experiments were performed at this pH.
For GO-MnO2 nanocomposite, the adsorption capacity was found to increase slightly with the increase in NaCl concentration, as presented in Figure 5c. This may have been due to the salting out effect of electrolytes via the decrease in the solubility of RB5 [54]. Since the adsorption performance of GO-MnO2 was the best at 1 mol L−1 NaCl, all experiments were performed under these conditions.
3.2.2. Effect of Contact Time—Effect of H2O2
The experimental results presented in Figure 6 indicate that RB5 degradation on GO-MnO2 reached equilibrium in 60 min. The results were fitted to the pseudo-first-order and pseudo second-order kinetic models. The pseudo second-order kinetic model was found to better describe the results. The kinetic parameters are shown in Table 2.
The application of GO-MnO2 nanocomposite was also studied for the RB5 and degradation with the addition of H2O2 at a concentration that was estimated for the mineralization of the dye from the equation:
and was found to be 0.15 M.
The concentration of RB5 in the solution was measured at a certain reaction time, and the results are presented in Figure 6a. For an initial concentration of 60 mg L−1, about 70% of RB5 was removed by GO-MnO2 without the presence of H2O2 after 2 h, while the addition of 0.15 M H2O2 increased the percentage removal to about 99%. H2O2 improved the RB5 degradation due to •OH creation, according to a possible route described by Equation (6) [55]:
RB5–OH + •OH–H2O → •RB5 = O + •OH → CO2 + H2O.
The application of GO-MnO2 for RB5 degradation was also studied with the addition of H2O2 for 20 and 100 mg L−1 initial RB5 solution concentrations, and the results are presented in Figure 6a. These results convey that the increase in the initial concentration resulted in a decrease in the percentage of removal/degradation of the dye. Experiments in the presence of H2O2—but in the absence of catalyst—presented no decolorization of the solution. In presence of catalysts, the addition of H2O2 resulted in an increase in the removal/degradation. The percentage increase was different for the different initial concentration. The lower concentration resulted in a lower increase, indicating that the ratio C0 RB5/mM H2O2 is a crucial parameter.
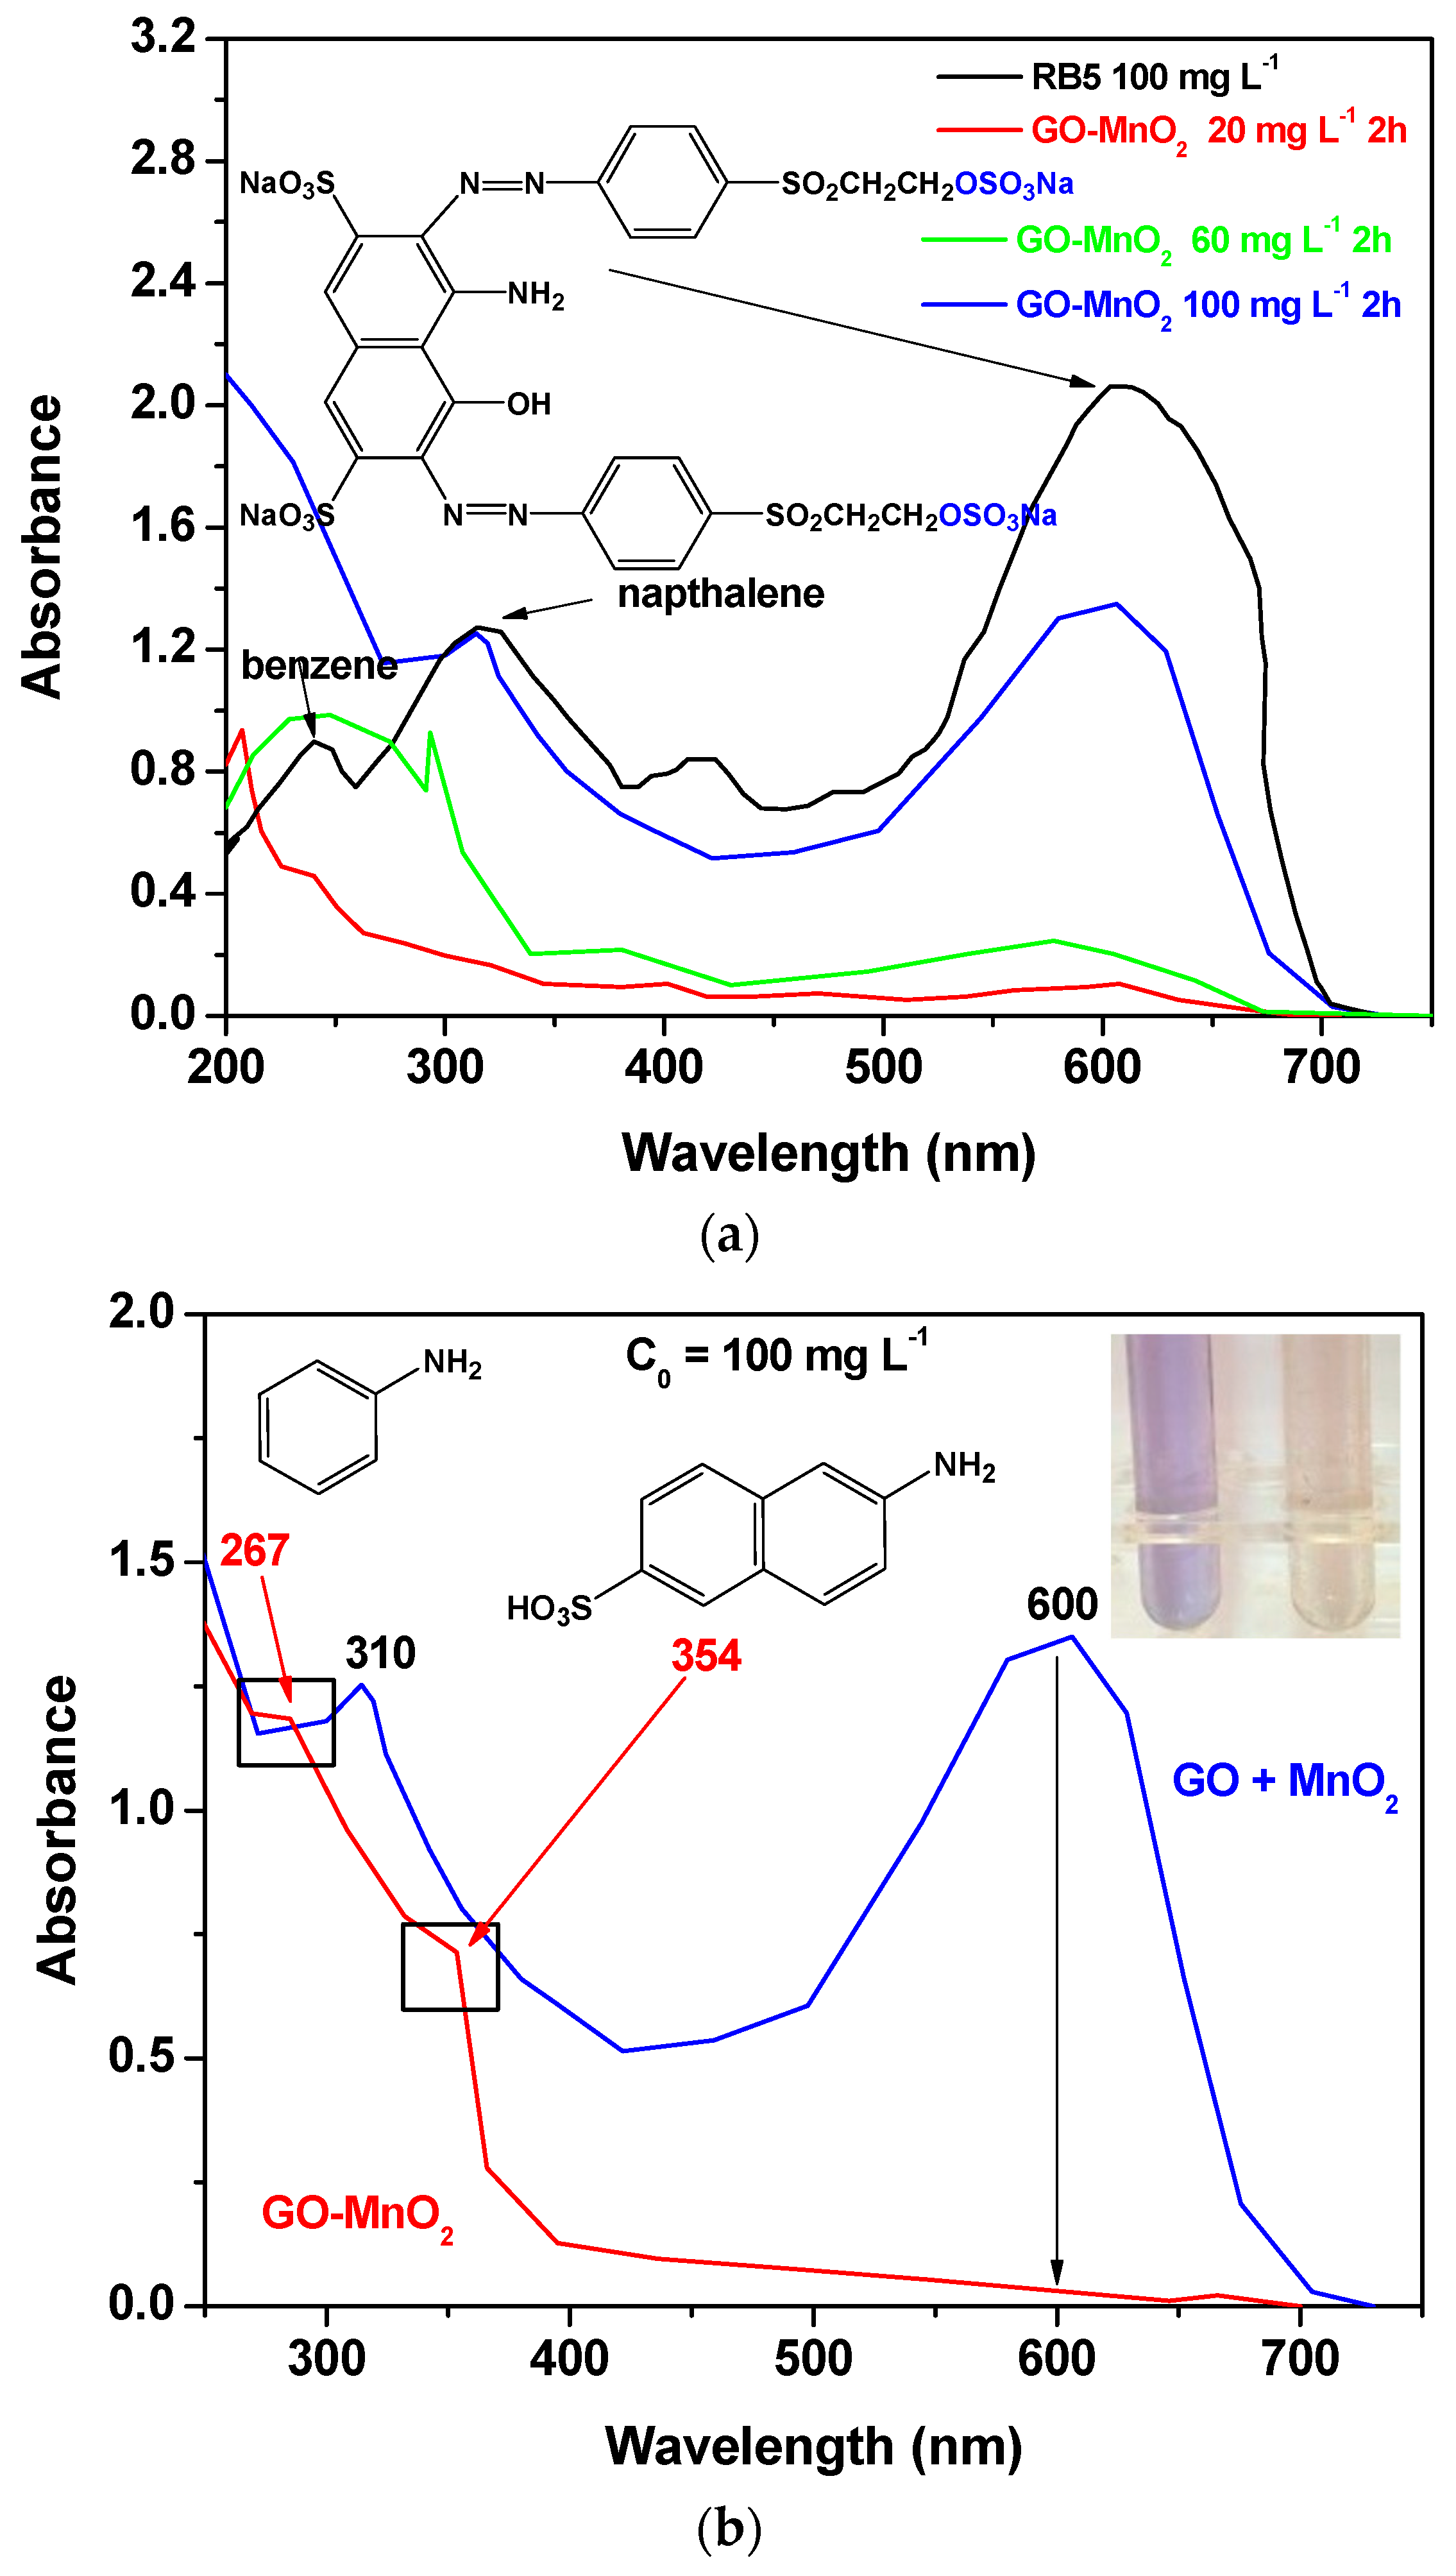
The degradation activity of the GO-MnO2 was also investigated spectroscopically by monitoring the decolorization efficiency in UV-Vis spectra (250–750 nm). Figure 7a shows the UV-vis spectra of the 100, 60, and 20 ppm RB5 aqueous solutions after 2 h contact time, with GO-MnO2 suspension at pH 3 in the absence of H2O2, along with the UV-vis spectra of the 100 ppm RB5 initial solution. From Figure 7a, it is seen that for the initial RB5 solution, the maximum absorbance was presented at λmax ~599 nm in the visible region, which could be attributed to the –N=N– azo bond of the dye. The intensity of this peak was relative to the azo dye concentration in the solution [56,57], and the blue color of the dye was attributed to the n→p transition of the non-bonding electrons to the anti-banding pi-group orbital of the double bond system. With the decrease in the concentration of the initial RB5 solution, the intensity of this band decreased due to the decolorization of the solution and the possible cleavage of the azo bonds for the formation of –NH2 groups.
In the presence of H2O2 (Figure 7b for 100 mg L−1 initial RB5 concentration), within 120 min, the band seemed to be disappearing, suggesting a nearly complete decolorization of RB5. The bands at 230 and 310 nm, which could be attributed to the benzene and naphthalene aromatic rings of RB5 [58,59,60], were also not present, while new absorption bands were presented at ~267 and ~354 nm, which could be attributed to aromatic amines and amino-naphthalene sulfonates [61].
The RB5 degradation activity of pure GO and of a mixture of GO and MnO2 was tested in the presence of H2O2. The results are illustrated in Figure 7c, from which it is clear that the nanocomposite presented a better performance from its precursor materials as well as from a mixture of the precursor materials at the same weight percentage as in the nanocomposite, which suggests the beneficial properties of the prepared nanocomposite. The above presented results are in agreement with those presented by Zhang et al. [62] (with amorphous zero-valent iron) and Ben Mbarek et al. [63] (with Mn-Al particles as the decolorizing material for RB5 aqueous solutions).
3.3. Analysis of Surface Features
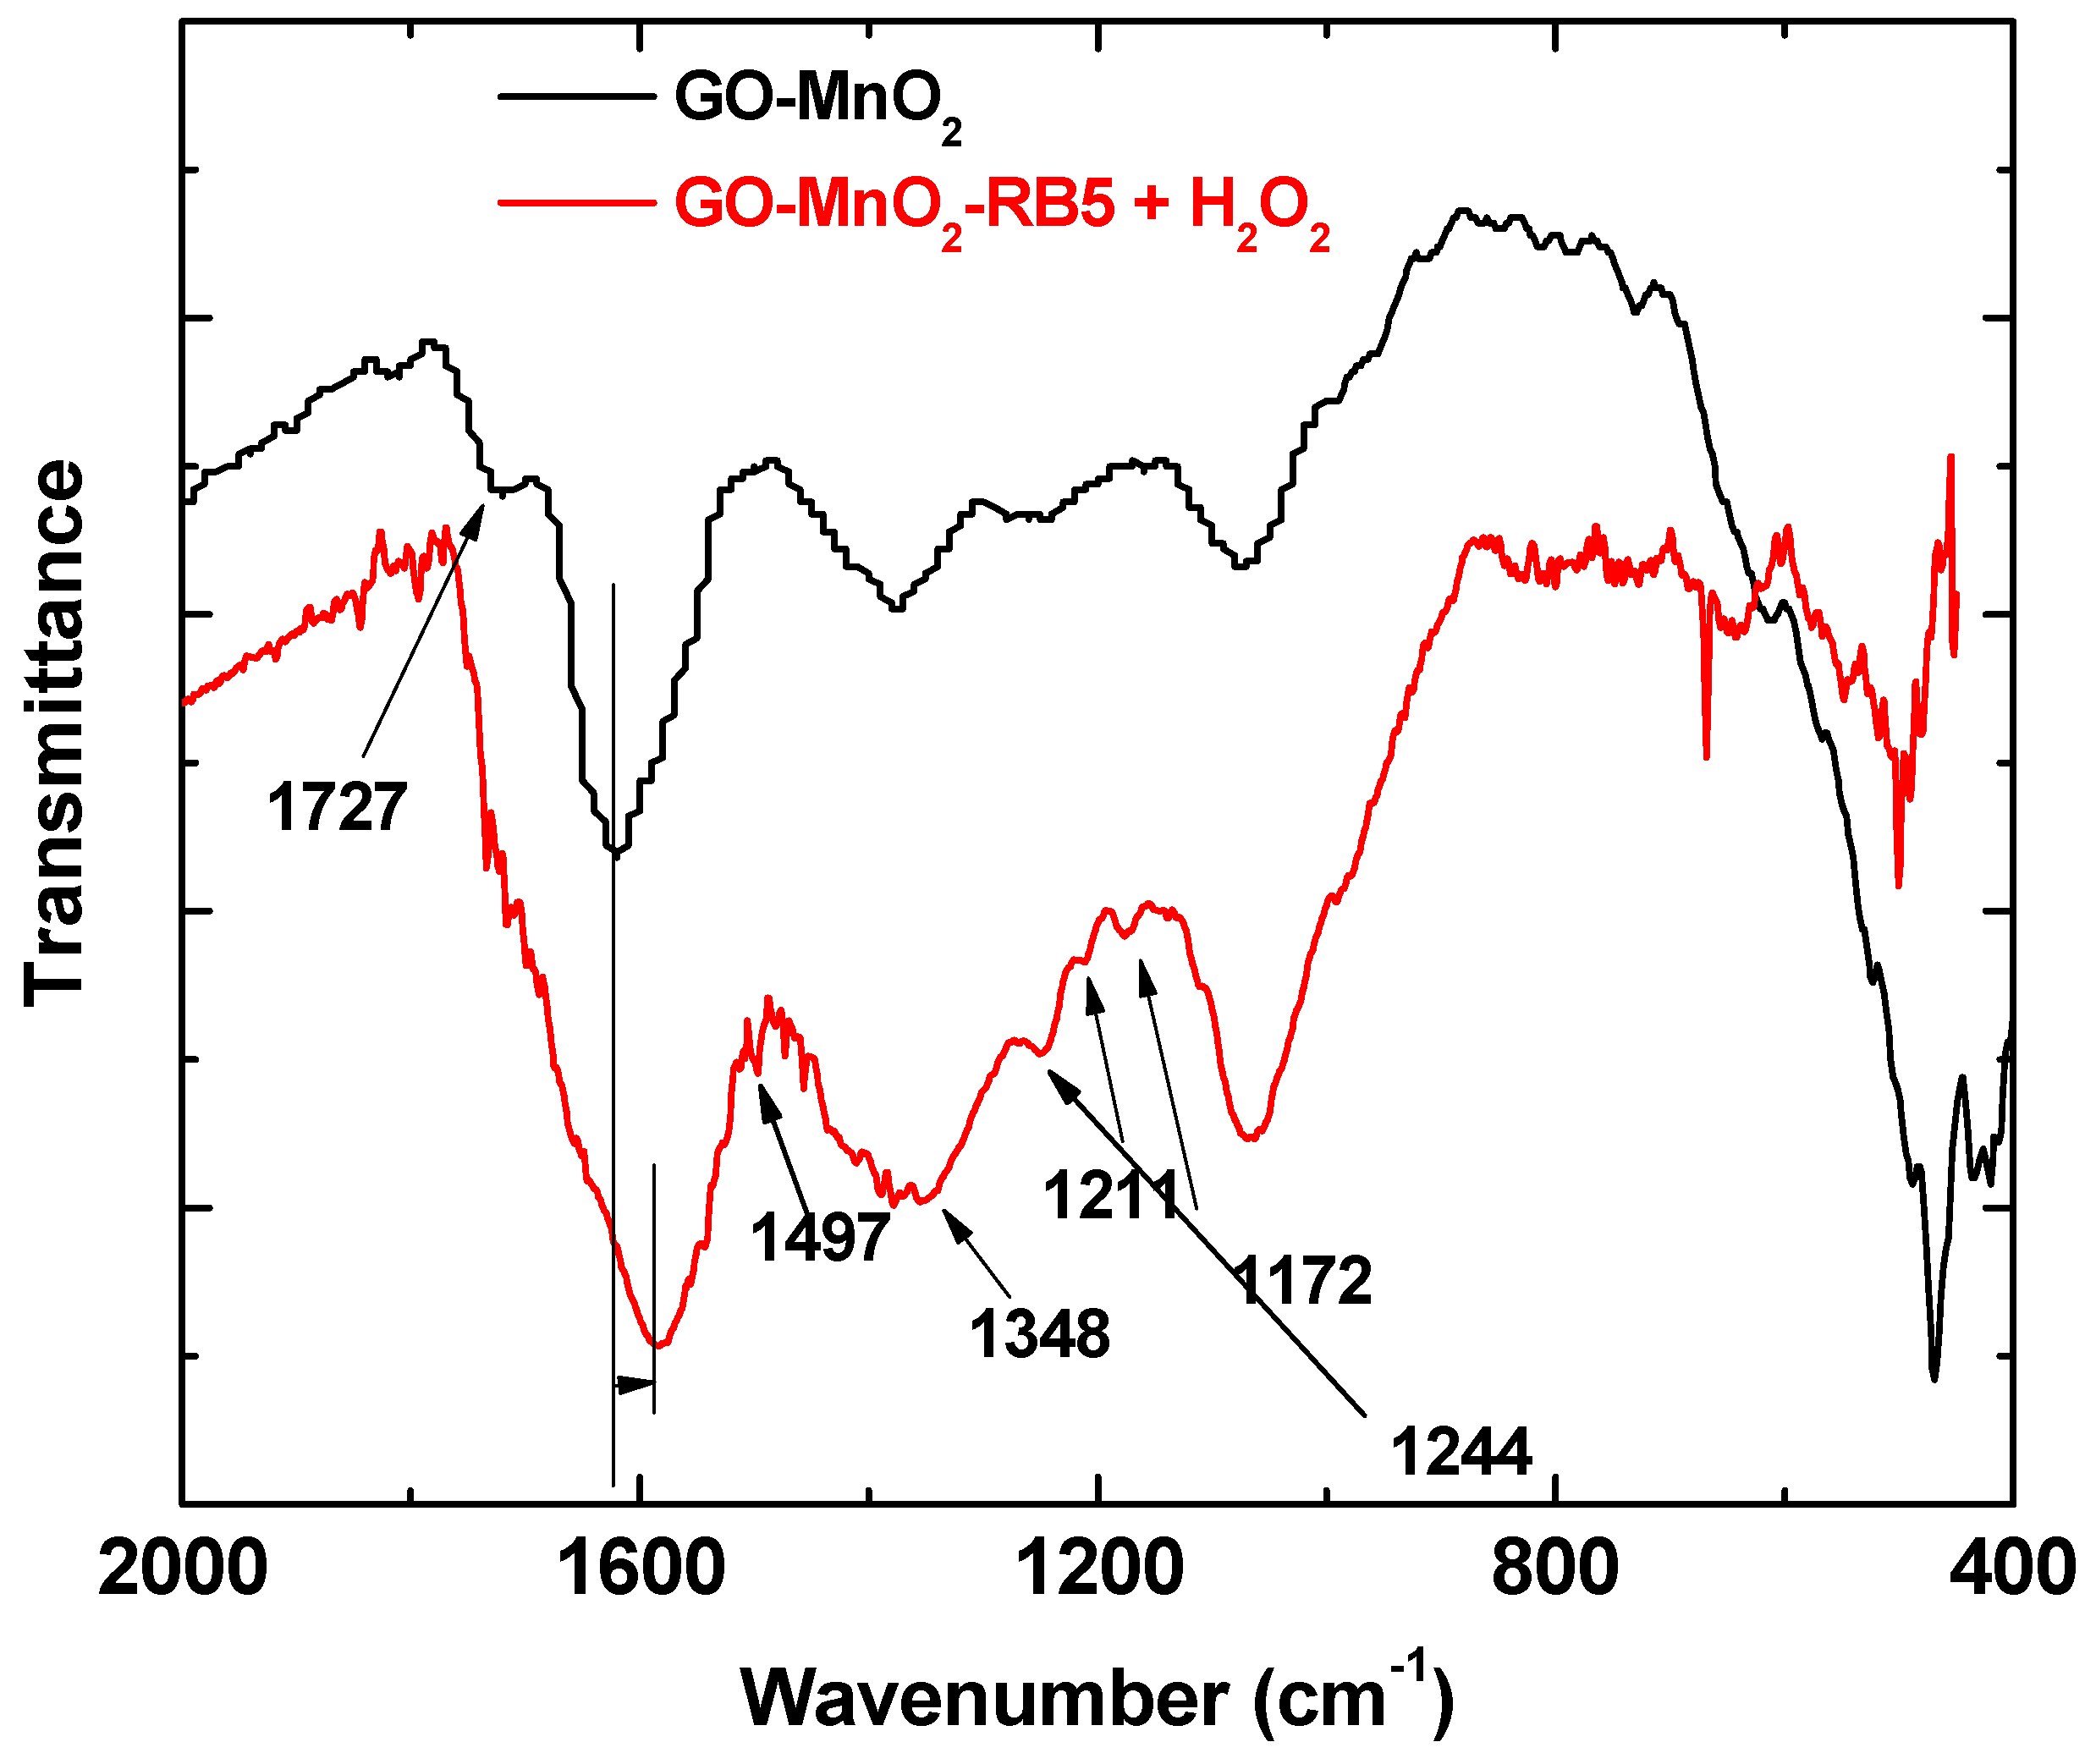
Figure 8 shows the FTIR spectra of GO-MnO2 nanocomposite. The spectrum for GO-MnO2 nanocomposite shows the characteristic absorption bands corresponding to graphite oxide from its oxygen-containing functional groups at 1055, 1220, 1380, and 1724 cm−1 due to the stretching vibration of alkoxy (C–O), C–O (epoxy), the deformation vibration of O–H carboxyl (C–OH), and the C=O stretching vibration of COOH groups (carbonyl C=O), respectively [47]. It should be noted that the bands between 1150 and 1380 cm−1 corresponding to the stretching vibration bands of C–O (epoxy) and to the deformation vibration of O–H carboxyl (C–OH) were less intense for the composites, indicating that these groups were involved in the nanocomposite formation. Moreover, the peak at about 725 cm−1 was attributed to the Mn–O–Mn band [64], and the symmetric vibration of Mn–O–H appeared at about 1060 cm−1 [65]. The presence of Mn–O–H indicated that Mn atoms of the MnO6 octahedron may have interacted with O atoms of the residual functional groups via a hydrogen bond or a covalent coordination bond [66].
RB5 molecules present on the spent nanocomposites’ surface caused a shift in the band attributed to the C=C bond of the aromatic ring, indicative of adsorption through pi-pi interactions between the aromatic ring of the nanocomposites and the RB5 [66]. In the spectra of the nanocomposite after the adsorption/degradation of RB5, new bands appeared, indicating that new products were additionally formed as a result of the RB5 degradation. The new bands that appeared at 1074 cm−1 could be attributed to C=N, while the bands at 1244 and 1211 cm−1 to C–N stretching and the shoulder at 1584 cm−1 could be attributed to N–H bending, indicating that primary amines were formed as a result of the cleavage of the –N=N– bond of RB5 [60]. The bands at 1170 cm−1 revealed that there were surface species with sulfone and/or sulfonate groups indicative of RB5 degradation; the bands at about 1350 cm−1 could be also attributed to these groups. The increase in the band at about 718 cm−1, which was due to the out of plane deformation vibration of aromatic C–H corresponding to para-substituted aromatic rings, suggested that new degradation products accumulated on the catalyst’ surface as a consequence of the oxidative reactions on the impregnated GO surface. These degradation products were adsorbed on the GO-MnO2 surface. The same results were presented by Mbarek et al. after the degradation of RB5 by Mn85Al15 particles. Méndez-Martınéz et al. also presented similar results [61] after the electrochemical treatment of the RB5 solution. For the spent MnO2, the bands at 1160 and 1117 cm−1 revealed that there were oxygen surface species that attributed to the sulfone and/or sulfonate groups, which was indicative of RB5 degradation. The bands at about 1360 cm−1 may have been due to these groups as well.
3.4. Degradation Mechanism
The GO-MnO2 nanocomposite presented a superior performance compared with the precursor materials. The contact between MnO2 nanoparticles and GO sheets prevented the MnO2 from leaching to the solution and efficiently catalyzed H2O2 to generate OH radicals, thus facilitating the dye degradation [67]. Dye molecules were initially adsorbed onto the GO surface by pi-pi conjugation mechanisms [68], as was revealed by FTIR results, and were degradated by MnO2. Small reaction products molecules, i.e., SO42− from the RB5 decomposition, were desorbed from the MnO2 surface, leading to the catalyst recovering [67]. Upon contact with the GO-MnO2 acidic surface (pH = 3), RB5 exchanged electrons with MnO2. RB5 degradation could be described by equations of redox reactions [63]:
In acidic environments, the concentration of H3O+ increased, resulting in increased active H2 and thus improving the azo dye degradation. The active H2 was seen during the reaction as bubbles in the solution, while the presence of OH− ions (Equation (8)) resulted in a pH increase in the dye solution. The pH was found to increase after the degradation from the initial level 3 to about 6.2 and 6.8 in the solutions with MnO2 and GO-MnO2 catalysts, respectively. It was concluded that RB5 degradation in the presence of either MnO2 or GO-MnO2 was based on H2 release and cleavage of –N=N– bonds to –NH2 groups.
H2O2 could increase the RB5 degradation due to a Fenton-like mechanism [69]. H2O2 could react with Mn ions, producing hydroxyl radicals that could attack and degrade the RB5 molecules according to the following equations [69]:
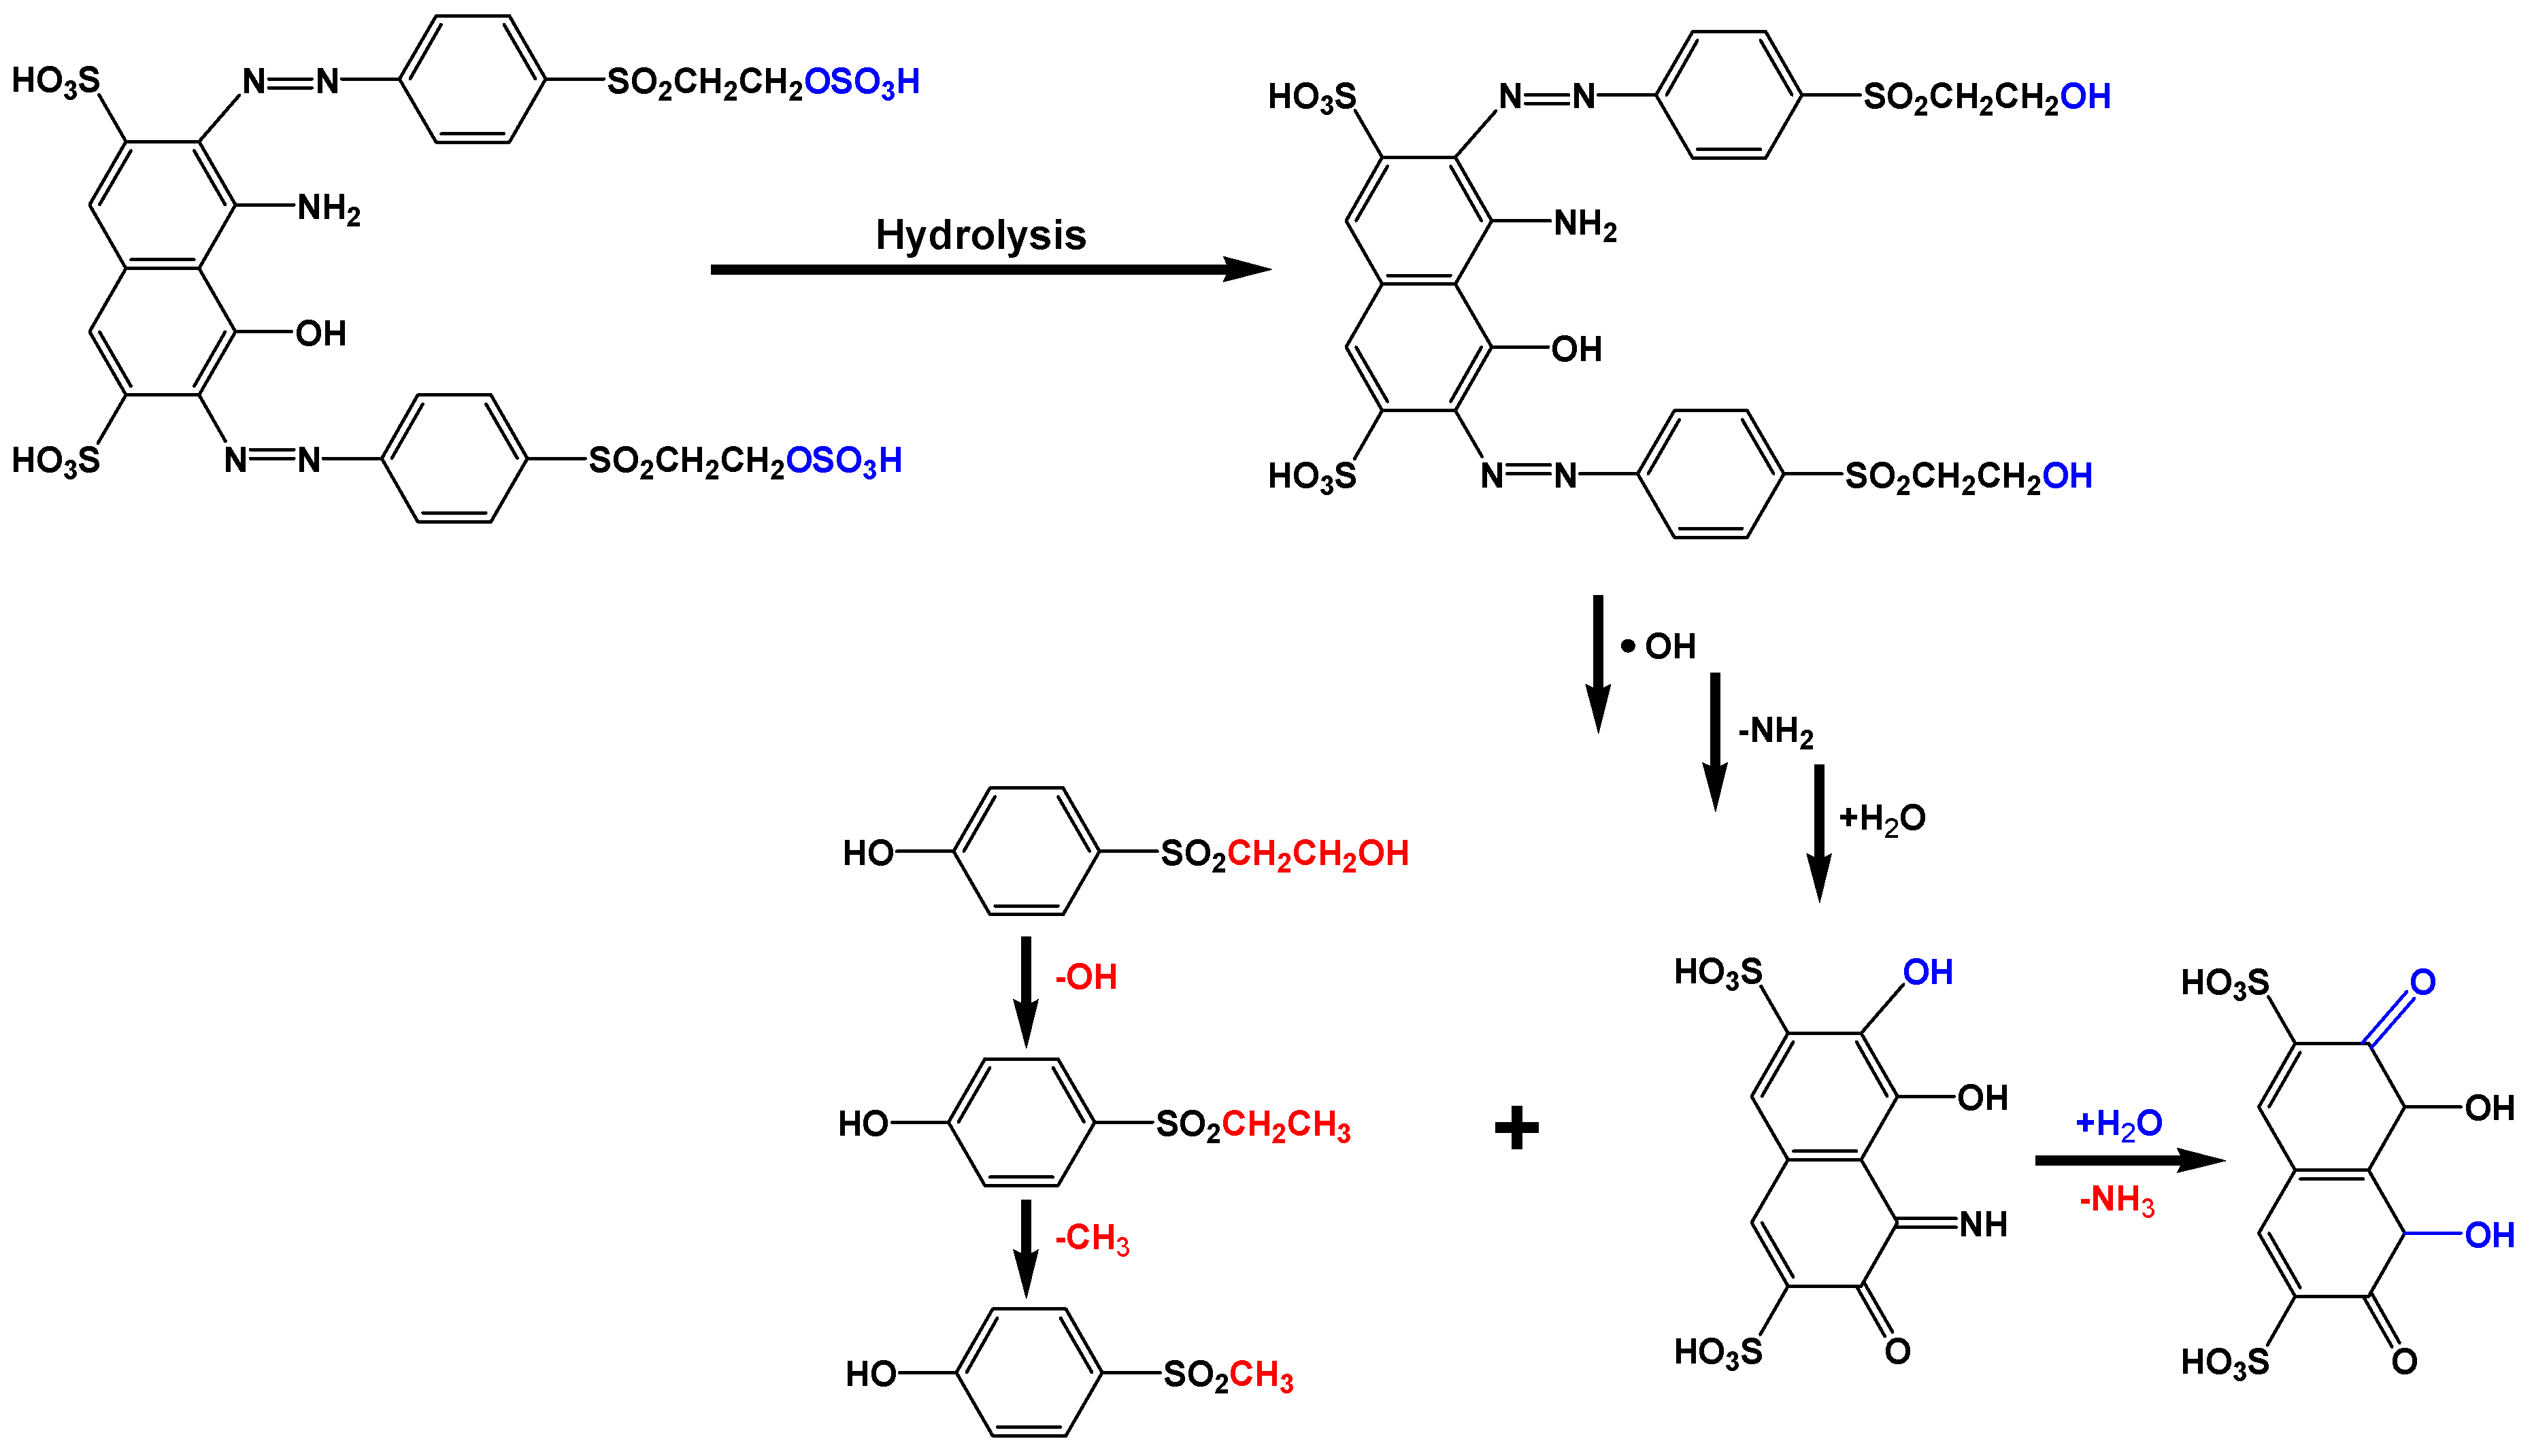
The cleavage of the azo bonds could lead to the generation of alkylsulfonyl phenolic compounds since the hydroxyl radicals could destroy the conjugated pi-systems according to Figure 9:
The presence of graphene oxide supported the adsorption ability for RB5, indicating that having a rich surface chemistry with a sufficient amount of hydroxyl groups leads to a sufficient RB5 degradation. The modification of GO may be further examined for improvement of the degradation process.
7. Conclusions
GO proved to be an effective carbonaceous support for manganese oxide (MnO2) for the preparation of a nanocomposite catalyst. The nanocomposite was tested for the degradation of RB5. The GO-MnO2 nanocomposite presented a high catalytic activity for the degradation/oxidation of RB5 in ambient conditions without light irradiation that reached equilibrium in 60 min. The GO-MnO2 catalytic activity was higher than that of its precursor materials. The addition of H2O2 resulted in an increase in the removal/degradation of RB5. Degradation may have been due to the cleavage of the azo bonds for the formation of –NH2 groups, which led to the decolorization of the solution and the formation of new products as aromatic amines and amino-naphthalene sulfonates. The higher RB5 degradation presented by GO-MnO2 nanocomposite was attributed to the presence of graphene oxide with a sufficient amount of hydroxyl groups, which led to a more sufficient RB5 degradation. The improved RB5 degradation presented by GO-MnO2 nanocomposite, which reached 98% removal/degradation with a 20% concentration of manganese oxide in the nanocomposite compared to 95% for pure manganese oxide, presented serious difficulties in the separation from aquatic solutions, making the GO a sufficient carbonaceous support for manganese oxide that improved the removal/degradation and the separation from the solution.
Author Contributions
This article was written by G.Z.K. and E.A.D. after personal invitation for the Special Issue “Wastewater Treatment Processes”. H.S. contributed to the experimental design.
Funding
This research received no external funding.
Conflicts of Interest
The authors declare no conflict of interest.
References
- Przystas, W.; Zablocka-Godlewska, E.; Grabinska-Sota, E. Biological removal of azo and triphenylmethane dyes and toxicity of process by-products. Water Air Soil Pollut. 2012, 223, 1581–1592. [Google Scholar] [CrossRef] [PubMed]
- Chetima, A.; Wahabou, A.; Zomegni, G.; Rahman, A.N.; Nde, D.B. Bleaching of neutral cotton seed oil using organic activated carbon in a batch system: Kinetics and adsorption isotherms. Processes 2018, 6, 22. [Google Scholar] [CrossRef]
- Di Marcoberardino, G.; Vitali, D.; Spinelli, F.; Binotti, M.; Manzolini, G. Green hydrogen production from raw biogas: A techno-economic investigation of conventional processes using pressure swing adsorption unit. Processes 2018, 6, 19. [Google Scholar] [CrossRef]
- Yang, F.; Chen, S.; Shi, C.; Xue, F.; Zhang, X.; Ju, S.; Xing, W. A facile synthesis of hexagonal spinel λ-MnO2 ion-sieves for highly selective Li+ adsorption. Processes 2018, 6, 59. [Google Scholar] [CrossRef]
- You, Z.; Zhang, L.; Zhang, S.; Sun, Y.; Shah, K. Treatment of oil-contaminated water by modified polysilicate aluminum ferric sulfate. Processes 2018, 6, 95. [Google Scholar] [CrossRef]
- Bian, Y.; Xiong, N.; Zhu, G. Technology for the remediation of water pollution: A review on the fabrication of metal organic frameworks. Processes 2018, 6, 122. [Google Scholar] [CrossRef]
- Bafana, A.; Devi, S.S.; Chakrabarti, T. Azo dyes: Past, present and the future. Environ. Rev. 2011, 19, 350–370. [Google Scholar] [CrossRef]
- Gupta, V.K.; Jain, R.; Mittal, A.; Saleh, T.A.; Nayak, A.; Agarwal, S.; Sikarwar, S. Photo-catalytic degradation of toxic dye amaranth on TiO2/UV in aqueous suspensions. Mater. Sci. Eng. C 2012, 32, 12–17. [Google Scholar] [CrossRef]
- Gupta, V.K.; Jain, R.; Nayak, A.; Agarwal, S.; Shrivastava, M. Removal of the hazardous dye-tartrazine by photodegradation on titanium dioxide surface. Mater. Sci. Eng. C 2011, 31, 1062–1067. [Google Scholar] [CrossRef]
- Vijayaraghavan, J.; Sardhar Basha, S.J.; Jegan, J. A review on efficacious methods to decolorize reactive azo dye. J. Urban Environ. Eng. 2013, 7, 30–47. [Google Scholar] [CrossRef]
- Han, F.; Kambala, V.S.R.; Srinivasan, M.; Rajarathnam, D.; Naidu, R. Tailored titanium dioxide photocatalysts for the degradation of organic dyes in wastewater treatment: A review. Appl. Catal. A Gen. 2009, 359, 25–40. [Google Scholar] [CrossRef]
- Nakata, K.; Fujishima, A. TiO2 photocatalysis: Design and applications. J. Photochem. Photobiol. C Photochem. Rev. 2012, 13, 169–189. [Google Scholar] [CrossRef]
- Rauf, M.A.; Ashraf, S.S. Fundamental principles and application of heterogeneous photocatalytic degradation of dyes in solution. Chem. Eng. J. 2009, 151, 10–18. [Google Scholar] [CrossRef]
- Yin, B.; Zhang, S.; Jiao, Y.; Liu, Y.; Qu, F.; Wu, X. Facile synthesis of ultralong MnO2 nanowires as high performance supercapacitor electrodes and photocatalysts with enhanced photocatalytic activities. CrystEngComm 2014, 16, 9999–10005. [Google Scholar] [CrossRef]
- Caliskan, N.; Kul, A.R.; Alkan, S.; Sogut, E.G.; Alacabey, İ. Adsorption of Zinc(II) on diatomite and manganese-oxide-modified diatomite: A kinetic and equilibrium study. J. Hazard. Mater. 2011, 193, 27–36. [Google Scholar] [CrossRef] [PubMed]
- Mei, J.; Zhang, L.; Niu, Y. Fabrication of the magnetic manganese dioxide/graphene nanocomposite and its application in dye removal from the aqueous solution at room temperature. Mater. Res. Bull. 2015, 70, 82–86. [Google Scholar] [CrossRef]
- Tang, J.; Mu, B.; Wang, W.; Zheng, M.; Wang, A. Fabrication of manganese dioxide/carbon/attapulgite composites derived from spent bleaching earth for adsorption of Pb(II) and brilliant green. RSC Adv. 2016, 6, 36534–36543. [Google Scholar] [CrossRef]
- Debnath, B.; Roy, A.S.; Kapri, S.; Bhattacharyya, S. Efficient dye degradation catalyzed by manganese oxide nanoparticles and the role of cation valence. ChemistrySelect 2016, 1, 4265–4273. [Google Scholar] [CrossRef]
- Chacón-Patiño, M.L.; Blanco-Tirado, C.; Hinestroza, J.P.; Combariza, M.Y. Biocomposite of nanostructured MnO2 and fique fibers for efficient dye degradation. Green Chem. 2013, 15, 2920–2928. [Google Scholar] [CrossRef]
- Das, S.; Samanta, A.; Jana, S. Light-assisted synthesis of hierarchical flower-like MnO2 nanocomposites with solar light induced enhanced photocatalytic activity. ACS Sustain. Chem. Eng. 2017, 5, 9086–9094. [Google Scholar] [CrossRef]
- Zhang, Y.X.; Guo, X.L.; Huang, M.; Hao, X.D.; Yuan, Y.; Hua, C. Engineering birnessite-type MnO2 nanosheets on fiberglass for pH-dependent degradation of methylene blue. J. Phys. Chem. Solids 2015, 83, 40–46. [Google Scholar] [CrossRef]
- Vandenbroucke, A.M.; Mora, M.; Jiménez-Sanchidrián, C.; Romero-Salguero, F.J.; De Geyter, N.; Leys, C.; Morent, R. Tce abatement with a plasma-catalytic combined system using MnO2 as catalyst. Appl. Catal. B Environ. 2014, 156–157, 94–100. [Google Scholar] [CrossRef]
- Liang, H.; Sun, H.; Patel, A.; Shukla, P.; Zhu, Z.H.; Wang, S. Excellent performance of mesoporous Co3O4/MnO2 nanoparticles in heterogeneous activation of peroxymonosulfate for phenol degradation in aqueous solutions. Appl. Catal. B Environ. 2012, 127, 330–335. [Google Scholar] [CrossRef]
- Adán-Más, A.; Wei, D. Photoelectrochemical properties of graphene and its derivatives. Nanomaterials 2013, 3, 325–356. [Google Scholar] [CrossRef] [PubMed]
- Dreyer, D.R.; Park, S.; Bielawski, C.W.; Ruoff, R.S. The chemistry of graphene oxide. Chem. Soc. Rev. 2010, 39, 228–240. [Google Scholar] [CrossRef]
- Krishnamoorthy, K.; Veerapandian, M.; Yun, K.; Kim, S.J. The chemical and structural analysis of graphene oxide with different degrees of oxidation. Carbon 2013, 53, 38–49. [Google Scholar] [CrossRef]
- Yu, J.; Huang, H.; Gan, Y.; Xia, Y.; Liang, C.; Zhang, J.; Tao, X.; Zhang, W. A new strategy for the construction of 3D TiO2 nanowires/reduced graphene oxide for high-performance lithium/sodium batteries. J. Mater. Chem. A 2018, 6, 24256–24266. [Google Scholar] [CrossRef]
- Fei, F.; Cseri, L.; Szekely, G.; Blanford, C.F. Robust covalently cross-linked polybenzimidazole/graphene oxide membranes for high-flux organic solvent nanofiltration. ACS Appl. Mater. Interfaces 2018, 10, 16140–16147. [Google Scholar] [CrossRef]
- Cseri, L.; Baugh, J.; Alabi, A.; AlHajaj, A.; Zou, L.; Dryfe, R.A.W.; Budd, P.M.; Szekely, G. Graphene oxide–polybenzimidazolium nanocomposite anion exchange membranes for electrodialysis. J. Mater. Chem. A 2018, 6, 24728–24739. [Google Scholar] [CrossRef]
- Chen, W.; Li, D.; Tian, L.; Xiang, W.; Wang, T.; Hu, W.; Hu, Y.; Chen, S.; Chen, J.; Dai, Z. Synthesis of graphene quantum dots from natural polymer starch for cell imaging. Green Chem. 2018, 20, 4438–4442. [Google Scholar] [CrossRef]
- He, Y.; Chen, W.; Li, X.; Zhang, Z.; Fu, J.; Zhao, C.; Xie, E. Freestanding three-dimensional graphene/MnO2 composite networks as ultralight and flexible supercapacitor electrodes. ACS Nano 2013, 7, 174–182. [Google Scholar] [CrossRef]
- Hu, M.; Hui, K.S.; Hui, K.N. Role of graphene in MnO2/graphene composite for catalytic ozonation of gaseous toluene. Chem. Eng. J. 2014, 254, 237–244. [Google Scholar] [CrossRef]
- Hummers, W.S., Jr.; Offeman, R.E. Preparation of graphitic oxide. J. Am. Chem. Soc. 1958, 80, 1339. [Google Scholar] [CrossRef]
- Ma, S.-B.; Ahn, K.-Y.; Lee, E.-S.; Oh, K.-H.; Kim, K.-B. Synthesis and characterization of manganese dioxide spontaneously coated on carbon nanotubes. Carbon 2007, 45, 375–382. [Google Scholar] [CrossRef]
- Ma, L.; Shen, X.; Ji, Z.; Zhu, G.; Zhou, H. Ag nanoparticles decorated MnO2/reduced graphene oxide as advanced electrode materials for supercapacitors. Chem. Eng. J. 2014, 252, 95–103. [Google Scholar] [CrossRef]
- Vieira, R.S.; Beppu, M.M. Interaction of natural and crosslinked chitosan membranes with Hg(II) ions. Colloid Surf. A 2006, 279, 196–207. [Google Scholar] [CrossRef]
- Lagergren, S. About the theory of so-called adsorption of soluble substances. Handlingar 1898, 24, 1–39. [Google Scholar]
- Ho, Y.S.; Ng, J.C.Y.; McKay, G. Kinetics of pollutant sorption by biosorbents: Review. Sep. Purif. Methods 2000, 29, 189–232. [Google Scholar] [CrossRef]
- Kim, I.-T.; Kouda, N.; Yoshimoto, N.; Morita, M. Preparation and electrochemical analysis of electrodeposited MnO2/C composite for advanced capacitor electrode. J. Power Sources 2015, 298, 123–129. [Google Scholar] [CrossRef]
- Liu, S.; Li, H.; Yan, L. Synthesis and photocatalytic activity of three-dimensional ZnS/CdS composites. Mater. Res. Bull. 2013, 48, 3328–3334. [Google Scholar] [CrossRef]
- Zhu, H.T.; Luo, J.; Yang, H.X.; Liang, J.K.; Rao, G.H.; Li, J.B.; Du, Z.M. Birnessite-type MnO2 nanowalls and their magnetic properties. J. Phys. Chem. C 2008, 112, 17089–17094. [Google Scholar] [CrossRef]
- Wu, Z.-S.; Ren, W.; Wang, D.-W.; Li, F.; Liu, B.; Cheng, H.-M. High-energy MnO2 nanowire/graphene and graphene asymmetric electrochemical capacitors. ACS Nano 2010, 4, 5835–5842. [Google Scholar] [CrossRef]
- Qu, J.; Shi, L.; He, C.; Gao, F.; Li, B.; Zhou, Q.; Hu, H.; Shao, G.; Wang, X.; Qiu, J. Highly efficient synthesis of graphene/MnO2 hybrids and their application for ultrafast oxidative decomposition of methylene blue. Carbon 2014, 66, 485–492. [Google Scholar] [CrossRef]
- Seredych, M.; Bandosz, T.J. Evaluation of GO/MnO2 composites as supercapacitors in neutral electrolytes: Role of graphite oxide oxidation level. J. Mater. Chem. 2012, 22, 23525–23533. [Google Scholar] [CrossRef]
- Tian, H.; He, J.; Liu, L.; Wang, D.; Hao, Z.; Ma, C. Highly active manganese oxide catalysts for low-temperature oxidation of formaldehyde. Micropor. Mesopor. Mater. 2012, 151, 397–402. [Google Scholar] [CrossRef] [Green Version]
- Jeong, Y.U.; Manthiram, A. Nanocrystalline manganese oxides for electrochemical capacitors with neutral electrolytes. J. Electrochem. Soc. India 2002, 149, A1419–A1422. [Google Scholar] [CrossRef]
- Seredych, M.; Bandosz, T.J. Manganese oxide and graphite oxide/MnO2 composites as reactive adsorbents of ammonia at ambient conditions. Micropor. Mesopor. Mater. 2012, 150, 55–63. [Google Scholar] [CrossRef]
- Feng, Q.; Kanoh, H.; Miyai, Y.; Ooi, K. Metal ion extraction/insertion reactions with todorokite-type manganese oxide in the aqueous phase. Chem. Mater. 1995, 7, 1722–1727. [Google Scholar] [CrossRef]
- Oba, M.; Oaki, Y.; Imai, H. A microbial-mineralization-inspired approach for synthesis of manganese oxide nanostructures with controlled oxidation states and morphologies. Adv. Funct. Mater. 2010, 20, 4279–4286. [Google Scholar] [CrossRef]
- Lin, S.-S.; Gurol, M.D. Catalytic decomposition of hydrogen peroxide on iron oxide: Kinetics, mechanism, and implications. Environ. Sci. Technol. 1998, 32, 1417–1423. [Google Scholar] [CrossRef]
- Xu, L.; Xu, C.; Zhao, M.; Qiu, Y.; Sheng, G.D. Oxidative removal of aqueous steroid estrogens by manganese oxides. Water Res. 2008, 42, 5038–5044. [Google Scholar] [CrossRef] [PubMed]
- Garcia, J.; Boroski, M.; da Silva, A.; Oliviera, J.; Nozaki, J.; Barreto, W. Solar and Trends in Solar Energy Research; Hough, T.P., Ed.; Nova Science Publishers: New York, NY, USA, 2006; pp. 107–132. [Google Scholar]
- Karadag, D.; Turan, M.; Akgul, E.; Tok, S.; Faki, A. Adsorption equilibrium and kinetics of Reactive Black 5 and Reactive Red 239 in aqueous solution onto surfactant-modified zeolite. J. Chem. Eng. Data 2007, 52, 1615–1620. [Google Scholar] [CrossRef]
- Bautista-Toledo, M.I.; Rivera-Utrilla, J.; Ocampo-Pérez, R.; Carrasco-Marín, F.; Sánchez-Polo, M. Cooperative adsorption of bisphenol-A and chromium(III) ions from water on activated carbons prepared from olive-mill waste. Carbon 2014, 73, 338–350. [Google Scholar] [CrossRef]
- Wolfenden, B.S.; Willson, R.L. Radical-cations as reference chromogens in kinetic studies of ono-electron transfer reactions: Pulse radiolysis studies of 2,2′-azinobis-(3-ethylbenzthiazoline-6-sulphonate). J. Chem. Soc. Perkin Trans. 1982, 2, 805–812. [Google Scholar] [CrossRef]
- Cao, J.; Wei, L.; Huang, Q.; Wang, L.; Han, S. Reducing degradation of azo dye by zero-valent iron in aqueous solution. Chemosphere 1999, 38, 565–571. [Google Scholar] [CrossRef]
- Nam, S.; Tratnyek, P.G. Reduction of azo dyes with zero-valent iron. Water Res. 2000, 34, 1837–1845. [Google Scholar] [CrossRef]
- Feng, W.; Nansheng, D.; Helin, H. Degradation mechanism of azo dye C.I. Reactive red 2 by iron powder reduction and photooxidation in aqueous solutions. Chemosphere 2000, 41, 1233–1238. [Google Scholar] [CrossRef]
- Stylidi, M.; Kondarides, D.I.; Verykios, X.E. Pathways of solar light-induced photocatalytic degradation of azo dyes in aqueous TiO2 suspensions. Appl. Catal. B Environ. 2003, 40, 271–286. [Google Scholar] [CrossRef]
- Bradu, C.; Frunza, L.; Mihalche, N.; Avramescu, S.-M.; Neaţă, M.; Udrea, I. Removal of Reactive Black 5 azo dye from aqueous solutions by catalytic oxidation using CuO/Al2O3 and NiO/Al2O3. Appl. Catal. B Environ. 2010, 96, 548–556. [Google Scholar] [CrossRef]
- Méndez-Martínez, A.J.; Dávila-Jiménez, M.M.; Ornelas-Dávila, O.; Elizalde-González, M.P.; Arroyo-Abad, U.; Sirés, I.; Brillas, E. Electrochemical reduction and oxidation pathways for Reactive Black 5 dye using nickel electrodes in divided and undivided cells. Electrochim. Acta 2012, 59, 140–149. [Google Scholar] [CrossRef]
- Zhang, M.; Lei, D.; Du, Z.; Yin, X.; Chen, L.; Li, Q.; Wang, Y.; Wang, T. Fast synthesis of SnO2/graphene composites by reducing graphene oxide with stannous ions. J. Mater. Chem. 2011, 21, 1673–1676. [Google Scholar] [CrossRef]
- Ben Mbarek, W.; Azabou, M.; Pineda, E.; Fiol, N.; Escoda, L.; Suñol, J.J.; Khitouni, M. Rapid degradation of azo-dye using Mn-Al powders produced by ball-milling. RSC Adv. 2017, 7, 12620–12628. [Google Scholar] [CrossRef]
- Liang, S.; Teng, F.; Bulgan, G.; Zong, R.; Zhu, Y. Effect of phase structure of MnO2 nanorod catalyst on the activity for CO oxidation. J. Phys. Chem. C 2008, 112, 5307–5315. [Google Scholar] [CrossRef]
- Vázquez-Olmos, A.; Redón, R.; Rodríguez-Gattorno, G.; Esther Mata-Zamora, M.; Morales-Leal, F.; Fernández-Osorio, A.L.; Saniger, J.M. One-step synthesis of Mn3O4 nanoparticles: Structural and magnetic study. J. Colloid Interface Sci. 2005, 291, 175–180. [Google Scholar] [CrossRef] [PubMed]
- Bele, S.; Samanidou, V.; Deliyanni, E. Effect of the reduction degree of graphene oxide on the adsorption of bisphenol A. Chem. Eng. Res. Des. 2016, 109, 573–585. [Google Scholar] [CrossRef]
- Li, Y.; Qu, J.; Gao, F.; Lv, S.; Shi, L.; He, C.; Sun, J. In situ fabrication of Mn3O4 decorated graphene oxide as a synergistic catalyst for degradation of methylene blue. Appl. Catal. B Environ. 2015, 162, 268–274. [Google Scholar] [CrossRef]
- Travlou, N.A.; Kyzas, G.Z.; Lazaridis, N.K.; Deliyanni, E.A. Graphite oxide/chitosan composite for reactive dye removal. Chem. Eng. J. 2013, 217, 256–265. [Google Scholar] [CrossRef]
- Ramesh, M.; Nagaraja, H.S.; Rao, M.P.; Anandan, S.; Huang, N.M. Fabrication, characterization and catalytic activity of α-MnO2 nanowires for dye degradation of Reactive Black 5. Mater. Lett. 2016, 172, 85–89. [Google Scholar] [CrossRef]
Figure 1.
XRD patterns of graphite oxide (GO), manganese oxide (MnO2), and GO-MnO2 nanocomposite. 2θ (degrees).
Figure 1.
XRD patterns of graphite oxide (GO), manganese oxide (MnO2), and GO-MnO2 nanocomposite. 2θ (degrees).

Figure 2.
(a) SEM images of GO-MnO2 nanocomposite; (b) SEM-EDS; (c) SEM-maps of the manganese distribution on the GO-MnO nanocomposite.
Figure 2.
(a) SEM images of GO-MnO2 nanocomposite; (b) SEM-EDS; (c) SEM-maps of the manganese distribution on the GO-MnO nanocomposite.

Figure 3.
(a) N2 adsorption isotherms for GO (black line), MnO2 (red line) and GO-MnO2; (blue line); (b) pore size distribution for GO, MnO2, and GO-MnO2.
Figure 3.
(a) N2 adsorption isotherms for GO (black line), MnO2 (red line) and GO-MnO2; (blue line); (b) pore size distribution for GO, MnO2, and GO-MnO2.

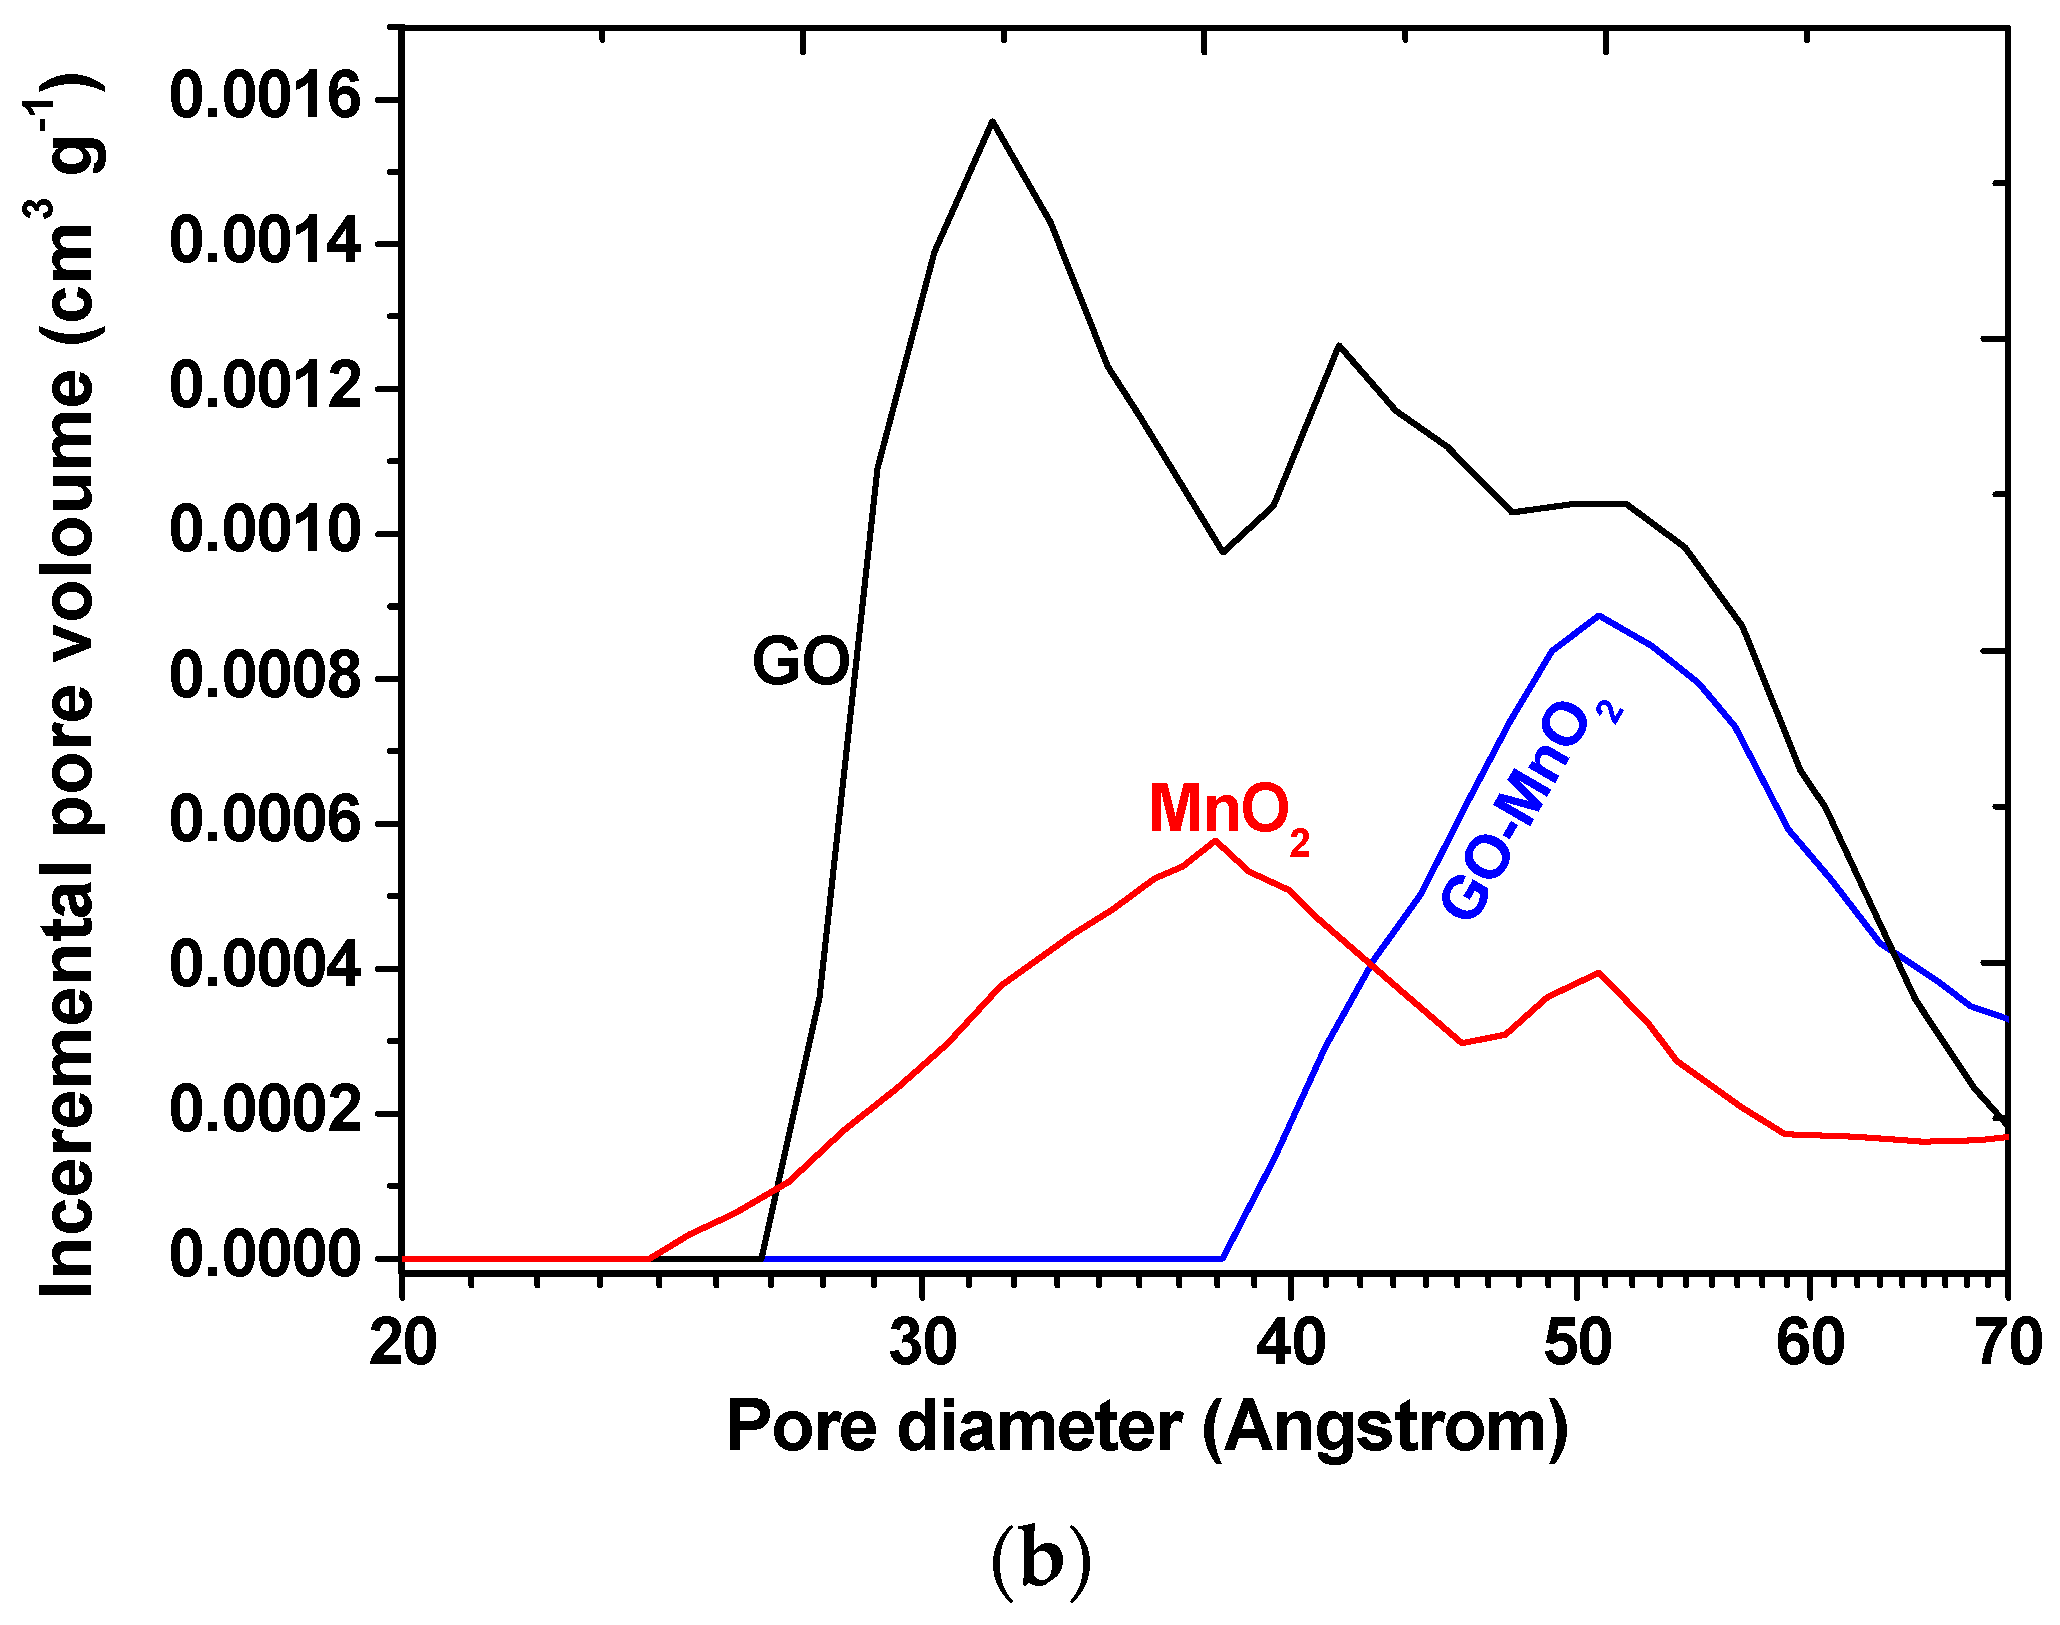
Figure 4.
Differential thermogravimetric (DTG) curves for GO, MnO2, and GO-MnO2 nanocomposite.
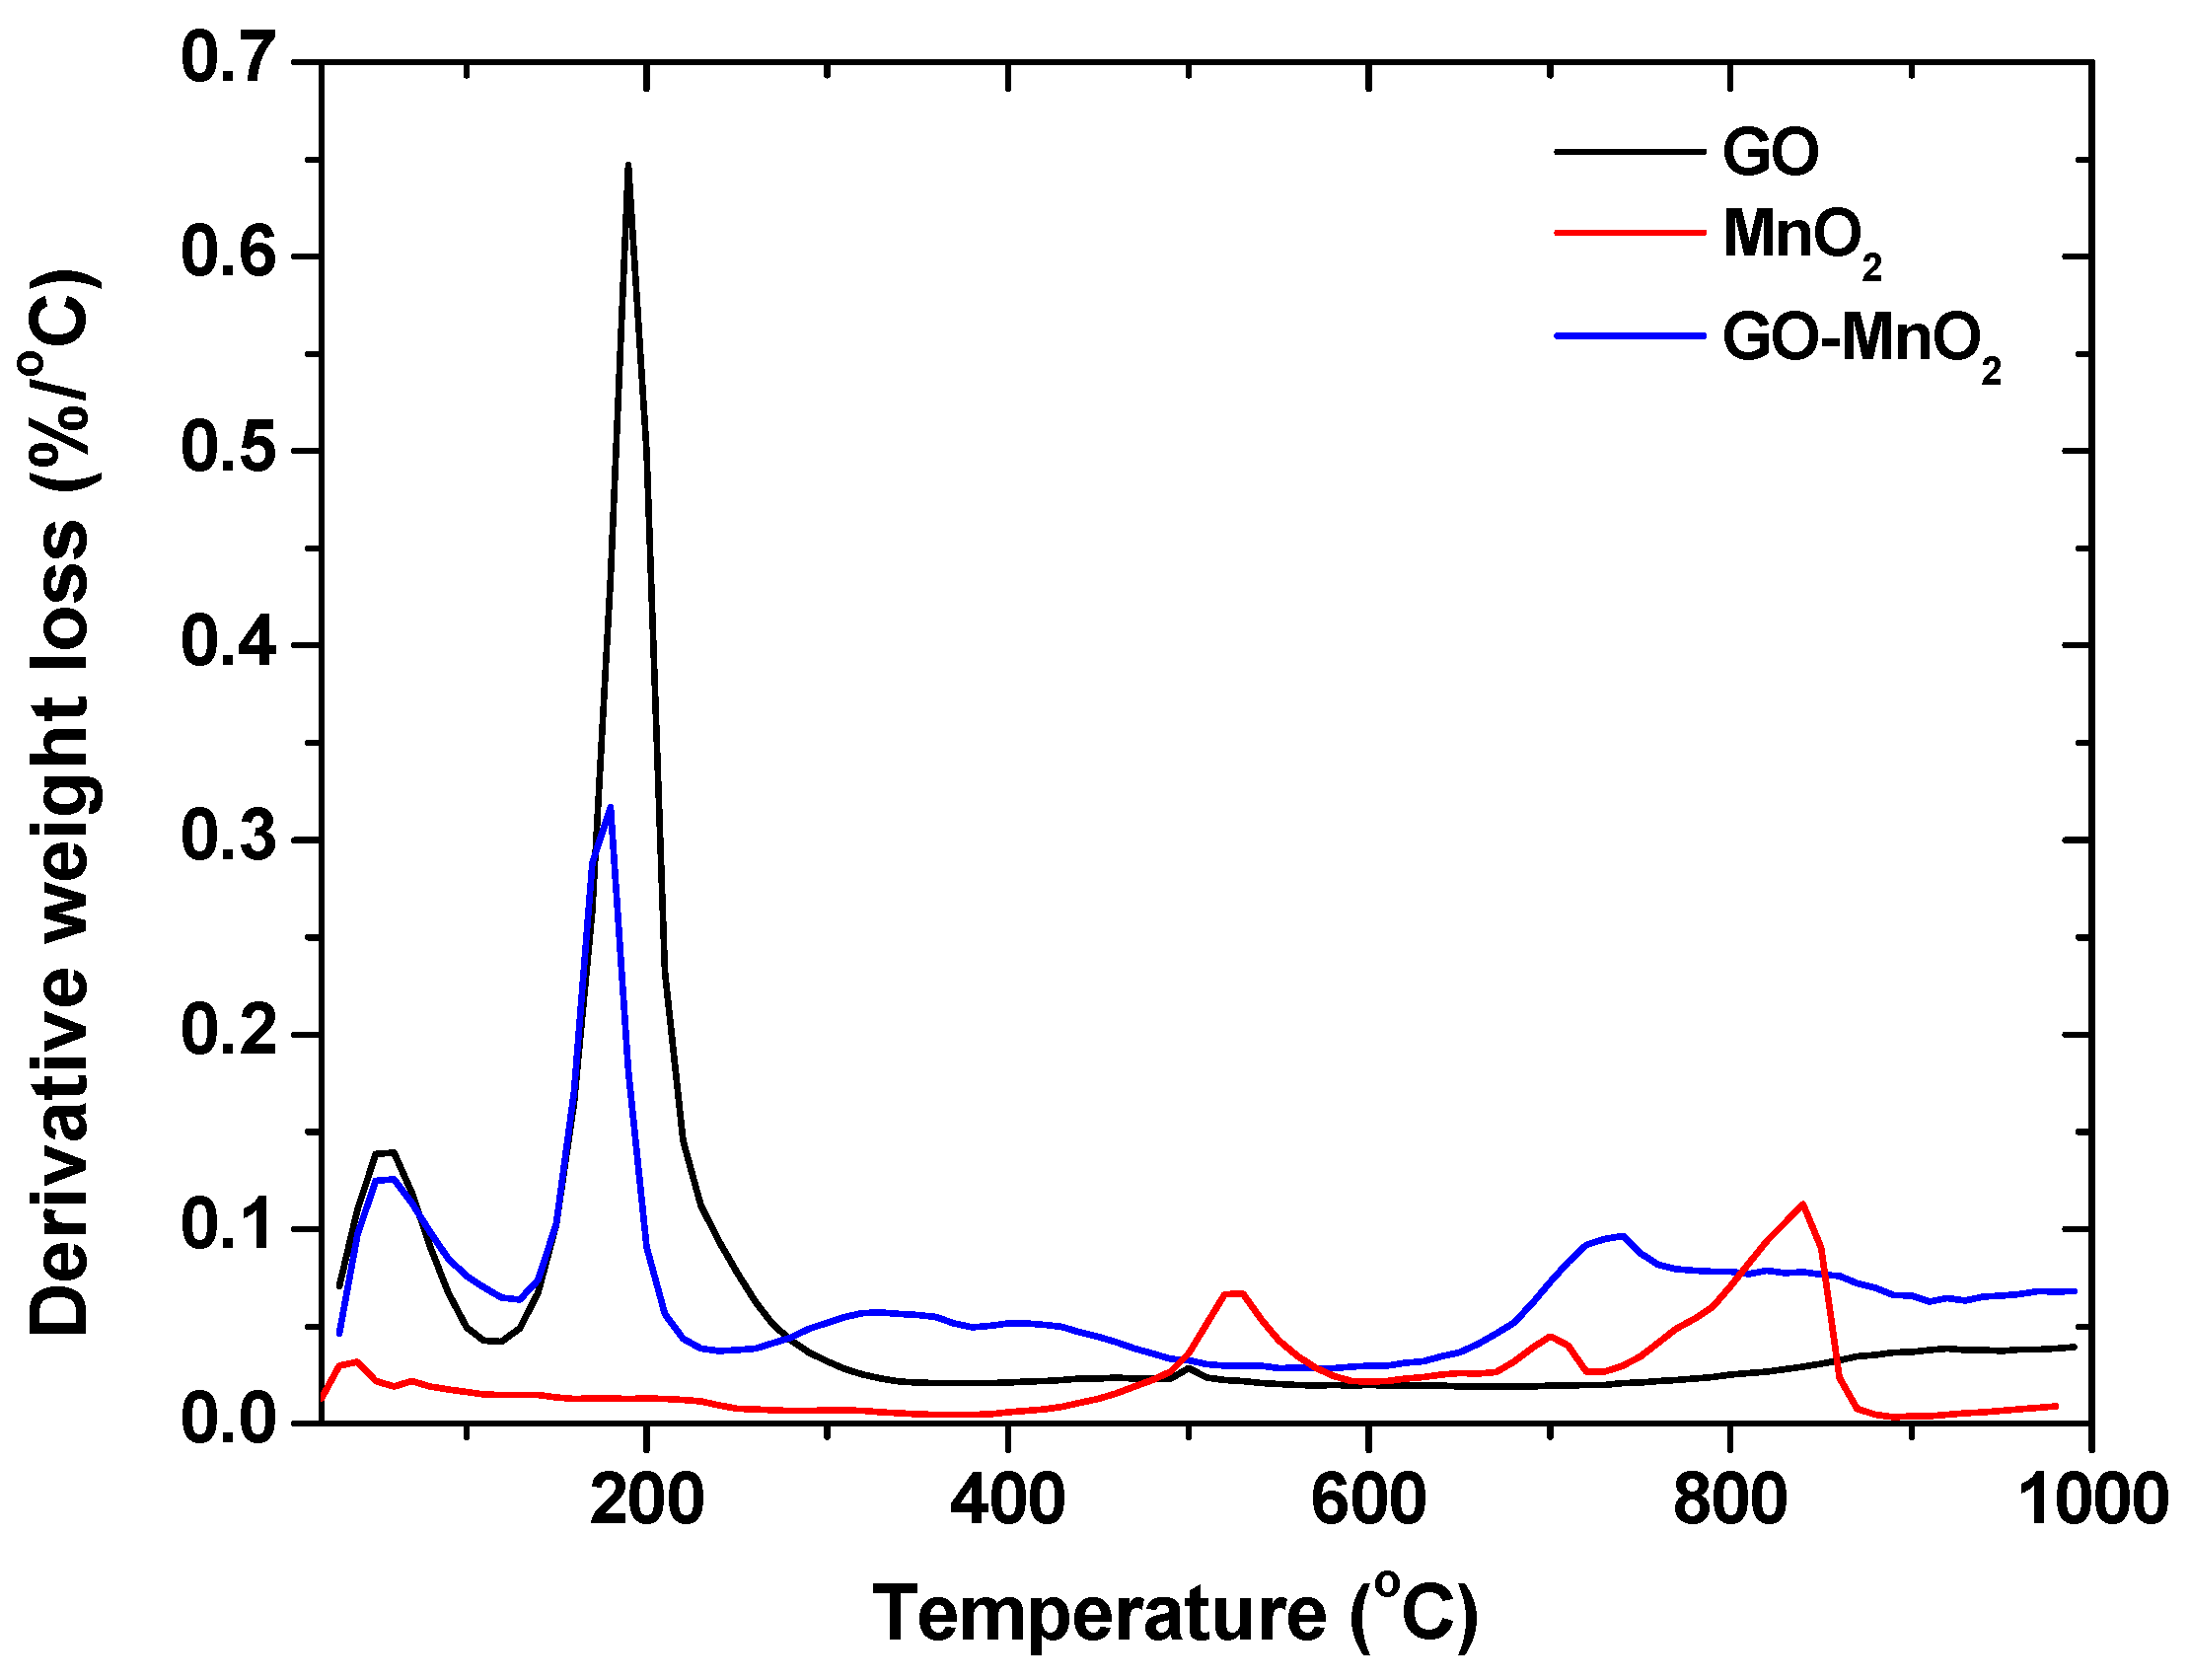
Figure 5.
(a) Effect of initial pH on Reactive Black 5 (RB5) removal onto MnO2 and GO-MnO2 nanocomposite (V = 20 mL; C0 = 60 mg L−1); (b) proton uptake curves for MnO2 and GO-MnO2 nanocomposite; (c) effect of ionic strength on RB5 adsorption/degradation onto GO-MnO2 (V = 20 mL; C0 = 60 mg L−1).
Figure 5.
(a) Effect of initial pH on Reactive Black 5 (RB5) removal onto MnO2 and GO-MnO2 nanocomposite (V = 20 mL; C0 = 60 mg L−1); (b) proton uptake curves for MnO2 and GO-MnO2 nanocomposite; (c) effect of ionic strength on RB5 adsorption/degradation onto GO-MnO2 (V = 20 mL; C0 = 60 mg L−1).

Figure 6.
(a) Effect of H2O2 at different initial concentrations on RB5 removal by GO-MnO2; (b) effect of the comparison between the nanocomposite catalyst and the mixture of the raw materials performance on RB5 degradation.
Figure 6.
(a) Effect of H2O2 at different initial concentrations on RB5 removal by GO-MnO2; (b) effect of the comparison between the nanocomposite catalyst and the mixture of the raw materials performance on RB5 degradation.
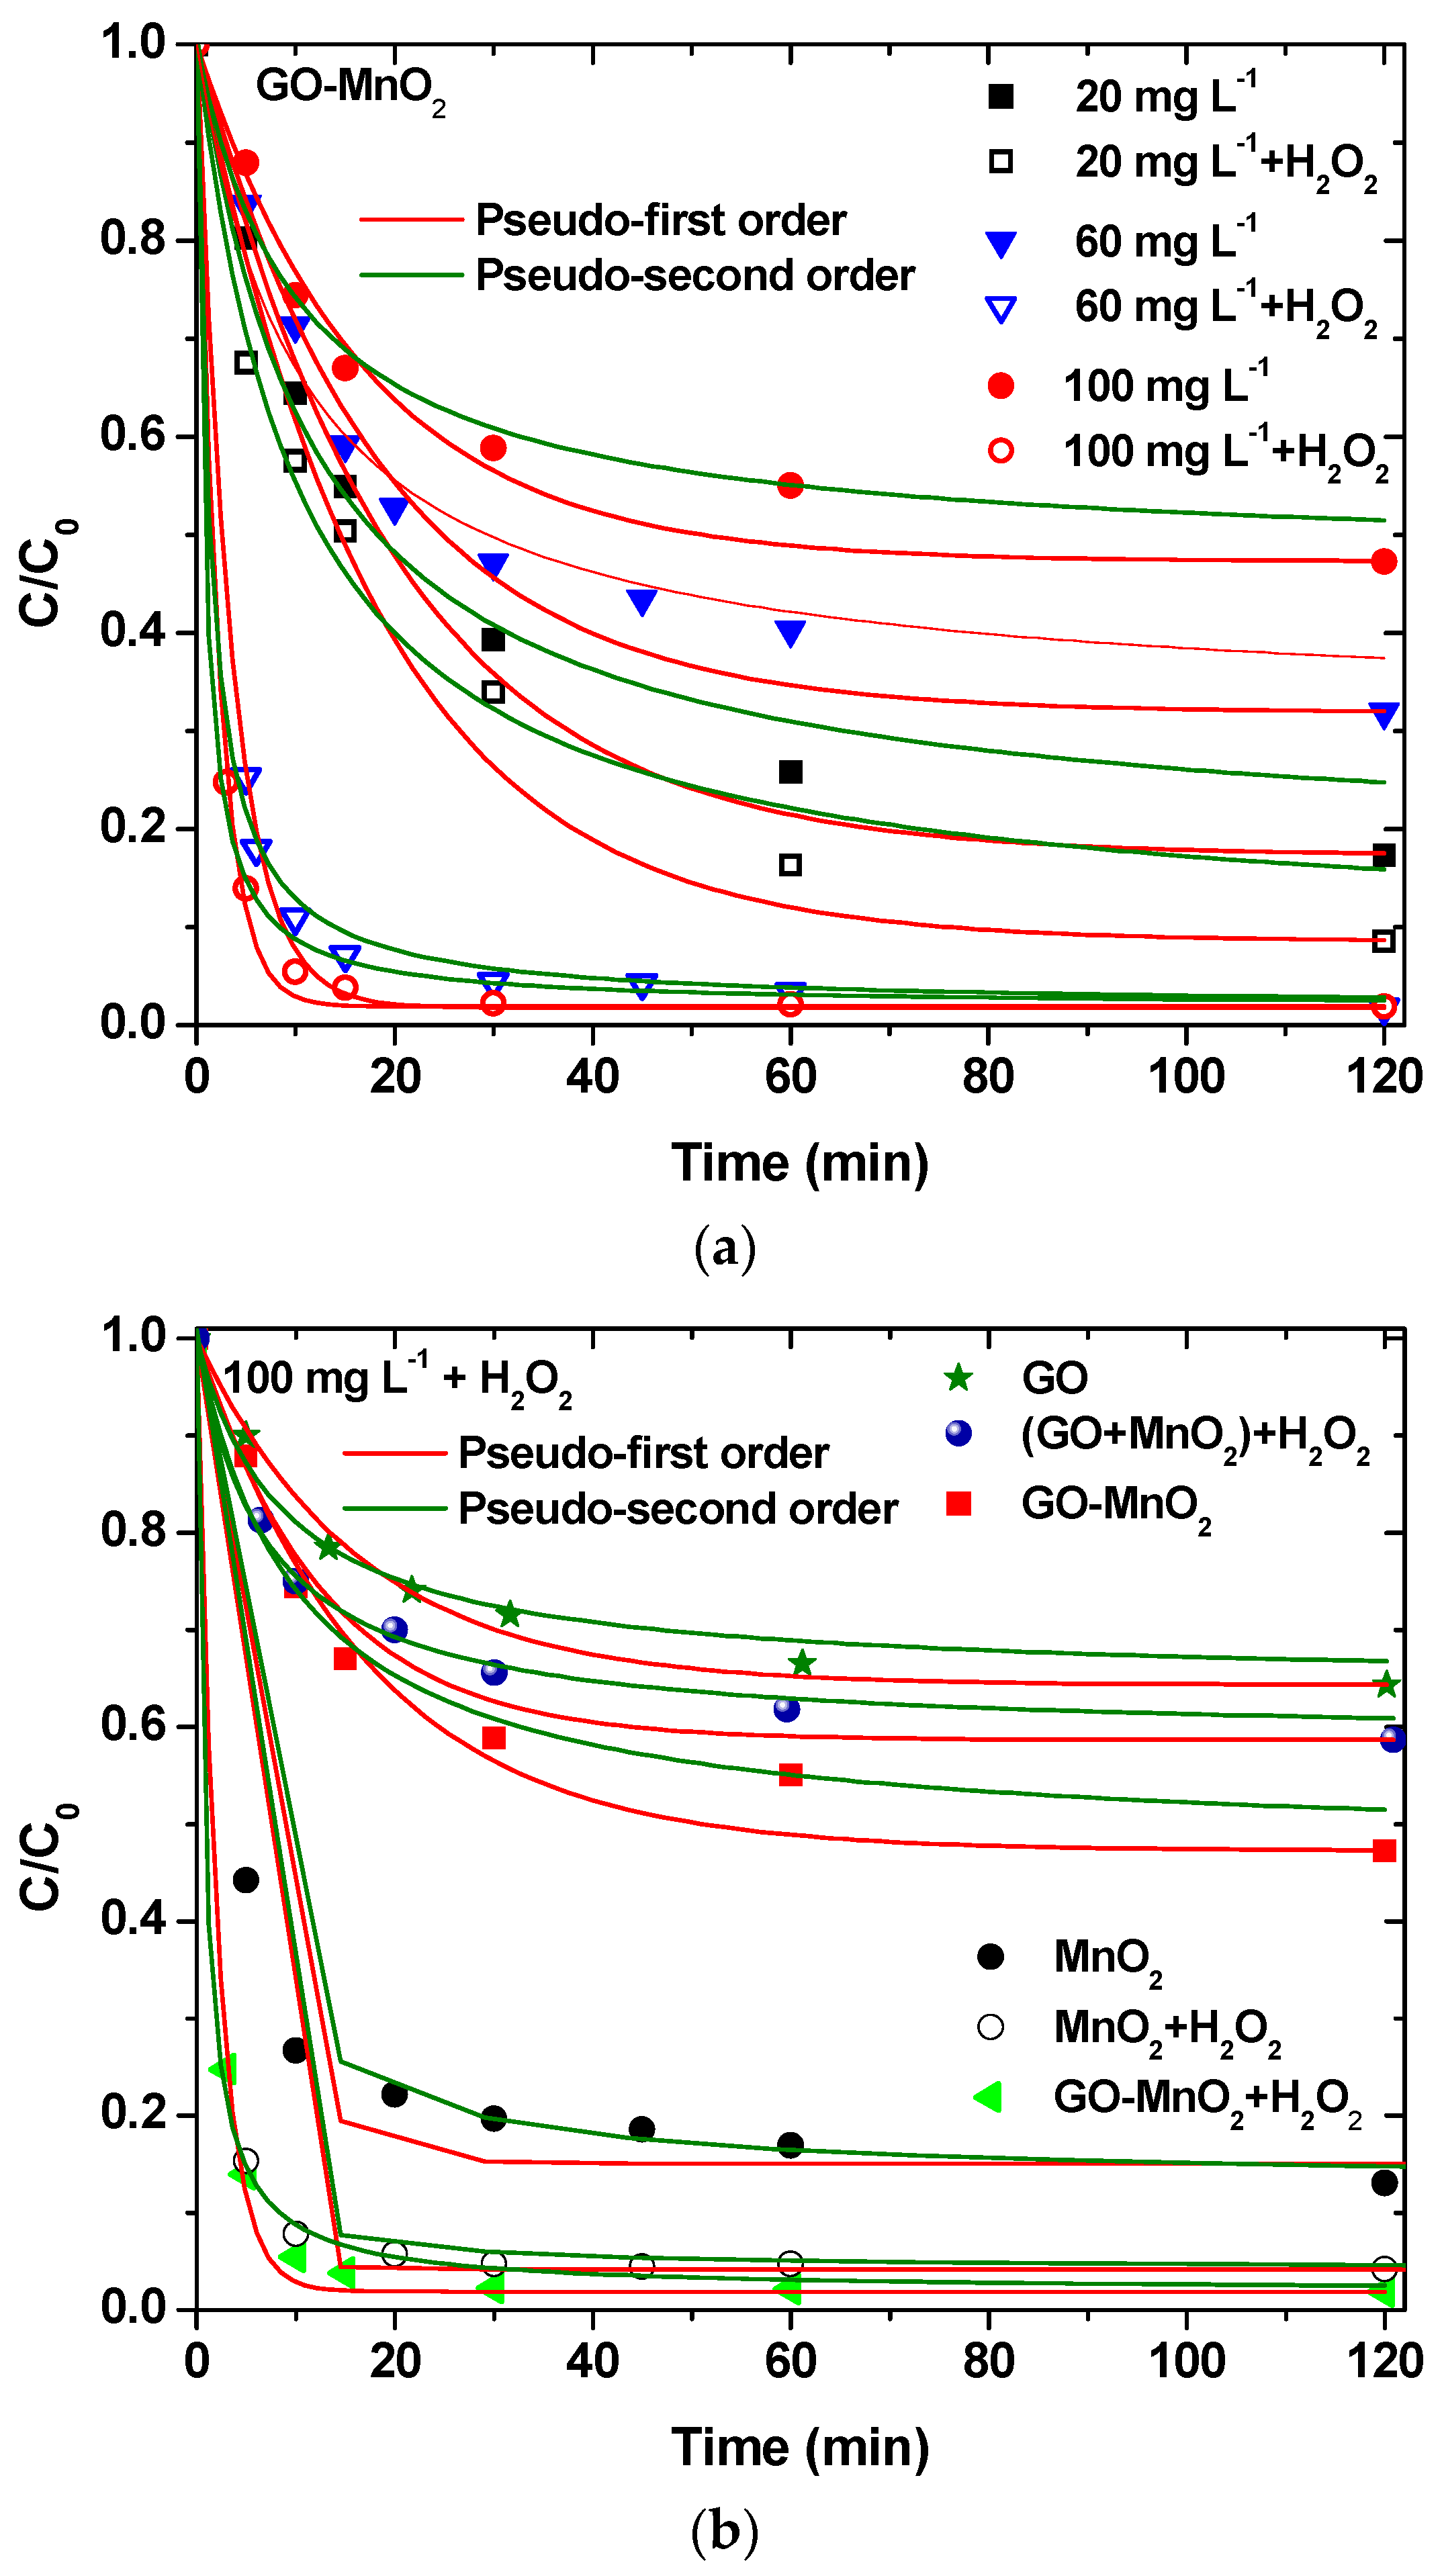
Figure 7.
UV-Vis spectra illustrating: (a) the effect of different initial dye concentration; (b) the effect of H2O2 on RB5 degradation; (c) the comparison between the performance of the nanocomposite catalyst and the mixture of the raw materials on RB5 degradation.
Figure 7.
UV-Vis spectra illustrating: (a) the effect of different initial dye concentration; (b) the effect of H2O2 on RB5 degradation; (c) the comparison between the performance of the nanocomposite catalyst and the mixture of the raw materials on RB5 degradation.

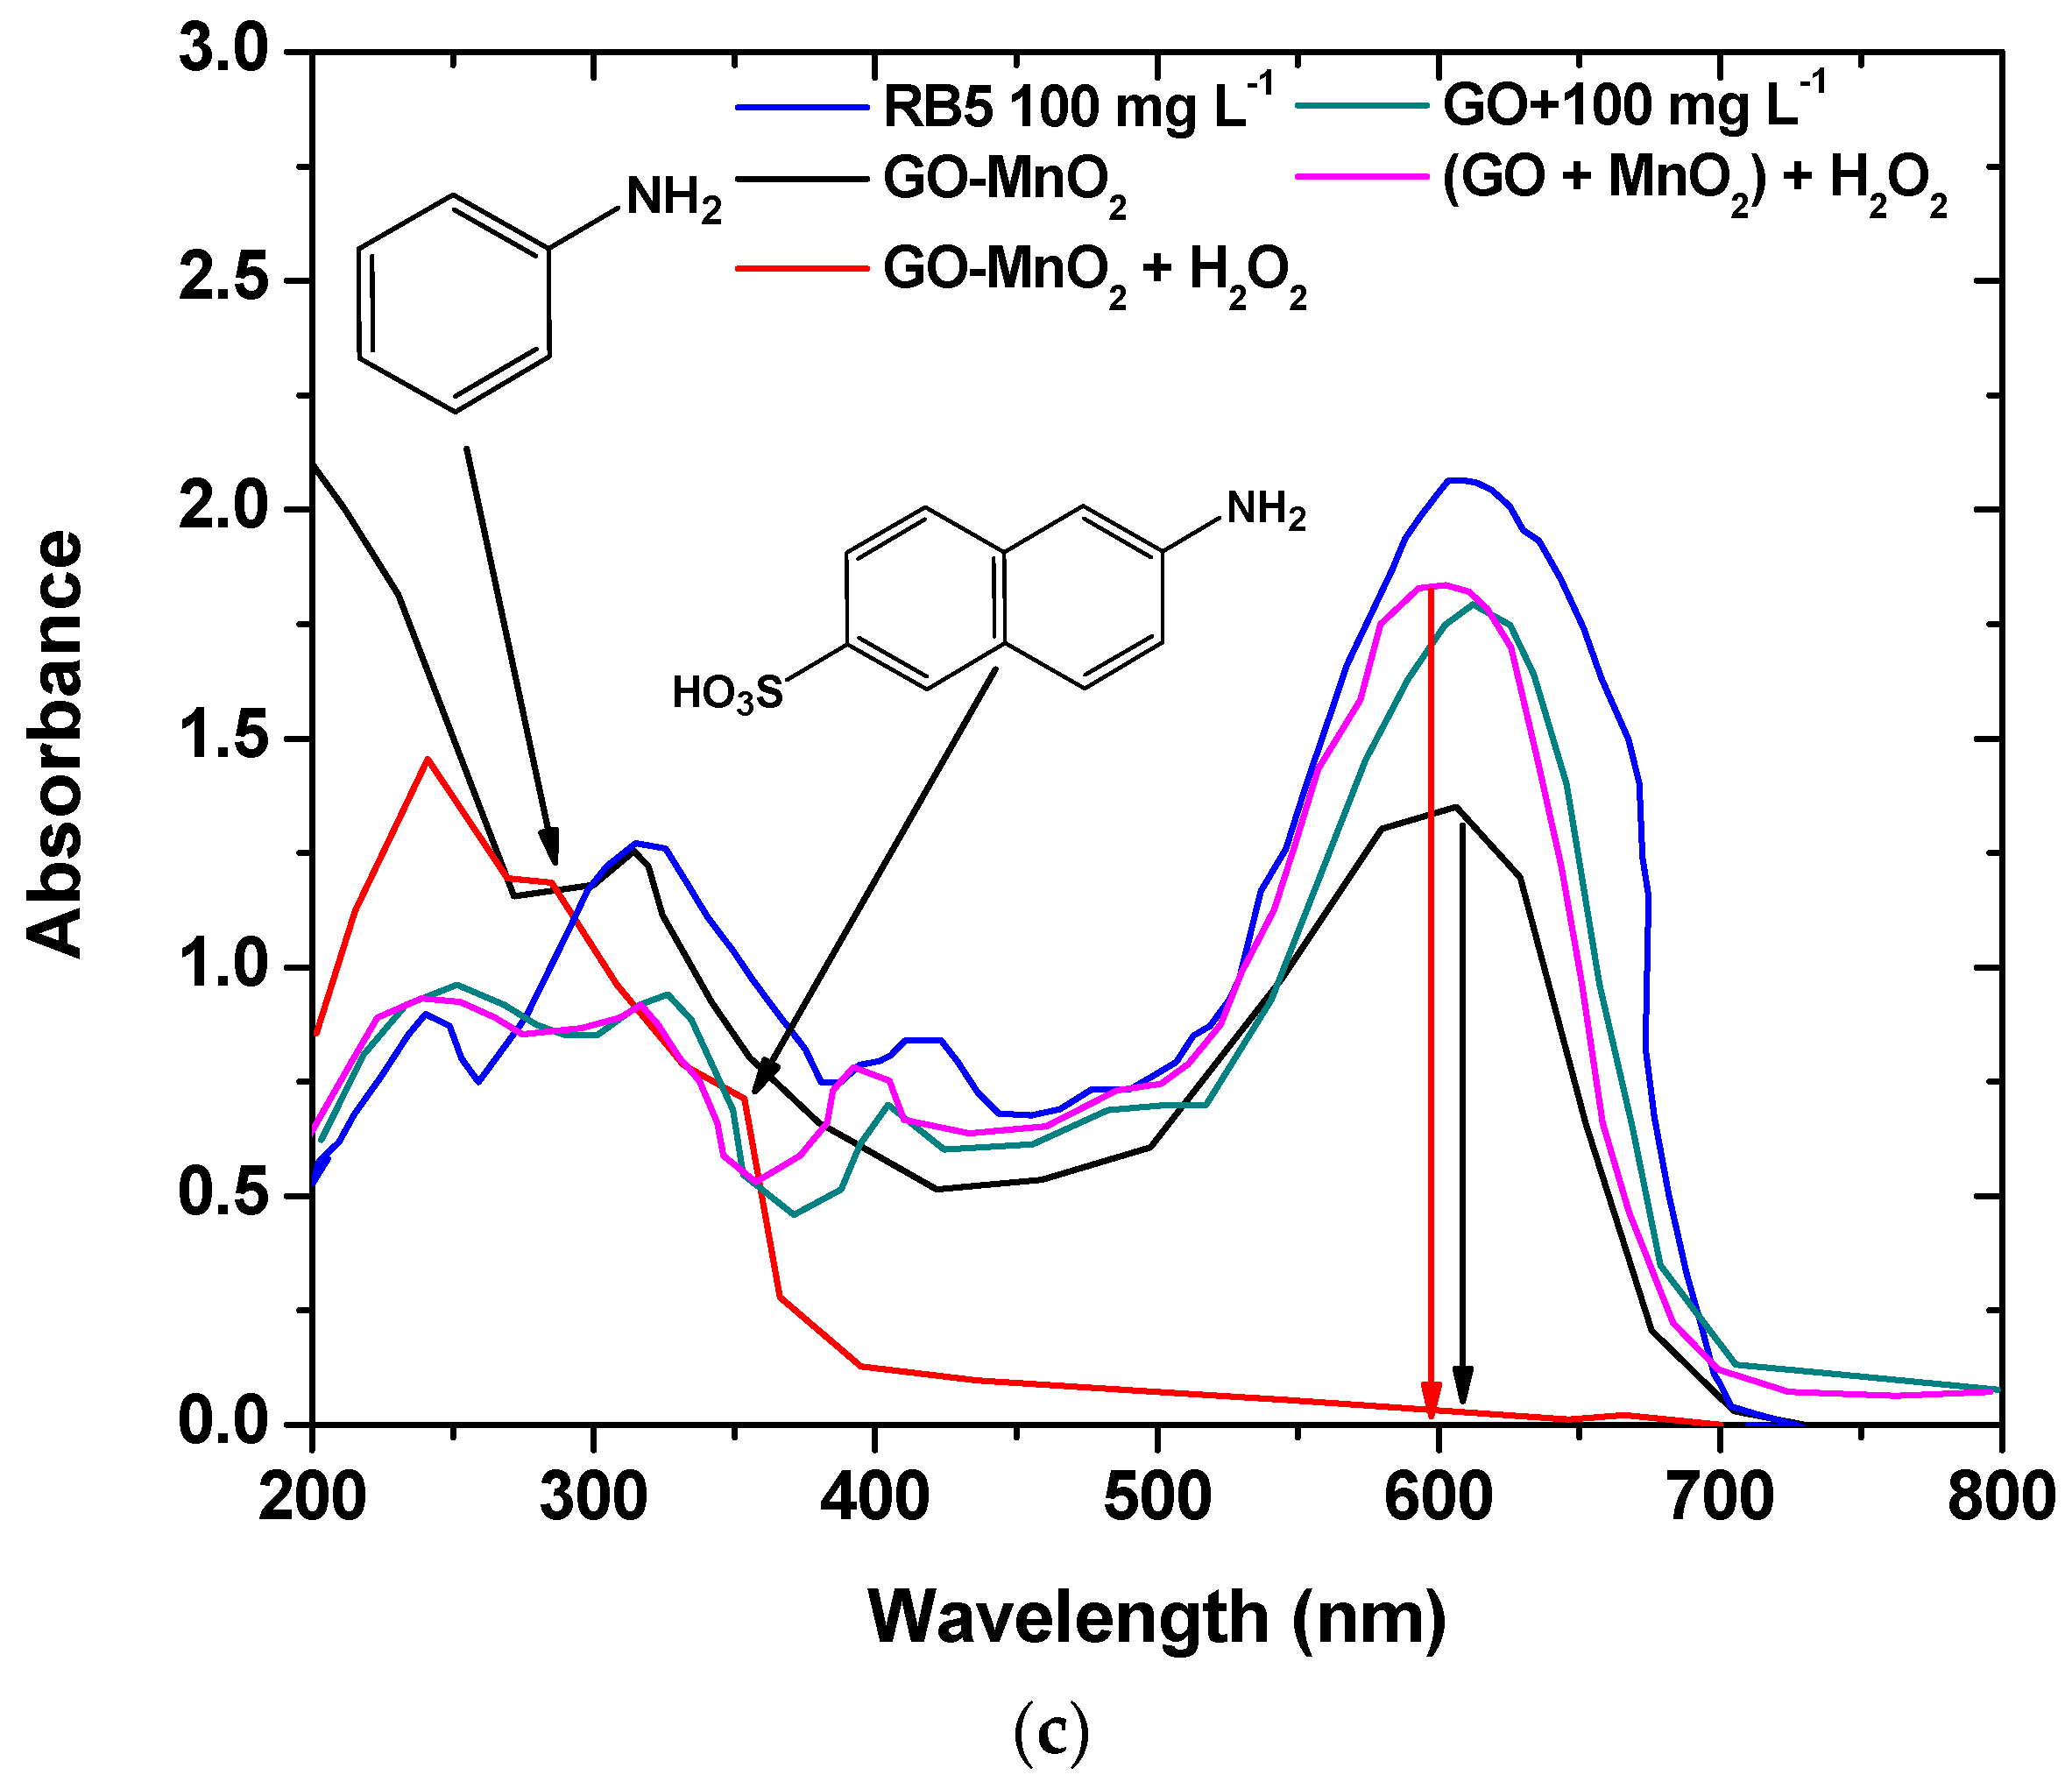
Figure 8.
FTIR spectra of GO-MnO2 before and after RB5 adsorption.

Figure 9.
Possible mechanism of azo-bond cleavage in dye molecules.


Table 1.
Textural parameters of GO, MnO2, and GO-MnO2.
| Sample | SBET (m2 g−1) | Vtotal (cm3 g−1) | Vmeso (cm3 g−1) | Vmicro (cm3 g−1) |
|---|---|---|---|---|
| GO | 20.93 | 0.088 | 0.024 | 0.065 |
| MnO2 | 38.50 | 0.336 | 0.336 | 0 |
| GO-MnO2 | 25.85 | 0.133 | 0.133 | 0 |
Table 2.
Kinetic parameters for the RB5 degradation related to Figure 6a,b.
Table 2.
Kinetic parameters for the RB5 degradation related to Figure 6a,b.
| Pseudo-First Order | Pseudo-Second Order | ||||
|---|---|---|---|---|---|
| k1 | R2 | k2 | R2 | ||
| Curve | Figure | min−1 | - | min−1 | - |
| 100 mg L−1 RB5 (+H2O2) | 7a | 0.45993 | 0.998 | 1.34084 | 0.995 |
| 100 mg L−1 RB5 | - | 0.05804 | 0.974 | 0.09595 | 0.976 |
| 60 mg L−1 RB5 (+H2O2) | - | 0.28312 | 0.994 | 0.78528 | 0.997 |
| 60 mg L−1 RB5 | - | 0.05333 | 0.979 | 0.09390 | 0.975 |
| 20 mg L−1 RB5 (+H2O2) | - | 0.05450 | 0.965 | 0.09543 | 0.979 |
| 20 mg L−1 RB5 | - | 0.04981 | 0.991 | 0.08536 | 0.979 |
| MnO2 | 7b | 0.20301 | 0.983 | 0.40697 | 0.994 |
| MnO2 + H2O2 | - | 0.42056 | 0.999 | 1.81215 | 0.998 |
| GO | - | 0.06076 | 0.991 | 0.11268 | 0.980 |
| GO-MnO2 | - | 0.05802 | 0.974 | 0.09595 | 0.976 |
| GO-MnO2 (+H2O2) | - | 0.45993 | 0.997 | 1.34084 | 0.995 |
| GO + MnO2 (+H2O2) | - | 0.07789 | 0.970 | 0.14492 | 0.992 |
© 2019 by the authors. Licensee MDPI, Basel, Switzerland. This article is an open access article distributed under the terms and conditions of the Creative Commons Attribution (CC BY) license (http://creativecommons.org/licenses/by/4.0/).
Share and Cite
MDPI and ACS Style
Saroyan, H.; Kyzas, G.Z.; Deliyanni, E.A. Effective Dye Degradation by Graphene Oxide Supported Manganese Oxide. Processes 2019, 7, 40. https://doi.org/10.3390/pr7010040
AMA Style
Saroyan H, Kyzas GZ, Deliyanni EA. Effective Dye Degradation by Graphene Oxide Supported Manganese Oxide. Processes. 2019; 7(1):40. https://doi.org/10.3390/pr7010040
Chicago/Turabian StyleSaroyan, Hayarpi, George Z. Kyzas, and Eleni A. Deliyanni. 2019. "Effective Dye Degradation by Graphene Oxide Supported Manganese Oxide" Processes 7, no. 1: 40. https://doi.org/10.3390/pr7010040
Note that from the first issue of 2016, this journal uses article numbers instead of page numbers. See further details here.