Chemically Enhanced Primary Sludge as an Anaerobic Co-Digestion Additive for Biogas Production from Food Waste


1
School of Environmental Engineering, Nanjing Institute of Technology, Nanjing 211167, China
2
School of Civil Engineering, Nanjing Forestry University, Nanjing 210037, China
*
Author to whom correspondence should be addressed.
Processes 2019, 7(10), 709; https://doi.org/10.3390/pr7100709
Submission received: 23 July 2019
/
Revised: 9 September 2019
/
Accepted: 18 September 2019
/
Published: 7 October 2019
(This article belongs to the Section Food Process Engineering)
Abstract
:In order to overcome process instability and buffer deficiency in the anaerobic digestion of mono food waste (FW), chemically enhanced primary sludge (CEPS) was selected as a co-substrate for FW treatment. In this study, batch tests were conducted to study the effects of CEPS/FW ratios on anaerobic co-digestion (coAD) performances. Both soluble chemical oxygen demand (SCOD) and protease activity were decreased, with the CEPS/FW mass ratio increasing from 0:5 to 5:0. However, it was also found that the accumulation of volatile fatty acids (VFAs) was eliminated by increasing the CEPS/FW ratio, and that corresponding VFAs concentrations decreased from 13,872.97 to 1789.98 mg chemical oxygen demand per L (mg COD/L). In addition, the maximum value of cumulative biogas yield (446.39 mL per g volatile solids removal (mL/g VSsremoval)) was observed at a CEPS/FW ratio of 4:1, and that the tendency of coenzyme F420 activity was similar to biogas production. The mechanism analysis indicated that Fe-based CEPS relived the VFAs accumulation caused by FW, and Fe(III) induced by Fe-based CEPS enhanced the activity of F420. Therefore, the addition of Fe-based CEPS provided an alternative method for FW treatment.

1. Introduction
As the major organic fraction of municipal solid wastes, about 1.3 billion tons of food waste (FW) are wasted globally every year from the food produced for human consumption, as reported by the Food and Agricultural Organization [1]. Especially in China, about 80–100 million tons of FW are produced annually due to the intensification of urbanization, of which most is directly landfilled [2,3]. FW is a suitable organic waste for recycling into renewable energy by bioengineering [4]. However, improper disposal practices of FW can result in a various environmental problems, such as toxicity to aquatic life, polluting surface and ground waters, and changes in soil quality [5,6]. Anaerobic digestion (AD) has been proposed as a relatively cost-effective technology for FW treatment and renewable energy generation [7]. However, AD has been used less often for FW treatment in recent decades due to improper materials (such as high sodium content) and extremely high biodegradability [8]. Meanwhile, the activity of methanogens is inhibited as a result of nutrient imbalances and volatile fatty acids (VFAs) accumulations [9].
Anaerobic co-digestion (coAD) is an effective way to improve biogas production, due to low capital investment and substantial environmental benefits [10]. Suitable co-substrates are beneficial for FW digestion, because co-substrates can supply micronutrients and alkalinity, dilute toxic chemicals, enhance the synergistic effect of microorganisms, and overcome the disadvantages of FW mono-digestion [11,12,13]. Thus, the optimization of substrate properties of coAD is an important way to improve digestion efficiency and the process performance of FW.
Chemically enhanced primary sedimentation (CEPS) is produced during the chemically enhanced primary treatment process of wastewater treatment plants (WWTPs) using an Fe/Al-based coagulant addition that contains a large amount of polymeric sludge rich in Fe/Al. As described by Lin [14], ferric chloride (FeCl3) (10–12 mg Fe/L of dosage) was used to enhance the primary wastewater treatment of the Stonecutters Island Sewage Treatment Works in Hong Kong, and a large number of Fe-based CEPS sludge was produced. Fe is an essential trace metal for anaerobic microorganisms that participates in the synthesis of some important metalloenzymes in methanogenesis [15]. It has been demonstrated that addition of ferric chloride could disinhibit excessive volatile fatty acids [16] and enhance biogas production by enriching Coprothermobacter for protein fermentation and Methanosarcina for methanogenesis from the perspective of microorganisms [17]. It has been proposed that the introduction of FeCl3 might contribute to a reduction of VFAs content and protect methanogenesis from the accumulation of volatile acids. Thus, the effects of Fe-based CEPS on VFAs reduction and methanogenesis during the coAD of FW need to be studied deeply.
This study intends to explore coAD performance of FW and Fe-based CEPS from the perspective of organic matter degradation, while simultaneously investigating the relationship between biogas production and Fe-based CEPS content under mesophilic digestion. Different mixing ratios of the CEPS and FW were conducted to study the typical substances involved in the coAD process, including organic substrate solubilization, VFAs variation, and biogas production. Meanwhile, representative enzyme activities associated with AD were monitored to analyze process stability of biogas production.
2. Materials and Methods
2.1. Substrate Preparation and Inoculums
The FW used in this study was collected from a student dining hall on campus in Nanjing, China. The chemical and physical characteristics of the FW were as follows: 112.3 g/L of total solids (TSs), 99.1 g/L of volatile solids (VSs), 44.3% of carbohydrates, 21.9% of proteins, 28.1% of lipids, and others. The FW was pulverized into particles with an average size of 1–2 mm using a grinder. The processed FW was mixed, weighed, and stored in plastic containers at 4 °C before use.
The CEPS used in this study was obtained from the Jiangning Science Park WWTP (Nanjing, China). Ferric chloride was used as a chemical flocculant, and the dosage was 20 mg/L. The characteristics of the concentrated CEPS were as follows: 6.6–7.2 of pH, 17.50 ± 0.50 g/L of TSs, 11.10 ± 0.50 g/L of VSs, 175 ± 5.0 mg/L of VFAs, 280 ± 20 mg/L of soluble chemical oxygen demand (SCOD), 413.8 ± 26.0 mg/L of total nitrogen (TN), 147.2 ± 3.2 mg/L of total phosphorus (TP), and 452.5 ± 3.5 mg/L of total Fe. The CEPS after sedimentation was stored at 4 °C.
The seeding sludge for coAD in this study was taken from a mesophilic anaerobic digester in Jiangning Science Park WWTP, Nanjing, China. The characteristics of the seeding sludge were as follows: 7.3–7.5 of pH, 22.5 ± 0.50 g/L of TSs, and 43 ± 1% of VSs/TSs.
2.2. CoAD Batch Experiment Setup
Six serum bottles with a working volume of 600 mL were set in parallel. The substrates of CEPS and FW were mixed at mass ratios of 0:5, 1:4, 2:3, 3:2, 4:1, and 5:0, with the corresponding coAD bottles labeled M0:5, M1:4, M2:3, M3:2, M4:1, and M5:0, respectively. In each bottle, the final TSs of substrates was adjusted to 40 ± 0.5 g/L by adding water, and the mass ratio of seeding sludge to substrates was determined to be 1:1. All bottles were flushed with nitrogen for 5 min, sealed, and incubated in an air-bath shaker (50 rpm) at 37 ± 0.5 °C for 20 days. The pH value in every bottle was measured and adjusted to near neutral pH (7.0–7.5) once a day using 1 M NaOH. A 1.5-mL sample of the mixture was taken from each bottle with a syringe every other day, then centrifuged at 10,000 rpm for 5 min. The supernatant was diluted with deionized water for further measurement.
2.3. Analytical Methods
The TSs, VSs, TN, TP, and SCOD were determined according to the Standard Methods [18]. The pH values were measured using a pH meter (WTWOxi3210, Germany). The VFAs were measured by gas chromatography (Agilent 6890 N, Palo Alto, CA, USA), and the related parameters followed the literature [19]. The total VFAs concentration was the sum of acetic, propionic, n-butyric, iso-butyric, n-valeric, and iso-valeric acids. The protease activity was measured using the Folin method [20]. The F420 was analyzed using a UV-visible spectrophotometer at 420 nm [21]. The carbohydrates were determined using the anthrone–sulfuric method with glucose as the standard [22]. The proteins in the fermentation liquid samples were conducted using the Lowry method [23]. Lipids were measured in the form of fatty acid methyl esters using a gas chromatograph (Agilent 6890 N, Palo Alto, CA, USA), as described in the literature [24].
Biogas volume was measured by a gas-sampling bag. The methane content was determined using a gas chromatograph (GC-2014, Shimadzu, Kyoto, Japan) equipped with a thermal conductivity detector and a stainless steel column 2 m × 4 mm, with hydrogen (H2) as the carrier gas (25 mL/min) [25]. The biogas yield was defined as the volume of biogas (mL) produced by unit mass of VS removal (g VSremoval) [25].
3. Results and Discussion
3.1. Organic Matters Solubilization
The hydrolysis of substrates can be expressed through the changes of SCOD [26]. The changes of SCOD concentrations at different CEPS/FW ratios during the coAD process are shown in Figure 1. In general, SCOD concentrations decreased with an increase of CEPS/FW ratios. For example, after 20 days, the SCOD concentrations were 20,184.36, 17,273.67, 15,512.38, 13,875.62, 10,668.02, and 2682.9 mg/L in the M0:5, M1:4, M2:3, M3:2, M4:1 and M5:0, respectively. Additionally, the SCOD concentrations at any CEPS/FW ratio had similar change trends, except for M5:0. For instance, the SCOD concentrations increased rapidly from 5200.53 to 15,296.48 mg/L within 11 days in the M1:4, then maintained relative stability. Meanwhile, the SCOD concentrations in the M5:0 increased from 2498.43 to 3948.7 mg/L in the first 3 days, then fluctuated in the range of 2455.22–3568.51 mg/L.
In this study, the changes of SCOD concentration were positively correlated with FW content, indicating that FW hydrolysis was the major reason for the increase of SCOD concentration during the coAD process. More readily biodegradable organic matters, such as polysaccharides and lipids, were brought into the reactor with increases of FW, then hydrolyzed rapidly with microorganisms [27]. Meanwhile, it can be inferred from Figure 1 that the hydrolysis rate of FW was better than mono CEPS in the AD process. The SCOD variation in M5:0 might be attributed to the flocculation reaction between Fe(III) and organic substances in the CEPS, which prevented the release of organic matters into the liquid phase.
3.2. VFAs Production
VFAs are the major intermediate degradation products of soluble organics, with low molecular weight to biogas. The changes of VFAs concentrations and compositions at different CEPS/FW ratios are summarized in Figure 2. It is clear to see that the VFAs concentrations decreased with increases in the CEPS/FW ratio. After 20 days of coAD, total VFAs concentrations were 13,872.97, 11,556.97, 9929.39, 9958.97, 8367.02, and 1789.98 mg COD/L, in the M0:5, M1:4, M2:3, M3:2, M4:1, and M5:0, respectively. This tendency of VFAs concentrations indicates that the accumulation of VFAs was mainly caused by high FW content, and the addition of CEPS significantly alleviated the accumulation of VFAs.
Furthermore, the composition of VFAs changed significantly along with the CEPS/FW ratios during the coAD process. Acetic acid, propionic acid, isobutyric acid, n-butyric acid, isovaleric acid, and n-valeric acid were observed at any CEPS/FW ratio, and the acetic acid and propionic acid were the main components of the VFAs. Taking M1:4 as an example, acetic and propionic acids accounted for 49.32% and 25.46%, respectively, while the iso-butyric, n-butyric, iso-valeric, and n-valeric acids were 4.44%, 2.82%, 7.0%, and 10.96%, respectively. At the same time, it can be seen that the concentration of acetic acid followed the order: M0:5 (7520.69 mg COD/L) > M1:4 (5700.14 mg COD/L) > M2:3 (4700.81 mg COD/L) > M3:2 (3248.25.08 mg COD/L) > M1:4 (2427.74 mg COD/L, M0:5) > M5:0 (501.47 mg COD/L). The concentration of acetic acid was positively correlated with the VFAs concentrations and FW content, and the accumulation of acetic acid was more serious at lower CEPS/FW ratios. Thus, the result of acetic acid concentration demonstrated that the addition of Fe-based CEPS could reduce the accumulation of acetic acid.
The change of VFAs concentration could characterize two aspects: the hydrolysis and acidification ability of organic matters to VFAs, and the conversion efficiency of VFAs to methane. In this study, a larger number of easily degradable organic matters released from FW and CEPS were rapidly converted to VFAs during the hydrolysis and acidification process. Simultaneously, in the methanogenesis process, acetic acid was consumed as the major substrate for methane production. The accumulation of acetic acid indicates that the conversion efficiency of VFAs to methane declined. Therefore, it is speculated that appropriate CEPS additions have a positive effect on acetic degradation, which effectively reduces the inhibition of high concentrations of VFAs during methanogenesis.
3.3. Biogas Production
The cumulative biogas production was employed to evaluate the methanogenesis performances and the conversion efficiency of VFAs. The changes in cumulative biogas production with CEPS/FW ratios and coAD time are shown in Figure 3. It can be seen that the cumulative biogas production was profoundly affected by CEPS/FW. The highest cumulative biogas production (2812.27 mL) was detected in M4:1 on the 20th day of coAD, which was 4.08-, 3.28-, 1.73-, 1.32-, and 3.01-fold the amount present in M0:5, M1:4, M2:3, M3:2, and M5:0, respectively. Additionally, cumulative biogas production at any CEPS/FW ratio first rapidly increased with the extension of AD time, then gradually leveled off. For instance, in the M4:1, the cumulative biogas production increased rapidly to 2617.52 mL within 9 days, then remained relatively stable.
On the basis of cumulative biogas production analysis, two main factors were considered to affect coAD process. Firstly, high SCOD and VFAs concentrations produced from high FW content inhibited the activities of methanogens, which in turn decreased biogas production [9]. Secondly, Fe content was increased with increase of the CEPS/FW ratio, which played a key role in enhancing the conversion from VFAs to biogas during the coAD process. Generally, Fe is the most demanding trace metal for metalloenzymes in methanogenesis [15], which is correlated with the activity of methanogen and enzymes [28]. As we know, carbon monoxide dehydrogenase (CODH) belongs to the Ni-Fe enzymes participating in the aceticlastic pathway [29]. F420 is a low-potential electron transfer carrier whose activity is affected by Fe [30]. Moreover, Fe could precipitate with S2− to diminish the negative impact of S2− on microorganism activities [31].
The VS removal efficiencies and biogas yields in coAD of FW and CEPS are summarized in Table 1. The average biogas yields of M0:5, M1:4, M2:3, M3:2, M4:1 and M5:0 were 86.93, 108.99, 212.16, 288.42, 446.39, 247.50 mL/g VSremoval, respectively. The maximum value of biogas yield was found in M4:1, and the corresponding VS removal efficiency was 38.12%. In the previous study, Chakraborty [20] confirmed that the addition of CEPS could improve enzyme activities and CH4 production in the coAD of FW at a FW/CEPS ratio of 1:7, and that a maximum volumetric CH4 productivity of 270 ± 71 mL/g VSremoval was achieved. Similarly, the study conducted by Kim [32] showed that a maximum CH4 yield of 215 mL/g VS was produced under a FW and sewage sludge ratio of 1:4, which is a 85.3% higher CH4 yield compared to mono-digestion of FW alone. Mehariya [33] suggested that the main basis for determining the optimum feed ratio in the coAD process of FW is to define either total solids content or the C/N ratio for each specific case. These results show that the addition of Fe-based CEPS has a positive effect on FW degradation and biogas yield.
3.4. Enzymes Activity
Figure 4 shows the effects of CEPS/FW ratios on the relative activities of protease and coenzyme F420. It is well known that protease activity is a characterization of protein hydrolysis, which plays critical roles in the hydrolysis of substrates. Clearly, the CEPS/FW ratios had a significant effect on protease activity, and protease activity decreased with an increase of CEPS/FW ratios. For example, average protease activities were up to 8.74, 10.4, 11.3, 12.5, and 13.4 IU/L in the M0:5, M1:4, M2:3, M3:2, and M4:1, respectively, and were 1.21, 1.44, 1.57, 1.73, and 1.86 times that of the M5:0 (7.22 IU/L). Meanwhile, the protease activity increased gradually in the first few days, then decreased slowly. For example, protease activity increased from 6.84 to 14.2 IU/L in M4:1 in the first 17 days, then dropped to 13.4 IU/L.
Changes of protease activity might have been closely related to protein concentration in FW. The lower the CEPS/FW ratio, the higher the protein concentration that was obtained, and thus the higher the protease activity that was detected. Similarly, at the initial time, a lot of readily degradable proteins were brought into the coAD system with FW, accelerating the hydrolysis reaction of proteins. As the reaction proceeded, the readily degradable proteins were gradually consumed, resulting in a decrease of protease activity.
The activity of coenzyme F420 reflects the methanogenesis. As shown in Figure 4b, coenzyme F420 increased in the first 5 days then decreased during the subsequent reaction process. For example, the average coenzyme F420 in M4:1 increased from 0.982 to 1.732 μmol/L in first 5 days, then dropped to 0.694 μmol/L in the remaining time. Further, the CEPS/FW ratio affected the changes of coenzyme F420 distinctly. The change of F420 was consistent with the cumulative biogas production, indicating that a suitable CEPS/FW ratio (M4:1) was more beneficial for biogas production. This might be because the Fe introduced by CEPS enhanced the activity of coenzyme F420.
4. Conclusions
The anaerobic co-digestion performance indicated that CEPS was a good additive that could improve biogas production efficiency and renewable energy recovery of FW. The SCOD was inversely related to the CEPS/FW ratio due to the decrease of readily biodegradable organic matters brought into the AD system with FW. The addition of CEPS effectively slowed the accumulation of VFAs at high FW ratios, especially acetic acid accumulation, and enhanced biomethane production in mesophilic coAD. A maximum biogas yield of 446.39 mL/g VSremoval was observed at a CEPS/FW ratio of 4:1. The enzyme activities analysis demonstrated that sufficient Fe introduced by CEPS improved the activity of F420 in methanogenesis process, which was the main reason for biogas production.
Author Contributions
Conceptualization, X.K.; validation, Y.L.; investigation, X.K. and Y.L.; data curation, X.K.; writing-original draft preparation, Y.L.; writing-review and editing, X.K.
Funding
This research was funded by the Natural Science Foundation of the Jiangsu Higher Education Institutions of China (grant number 16KJB560018); the National Natural Science Foundation of China (grant number 51808282; the Natural Science Foundation of Jiangsu Province of China (grant number BK20160937); and the Scientific Research Foundation of the Nanjing Institute of Technology (YKJ201734).
Conflicts of Interest
The authors declare no conflict of interest.
References
- Ariunbaatar, J.; Panico, A.; Frunzo, L.; Esposito, G.; Lens, P.N.L.; Pirozzi, F. Enhanced anaerobic digestion of food waste by thermal and ozonation pretreatment methods. J. Environ. Manag. 2014, 146, 142–149. [Google Scholar] [CrossRef] [PubMed]
- Joshi, P.; Visvanathan, C. Sustainable management practices of food waste in Asia: Technological and policy drivers. J. Environ. Manag. 2019, 247, 538–550. [Google Scholar] [CrossRef] [PubMed]
- Zhou, Y.; Engler, N.; Nelles, M. Symbiotic relationship between hydrothermal carbonization technology and anaerobic digestion for food waste in China. Bioresour. Technol. 2018, 260, 404–412. [Google Scholar] [CrossRef] [PubMed]
- Zhang, C.; Su, H.; Baeyens, J.; Tan, T. Reviewing the anaerobic digestion of food waste for biogas production. Renew. Sustain. Energy Rev. 2014, 38, 383–392. [Google Scholar] [CrossRef]
- Nayak, A.; Bhushan, B. An overview of the recent trends on the waste valorization techniques for food wastes. J. Environ. Manag. 2019, 233, 352–370. [Google Scholar] [CrossRef]
- Kiran, E.U.; Liu, Y. Bioethanol production from mixed food waste by an effective enzymatic pretreatment. Fuel 2015, 159, 463–469. [Google Scholar] [CrossRef]
- Xu, F.; Li, Y.; Ge, X.; Yang, L.; Li, Y. Anaerobic digestion of food waste—Challenges and opportunities. Bioresour. Technol. 2018, 247, 1047–1058. [Google Scholar] [CrossRef] [PubMed]
- Awe, O.W.; Zhao, Y.; Nzihou, A.; Minh, D.P.; Lyczko, N. Anaerobic co-digestion of food waste and FOG with sewage sludge—Realising its potential in Ireland. Int. J. Environ. Stud. 2017, 1–22. [Google Scholar] [CrossRef]
- Veeken, A.H.; Hamelers, B.V. Effect of substrate-seed mixing and leachate recirculation on solid state digestion of biowaste. Water Sci. Technol. 2000, 41, 255–262. [Google Scholar] [CrossRef]
- Fonoll, X.; Astals, S.; Dosta, J.; Mata-Alvarez, J. Anaerobic co-digestion of sewage sludge and fruit wastes: Evaluation of the transitory states when the co-substrate is changed. Chem. Eng. J. 2015, 262, 1268–1274. [Google Scholar] [CrossRef]
- Hobbs, S.R.; Landis, A.E.; Rittmann, B.E.; Young, M.N.; Parameswaran, P. Enhancing anaerobic digestion of food waste through biochemical methane potential assays at different substrate: Inoculum ratios. Waste Manag. 2018, 71, 612–617. [Google Scholar] [CrossRef] [PubMed]
- Drennan, M.F.; DiStefano, T.D. High solids co-digestion of food and landscape waste and the potential for ammonia toxicity. Waste Manag. 2014, 34, 1289–1298. [Google Scholar] [CrossRef] [PubMed]
- Zhang, Y.; Banks, C.J.; Heaven, S. Co-digestion of source segregated domestic food waste to improve process stability. Bioresour. Technol. 2012, 114, 168–178. [Google Scholar] [CrossRef] [PubMed] [Green Version]
- Lin, L.; Li, R.-H.; Li, Y.; Xu, J.; Li, X.-Y. Recovery of organic carbon and phosphorus from wastewater by Fe-enhanced primary sedimentation and sludge fermentation. Process Biochem. 2017, 54, 135–139. [Google Scholar] [CrossRef]
- Glass, J.B.; Orphan, V.J. Trace metal requirements for microbial enzymes involved in the production and consumption of methane and nitrous oxide. Front. Microbiol. 2012, 3, 61. [Google Scholar] [CrossRef] [PubMed]
- Yu, B.; Shan, A.; Zhang, D.; Lou, Z.; Yuan, H.; Huang, X.; Zhu, N.; Hu, X. Dosing time of ferric chloride to disinhibit the excessive volatile fatty acids in sludge thermophilic anaerobic digestion system. Bioresour. Technol. 2015, 189, 154–161. [Google Scholar] [CrossRef] [PubMed]
- Yu, B.; Lou, Z.; Zhang, D.; Shan, A.; Yuan, H.; Zhu, N.; Zhang, K. Variations of organic matters and microbial community in thermophilic anaerobic digestion of waste activated sludge with the addition of ferric salts. Bioresour. Technol. 2015, 179, 291–298. [Google Scholar] [CrossRef] [PubMed]
- APHA-AWWA-WPCF. Standard Methods for the Examination of Water and Wastewater; American Public Health Association, American Water Works Association, Water Environment Federation: Washington, DC, USA, 2012.
- Chen, Y.; Jiang, S.; Yuan, H.; Zhou, Q.; Gu, G. Hydrolysis and acidification of waste activated sludge at different pHs. Water Res. 2007, 41, 683–689. [Google Scholar] [CrossRef] [PubMed]
- Chakraborty, D.; Karthikeyan, O.P.; Selvam, A.; Wong, J.W.C. Co-digestion of food waste and chemically enhanced primary treated sludge in a continuous stirred tank reactor. Biomass Bioenergy 2018, 111, 232–240. [Google Scholar] [CrossRef]
- Bashiri, G.; Rehan, A.M.; Greenwood, D.R.; Dickson, J.M.J.; Baker, E.N. Metabolic Engineering of Cofactor F-420 Production in Mycobacterium smegmatis. PLoS ONE 2010, 5, e15803. [Google Scholar] [CrossRef]
- Morris, D.L. Quantitative Determination of Carbohydrates with Dreywood’s Anthrone Reagent. Science 1948, 107, 254–255. [Google Scholar] [CrossRef]
- Lowry, O.H.; Rosebrough, N.J.; Farr, A.L.; Randall, R.J. Protein measurement with the Folin phenol reagent. J. Biol. Chem. 1951, 193, 265–275. [Google Scholar] [PubMed]
- Ning, Z.; Zhang, H.; Li, W.; Zhang, R.; Liu, G.; Chen, C. Anaerobic digestion of lipid-rich swine slaughterhouse waste: Methane production performance, long-chain fatty acids profile and predominant microorganisms. Bioresour. Technol. 2018, 269, 426–433. [Google Scholar]
- Cai, Y.; Zhao, X.; Zhao, Y.; Wang, H.; Yuan, X.; Zhu, W.; Cui, Z.; Wang, X. Optimization of Fe2+ supplement in anaerobic digestion accounting for the Fe-bioavailability. Bioresour. Technol. 2018, 250, 163–170. [Google Scholar] [CrossRef] [PubMed]
- Andreasen, K.; Petersen, G.; Thomsen, H.; Strube, R. Reduction of nutrient emission by sludge hydrolysis. Water Sci. Technol. 1997, 35, 79–85. [Google Scholar] [CrossRef]
- Meng, Y.; Li, S.; Yuan, H.; Zou, D.; Liu, Y.; Zhu, B.; Chufo, A.; Jaffar, M.; Li, X. Evaluating biomethane production from anaerobic mono- and co-digestion of food waste and floatable oil (FO) skimmed from food waste. Bioresour. Technol. 2015, 185, 7–13. [Google Scholar] [CrossRef] [PubMed]
- Wall, D.M.; Allen, E.; Straccialini, B.; O’Kiely, P.; Murphy, J.D. The effect of trace element addition to mono-digestion of grass silage at high organic loading rates. Bioresour. Technol. 2014, 172, 349–355. [Google Scholar] [CrossRef] [PubMed]
- Harrop, T.C.; Mascharak, P.K. Structural and spectroscopic models of the A-cluster of acetyl coenzyme a synthase/carbon monoxide dehydrogenase: Nature’s Monsanto acetic acid catalyst. Coord. Chem. Rev. 2005, 249, 3007–3024. [Google Scholar] [CrossRef]
- Choong, Y.Y.; Norli, I.; Abdullah, A.Z.; Yhaya, M.F. Impacts of trace element supplementation on the performance of anaerobic digestion process: A critical review. Bioresour. Technol. 2016, 209, 369–379. [Google Scholar] [CrossRef]
- Schmidt, T.; Nelles, M.; Scholwin, F.; Proeter, J. Trace element supplementation in the biogas production from wheat stillage—Optimization of metal dosing. Bioresour. Technol. 2014, 168, 80–85. [Google Scholar] [CrossRef]
- Kim, H.W.; Han, S.K.; Shin, H.S. The optimisation of food waste addition as a co-substrate in anaerobic digestion of sewage sludge. Waste Manag. Res. 2003, 21, 515–526. [Google Scholar] [CrossRef] [PubMed]
- Mehariya, S.; Patel, A.K.; Obulisamy, P.K.; Punniyakotti, E.; Wong, J.W.C. Co-digestion of food waste and sewage sludge for methane production: Current status and perspective. Bioresour. Technol. 2018, 265, 519–531. [Google Scholar] [CrossRef] [PubMed]
Figure 1.
Effect of the ratios of chemically enhanced primary sedimentation (CEPS) to food waste (FW)(CEPS/FW) -and anaerobic digestion (AD) time on soluble chemical oxygen demands (SCOD) concentrations.
Figure 1.
Effect of the ratios of chemically enhanced primary sedimentation (CEPS) to food waste (FW)(CEPS/FW) -and anaerobic digestion (AD) time on soluble chemical oxygen demands (SCOD) concentrations.

Figure 2.
Changes in VFAs concentrations at different CEPS/FW ratios.
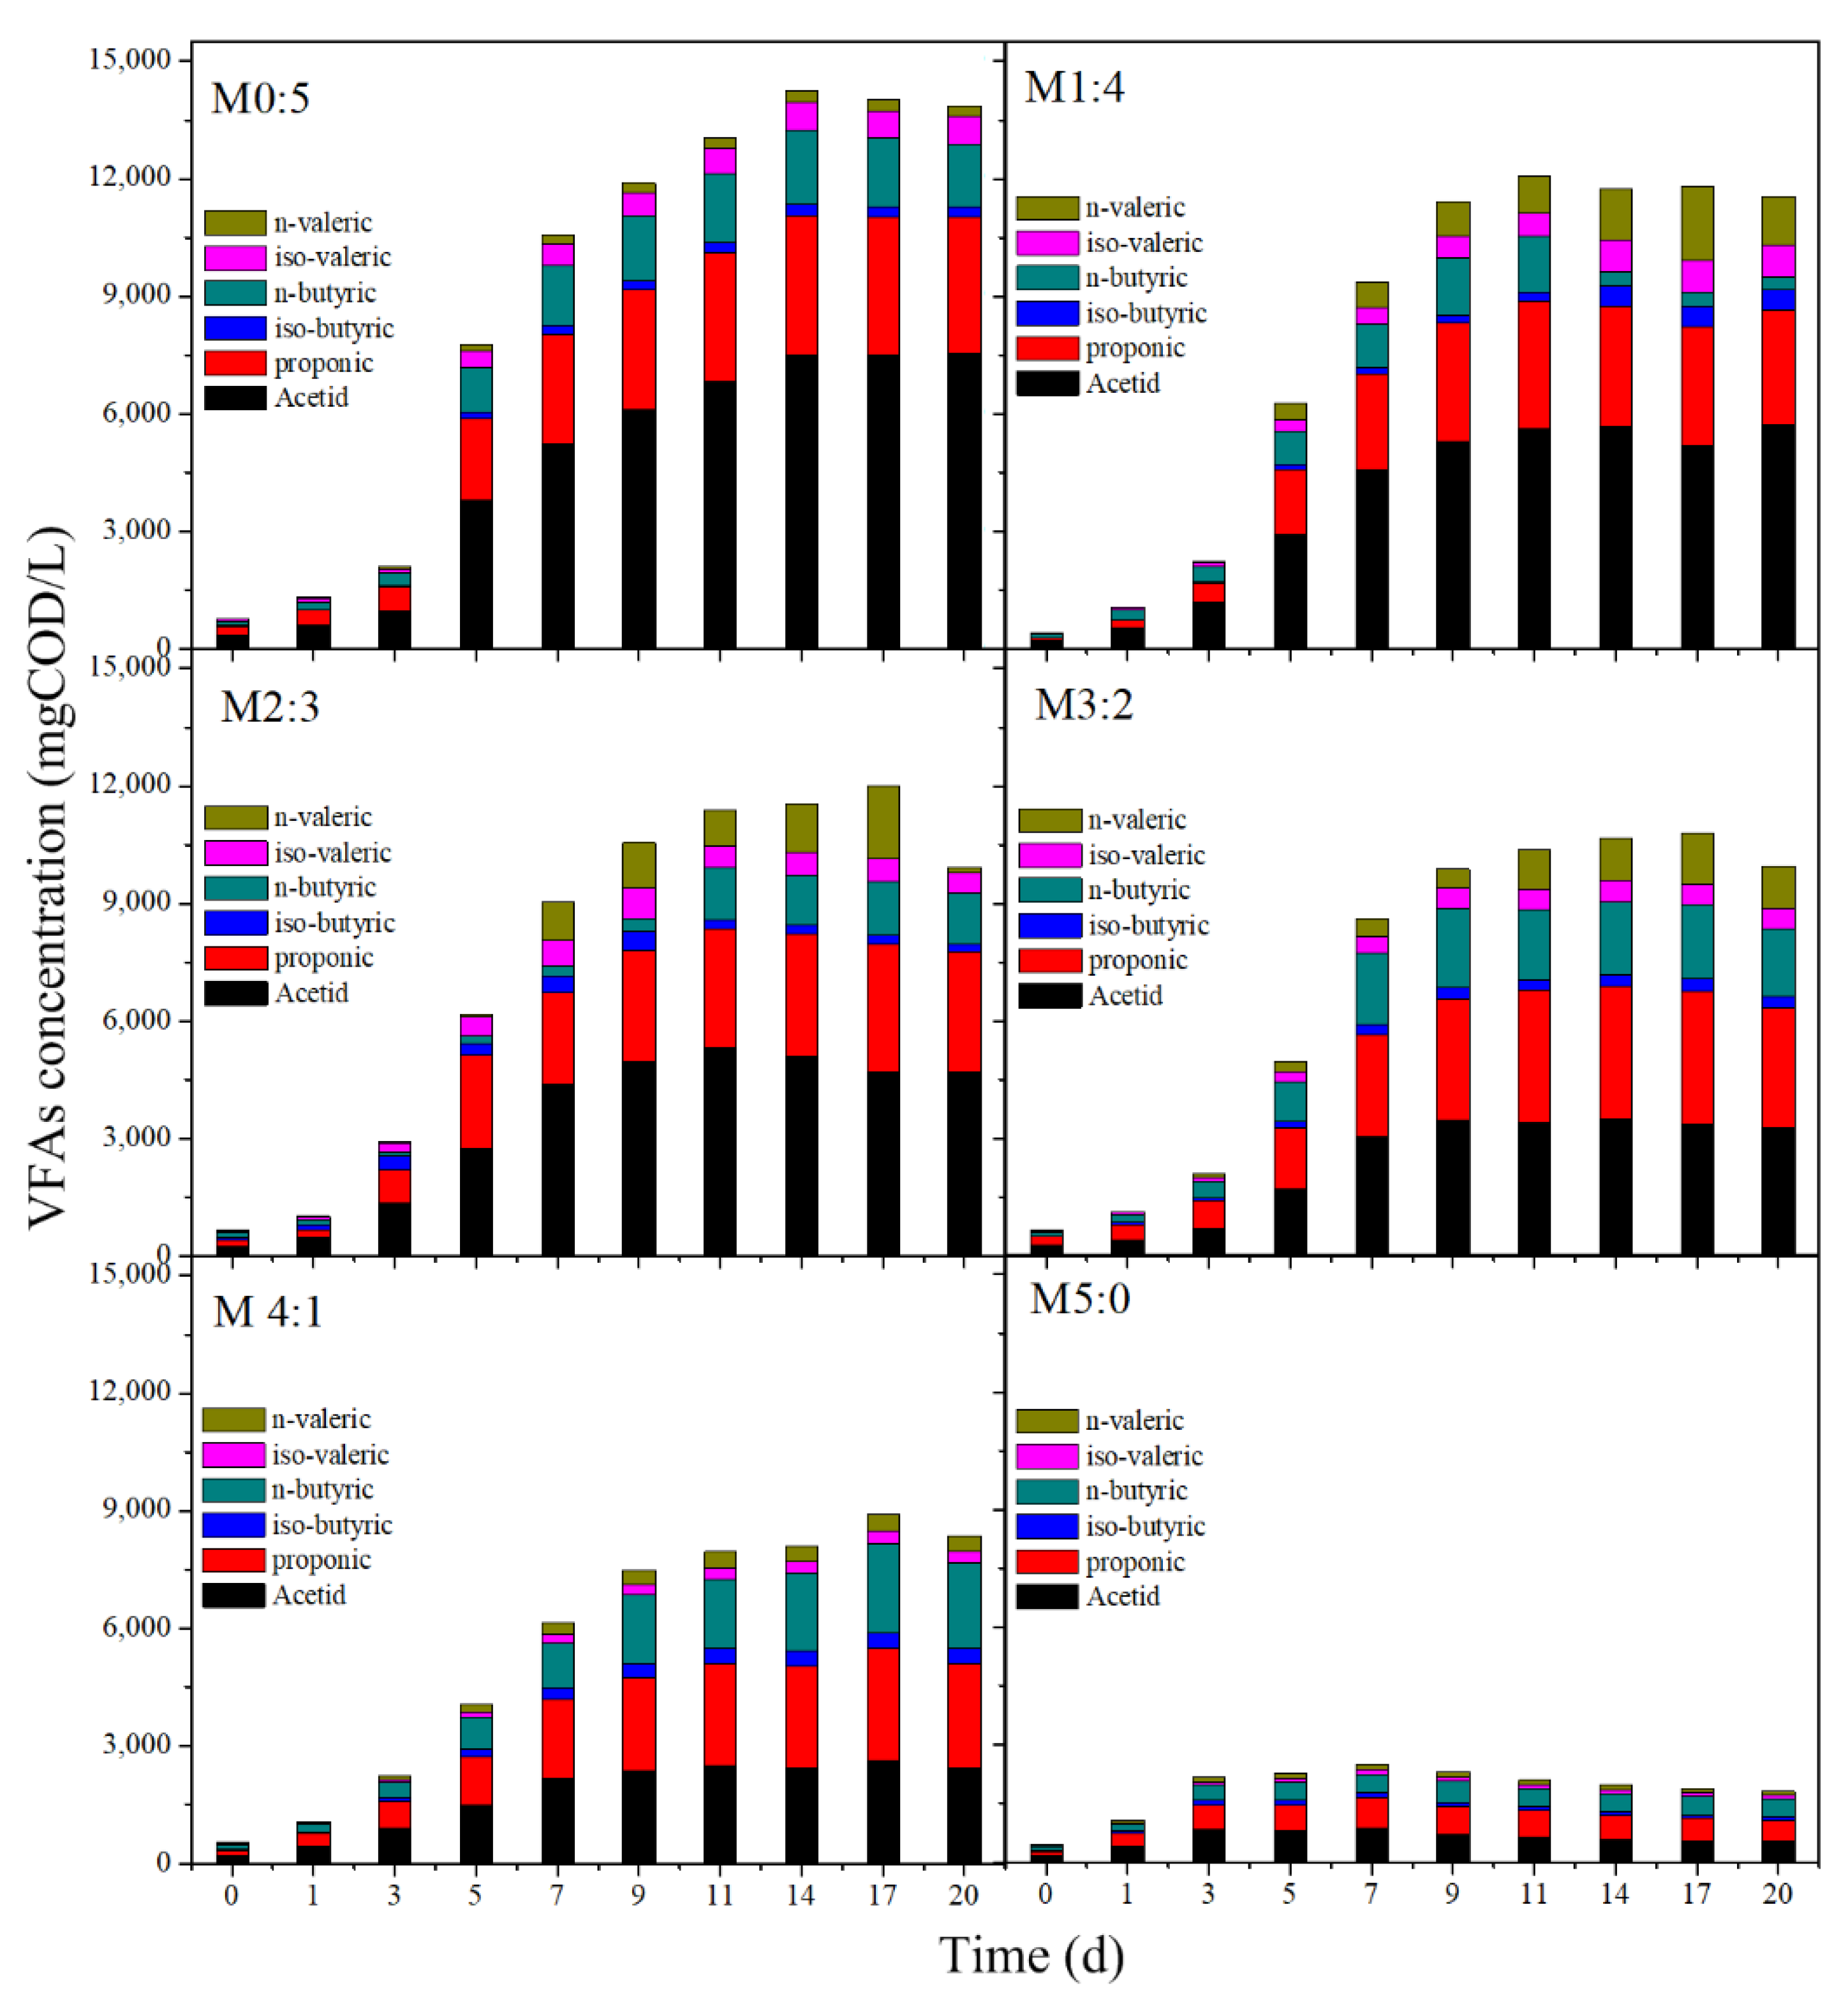
Figure 3.
Effect of CEPS/FW ratios and AD time on cumulative biogas production.

Figure 4.
Effect of CEPS/FW ratios on the activity of (a) protease and (b) F420.


Table 1.
The anaerobic co-digestion (coAD) performances of FW and CEPS.
| Parameters | M0:5 | M1:4 | M2:3 | M3:2 | M4:1 | M5:0 |
|---|---|---|---|---|---|---|
| Initial volatile solids (VSs) | 21.12 ± 0.4 | 19.97 ± 0.52 | 18.82 ± 0.58 | 17.66 ± 0.54 | 16.51 ± 0.61 | 15.36 ± 0.6 |
| End VSs | 13.19 ± 0.5 | 12.10 ± 0.33 | 11.16 ± 0.28 | 10.30 ± 0.31 | 10.21 ± 0.42 | 11.59 ± 0.41 |
| VSs removal (%) | 37.56 ± 0.82 | 39.43 ± 1.32 | 40.68 ± 3.42 | 41.70 ± 2.03 | 38.12 ± 0.81 | 24.53 ± 0.65 |
| Biogas yield (mL/g VSremoval) | 86.93 ± 7.8 | 108.99 ± 7.8 | 212.16 ± 8.4 | 288.42 ± 6.7 | 446.39 ± 7.1 | 247.50 ± 5.3 |
© 2019 by the authors. Licensee MDPI, Basel, Switzerland. This article is an open access article distributed under the terms and conditions of the Creative Commons Attribution (CC BY) license (http://creativecommons.org/licenses/by/4.0/).
Share and Cite
MDPI and ACS Style
Kang, X.; Liu, Y. Chemically Enhanced Primary Sludge as an Anaerobic Co-Digestion Additive for Biogas Production from Food Waste. Processes 2019, 7, 709. https://doi.org/10.3390/pr7100709
AMA Style
Kang X, Liu Y. Chemically Enhanced Primary Sludge as an Anaerobic Co-Digestion Additive for Biogas Production from Food Waste. Processes. 2019; 7(10):709. https://doi.org/10.3390/pr7100709
Chicago/Turabian StyleKang, Xiaorong, and Yali Liu. 2019. "Chemically Enhanced Primary Sludge as an Anaerobic Co-Digestion Additive for Biogas Production from Food Waste" Processes 7, no. 10: 709. https://doi.org/10.3390/pr7100709
Note that from the first issue of 2016, this journal uses article numbers instead of page numbers. See further details here.