A Study of Cake Filtration Parameters Using the Constant Rate Process


1
Department of Chemical Engineering, Sirte University, Sirte, Libya
2
School of Chemical and Process Engineering, University of Leeds, Leeds LS2 9JT, UK
3
Department of Chemical Engineering, Loughborough University, Loughborough LE11 3TU, UK
*
Author to whom correspondence should be addressed.
Processes 2019, 7(10), 746; https://doi.org/10.3390/pr7100746
Submission received: 29 August 2019
/
Revised: 10 October 2019
/
Accepted: 11 October 2019
/
Published: 15 October 2019
(This article belongs to the Special Issue Wastewater Treatment Processes)
Abstract
:The minerals calcium carbonate and talc were filtered under various conditions of filtrate flow rate and suspension concentration, using constant rate conditions with the aid of a peristaltic pump to draw the filtrate. Cake concentrations of between 0.41 and 0.53 v/v for calcium carbonate and 0.19 and 0.26 v/v for talc were recorded. The mean sizes of the two different minerals were very similar, but the average specific resistances obtained from the experiments were 5.9 × 10¹⁰ and 7.4 × 10¹¹ m/kg for calcium carbonate and talc, respectively. These results do not agree with what would be predicted from an analytical equation for permeability, such as Kozeny-Carman. In addition, discontinuities were observed in all cases on the curves of filtrate volume with time for the initial stage of filtration. This behaviour is attributed to retarded packing compressibility (RPC) complicating the analysis of the filter medium resistance. RPC is an important component in determining the filter cake resistance and its functionality with cake forming pressure. It is found that there are additional effects that enhance the resistance to permeation in different cake materials, which is not recognised in the standard analytical approaches. These complexities can be related to shape, polydispersity, or agglomeration within the material sample and not to the experimental equipment or procedure. Furthermore, a complete and straightforward methodology is presented in this work for investigating the significance, or otherwise, of medium resistance on the later stages of the filtration.
1. Introduction
Cake filtration is important in many processes. However, the analysis and design of filtration operations is still largely dependent on heuristics and experimentation. In industry, constant rate filtration (CRF) is a widely practiced and mature technology to recover both the solids and the filtrate, or only one of these [1,2]. There are a number of advantages to use CRF over the alternative of constant pressure filtration (CPF). For example, constant rate filtration operates at low pressures at the start of the filtration cycle, and thus any fine particles present are less likely to penetrate the filter medium leading to filter medium blinding [3,4]. In addition, the CRF provides more reliable data at the start of the filtration that can help to determine a value for the filter medium resistance (Rm). The reliability of this data is greater than what is normally obtained from the alternative CPF, where a negative intercept on the classical t/V plot used for data analysis is often found [5,6].
The common objective in many laboratory filtration experiments include determination of the filter cake permeability, or specific cake resistance to filtration, and how it varies with filtration pressure, as well as information on the filter medium resistance, after it has stabilised [7,8]. It has been proposed that a homogeneous constant growth rate of cake, using a constant rate, provides a better packing structure of particles that is independent of cake thickness [6,9,10]. In addition, reports by many authors [11,12,13,14,15,16,17] indicate that, for the cake and the medium, the measured resistances are influenced by the migration of the fine particles, which increases the interactions between the particles and reduces fluid flow rates through them. When filtering suspension with low initial concentrations, the ability of fine particles to migrate into the filter medium is greater. Therefore, during the initial stages of filtration, the medium resistance will rapidly increase to what is assumed to be a constant value, owing to clogging by fine particles, but is often orders of magnitude greater than the medium resistance in the absence of solids [11,12,13,14,15].
However, it is worth noting that the most noticeable variation of specific resistance with pressure is found within the lower pressure range. As pressure increases, the change in resistance becomes less pronounced, as would be expected of a power law relationship, such as that shown in Equation (1). Hence, the most relevant region to investigate is the lower pressure one [5] which is possible to do using a CRF system, as utilised in this work.
It is usual to define an average cake concentration and average specific resistance, both of which may be a function of the applied pressure over the cake at any instance in time. Increasing the applied pressure increases the cake density by reducing the spaces between particles. The common equations used to correlate both the average specific resistance (αav) and the average concentration (Cav) respectively with pressure, are given in Equations (1) and (2)
where ∆Pc is the pressure drop across the cake (Pa), α0 is the specific cake resistance (m/kg) for zero applied pressure, while C0 is the bed concentration (m3/m3) for the same conditions. The power law exponents n and m are other constants for the material, called its compressibility coefficients (relating to the cake resistance and concentration, respectively). Values for αav can be determined experimentally by performing a series of filtrations at different pressures, allowing the resistance exponent n to be evaluated in a relative straight forward manner. While the same is possible for the cake concentration, to find the exponent m, it is more difficult to determine accurately experimentally. However, it can be normally assessed to the required degree, simply from measuring the change in cake height.
Although the cake filtration behaviour of both incompressible and compressible filter cakes is now more understood, there still remains many fundamental issues, such as the difficulty of changing the cake structure with different applied pressures or cake thicknesses. Additionally, the influence of sedimentation during the initial stage of filtration is another problem that needs to be better understood. According to Rietema [18,19], the so-called retarded packing compressibility (RPC) can be found in both constant pressure and constant rate filtration with almost any kind of material (compressible and incompressible). This phenomenon occurs only after some time after the initial filtration stage and for a critical cake height. The phenomenon is represented by two different upper and lower formed cake layers. The upper layer retains its original packing structure and porosity, while the lower is much denser packing with increasing resistance. He also found that, in the case of observing this phenomenon during constant rate filtration, the rate of pressure increase suddenly jumps to a higher and constant value, which is due to the specific resistance increase at the bottom of the cake. As a result, the measured pressure and porosity distribution as well as the filtration rate with cake thickness are affected by this phenomenon. Similar behaviour to an RPC has also been noted by other authors [20,21,22].
On the other hand, the retarded packing compressibility (RPC) phenomena has only limited support, and there are a number of researchers including Shirato et al. [23,24] and Murase et al. [25] who do not accept Rietema’s results, while it has still not fitted fully into existing and developing theories of cake filtration. They suggested that this behaviour was related to the presence of pin electrodes that did not allow normal compression to occur within the experimental equipment. Moreover, Tarleton et al. [2] and Sorensen et al. [26] claim that the maximum solid concentration of the formed cake may be reached away from the medium at a position into the cake. Furthermore, in some cases, there are temporary increases in filtrate flow for a short time, which is accompanied by a sudden increase in the turbidity of the filtrate, whereupon the filtration rate returned to the original level. Tarleton et al. [27] concluded that this behaviour is more likely to occur during the filtration of suspensions containing structured or more loosely bound particles. Recognising the previous aspects, it is not easy to obtain values of average permeability or specific resistance for all materials used in filtration. The permeability (k) of a filter cake is related to its cake specific resistance by Equation (3).
where k is the hydraulic permeability (m2), C is the solid concentration by volume (m3/m3) and is the density of solids (kg/m3).
Efforts to predict the permeability (or resistance) to filtration from particle size data are notoriously inaccurate for many systems, especially for irregular shaped or cohesive particle beds. Hence, there is still need for experimental empiricism to explain behaviour, for the purpose of scale up and design, and critical uncertainty in the analysis of filtration results due to the above reviewed phenomena. Well known models of permeability (and hence specific resistance) contain terms representing the specific surface area per unit volume of the particles (and thereby the particle size) and the solids volume fraction. The porous media permeability can be deduced from the Kozeny-Carman equation by using Equation (4) or Equation (5).
or in terms of a mean size (Sauter diameter):
where C is the volume fraction of solids present, Sv is the specific surface area per unit volume of the particles, (1/m) and K is the Kozeny coefficient, where a value of 5 is used as is conventionally assumed in text book for packed beds [28,29]. The permeability may be converted to specific resistance using Equation (3), but attempts to predict specific resistance from particle size analysis data usually fail by at least one order of magnitude [5] with the resistance being greater than that predicted. The choice of any particular diameter for characterisation of an irregular particle depends on the intended application in most cases [30,31]. When the particle is non-spherical, the determination of a single particle size is not a simple task. Either particle orientation or direction affects the measurement of common statistical diameters [32]. Rhodes [33] reported a number of different geometrical sizes as well as different dynamic ones together with the statistical diameters. In this work, the Sauter mean diameter () being the diameter of a sphere with the same average specific surface area per unit volume was used. This diameter is applicable for systems where the surface area is the determining factor and particle samples have relatively narrow size distributions.
In this research, the effect of the initial filtration period on the cake specific resistance and permeability will be investigated in detail. To study this period for different materials, two particulate materials are reported, with similar particle size distributions: one mildly compressible (talc) the other substantially incompressible (calcium carbonate). Constant rate filtration will be used in this system because of two main reasons: (a) Upper and lower limits on the variation of solids pressure in the filter cake can easily be obtained and (b) the particle packing structure is expected to be independent of cake thickness, so that uniform compacts are formed [5]. This will enable some critical understanding on the differences between predicted and permeabilities from known analytical expressions and the measured values.
2. Materials and Methods
2.1. Materials
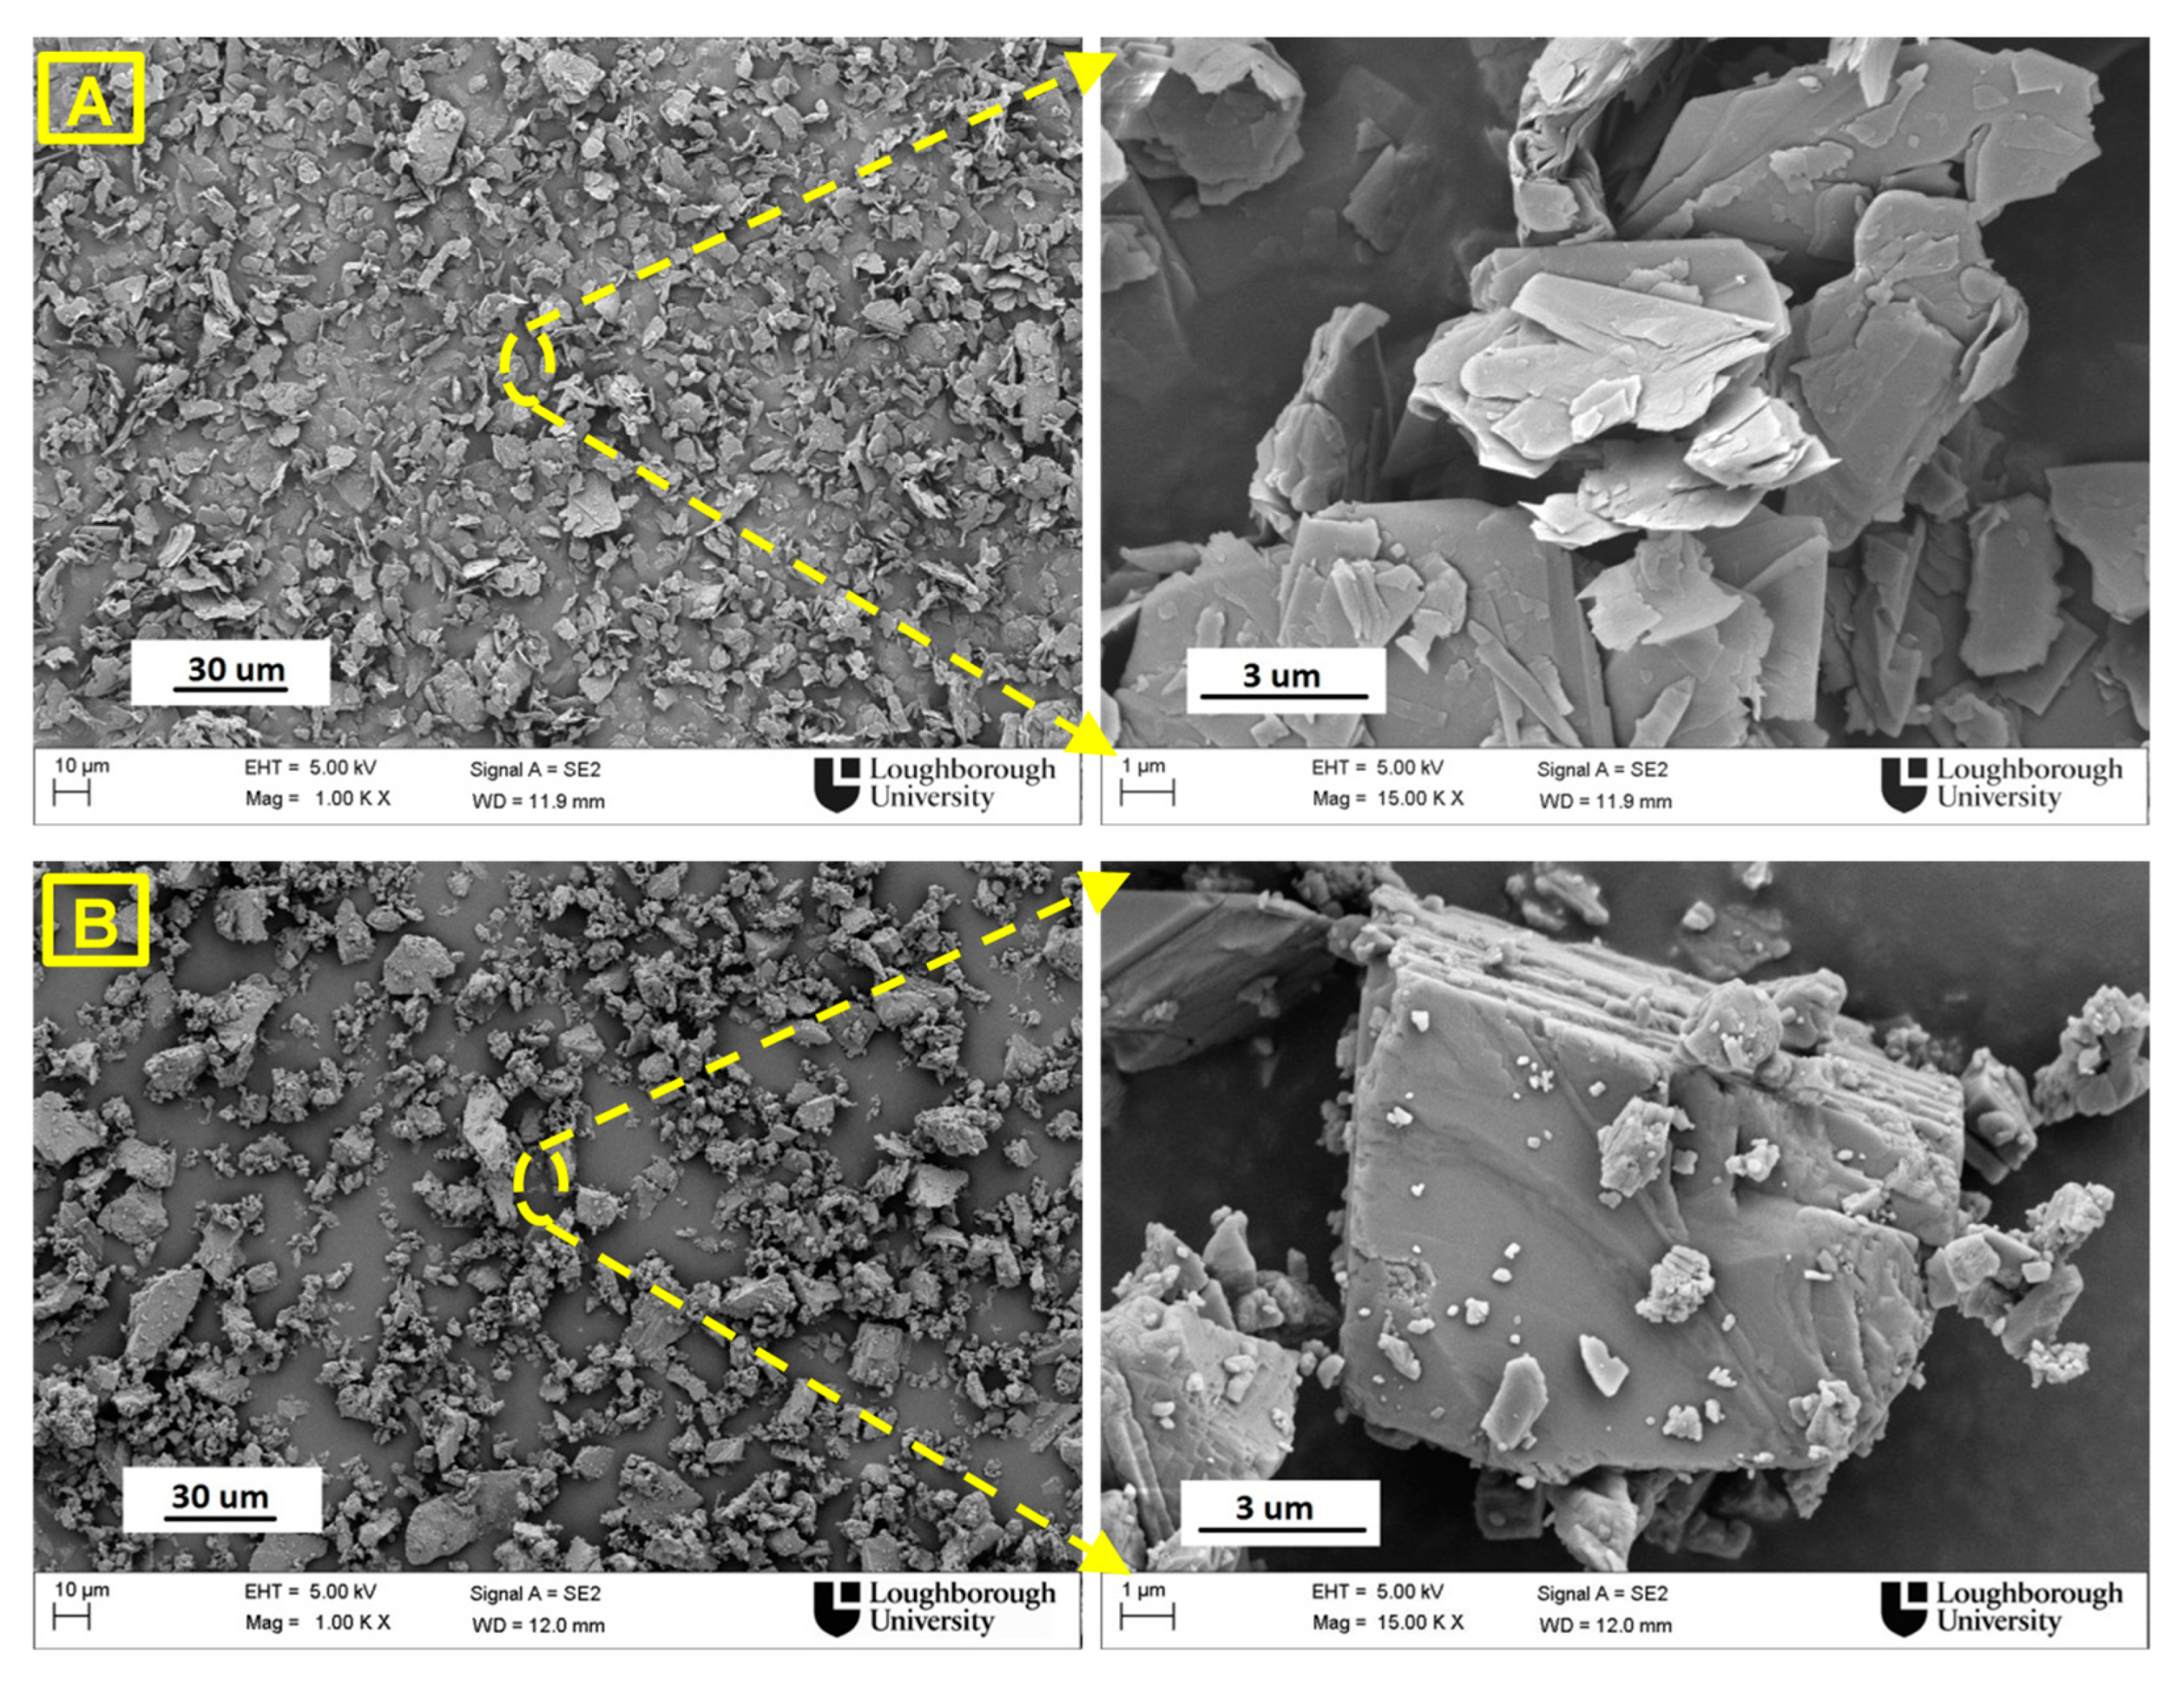
Two different particle beds were used in order to study both compressible and incompressible systems. Suspensions of talc (White-Talc MINELCO) at different solid concentrations of 0.01, 0.02, 0.03, 0.04, and 0.05 by volume were prepared, and were assumed to be representative of a compressible system. For an assumed incompressible system (as discussed below within the compressibility tests section) suspensions of aqueous calcium carbonate (Fordacal-30 MINELCO) at 0.09, 0.11, 0.13, 0.15, 0.17, 0.19, and 0.21 by volume of solid concentration were used. Each suspension was prepared by dispersing the dry powder into reverse osmosis water (RO-water) to avoid the ionic variation found in tap water usage. The natural pH (constant for all the tests), Sauter mean diameters and densities of both materials were measured, as shown in Table 1. Scanning electron microscope (FEGSEM Jeol 7100 SEM) images for both powders were taken (see Figure 1). To investigate the physical properties of each material and check the difference between them as well as their influence on the filtration results, a number of additional characterisation tests were conducted.
Zeta potential measurements: Both pH and Zeta potential were performed on an Acoustosizer IIS™ by conducting a potentiometric series of tests at room temperature (20 ± 2 °C) using 150 mL of RO-water for both solids. As shown in Table 1, although the Zeta potential of calcium carbonate is positive and relatively low (+7.5 mV), it is negative for talc (up to −16 mV). In general, calcium carbonate is a system where surface effects are relatively small [34] and the low positive value is consistent with previous literature [35]. According to Gribble et al. [36], the structure of talc consists of a magnesium hydroxide (Mg(OH)2) layer sandwiched between two sheets of silica (SiO2). These layers of talc are approximately 19 Å thick and they are held together by weak Van der Waal’s forces. The edges of the talc are predominantly hydrophilic hydroxide groups, whereas the faces have hydrophobic groups. Hence, the measured Zeta potential is the net charge over the differing surfaces and the mineral can form structures commonly known as a ‘house of cards’ that are similar to clays.
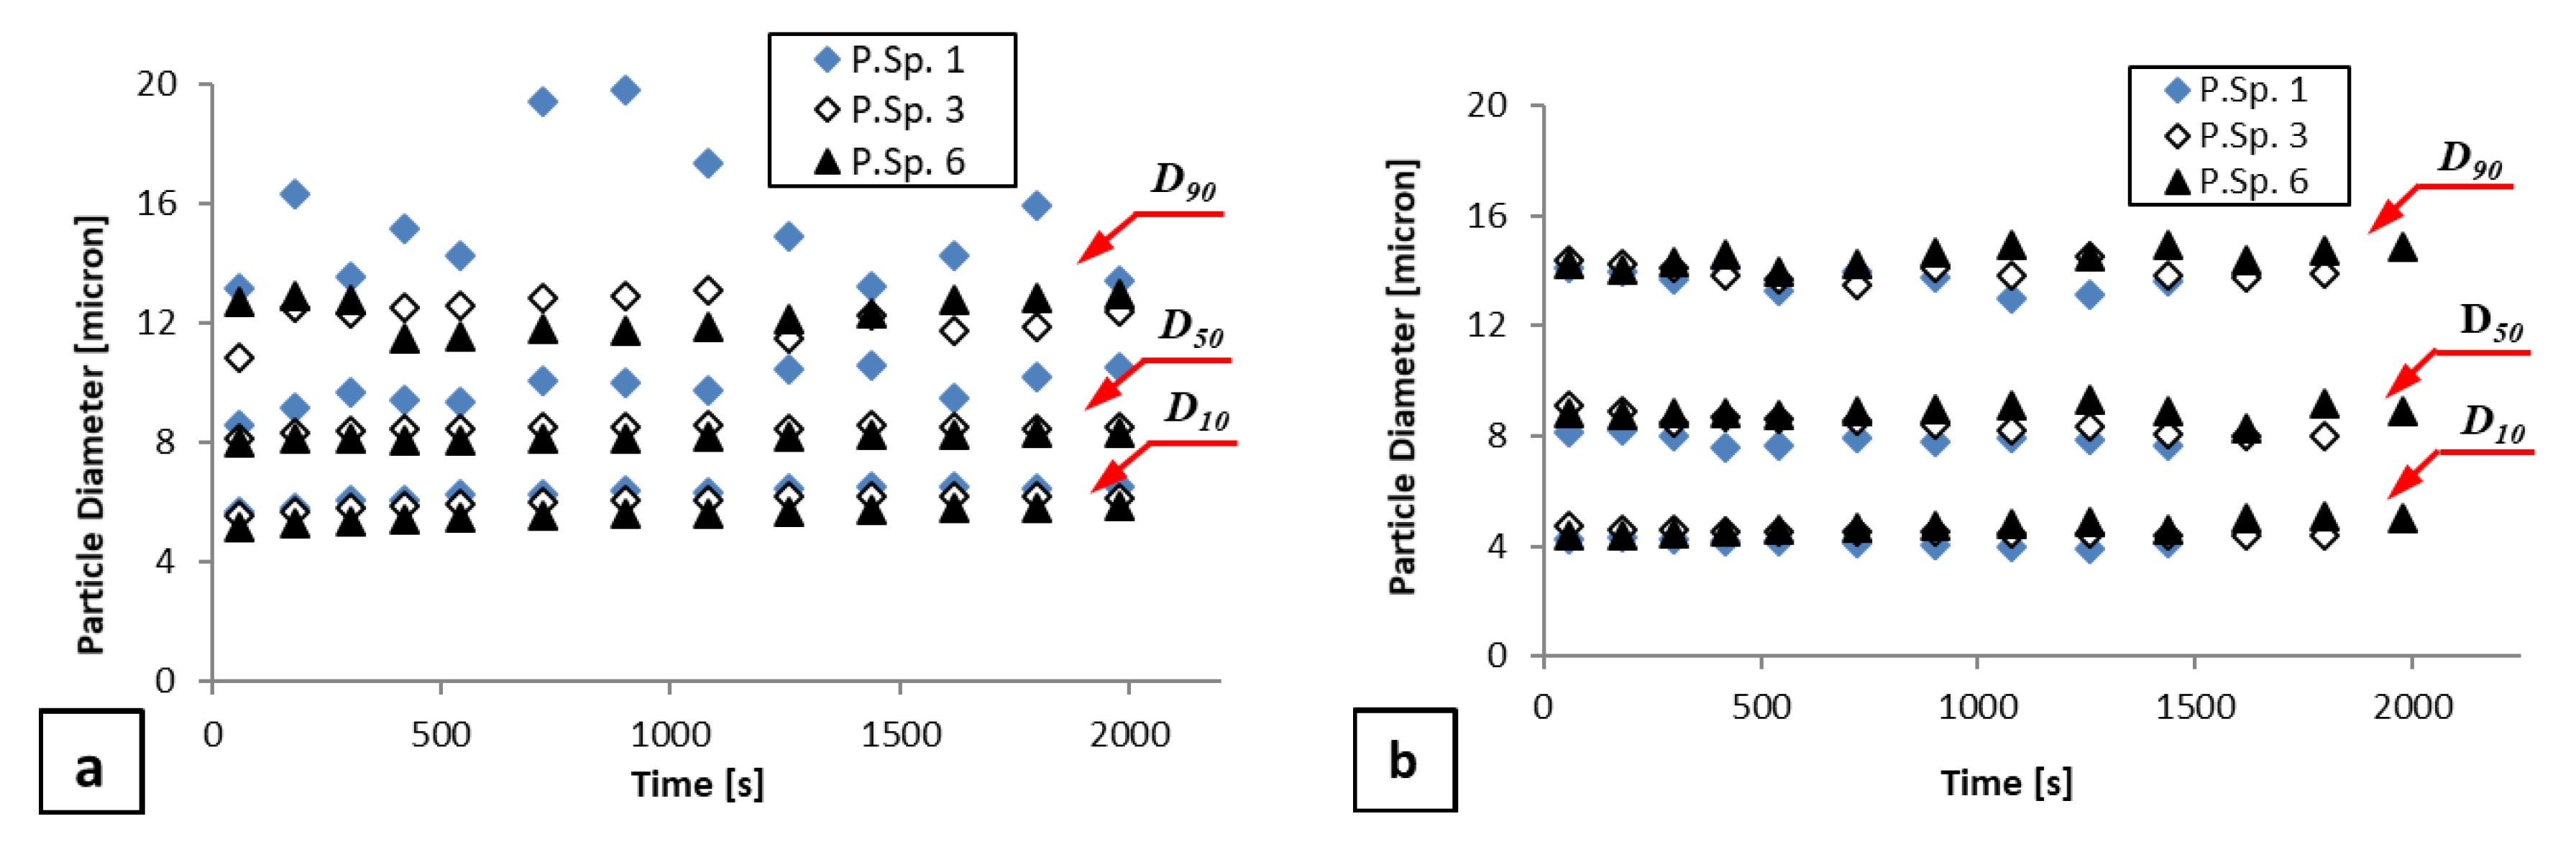
Laser Diffraction size analysis: Two different instruments were used in this work. Initially, the cumulative particle size distributions of both materials based on volume, were measured using a Malvern Mastersizer 2000, where results have been illustrated in Figure S1 within the Electronic Supplementary Information (ESI). A second method was used to study the effect of pumping shear value on the particle size. For this work, a series of tests at different analytical flow cell pump speeds were conducted with a Horiba LA-920 laser diffraction instrument, with sizes are reported with respect to the analysis time, as discussed in a previous study [37]. The circulation system employs a pump with variable speeds corresponding to different shear values. An analysis at different shear rates helped to illustrate both the kinetics of the clustering and the identification of the equilibrium cluster size. Figure 2 shows the variation of D10, D50 and D90 of particle diameters over time for talc and calcium carbonate based on volume distribution. Three different shear rates induced by increasing the pump speed (P.Sp.) were used during the LD analysis. The samples were subjected to various shear rates and sonication energy, in order to monitor the formation of aggregates. Ideally, in situ cluster analysis is required during hindered sedimentation. However, the relatively high concentration of dispersed phase and the consequent light scattering problems made this difficult; hence alternatively, clustering at low concentrations was tested. The results presented in Figure 2 demonstrates no evidence of significant aggregation or clustering on talc or calcium carbonate under the prevailing conditions. It also demonstrates that both materials have very similar median particle size and distributions as determined by the usually reported values of D10, D50, and D90, based on a volume (or mass) particle size distribution.
Compressibility tests: In order to determine the values of the coefficients in the constitutive equations for scale-up constants, a series of runs over the pressure range of 14–67 kPa for talc and 8–80 kPa for calcium carbonate were completed. A summary of the empirical constants obtained through consistent analysis procedures is given in Table 2, indicating the proportional compressibility of both materials. Tiller et al. [38] stated that a material compressibility (n) value of 0.2 suggests a slightly compressed cake. Based on that assumption, calcium carbonate (n = 0.19) is taken as a slightly compressed system, while talc, with a value of n = 0.47 is considered a strongly compressible system. In addition, the average cake resistance and cake concentration can be found by applying the values of α0, C0, n, and m from Table 2 in Equations (2) and (3), respectively.
2.2. Methodology
The filtration system has been previously described in detail within a previous publication [5], and an outline of the equipment and detailed methodology information has been added to the ESI, along with a schematic of the rig (Figure S2). In summary, for each concentration, three different filtrate pump settings were used (5, 10, and 30 rpm) which gave rise to three different filtration rates and cake forming pressure profiles. The same suspension was reused many times, to avoid any variability in the feed material. The loss in the reused suspension was monitored between filtrations and found to be very low (about 1% between runs). The ‘dead volume’ below the micro-porous membrane and within the filter tubes was filled with filtrate from a filtration of similar suspension before starting an experiment, in order to avoid missing filtration data at the very early stages of the experiment, due to filling this dead volume.
Before each series of tests, the suspension was prepared and left at room temperature (20 ± 2 °C) for at least 24 h, with periodic mixing. This time ensured the system had reached ionic equilibrium and avoided thermal gradients. To validate the calculations of the final cake concentrations, a vernier calliper was used (measurement difference is shown in Table 3); measuring cake height over five different positions per test; each position equally spaced on a pitch circle diameter of 25 mm with another position at the centre and using the average cake height in a mass balance to give the cake concentration. Measurements were taken from the top of the cell to the filter medium before starting the experiment, and from the cake surface at the end. The cake height was, therefore, the difference between these two. It was possible to clean the metal slotted filter medium after each run and reuse it. All tests were completed in triplicate. In order to demonstrate the reproducibility of the filtration process, data for calcium carbonate at 30 rpm pump speed and 0.19 v/v is shown in Figure S3 within the ESI.
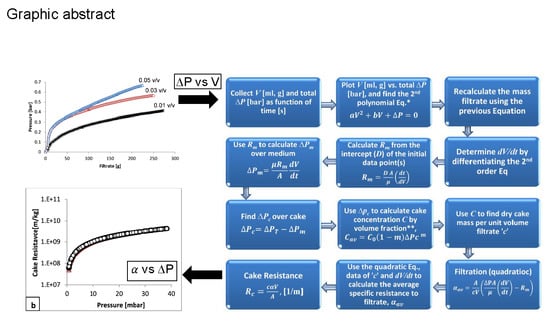
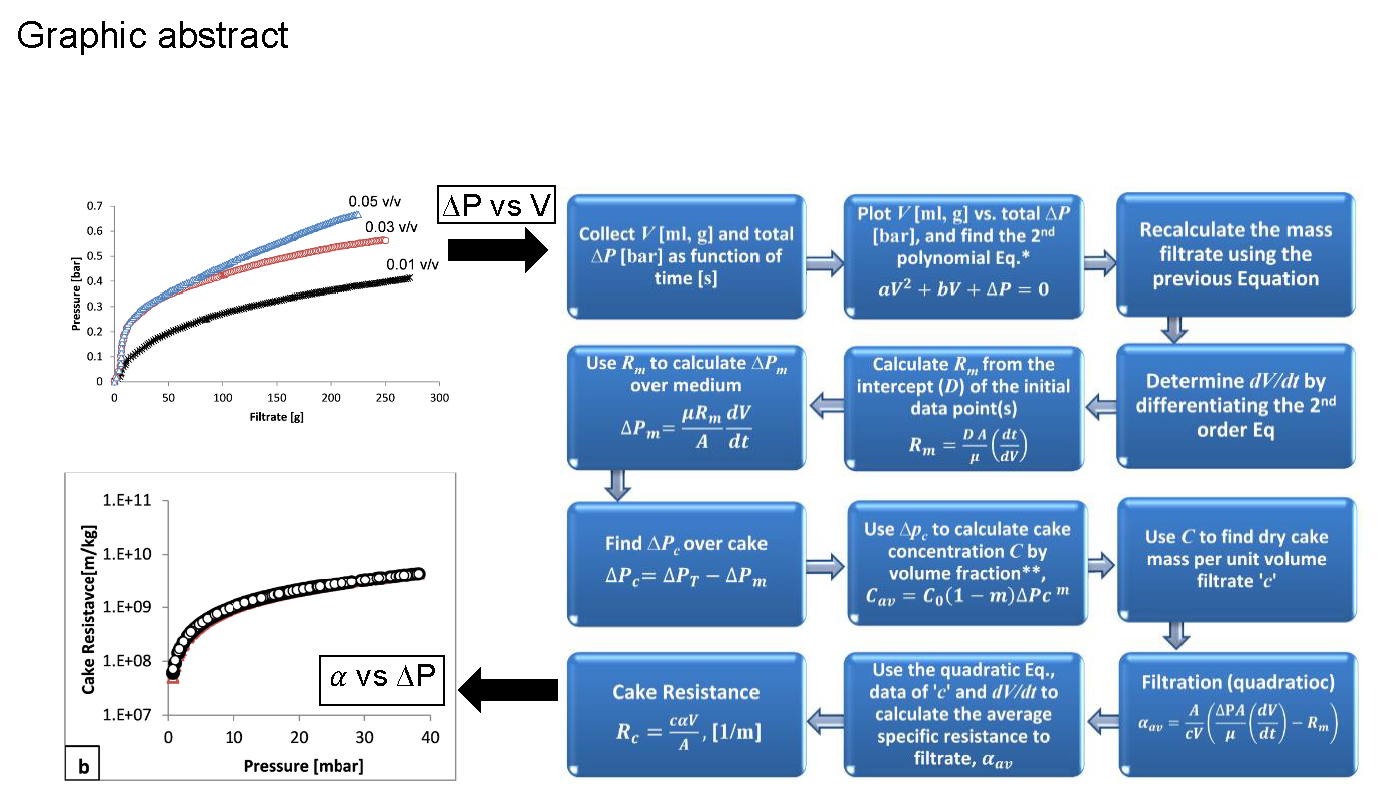
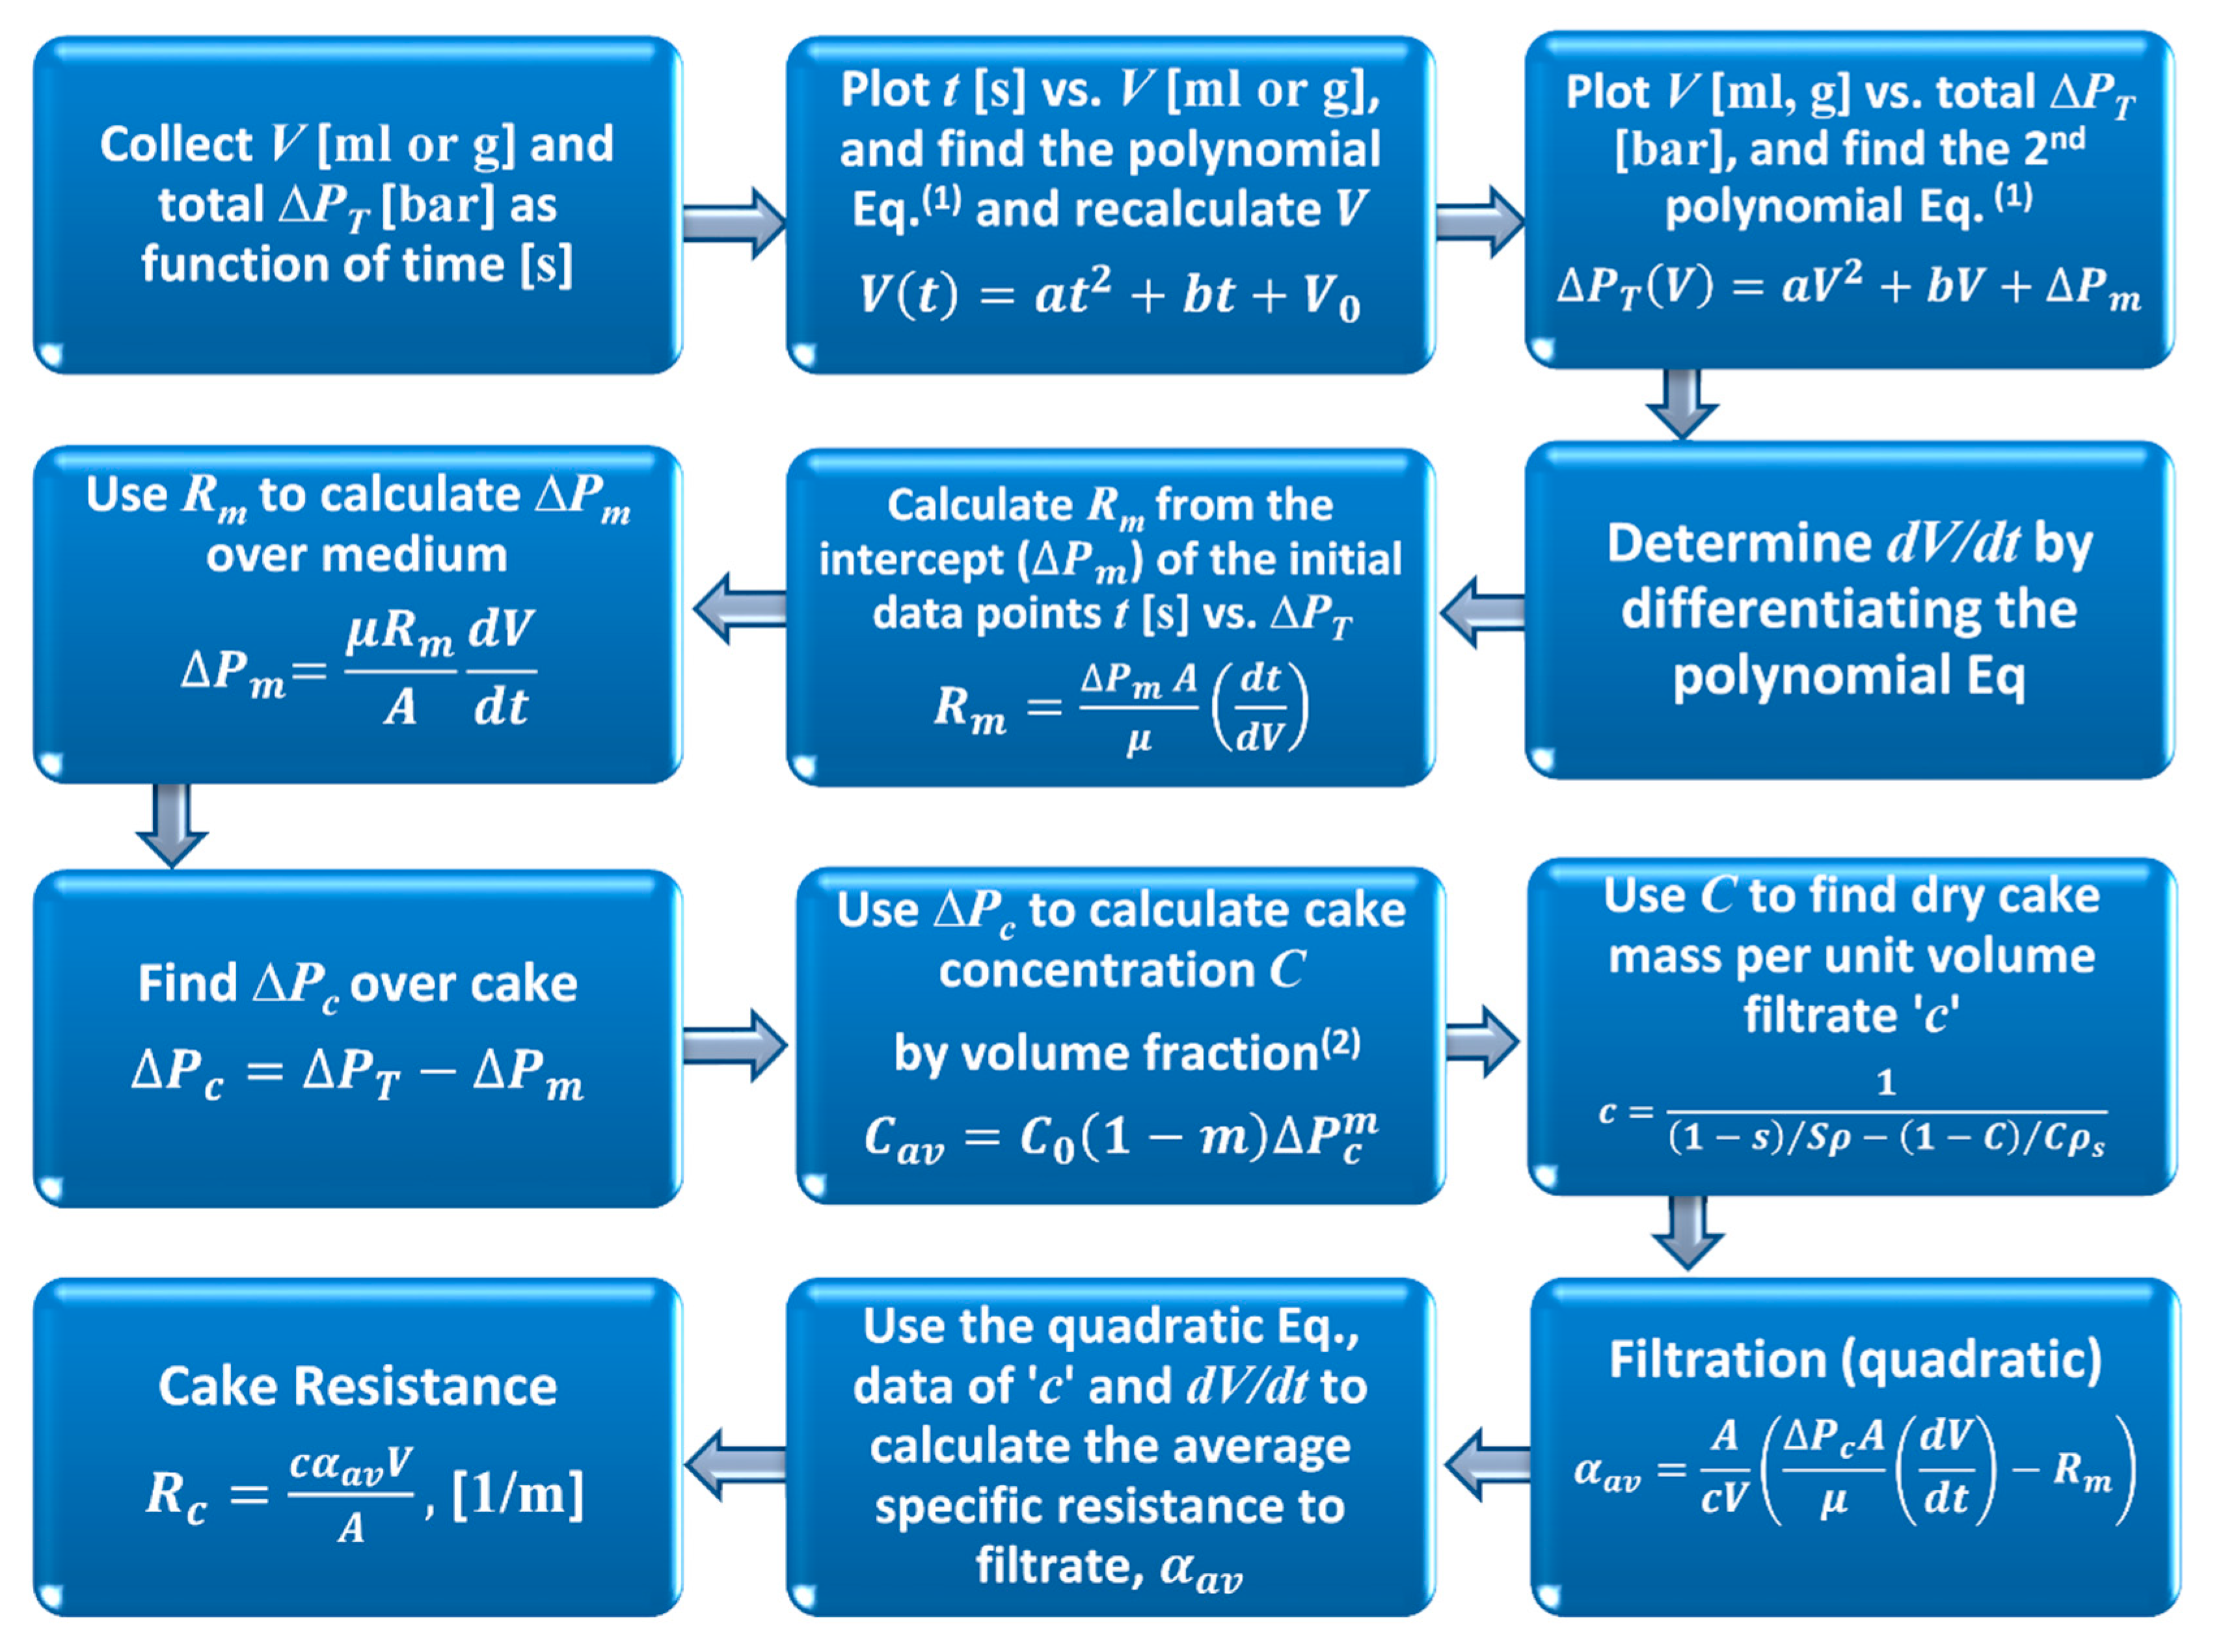
Data Analysis: Figure 3 demonstrates a flowchart for calculating the average cake filtration resistance () from the constant rate data. Both filtrate mass (which is converted to volume) and total pressure in the system were collected as a function of process time for each run (e.g., Figure 5 for talc and Figure 6 for calcium carbonate). The filtrate rate at any instance in time was estimated by assuming a second order polynomial fit between the measured filtrate versus time (as given in Equation (6)). Both the membrane pressure (∆Pm) and the filtrate rate (dV/dt) are obtained from the intercept and differential of the polynomial fit respectively. Additionally, the collected filtrate versus total pressure is plotted (e.g., Figure 4) where again, a second order polynomial is fitted to smooth the data (Equation (7)) and to enable simple calculation of the differential, allowing and constants to be determined, which ultimately enable the membrane and cake resistances to be measured.
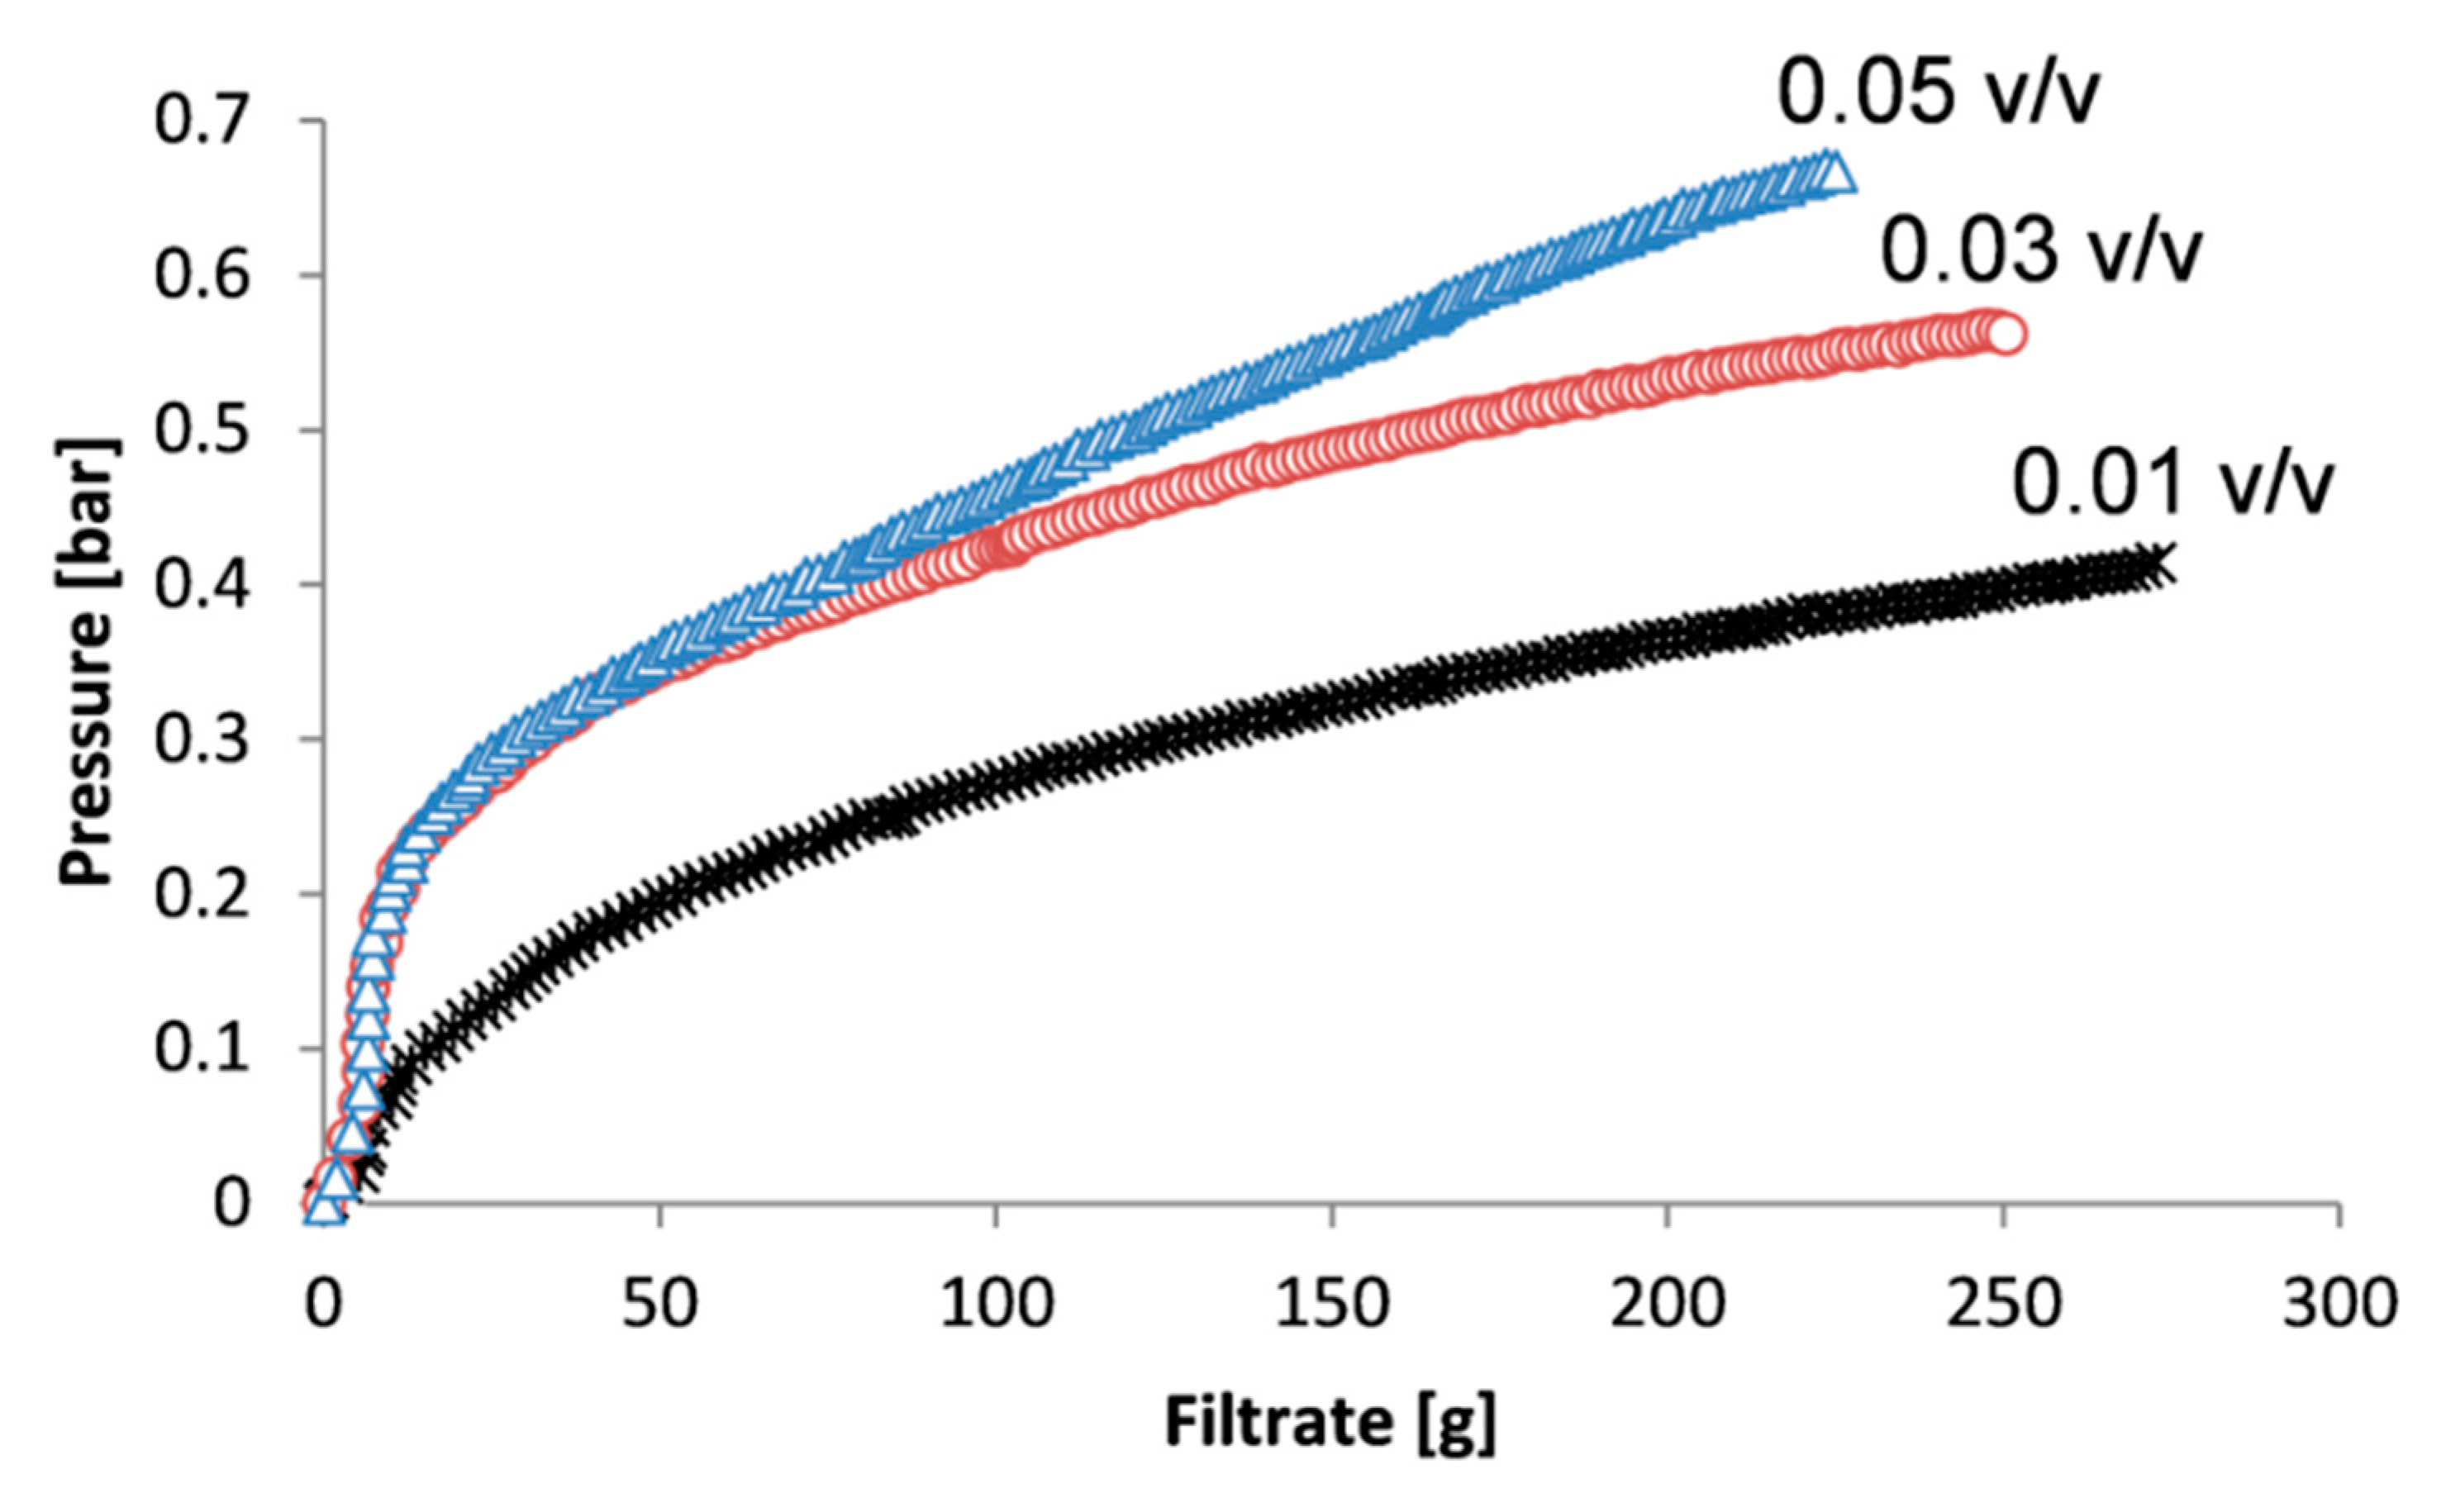
Figure 4 shows three examples of measured filtration pressure vs. filtrate mass at three starting concentrations: 0.01, 0.03, and 0.05 v/v of talc with 30 rpm pump speed, where the intercepts () have found to be 0.058, 0.159, and 0.154 bar, respectively.
where a and b are fit constants, t is the process time (s), is the total filtrate volume (m3), is the initial filtrate volume (m3), is the total measured pressure (Pa) and is the pressure over membrane (Pa). This data-smoothing procedure was adopted to remove random fluctuations in measurements, and it was found necessary to apply different polynomial equations to different regions as discussed in more detail within the results section.
3. Results and Discussion
Figure 4 illustrates three different starting suspension concentrations; 0.01, 0.03 and 0.05 by volume of talc, using the fastest pump speed (30 rpm). Overall, the figure appears to be reasonable; with the greatest suspension of solids showing the highest required filtration pressure. There was no observable evidence of significant gas bubbles being formed in the filtrate line even at the highest differential pressure (vacuum) of 0.7 bar. However, the shape of the figure is slightly unexpected in that there is a small point of inflection near the origin followed by a rapid rise in pressure, before the rate of pressure increase reduces in the latter part of the experiments. This issue will be studied in detail later in this work.
Cake concentration was determined based on the volume of the starting concentration and the volume of filtered slurry, together with the measured filter cake heights and the filter area, using material balances. The relative standard deviation (RSD) of the height measurements is obtained from the standard deviation divided by the average value. The measured heights, calculated cake concentrations, and RSD for both solid materials are shown in Table 3a,b where the RSD of the cake concentration is determined from the variation in cake height measurements over the five measured data points. The RSD, in general, decreases with increasing initial slurry concentration: from about ±12% (0.01 v/v) to less than ±4% (0.05 v/v) feed suspension for talc, an expected consequence of a greater cake height being formed. However, when using calcium carbonate, the RSD varies from about ±2.4% (0.09 v/v) to less than ±1% (0.21 v/v). It is assumed that the cake is of uniform concentration throughout its height as cake volume is small (see Table 3).
As would be expected, a low pump speed (5 rpm) provides a low pressure resulting in a lower specific resistance, as shown in Table 3. Moreover, it is worth noting that the most noticeable variation of specific resistance with pressure is found within the lower pressure range; as pressure increases, the change in resistance becomes less pronounced as would be expected of a power law equation such as that shown in Equation (1). Hence, the most relevant region to investigate is the lower pressure one, as discussed in reference [5]. For that reason, the discussion will focus on lower pump speed (5 rpm).
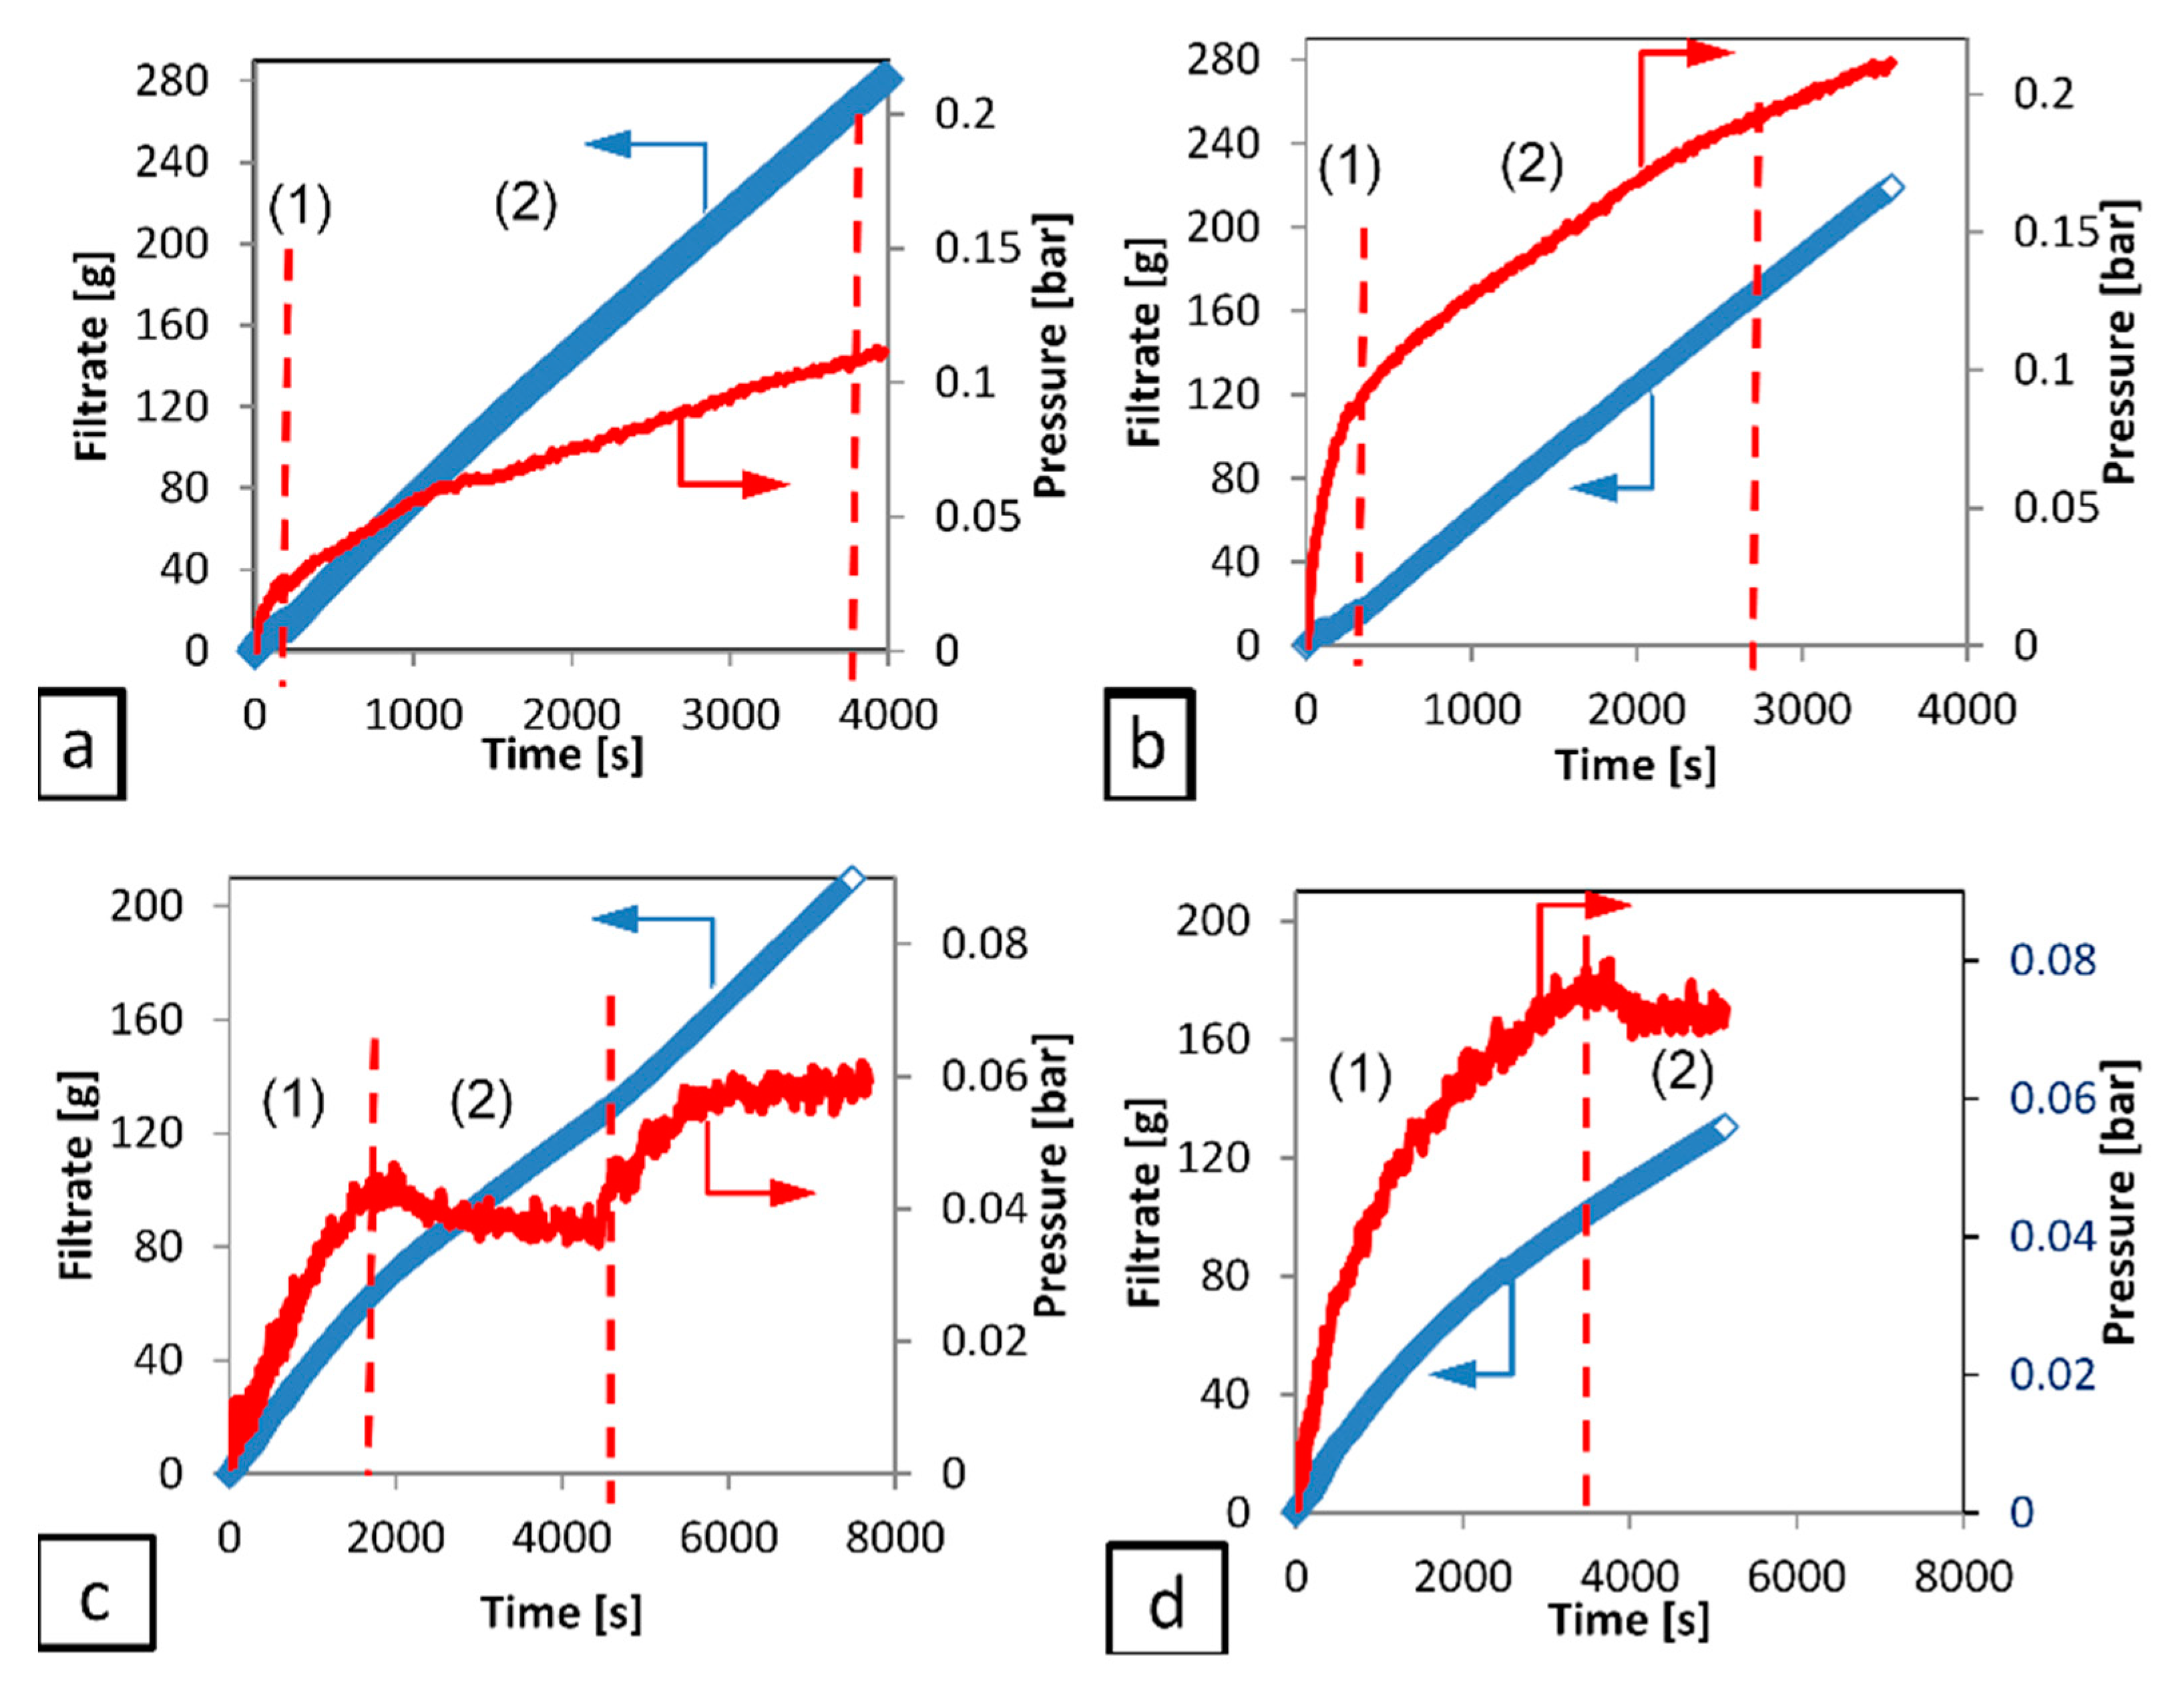
Figure 5 presents the filtrate and total applied pressure difference with time, for the talc and calcium carbonate filtration at the lowest pump speed 5 rpm (cake forming pressure). During talc filtration, the filtrate curve can be divided into two visible sections: rapid and slower filtration rates, as labelled (1) and (2) respectively, which are indicated in the figure by the two dashed vertical lines. Both the filtrate mass and pressure curves illustrate this trend. However, during calcium carbonate filtration, the filtrate curves were generally divided further into three visible sections for lower concentration (0.09 v/v): (1) filtration, (2) permeation (after around 30 min, assumed to be due to particle settling) and (3) cake consolidation (squeezing all liquid between particles). However, only two sections are clearly evident for higher concentrations (0.21 v/v): (1) filtration and (2) permeation. To clarify the difference between both systems (calcium carbonate and talc) the influence of particle sedimentation of both systems during the initial filtration was studied, and will be discussed herein.
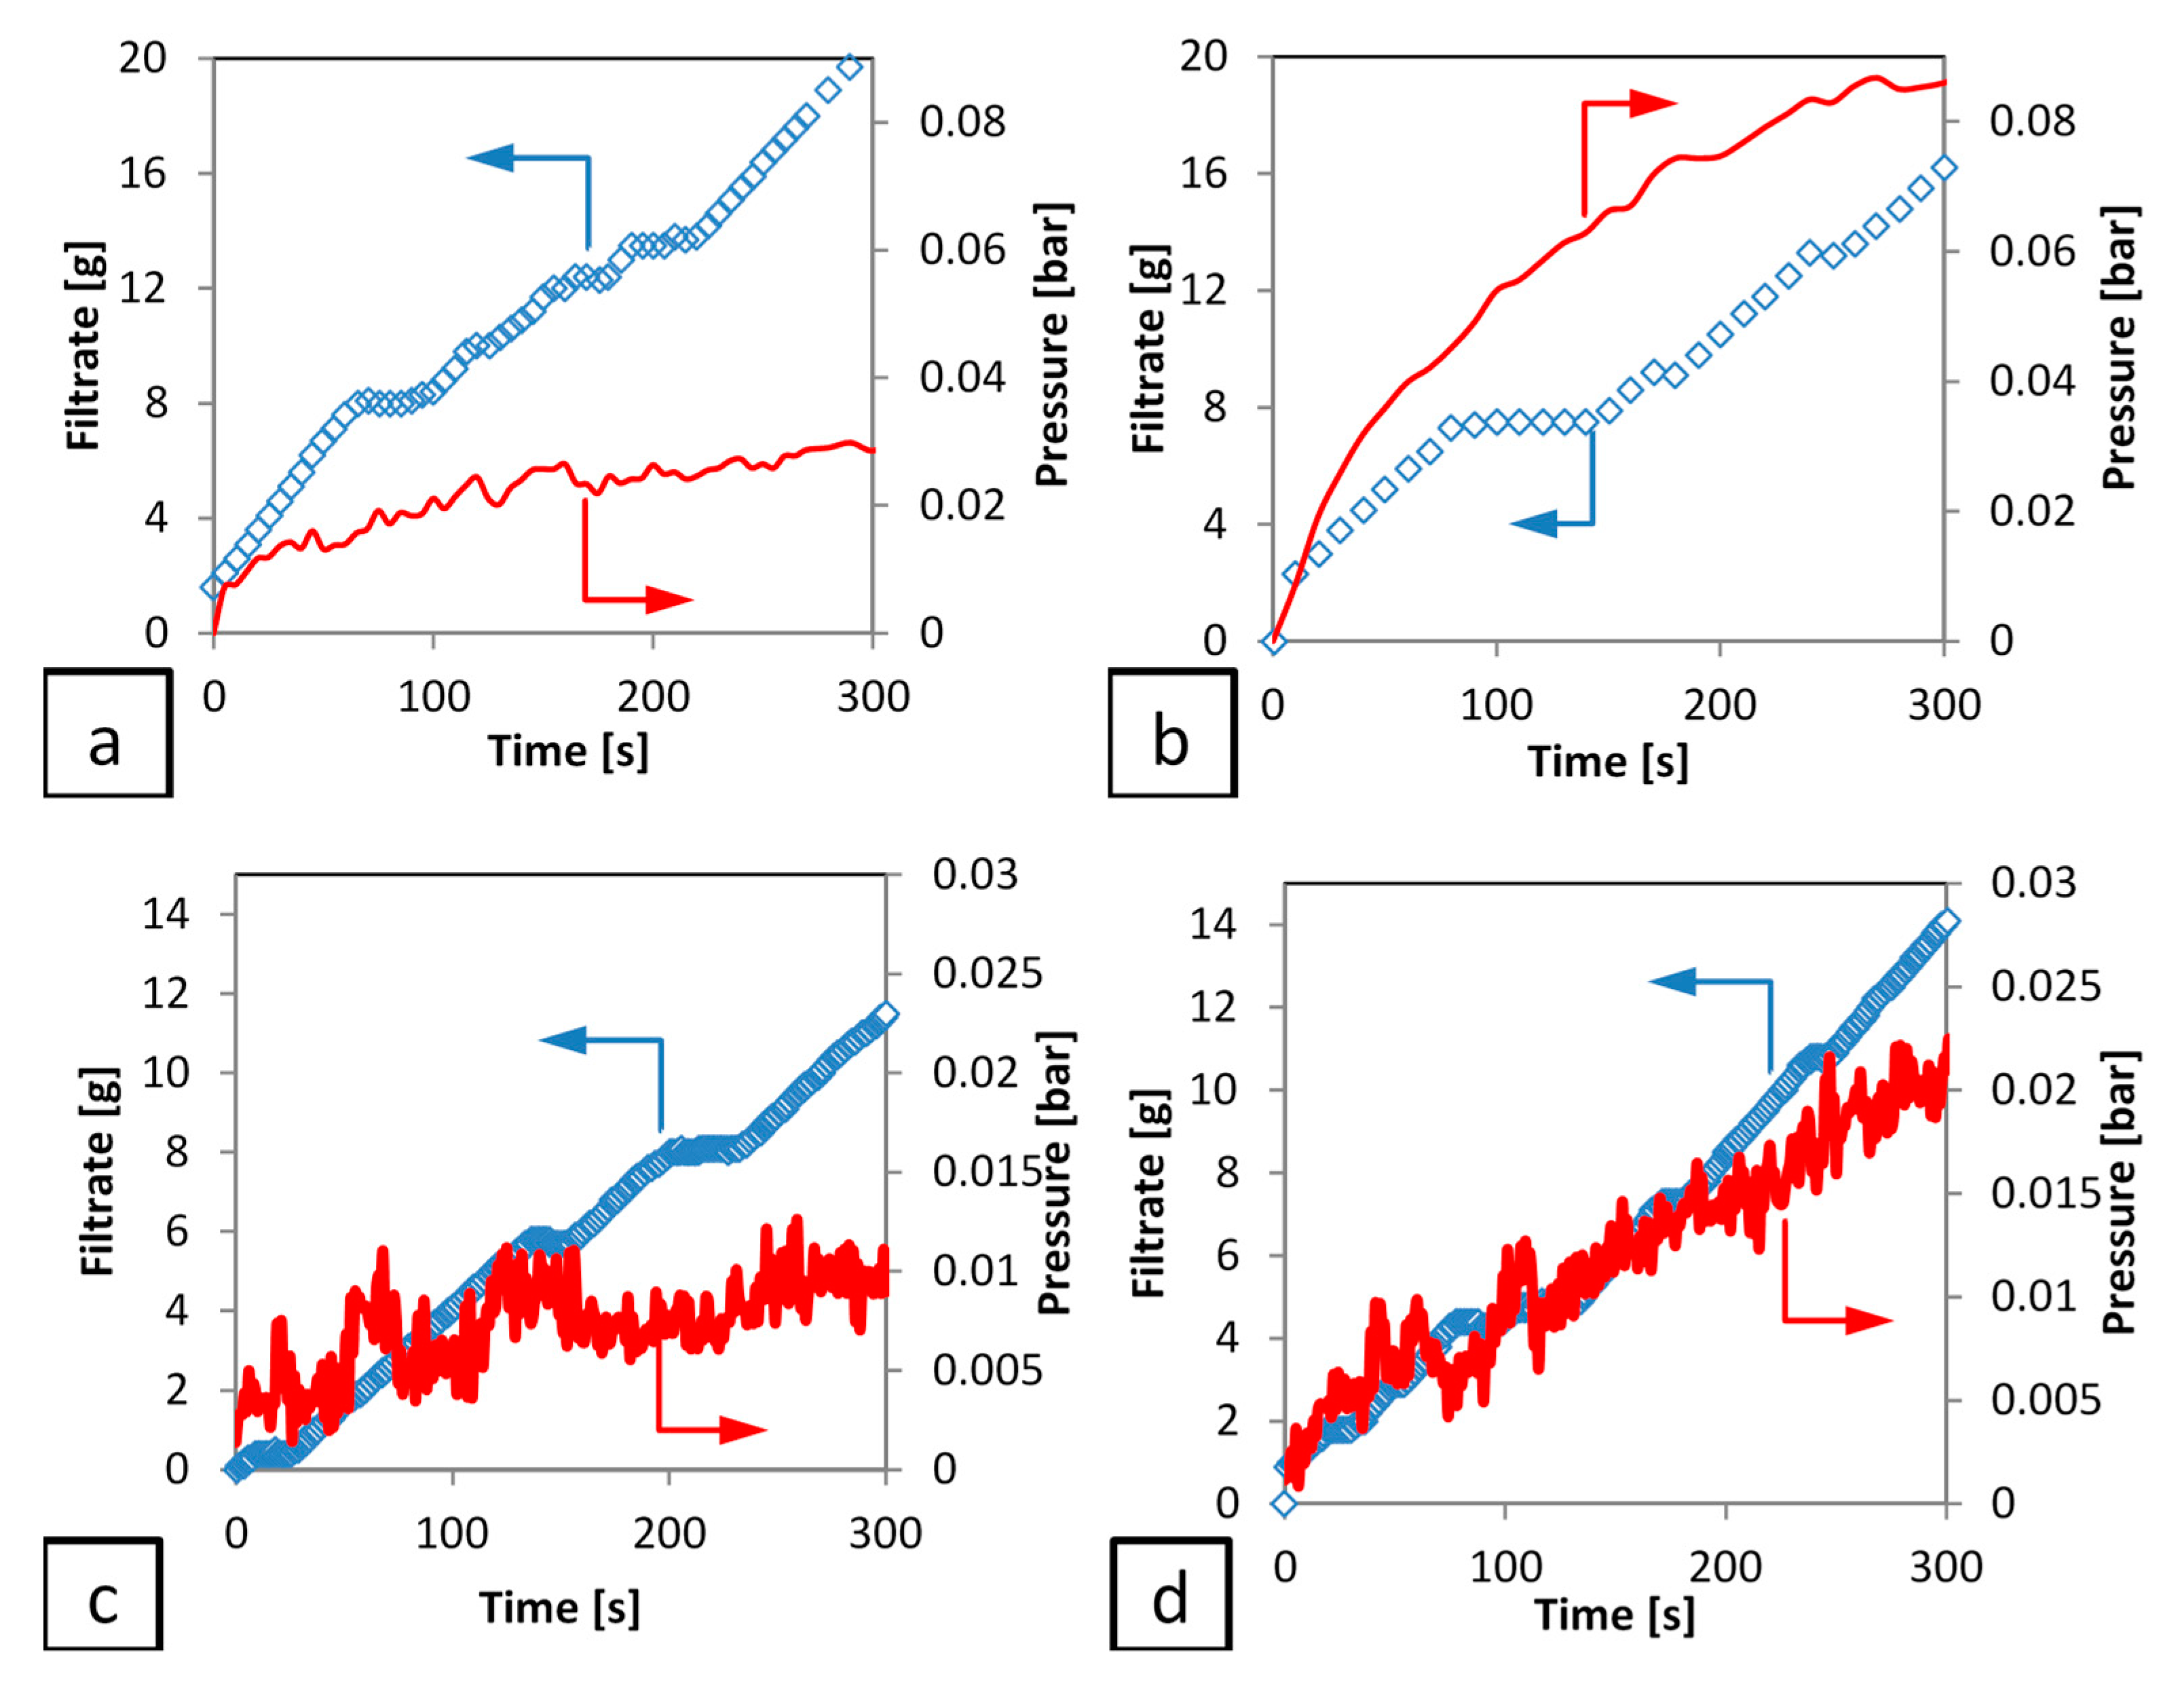
The initial filtration (period 1) is illustrated in greater detail in Figure 6, for both talc and calcium carbonate systems, which highlights a more complex situation at these early time steps, as cake formation takes places. There appears to be an initial period of filtrate accumulation with respect to time, followed by a ‘plateau region’ during which no filtrate is formed. In the case of the more compressible material (talc) this region is longer than the less compressible material (calcium carbonate). The pressure data is somewhat ‘noisy’ in both cases, due partly to the use of a peristaltic pump to suck the filtrate through the system and the operation of the transducer at a low differential pressure. In addition, the calcium carbonate data is more noisy, due to the much lower pressures being recorded when compared to the talc filtrations, as discussed for similar systems in a previous publication [5].
In addition, despite this experimental noise, there is no evidence from any of the runs of a differential pressure plateau corresponding to the filtrate plateau. Hence, it can be concluded that the pressure provided from the pump continues to rise, but the filtrate rate stops for a period of up to 20 s (depending on the studied system). This data shows that, for both cakes filtration (incompressible and compressible) the retarded packing compressibility (RPC) concept does exist with a significant period of zero filtrate flow, despite continued application of filtration pressure. It is suggested that the filter cake undergoes a period of rearrangement at that point, with the liquid pressed out from that rearrangement flowing upwards into the slurry rather than down through the previously formed filter cake and the filter medium. Hence, after that ‘cake collapse’ the overall resistance to filtration changed to a higher value. For that reason, pressure continues to be raised without filtrate mass, until it overcomes the new resistance due to the cake collapse.
Further effort is made to understand this period, as it is important from the point of view of attempting to determine the medium resistance, which is used later to provide a value for pressure drop over the medium and hence cake forming pressure drop. In addition, it is important to check if this behaviour is a result of equipment/process or materials influence. Two possible explanations can be suggested for these unexpected pauses in filtrate rate behaviour. The first is the influence of particle sedimentation during the initial filtration. This aspect was studied using a gravity sedimentation process to obtain the particle settling velocity. The lowest (0.09 v/v) and highest (0.21 v/v) initial concentration of calcium carbonate was used, as as plate like shape of the talc particles required longer time for settling. The results indicate that the filtration rate of calcium carbonate is much greater than the particle settling velocity by 4 to 13 times for the lowest and highest initial concentration used in this work respectively. As a result, while particle sedimentation has some contribution on the lowest concentration, the effect is very small and it can be neglected for the higher concentrations.
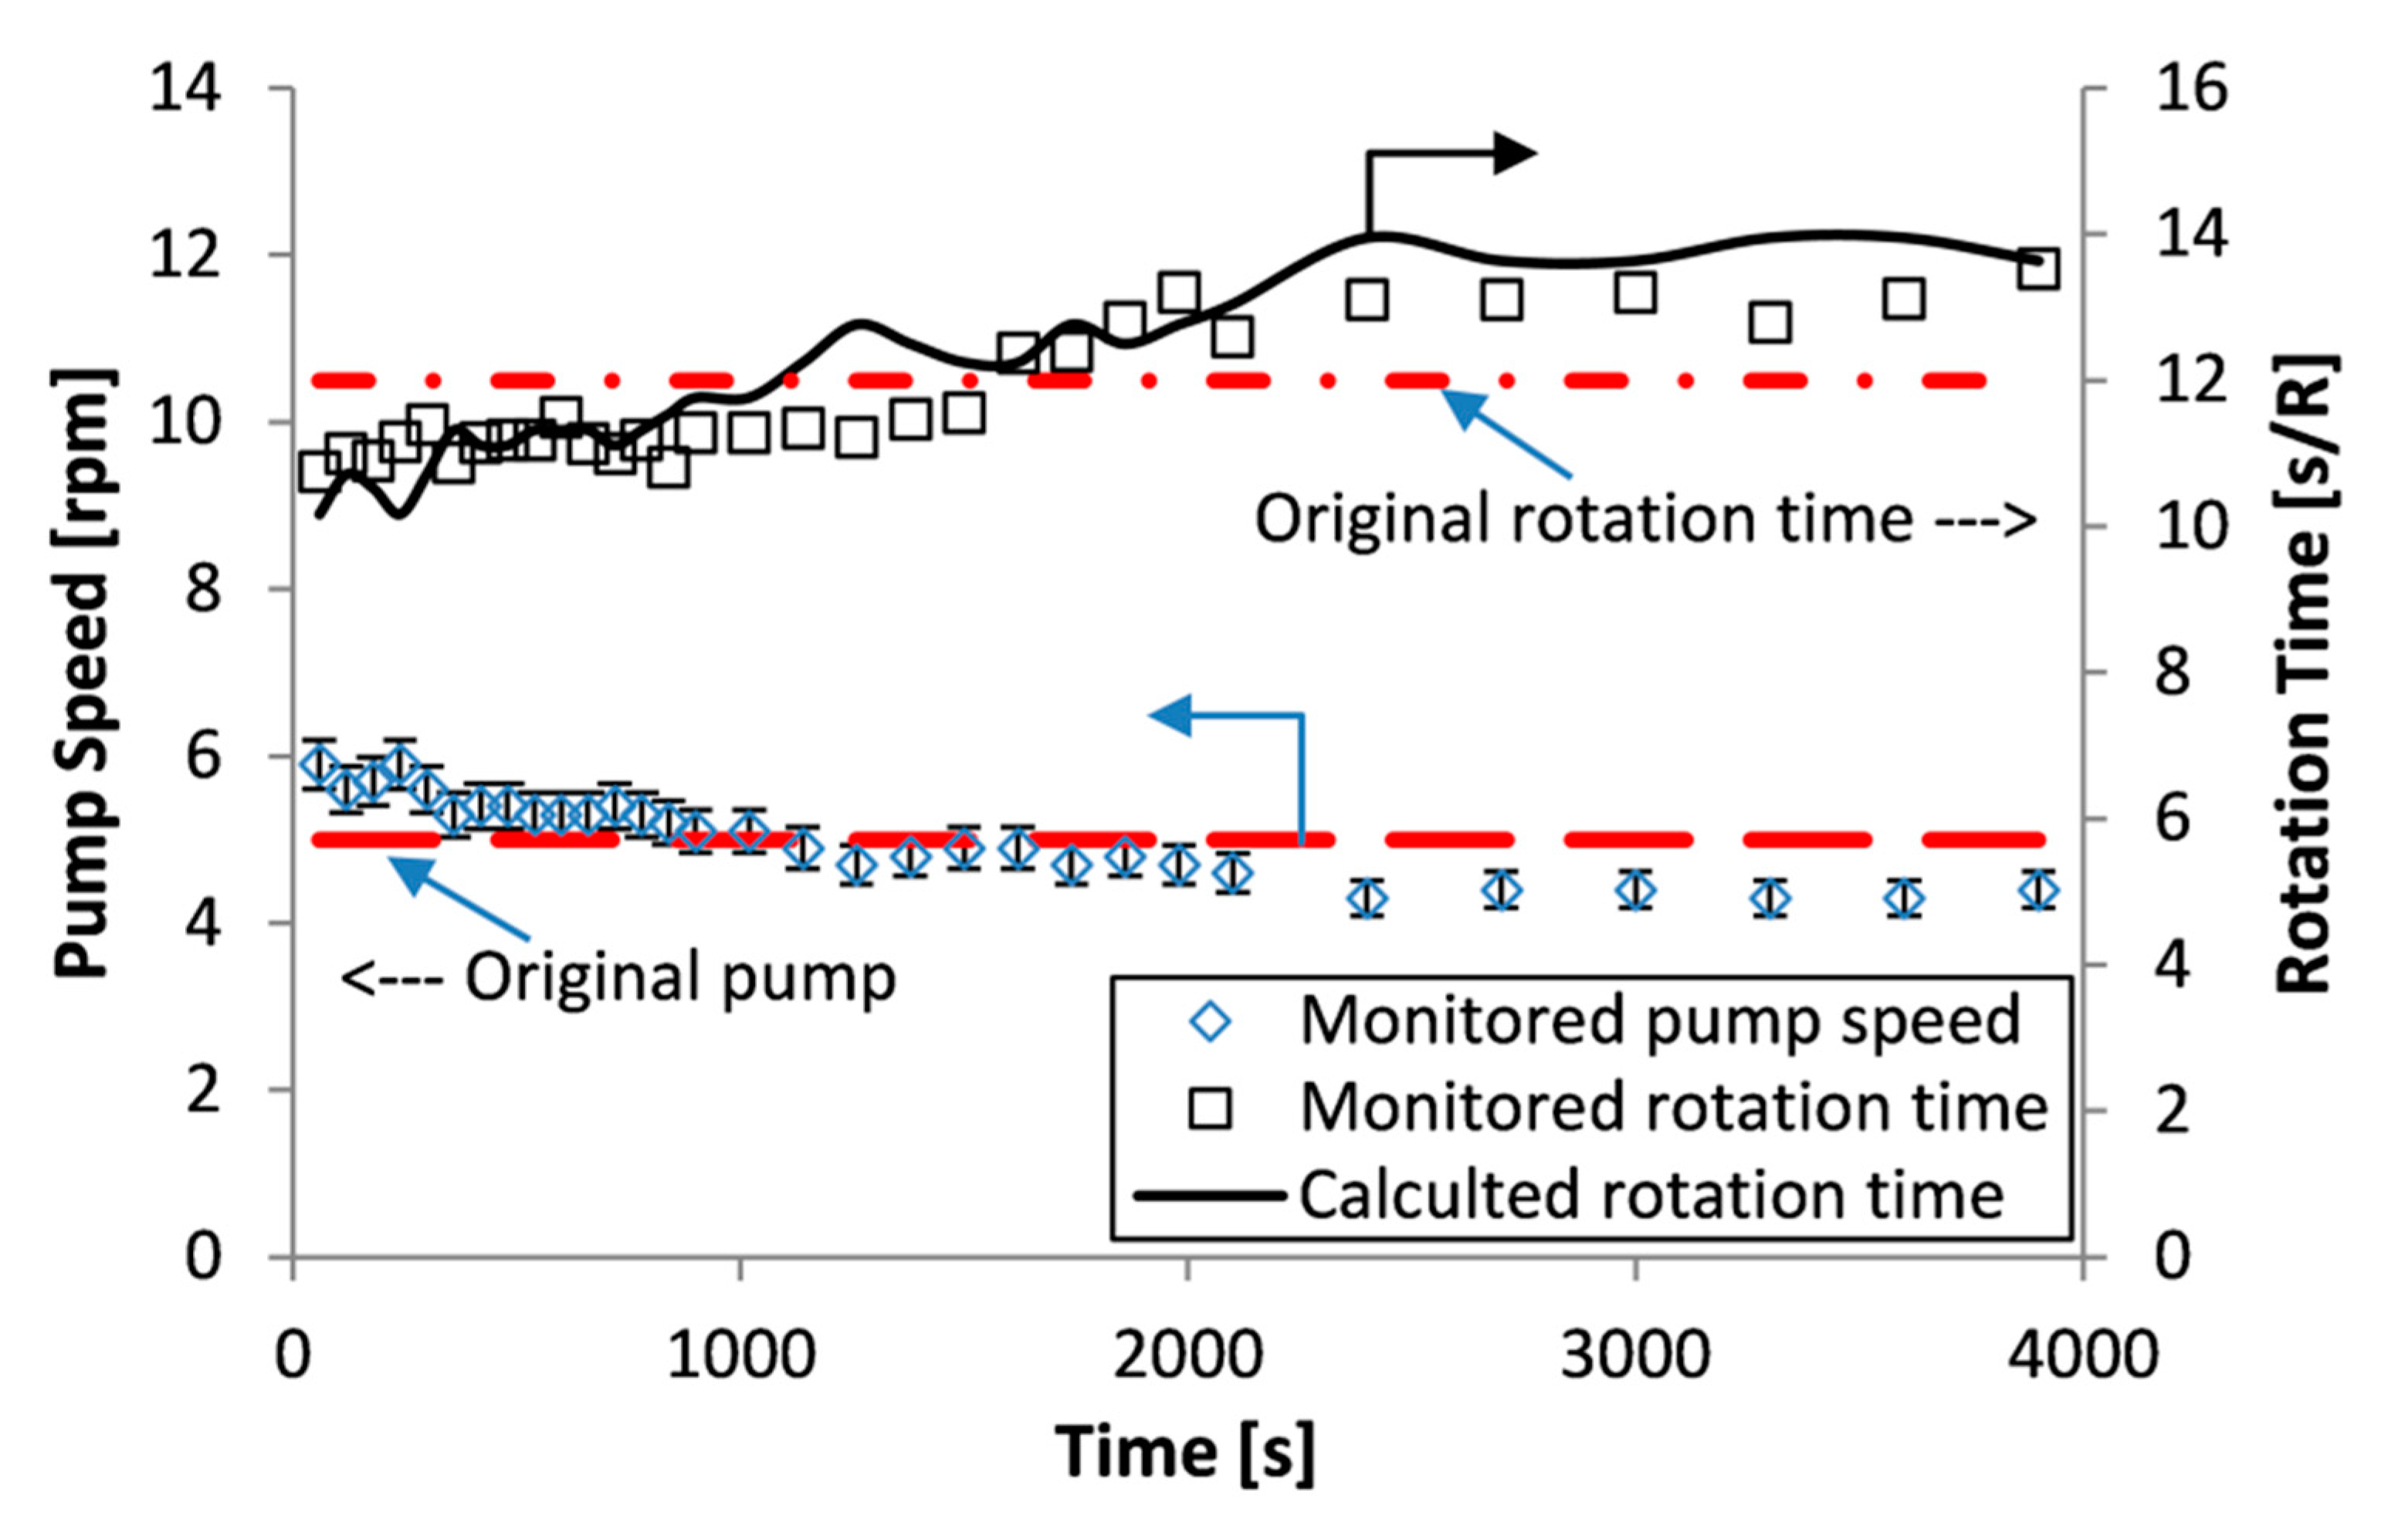
Another potential explanation is the influence of the peristaltic pump used to suck the filtrate through the filter medium. This aspect was investigated through the analysis illustrated in Figure 7, which shows the pump speed setting and the actual rotation time during the course of the filtration. The pump is a ‘low pulsation’ peristaltic pump with four rollers, hence at a setting of 5 rpm the time period for a roller to pass over the tubing is 3 s; i.e., if filtrate discharge occurs only when a roller passes then discharge should be every 3 s. Hence, this does not explain the stoppage of filtrate for a period of 20 s. This is the lowest pump setting used and the ‘plateau effect’ was noticed for all the experiments. Furthermore, another investigation was made on the experimental procedure. Initially, experiments were performed with the outlet tube on the discharge side of the pump discharging into air in an empty beaker on the weighing scales, to investigate if the stoppage could have been due to the intermittent drainage of that discharge tube. Therefore, the experimental procedure was changed to start with water in the beaker and the discharge tube end submerged in that water to prevent any drainage occurring. This alteration made no difference to the observation of a ‘plateau region’. Hence, it was concluded that the observed behaviour is not related to the equipment, process, or methodology, while it may be due to the nature of the materials of the solids (compressible and incompressible, size distribution, and shape). Also from Figure 7, it can be seen that the pump speed slightly decreases and the measured rotation time increases, during period (2). Hence, the pump motor is not sufficiently powerful enough to provide truly constant rate against a varying pressure formed by the filtration. This does not invalidate the filtration analysis, so long as the actual pressure and filtrate rate can be determined at any instance in time, and that is possible to assume an average cake concentration and specific resistance to filtration is valid.
The data illustrated in Figure 5 and Figure 6 further suggest that the pressure drop over the filter medium is negligible, with the measured pressure being close to zero at the start of the filtration. However, in order to assess the relevancy of filter medium resistance in the later calculation of pressure drop over the filter cake, the initial stages of filtration were treated as follows to provide three different possible values of the membrane filter resistance (Rm). Firstly, it was assumed that Rm is equal to zero (Rm = 0 at time 0 s). Secondly, the value of Rm was determined by applying Darcy’s law to the first data point measured, neglecting any resistance due to the filter cake (Rm = N1) at the first measurement of filtrate. For example, for conditions of 0.21 v/v and a 5 rpm pump speed (representing data shown in Figure 10) N1 is 1.07 × 10¹⁰ m−1 for talc and 6.8 × 10⁸ m−1 for calcium carbonate. The third approach is to consider the last time before the first ‘plateau region’ occurs and again determine Rm by assuming that all the pressure drop is over the filter medium by applying Darcy’s law (Rm = N2 at the first point of the filtrate plateau/stop). In the case of the talc filtration at 0.01 v/v solids (Figure 6a), Rm = N2 = 1.4 × 10¹¹ m−1, which occurs after 60 s into the filtration. While, in the case of the calcium carbonate filtration at 0.09 v/v solids (Figure 6c) Rm = N2 = 1.3 × 10⁹ m−1 would be at 10 s into the filtration. These provided three values for Rm that could be used in the later analysis for pressure forming the filter cake. The true value of Rm would, of course, likely be somewhere between these extreme values.
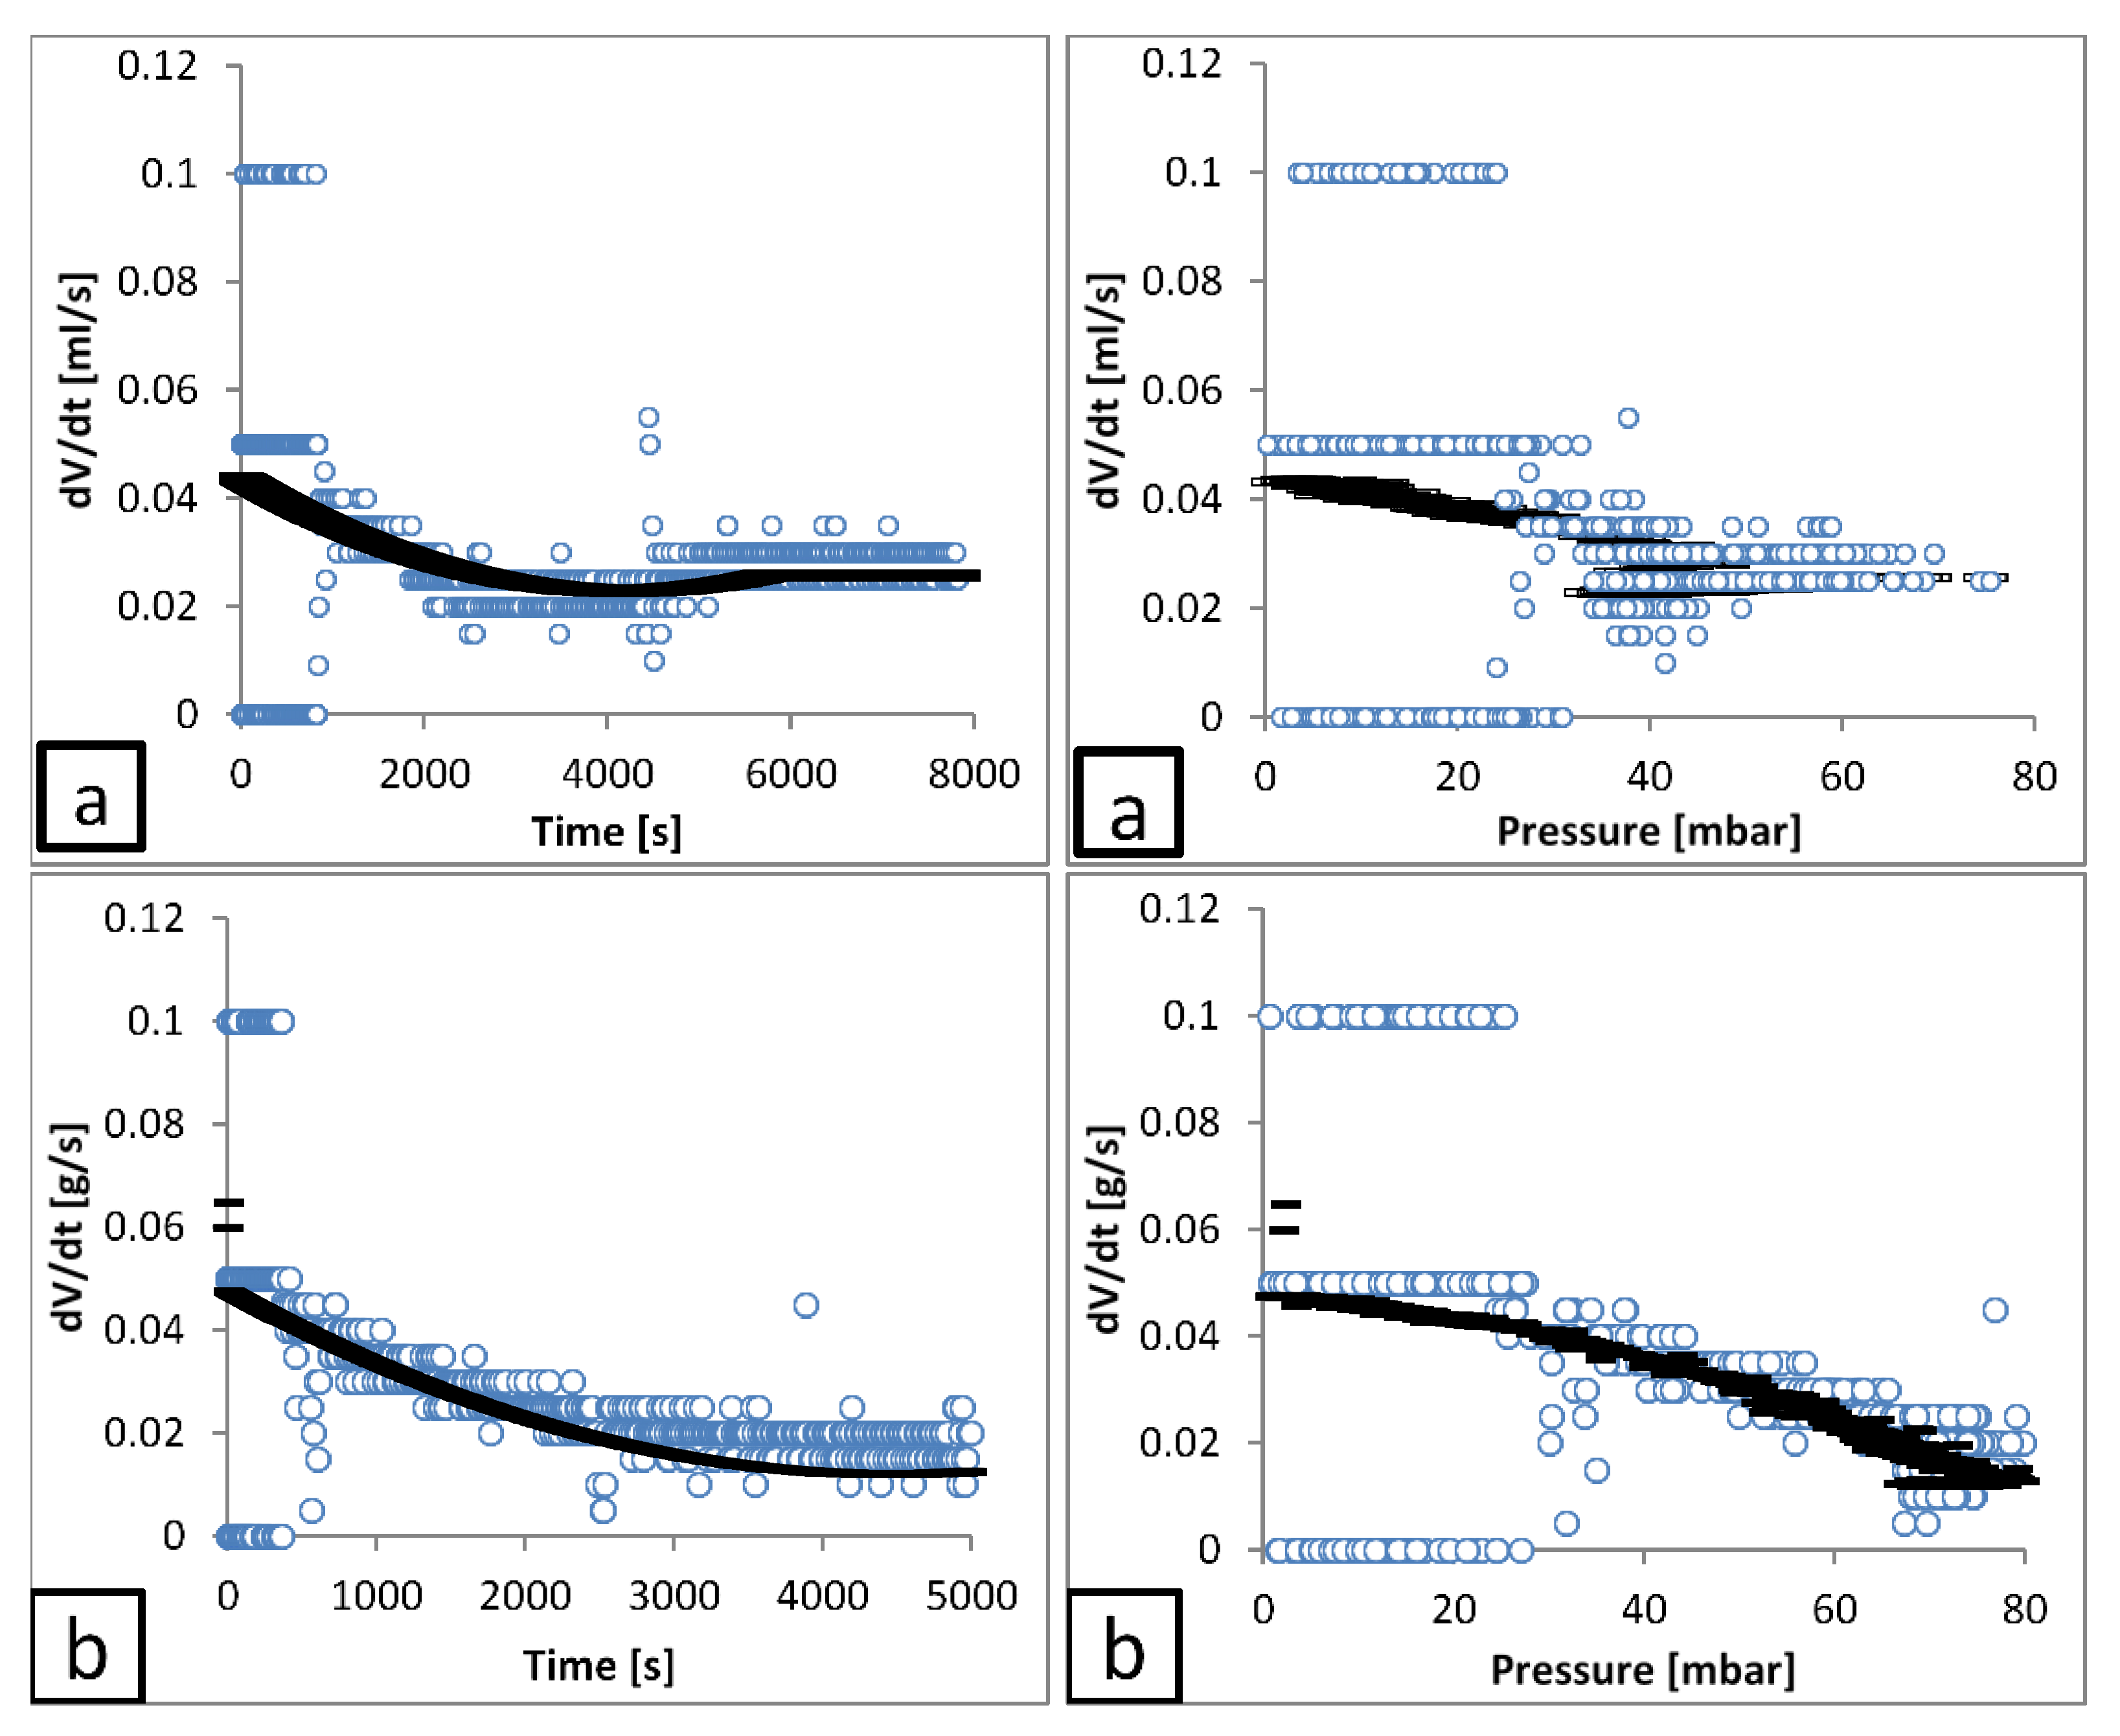
It is noted that also the general shape of the pressure versus time data shown in Figure 5 (right hand axis) during period (2) demonstrates a reduced change with respect to time, whereas the relationship of filtrate versus time (left hand axis) time appears substantially linear, which is attributed to the pseudo constant filtrate pump. Thus, the assumed 2nd polynomial fit of the filtrate data may be a greater order than generally required, where dV/dt would largely be presumed to be relatively constant within each time period. To test this feature, Figure 8 and Figure 9 show the filtrate rate with time for talc and calcium carbonate, respectively. In addition, both the differential of the second order polynomial and the experimentally determined values are illustrated. The latter are calculated by a ‘central difference’ technique, where for the filtrate rate (V) at time (t), the rate is determined by Equation (6).
It can be seen that the polynomial approach leads to significant data smoothing, considerably reducing experimental fluctuations. Thus, while not necessarily representing the physics exactly, the methodology was maintained for all analyses. The smoothed filtrate rate from each fitting was subsequently used for the calculation of pressure drop over the filter medium and cake, thereby allowing permeability and specific resistance of the filter cake to be measured (see Figure 3).
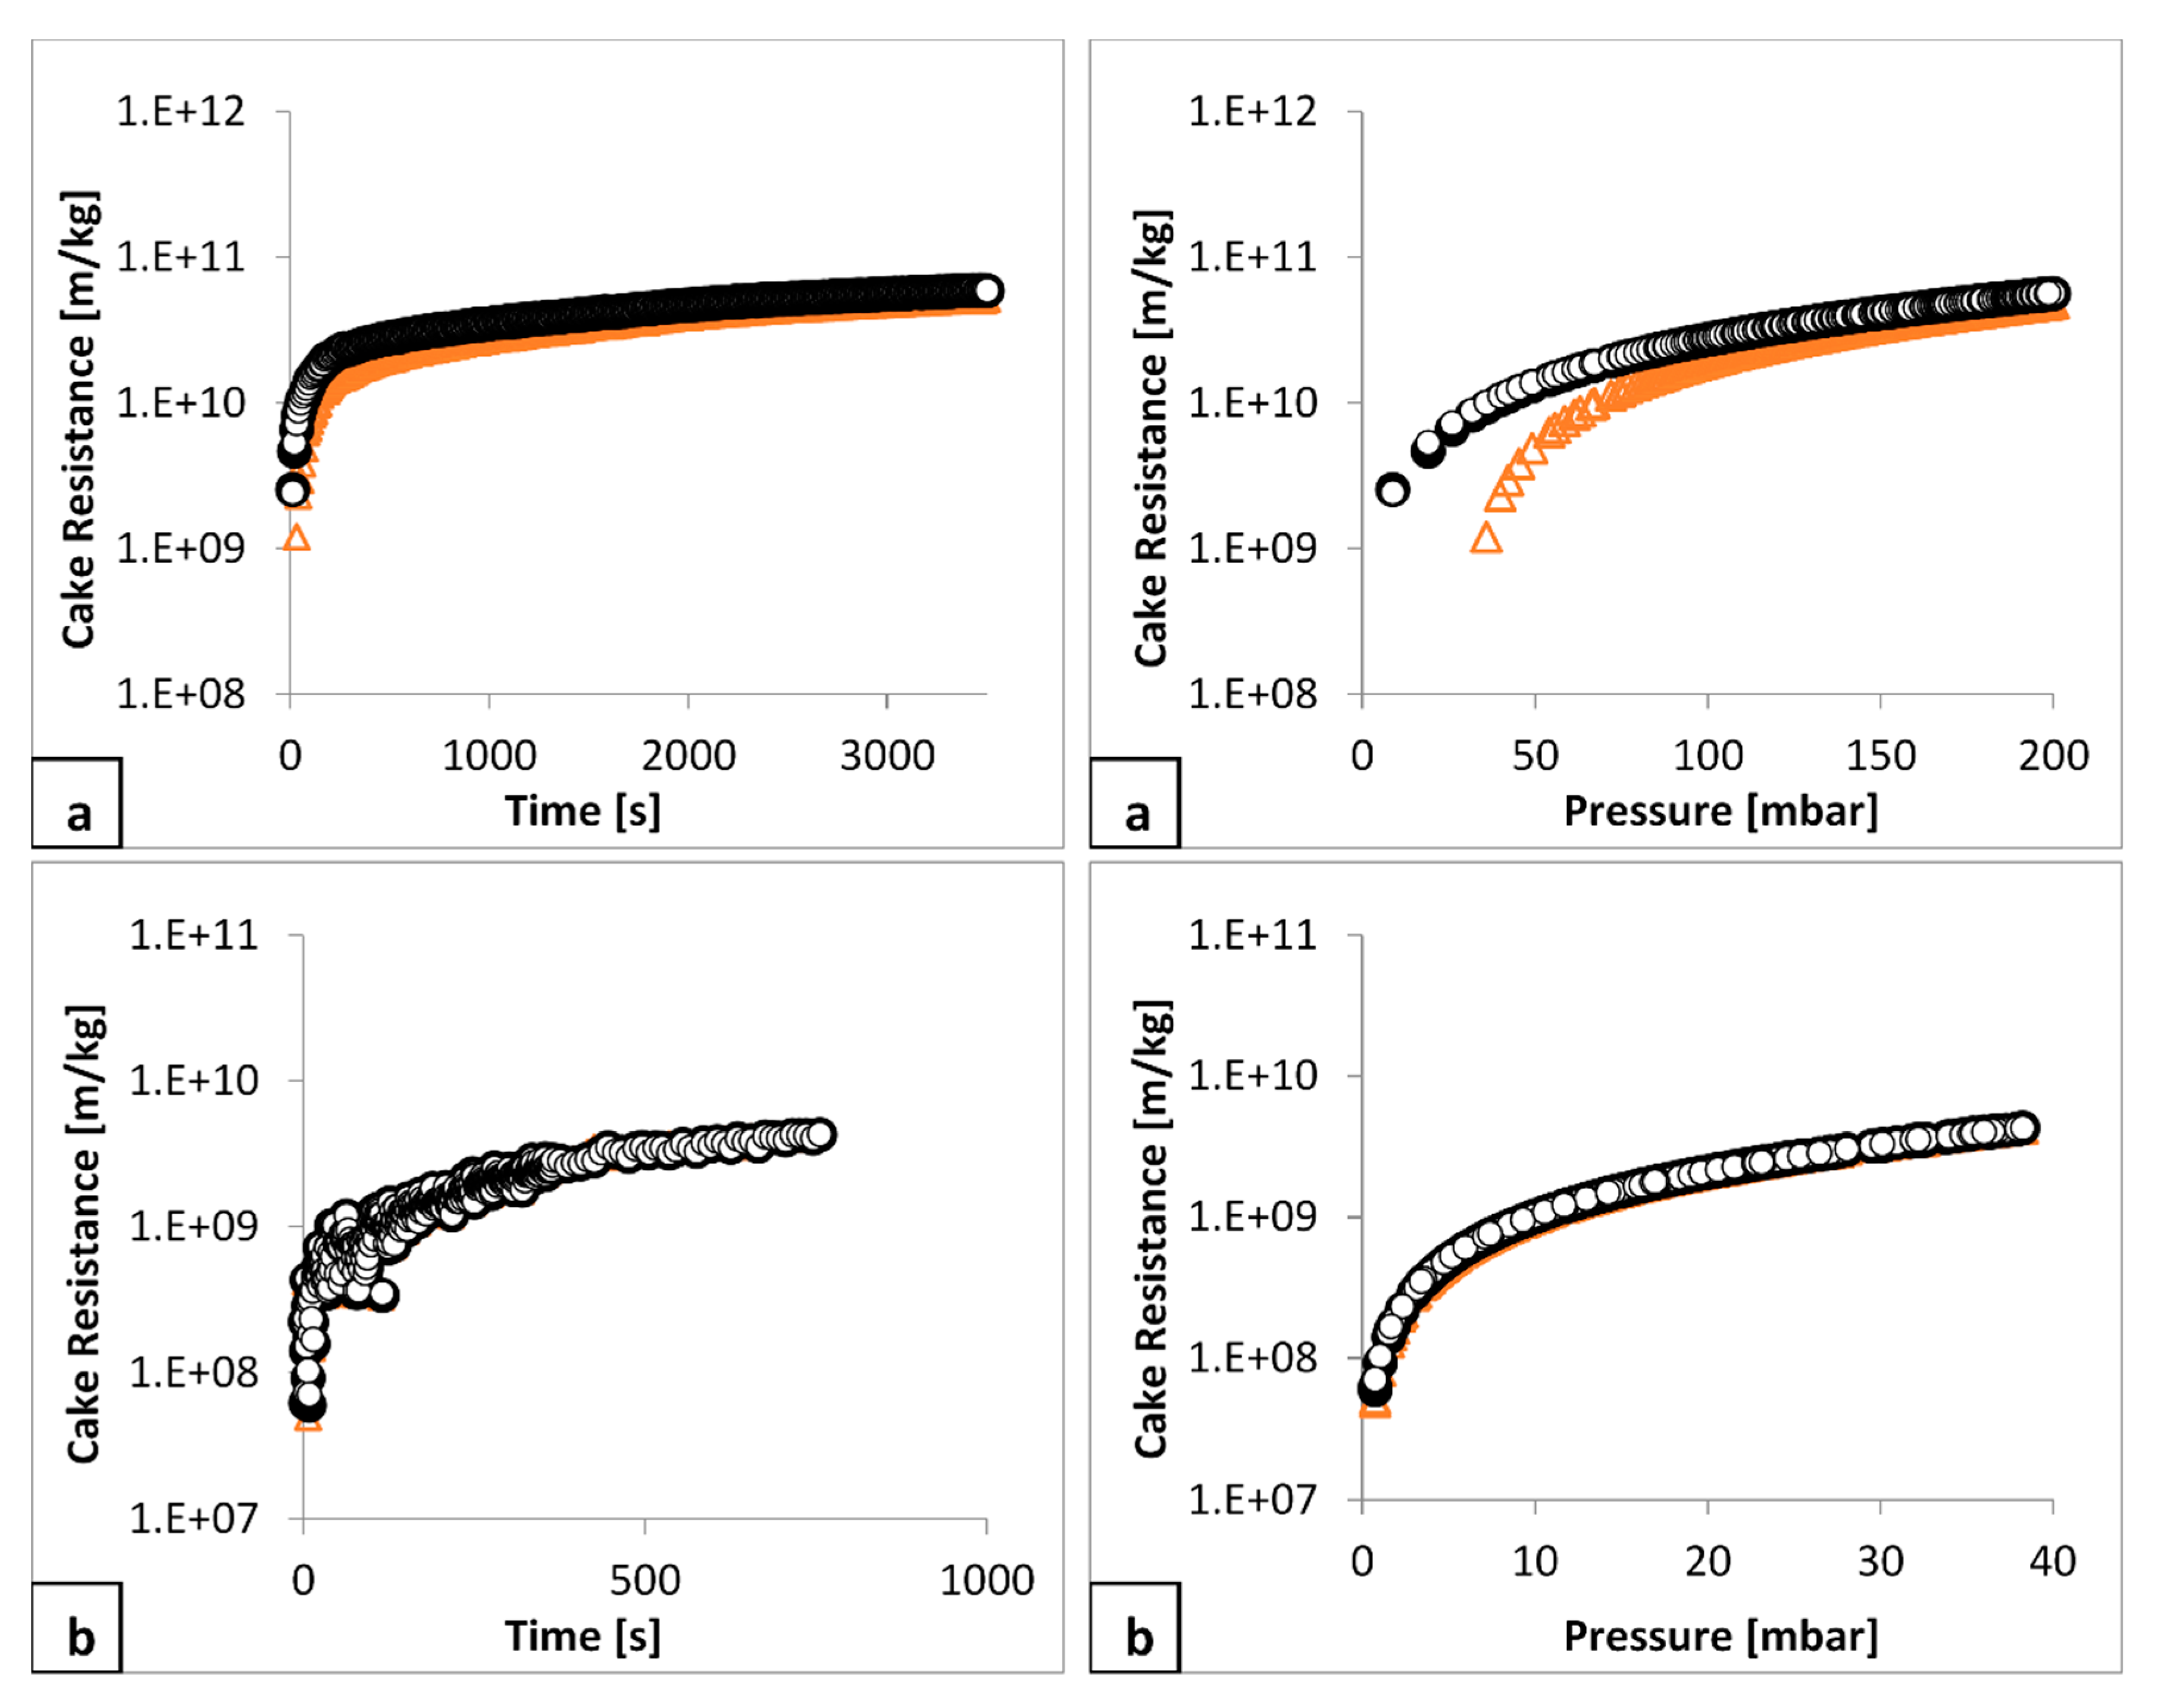
The variation of average filter cake specific resistance to filtration with time and with pressure, is illustrated for two examples filtrations in Figure 10: for talc (a, b) and for calcium carbonate (c, d). The analysis followed the format provided in Figure 3. One key aspect being investigated was determination of any influence of the pressure drop over the filter medium and to deduct it from the measured total pressure drop to provide that for the cake. This was achieved by considering the three different values of Rm, hence three different values of cake forming pressure, to determine three different values of cake resistance for all the filtrations.
In general, it is demonstrated that the pressure drop over the medium is negligible as the cake resistance is the same with respect to time, regardless of the chosen value of Rm. There is some small variation in the talc resistance with pressure curve at lower pressure, within the region of cake formation (Figure 10a), but it is reasonably consistent after a pressure of 80 mbar has been reached. Thus, for the purpose of determining the constitutive relation between cake resistance and cake forming pressure (Equation (2)) the data illustrated in Figure 10: (a) for talc, from 80 mbar onwards can be used and (b) for calcium carbonate all pressure values can be used.
Considering the voidage formed by the two different systems (talc and calcium carbonate) and the commonly used Kozeny approach to permeability (Equation (5)) it is possible to see why empiricism is still required for filtration modelling and scale up in design. Talc produced cakes with a concentration of between 0.18 to 0.26 (v/v) solids concentration; the calcium carbonate cakes were between 0.41 and 0.53 (v/v) in solids content (Table 3), while the Sauter mean diameter of the two different solids were almost identical (Table 1) which therefore would infer higher permeabilities in the talc, due to the increased porosity. The measured permeabilities for all constant rate trials were compared to estimates from the K-C equation, and are given in Table S1, within the ESI, where a number of important trends are observed. In this calculation, the values of Sauter mean diameter for both materials are as given in Table 1 (6 µm and 5 µm for the talc and calcium carbonate, respectively). It is firstly evident that the range of measured permeabilities for talc (e.g., 1.68 × 10⁻¹⁴ and 3.6 × 10⁻¹⁴ m2 at 5 rpm pump rates) are actually similar to calcium carbonate (e.g., 1.64 × 10⁻¹⁴ and 5.42 × 10⁻¹⁴ m2 at 5 pm). Hence, average specific cake resistance values (using Equation (3)) for talc are much greater, due the lower bed concentrations, giving an overall average for all conditions of 5.9 × 10¹⁰ and 7.4 × 10¹¹ m/kg for calcium carbonate and talc, respectively. Even allowing for a low value of sphericity for talc (0.22) compared to calcium carbonate (0.81) [39] would not explain the (at least) an order of magnitude higher specific resistance displayed by the talc cakes compared to the calcium carbonate. Therefore, there is clearly additional effects that are enhancing the resistance to permeation in the talc cakes compared to the calcium carbonate ones.
It is also evident that the K-C approach (using Equation (5)) considerably overestimates the permeability in both systems, but most significantly with the talc particles (see Table S1). As such, these effects are parameters that are not recognised in the K-C equation, and they become more prevalent with the compressible talc cake. This result may be related to a number of factors, including the shape of the particles or the enhanced contribution to resistance from the fine particles with the size distribution, as discussed by number of authors [11,12,13,14,15,16,17]. The particle shape and contribution of fines to the overall resistance is also being investigated using numerical models (ANN and MVR) to determine permeabilities [40]. It may also be the case that particle agglomeration may increase the tortuosity of permeation pathways and could contribute to the overestimation in the K-C approach. It is known from previous work on similar calcium carbonate systems that some low level of agglomeration may take place, due to its small surface charge [35], while the charge differential on the faces and sides of talc platelets may lead to complex structuring in solution, further decreasing permeability.
4. Conclusions
Two different solid suspensions with different compressibilities were used in constant rate filtration experiments, with various initial concentrations and filtration rates. Stable and well characterised solids were used, with similar values of specific surface and Sauter mean diameter. The filtration data plots for both types of solids showed two different stages of filtration (initial and final) for all concentrations and flow rates. The initial stage indicated discontinuities in the volume of filtrate with time, while applied pressure was continually increased.
Detailed analysis of the initial stage of filtration showed evidence for the occurrence of a retarded packing compressibility, which is still a controversial topic in filtration literature. The data illustrated here, for both largely incompressible and mildly compressible cakes, indicated that such a concept does exist; with a significant period of zero filtrate flow, despite continued application of filtration pressure. It is suggested that filter cakes undergo a period of rearrangement (or ‘cake collapse’) in the initial filtration stage, with the liquid pressed out from rearrangement flowing upwards into the slurry rather than down through the previously formed filter cake and the filter medium. Hence, the overall resistance to filtration changes to a higher value. It is concluded that the observed behaviour is not related to the equipment, process or methodology, although it may be due to the nature and physical properties of the materials of the solids.
The use of a constant rate process for laboratory filtration analysis provides a means whereby the initial stages of filtration can be studied in detail, with a gently increasing pressure applied to the filter cake. The level of detail provides a method to see how the pressure builds-up, leading to changes in estimates of the membrane resistance Rm with the initial layers of filter cake. It is then possible to use the determined values of Rm for later analysis of cake specific resistance with pressure. Measurements of the specific cake resistance and overall cake permeability were compared to estimates from the Kozeny-Carmen analytical model (using the Sauter mean diameters). It was found that the K-C model considerably underestimated the resistance to filtration in all cases, but most significantly for the talc systems. It was assumed this was likely to due to the ‘enhanced’ resistance arising from particle shape effects, the presence of the finer particles within the distribution, or agglomeration.
Supplementary Materials
An Electronic Supplementary Information (ESI) file is available from https://www.mdpi.com/2227-9717/7/10/746/s1, containing an extended methodology of the filtration rig and procedure; as well as Figure S1 (cumulative size distributions of the particles used); Figure S2 (schematic of filtration rig); Figure S3 (example triplicate filtration data); Table S1 (measured permeabilities for all systems in comparison with Kozeny-Carmon estimates).
Author Contributions
Conceptualization, F.M.M. and R.G.H.; methodology, F.M.M.; validation, F.M.M. and R.G.H.; formal analysis, F.M.M.; investigation, F.M.M. and R.G.H.; resources, F.M.M. and R.G.H.; writing—original draft preparation, F.M.M.; writing—review and editing, F.M.M., T.N.H. and R.G.H.; visualization, F.M.M., T.N.H. and R.G.H.; supervision, R.G.H.; project administration, F.M.M., T.N.H. and R.G.H.; funding acquisition, F.M.M., T.N.H. and R.G.H.
Funding
This research was funded by the Engineering and Physical Sciences Research Council (EPSRC) UK and University of Leeds as an Impact Acceleration Account (EP/R511717/1) as well as Sirte University and Ministry of Education, Libya http://su.edu.ly/en/ (ME-SU-205/2010).
Acknowledgments
Authors are grateful to the Engineering and Physical Sciences Research Council (EPSRC) UK, University of Leeds and the Libyan Ministry of Higher Education and Sirte University, Libya for sponsoring this work.
Conflicts of Interest
We wish to confirm that there are no known conflicts of interest associated with this publication and there has been no significant financial support for this work that could have influenced its outcome, apart from the grant funding listed in the acknowledgements. We confirm that the manuscript has been read and approved by all named authors and that there are no other persons who satisfied the criteria for authorship but are not listed. We further confirm that the order of authors listed in the manuscript has been approved by all of us. We confirm that we have given due consideration to the protection of intellectual property associated with this work and that there are no impediments to publication, including the timing of publication, with respect to intellectual property. In so doing we confirm that we have followed the regulations of our institutions concerning intellectual property. We also confirm this manuscript is not currently submitted to any other publication. We understand that the Corresponding Author is the sole contact for the Editorial process (including Editorial Manager and direct communications with the office). He is responsible for communicating with the other authors about progress, submissions of revisions and final approval of proofs. We confirm that we have provided a current, correct email address which is accessible by the Corresponding Author, being FM Mahdi ([email protected]).
References
- Svarovsky, L. Solid-Liquid Separation; Butterworth-Heinemann: Oxford, UK, 2000. [Google Scholar]
- Tarleton, E.S.; Hancock, D.L. Using mechatronics for the interpretation and modelling of the pressure filter cycle. Chem. Eng. Res. Des. 1997, 75, 298–308. [Google Scholar] [CrossRef]
- Stickland, A.D.; De Kretser, R.G.; Scales, P.J. Nontraditional constant pressure filtration behavior. AIChE J. 2005, 51, 2481–2488. [Google Scholar] [CrossRef]
- Iritani, E. Properties of Filter Cake in Cake Filtration and Membrane Filtration. KONA 2003, 21, 19–39. [Google Scholar] [CrossRef] [Green Version]
- Mahdi, F.M.; Holdich, R.G. Laboratory cake filtration testing using constant rate. CHERD 2013, 91, 1145–1154. [Google Scholar] [CrossRef]
- Greil, P.; Gruber, U.; Travitzky, N.; Kulig, M. Pressure filtration of silicon nitride suspensions with constant filtration rate. Mater. Sci. Eng. 1992, 151, 247–254. [Google Scholar] [CrossRef]
- Tarabara, V.V.; Hovinga, R.M.; Wiesner, M.R. Constant transmembrane pressure vs. constant permeate flux: Effect of particle size on crossflow membrane filtration. Environ. Eng. Sci. 2002, 19, 343–355. [Google Scholar] [CrossRef]
- Tiller, F.M. The Role of Porosity in Filtration-Numerical Methods for Constant Rate and Constant Pressure Filtration Based on Kozeny Law. Chem. Eng. Prog. 1953, 49, 467–479. [Google Scholar]
- Tien, C. Introduction to Cake Filtration: Analyses, Experiments and Applications; Elsevier: Amsterdam, The Netherlands, 2006. [Google Scholar]
- Rushton, A.; Ward, A.S.; Holdich, R.G. Solid-Liquid Filtration and Separation Technology; Wiley-VCH: Weinheim, Germany, 2000. [Google Scholar]
- Wakeman, R.J. The influence of particle properties on filtration. Sep. Purif. Technol. 2007, 58, 234–241. [Google Scholar] [CrossRef]
- Wakeman, R.J.; Tarleton, E.S. Solid: Principles of Industrial Filtration; Elsevier: Bodmin, UK, 2005. [Google Scholar]
- Wakeman, R.J.; Wu, P. Neural Network Modelling of Vibration Filtration. Filtration 2003, 3, 237–244. [Google Scholar]
- Wakeman, R.J.; Sabri, M.N.; Tarleton, E.S. Factors affecting the formation and properties of wet compacts. Powder Technol. 1991, 65, 283–292. [Google Scholar] [CrossRef]
- Yim, S.-S.; Kwon, Y.-D.; Kim, H.-I. Effects of pore size, suspension concentration, and pre-sedimentation on the measurement of filter medium resistance in cake filtration. Korean J. Chem. Eng. 2001, 18, 741–749. [Google Scholar] [CrossRef]
- Kotlyarov, G.G. Investigations of the relations between the filtration constant of low-concentration suspensions and filtration pressure and solid-phase concentration. Chem. Pet. Eng. 1976, 12, 416–418. [Google Scholar] [CrossRef]
- Carman, P.C. Fundamental principles of industrial filtration. Trans. Inst. Chem. Eng. 1938, 16, 168–188. [Google Scholar]
- Rietema, K. Study on Compressibility of Filter Cakes; Delft University of Technology: Deflt, The Netherlands, 1953. [Google Scholar]
- Rietema, K. Stabilising effects in compressible filter cakes. Chem. Eng. Sci. 1953, 2, 88–94. [Google Scholar] [CrossRef]
- Fathi-Najafi, M.; Theliander, H. Determination of local filtration properties at constant pressure. Prog. Sep. Waste Reduct. 1995, 5, 165–178. [Google Scholar] [CrossRef]
- Chase, G.G.; Steffen, J.; Ott, D. Microscopic observation of filter cake formation. Sep. Technol. 1994, 4, 118–122. [Google Scholar] [CrossRef]
- Baird, R.L.; Perry, M.G. The distribution of porosity in filter cakes. Filtr. Sep. 1967, 4, 471–475. [Google Scholar]
- Shirato, M.; Sambuichi, A.; Murase, T.; Aragaki, T.; Kobayashi, K.; Iritani, E. Theoretical and experimental studies in cake filtration. Mem. Fac. Eng. (Nagoya Univ.) 1985, 37, 38–92. [Google Scholar]
- Shirato, M.; Aragaki, T.; Ichimura, K.; Ootsuti, N. Porosity variation in filter cakes under constant pressure filtration. J. Chem. Eng. Jpn. 1971, 4, 172–177. [Google Scholar] [CrossRef]
- Murase, T.; Iritani, E.; Cho, J.H.; Shirato, M. Determination of filtration characteristics based upon filtration tests under step-up pressure conditions. J. Chem. Eng. Jpn. 1989, 22, 373–378. [Google Scholar] [CrossRef]
- Sorensen, P.B.; Christensen, J.R.; Bruus, J.H. Effect of small scale solids migration in filter cakes during filtration of waste water solids suspensions. Water Environ. Res. 1995, 67, 25–32. [Google Scholar] [CrossRef]
- Tarleton, E.S.; Morgan, S.A. An experimental study of abrupt changes in cake structure during dead-end pressure filtration. Trans. Filtr. Soc. 2001, 1, 93–100. [Google Scholar]
- Tien, C.; Ramarao, B.V. Can filter cake porosity be estimated based on the Kozeny–Carman equation? Powder Technol. 2013, 237, 233–240. [Google Scholar] [CrossRef]
- Holdich, R.G. Fundamentals of Particle Technology; Midland Information Technology & Publishing: Shpeshed, UK, 2002. [Google Scholar]
- Salman, A.D.; Mojtaba, G.; Hounslow, M. Particle Breakag, Handbook of Powder Technology; Elsevier: Amsterdam, The Netherlands, 2007. [Google Scholar]
- Yang, W.-C. Handbook of Fluidization and Fluid-Particle Systems; Marcel Dekker Inc.: New York, NY, USA, 2003. [Google Scholar]
- Masuda, H.; Higashitani, K.; Hideto, Y. Powder Technology Handbook, 3rd ed.; CRC: Boca Raton, FA, USA, 2007. [Google Scholar]
- Rhodes, M. Introduction to Particle Technology; John Wily and Sons Ltd.: New York, NY, USA, 2008. [Google Scholar]
- Wakeman, R.J.; Tarleton, E.S. Colloidal fouling of microfiltration membranes during the treatment of aqueous feed streams. Desalination 1991, 83, 35–52. [Google Scholar] [CrossRef] [Green Version]
- Elliott, L.N.; Bourne, R.A.; Hassanpour, A.; Edwards, J.L.; Sutcliffe, S.; Hunter, T.N. Salt enhanced solvent relaxation and particle surface area determination via rapid spin-lattice NMR. Powder Technol. 2018, 333, 458–467. [Google Scholar] [CrossRef]
- Gribble, C.M.; Matthews, G.P.; Gantenbein, D.; Turner, A.; Schoelkopf, J.; Gane, P.A.C. Adsorption of surfactant-rich stickies onto mineral surfaces. J. Colloid Interface Sci. 2010, 352, 483–490. [Google Scholar] [CrossRef]
- DiGiovanni, B.A.; Mahdi, F.M.; Starov, V.M.; Holdich, R.G. Particulate clusters and permeability in porous media. CHERD 2012, 90, 1168–1176. [Google Scholar] [Green Version]
- Tiller, F.M.; Horng, L.-L. Hydraulic deliquoring of compressible filter cakes. Part 1: Reverse flow in filter presses. AIChE J. 1983, 29, 297–305. [Google Scholar] [CrossRef]
- Allen, T. Powder Sampling and Particle Size Determination; Elsevier Science: Amsterdam, The Netherlands, 2003. [Google Scholar]
- Mahdi, F.M.; Holdich, R.G. Using statistical and artificial neural networks to predict the permeability of loosely packed granular materials. Sep. Sci. Technol. 2017, 52, 1–12. [Google Scholar] [CrossRef]
Figure 1.
Scanning electron microscope (SEM) images of (A) talc and (B) calcium carbonate.

Figure 2.
Particle diameter variation (D10, D50 and D90) over time for three different shear conditions (P.Sp.) 1, 3 and 6 rpm, during analysis by laser diffraction using Horiba LA-920 for (a) talc and (b) calcium carbonate, based on volume distribution.
Figure 2.
Particle diameter variation (D10, D50 and D90) over time for three different shear conditions (P.Sp.) 1, 3 and 6 rpm, during analysis by laser diffraction using Horiba LA-920 for (a) talc and (b) calcium carbonate, based on volume distribution.

Figure 3.
The Flow chart of calculation steps for the constant rate filtration (CRF) technique to determine specific resistance. (1) Parameters: a, b are fit constants, t is the process time, V is the filtrate volume, ∆Pm is the membrane and ∆Pc is the pressure over the cake. Also used in analysis, µ is the liquid viscosity, A the cake surface area, Rm the membrane resistance, Rc the total cake resistance and αav the average specific cake resistance. Initial data points (e.g., stage 1 in Figure 5) which are used to calculate Rm, should not be included in the overall data trendline, except in the case of an incompressible material. (2) A series runs at different pressure are required in order to calculate C0 and m.

Figure 4.
Measured filtration pressure during filtration, at three starting concentrations: 0.01, 0.03, and 0.05 v/v of talc with 30 rpm pump speed.
Figure 4.
Measured filtration pressure during filtration, at three starting concentrations: 0.01, 0.03, and 0.05 v/v of talc with 30 rpm pump speed.

Figure 5.
The two stages (1 and 2, indicated in the figures by the two dashed vertical red lines) during talc filtration, (a) 0.01 v/v and (b) 0.05 v/v feed suspension concentration and calcium carbonate filtration, (c) 0.09 v/v and (d) 0.21 v/v feed suspension concentration at 5 rpm pump speed.
Figure 5.
The two stages (1 and 2, indicated in the figures by the two dashed vertical red lines) during talc filtration, (a) 0.01 v/v and (b) 0.05 v/v feed suspension concentration and calcium carbonate filtration, (c) 0.09 v/v and (d) 0.21 v/v feed suspension concentration at 5 rpm pump speed.

Figure 6.
The initial stages of filtration test for talc, (a) 0.01 and (b) 0.05 (v/v), and for calcium carbonate, (c) 0.09 and (d) 0.21 (v/v), at 5 rpm pump speed.
Figure 6.
The initial stages of filtration test for talc, (a) 0.01 and (b) 0.05 (v/v), and for calcium carbonate, (c) 0.09 and (d) 0.21 (v/v), at 5 rpm pump speed.

Figure 7.
Investigation on the variation of pump speed and rotation time during the filtration of talc at initial concentration of 0.05 v/v, using a pump speed of 5 rpm.
Figure 7.
Investigation on the variation of pump speed and rotation time during the filtration of talc at initial concentration of 0.05 v/v, using a pump speed of 5 rpm.

Figure 8.
Filtration flow rate with time and pressure for talc using 5 rpm pump speed, (a) 0.01 v/v and (b) 0.05 v/v (2nd polynomial equation, Equation (6) ( ̶ ) and central difference (○) Equation (8)).
Figure 8.
Filtration flow rate with time and pressure for talc using 5 rpm pump speed, (a) 0.01 v/v and (b) 0.05 v/v (2nd polynomial equation, Equation (6) ( ̶ ) and central difference (○) Equation (8)).

Figure 9.
Filtration flow rate with time and pressure for calcium carbonate using 5 rpm pump speed, (a) 0.09 v/v and (b) 0.21 v/v (2nd polynomial equation, Equation (6) ( ̶ ) and central difference (○), Equation (8)).
Figure 9.
Filtration flow rate with time and pressure for calcium carbonate using 5 rpm pump speed, (a) 0.09 v/v and (b) 0.21 v/v (2nd polynomial equation, Equation (6) ( ̶ ) and central difference (○), Equation (8)).

Figure 10.
Comparison between calculated specific cake resistances using Rm = 0 (○), Rm = N1 (●) and Rm = N2 (∆), (a) for talc at 0.05 v/v and (b) for calcium carbonate at 0.21 v/v, both using a pump speed of 5 rpm.
Figure 10.
Comparison between calculated specific cake resistances using Rm = 0 (○), Rm = N1 (●) and Rm = N2 (∆), (a) for talc at 0.05 v/v and (b) for calcium carbonate at 0.21 v/v, both using a pump speed of 5 rpm.


Table 1.
Relevant properties and characterisation information for the two solids used.
| Talc | Calcium Carbonate | |
|---|---|---|
| Natural pH | 9.4 | 8.0 |
| Zeta potential (mV) | −16.0 | +7.5 |
| IEP point | pH = 2.0 | pH = 10.3 |
| S.M.D a (µm) | 6.0 | 5.0 |
| Density b (g.cm−3) | 2.978 | 2.790 |
a (S.M.D) Sauter mean diameters were measured using a Horiba LA-920-wet Laser diffraction. b A Multivolume Pycnometer was used to determine materials densities.
Table 2.
Relevant filtration properties for the two solids used.
| Talc | Calcium Carbonate | |
|---|---|---|
| α0 (m kg−1) | 1.1 × 10¹⁰ | 6.6 × 10⁹ |
| n | 0.47 | 0.19 |
| C0 (v/v) | 0.17 | 0.25 |
| m | 0.21 | 0.08 |
Talc: Initial concentration 0.01 to 0.05 (v/v) applied pressure range 14 to 67 kPa. Calcium carbonate: Initial concentration 0.09 to 0.21 (v/v) applied pressure range 8 to 80 kPa.
Table 3.
Test results for the different initial solid concentration suspensions and various pump suction of both solids: (a) talc and (b) calcium carbonate.
Table 3.
Test results for the different initial solid concentration suspensions and various pump suction of both solids: (a) talc and (b) calcium carbonate.
| (a) | P.Sp. 5 rpm | P.Sp 10 rpm | P.Sp. 30 rpm | |||||||||
| Ci (1) (v/v) | C.H (mm) | C.C (v/v) | RSD 2 ±(%) | α × 10−10 (m/kg) | C.H (mm) | C.C (v/v) | RSD 2 ±(%) | α × 10−10 (m/kg) | C.H (mm) | C.C (v/v) | RSD 2 ±(%) | α × 10−10 (m/kg) |
| 0.01 | 5.57 | 0.191 | 12.98 | 10.49 | 5.46 | 0.194 | 13.09 | 12.25 | 4.74 | 0.224 | 11.07 | 16.98 |
| 0.02 | 11.72 | 0.181 | 6.99 | 8.66 | 10.62 | 0.199 | 4.21 | 9.01 | 8.53 | 0.249 | 6.46 | 11.83 |
| 0.03 | 17.38 | 0.183 | 7.38 | 7.23 | 14.67 | 0.217 | 8.07 | 6.23 | 12.13 | 0.263 | 7.81 | 8.95 |
| 0.04 | 20.27 | 0.209 | 3.86 | 5.59 | 19.43 | 0.219 | 6.47 | 5.47 | 16.12 | 0.263 | 5.32 | 7.39 |
| 0.05 | 26.58 | 0.199 | 4.03 | 4.65 | 24.69 | 0.215 | 3.89 | 4.50 | 20.09 | 0.264 | 6.41 | 6.38 |
| (b) | P.Sp. 5 rpm | P.Sp. 10 rpm | P.Sp. 30 rpm | |||||||||
| Ci (1) (v/v) | C.H (mm) | C.C (v/v) | RSD 2 ±(%) | α × 10−10 (m/kg) | C.H (mm) | C.C (v/v) | RSD 2 ±(%) | α × 10−10 (m/kg) | C.H (mm) | C.C (v/v) | RSD 2 ±(%) | α × 10−10 (m/kg) |
| 0.09 | 20.12 | 0.475 | 2.45 | 4.77 | 19.31 | 0.494 | 2.32 | 5.41 | 18.28 | 0.522 | 2.23 | 4.43 |
| 0.11 | 24.36 | 0.479 | 1.69 | 1.49 | 21.21 | 0.55 | 1.58 | 9.11 | 19.85 | 0.588 | 1.38 | 3.25 |
| 0.13 | 31.35 | 0.440 | 2.64 | 2.63 | 27.76 | 0.497 | 2.53 | 1.52 | 26.61 | 0.518 | 2.24 | 5.51 |
| 0.15 | 36.38 | 0.438 | 1.21 | 2.23 | 32.33 | 0.492 | 1.15 | 4.00 | 30.34 | 0.525 | 1.02 | 4.72 |
| 0.17 | 44.22 | 0.408 | 1.42 | 6.46 | 35.48 | 0.508 | 1.37 | 4.16 | 34.72 | 0.52 | 1.10 | 5.35 |
| 0.19 | 45.02 | 0.448 | 0.71 | 1.66 | 39.30 | 0.513 | 0.67 | 3.44 | 37.86 | 0.533 | 0.58 | 5.94 |
| 0.21 | 51.81 | 0.430 | 1.20 | 1.59 | 44.68 | 0.499 | 1.13 | 3.85 | 42.09 | 0.528 | 0.98 | 4.87 |
1 (Ci) Initial concentration, (P.Sp.) Pump speed, (C.H) Cake height, (C.C) Final cake concentration and (α) Cake resistance from filtration equation, Equation (1). 2 Relative standard deviation (RSD) based on cake height measurement variability from five points for each test, leading to uncertainty value for cake concentration.
© 2019 by the authors. Licensee MDPI, Basel, Switzerland. This article is an open access article distributed under the terms and conditions of the Creative Commons Attribution (CC BY) license (http://creativecommons.org/licenses/by/4.0/).
Share and Cite
MDPI and ACS Style
Mahdi, F.M.; Hunter, T.N.; Holdich, R.G. A Study of Cake Filtration Parameters Using the Constant Rate Process. Processes 2019, 7, 746. https://doi.org/10.3390/pr7100746
AMA Style
Mahdi FM, Hunter TN, Holdich RG. A Study of Cake Filtration Parameters Using the Constant Rate Process. Processes. 2019; 7(10):746. https://doi.org/10.3390/pr7100746
Chicago/Turabian StyleMahdi, Faiz M., Timothy N. Hunter, and Richard G. Holdich. 2019. "A Study of Cake Filtration Parameters Using the Constant Rate Process" Processes 7, no. 10: 746. https://doi.org/10.3390/pr7100746
Note that from the first issue of 2016, this journal uses article numbers instead of page numbers. See further details here.