Article

Performance and Microbial Community Structure of Anaerobic Membrane Bioreactor for Lipids-Rich Kitchen Waste Slurry Treatment: Mesophilic and Thermophilic Processes

1
School of Environmental and Civil Engineering, Jiangnan University, Wuxi 214122, China
2
Jiangsu Key Laboratory of Anaerobic Biotechnology, Jiangnan University, Wuxi 214122, China
*
Author to whom correspondence should be addressed.
Processes 2019, 7(12), 879; https://doi.org/10.3390/pr7120879
Submission received: 22 October 2019 / Revised: 11 November 2019 / Accepted: 12 November 2019 / Published: 26 November 2019
(This article belongs to the Special Issue Wastewater Treatment Processes)

Abstract

:
The performance and microbial community structure for treating lipids-rich kitchen waste slurry in mesophilic Anaerobic Membrane Bioreactor (m-AnMBR) and thermophilic AnMBR (t-AnMBR) were compared in this study. Higher Organic Loading Rate (OLR) of 12 kg-COD/(m3·d), better Chemical Oxygen Demand (COD) removal efficiency over 98%, stronger stability with Volatile Fatty Acids (VFAs)/alkalinity below 0.04, higher flux with 18 L/(m2·h) and lower Long Chain Fatty Acids (LCFAs) concentration of 550 mg/L were obtained in the m-AnMBR. Directly increasing temperature from 39 to 55 °C resulted in a collapse of the t-AnMBR. Acclimation via gradually increasing temperature made the t-AnMBR run successfully with lower OLR and COD removal efficiency of 7.5 kg-COD/(m3·d) and 96%. An obvious discrepancy of microbial community structure was presented between the m-AnMBR and t-AnMBR via the 16S rRNA gene sequence analysis. The Methanomethylovorans and Methanoculleus were dominant in the t-AnMBR instead of Methanobacterium and Methanothrix in the m-AnMBR.

1. Introduction

In China, the annual generation of kitchen waste from families, catering services, restaurants and other sources is about 110 million tons per year [1]. This huge amount of kitchen waste urgently needs to be disposed. The common disposal process of kitchen waste in China has been raw material crushing, high temperature steaming, biodiesel refining and solid–liquid separation. In this process, the produced liquid phase, also called kitchen waste slurry, makes up about 80% of kitchen waste and its temperature is up to 85 °C. This large amount of kitchen waste slurry is characterized by high lipids and would pollute the environment if directly discharged into the water body. Anaerobic digestion is a promising way to dispose the high-lipids waste slurry and achieve energy recovery as the lipids exhibit higher methane yield compared with carbohydrates and proteins [2,3]. However, their hydrolysis products, the Long Chain Fatty Acids (LCFAs), presents an acute toxic effect on the anaerobic, resulting a decrease of microbial activity [4,5]. In addition, they can absorb onto the surface of the microbe, forming a light LCFA layer around biomass particles, causing biomass flotation and wash-out [6,7]. Conventional high rate anaerobic digestion technology (Expanded Granular Sludge Bed (EGSB) and Up-flow Anaerobic Sludge Bed (UASB) technologies) for treating the high-lipids waste waters/slurries have faced problems of operation failure due to biomass retention problems. Fortunately, the Anaerobic Membrane Bioreactors (AnMBRs) can effectively solve these problems due to the complete intercept of the membrane to the biomass.
In our previous study, we had adopted an anaerobic membrane bioreactor for mesophilic digestion (m-AnMBR) to treat this high-lipids kitchen waste slurry after cooling to 50 °C and had obtained perfect treatment efficiency [8]. However, as the kitchen waste slurry had a high temperature of 85 °C and needed to be lowered to 50 °C for mesophilic digestion by cooling equipment, this would waste a lot of energy. Thus, in order to use the heat of the raw waste slurry and also save energy, we had another idea about adopting the thermophilic AnMBR (t-AnMBR) to treat this kind of wastewater without cooling. According to the relative report, thermophilic digestion could accelerate hydrolysis rate and achieve higher gas production rate and organic load compared to mesophilic digestion, since the growth rate of a thermophilic microorganism is 2–3 times that of a mesophilic microorganism [9]. Besides, the thermophilic anaerobic digestion is known to present several advantages such as an increased destruction rate of organic solids and the elimination of pathogens [10].
However, thermophilic digestion is also more sensitive to the inhibitors and prone to instability compared to mesophilic digestion [11]. LCFA, one kind of the inhibitors, presented higher biological toxicity to the microorganism under thermophilic digestion [12], as its toxicity as a surfactant enhanced when the temperature increased. This would cause a breakdown of anaerobic microbial cells and finally result in a failure of reactor operation. Bayr et al. [13] had found that thermophilic process for co-digestion rendering and slaughterhouse wastes was more unstable than mesophilic process probably due to the accumulation of long chain fatty acids (LCFAs), methane yields being lower in thermophilic conditions. Broughton et al. [14] investigated the effect of temperature on the anaerobic digestion for mutton tallow. Results showed that the mutton tallow could be quickly converted to LCFAs and VFAs at 35 °C while it was hardly difficulty to be degraded at 50 °C and the methanation lagged. Moreover, the difference in cell membrane composition between the thermophilic and mesophilic methanogens was also an importantal factor that made them present different tolerant ability to the LCFAs.
Recently, research into the toxicity and inhibition of LCFAs to the methanogens under high temperature have mainly focused on pure cultures and batch experiments. However, in the practical application for treating industry lipids-rich wastewater, the complexity of the wastewater composition, mixed flora and operation condition make the AnMBR more of a challenge, which needs to be further researched. Besides, the membrane filtration is also very important to the AnMBR stable operation. Long-term operation under high temperature may also affect the properties of sludge, such as changing the viscosity and rheological properties of sludge; thus, affecting the sludge filterability and further influencing the membrane filtration. There were also few reports about the long-term membrane filtration under thermophilic digestion. Therefore, in this work, the t-AnMBR system was operated by raising the temperature of an m-AnMBR being operated stably for a long time in our previous study [15], and the objective was to: (1) investigate and compare the digestion performance and reactor stability of t-AnMBR and m-AnMBR for treating kitchen waste slurry; (2) analyze the LCFAs degradation efficiency and the microbial community structure between t-AnMBR and m-AnMBR; (3) monitor the shift of the membrane filtration and sludge characteristics when the AnMBR operated at temperatures changing from 3 to 55 °C.

2. Materials and Methods

2.1. Kitchen Waste Slurry Characterization

The specific components of the kitchen waste slurry are summarized in Table 1. The slurry contained high concentration organic matter with average Total Chemical Oxygen Demand (TCOD) and Total Suspended Solids (TSS) concentrations of 90.2 g/L and 18.5 g/L, respectively. Especially, the lipids content in the slurry was very high and the average value was up to 5.95 g/L. The feed pH was about 3.88. The Ammonia Nitrogen (NH4+), Total Kjeldahl Nitrogen (TKN) and Total Phosphorus (TP) concentrations were approximately 325 mg/L, 1848 mg/L and 83.5 mg/L, respectively.

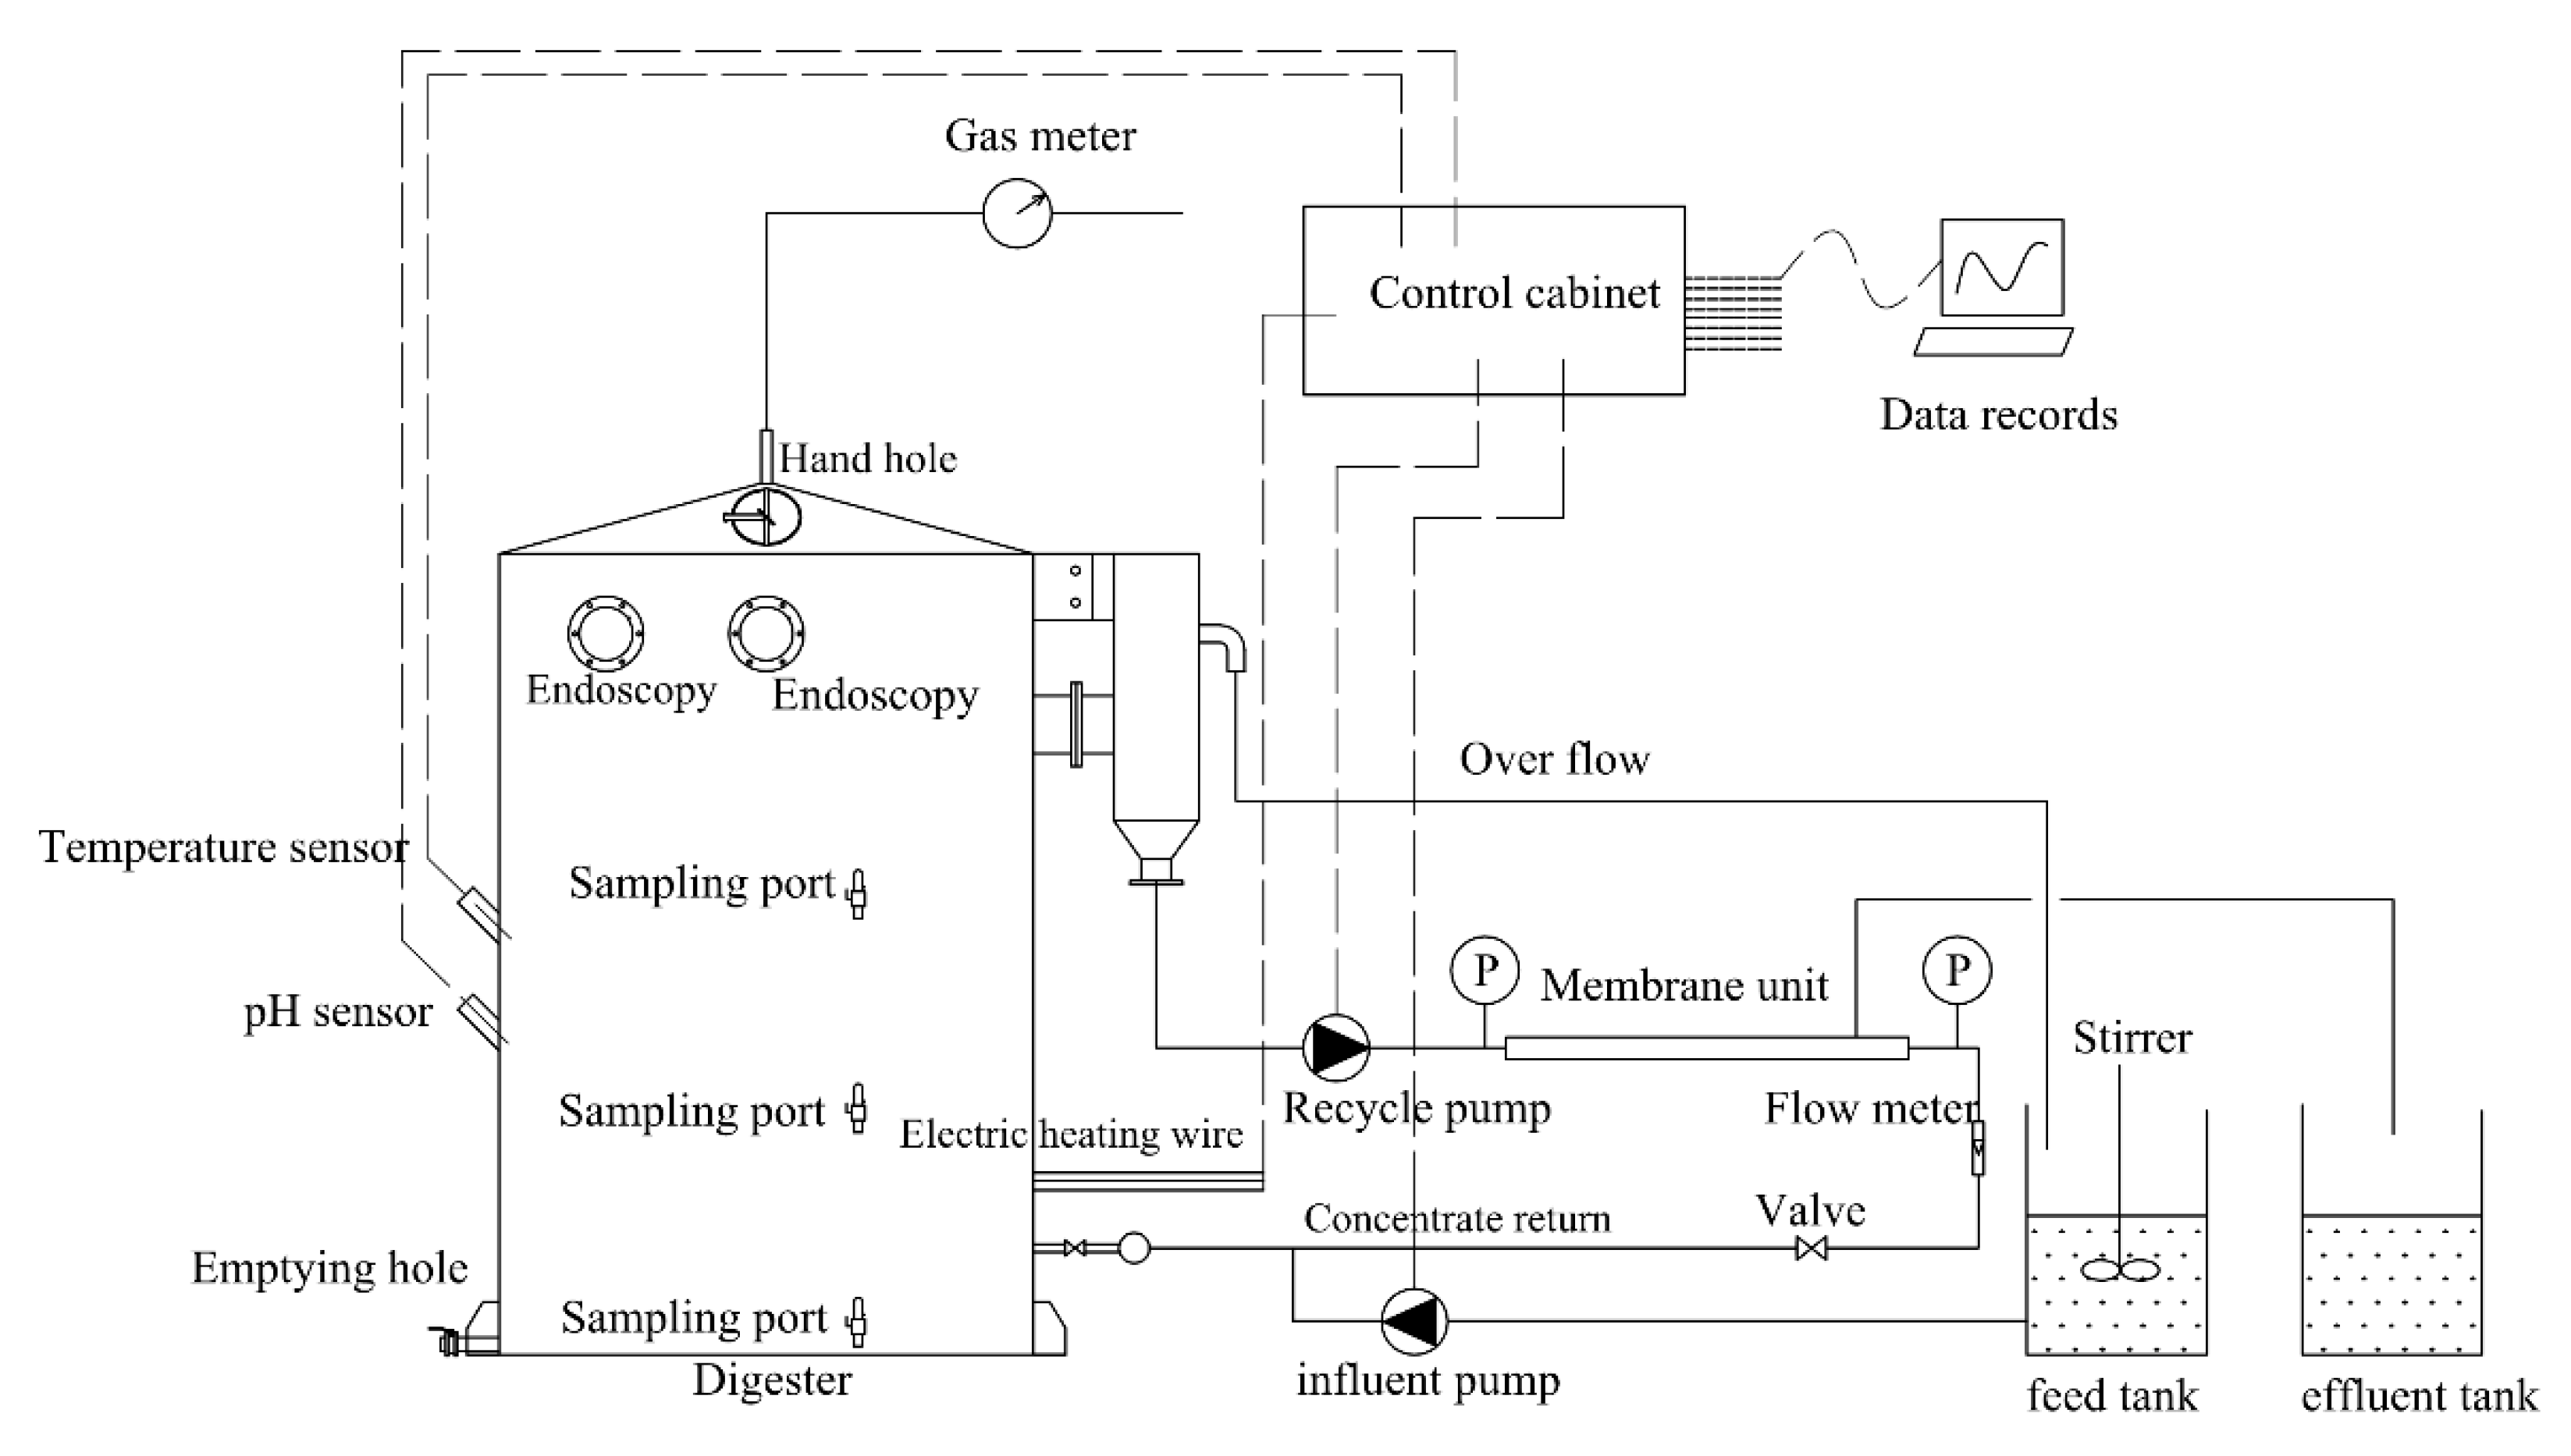
2.2. AnMBR Configuration and Parameters

The AnMBR used in this study was installed at a kitchen waste treating plant in Suzhou, China and mainly contained feed system, digestion system and membrane system (Figure 1) [15]. The feed system consisted of a feed tank with stirring and an influent pump. The digestion system mainly contained a digestion tank with effective volume of 1 m3, a temperature control device and a pH on-line monitor. The membrane filtration system was composed of two tubular Ultrafiltration (UF) membrane modules (MEMOS, Germany) and a recycle pump. The membrane material is polyvinylidene fluoride (PVDF), and the length and total surface were respectively 1 m and 0.095 m2 for each membrane module. The average operating pressure and the cross flow velocity of the membrane were 0.23 MPa and 2.2 m/s. the sludge concentrate after filtering was returned to the bottom of the digestion tank, resulting in a 2.2 m/s up flow velocity in the reactor and making the anaerobe fully contact with the substrate.

2.3. Operation Strategy

The AnMBR system was inoculated with 1 m3 anaerobic sludge containing 10.4 g/L Mixed Liquor Suspended Solid (MLSS) and 7.8 g/L Mixed Liquor Volatile Suspended Solid (MLVSS) from the full-scale Continuous Stirred Tank Reactor (CSTR) reactor treating kitchen waste slurry in the plant. Then, it had been operating steadily for about one year under mesophilic condition, with OLR, Sludge Retention Time (SRT) and Hydraulic Retention Time (HRT) of 9.3 kg-COD/(m3·d), 20 d and 10 d, respectively [9]. The inflow, outflow, sludge discharge flow rate was 98 L/d, 48 L/d and 50 L/d, respectively. As the membrane permeate flow rate was 74 L/d and more than the outflow rate (48 L/d), the excess 26 L/d permeate was returned to the digestion reactor. In this study, to improve the treating potential of the AnMBR, the OLR was gradually improved to 12.0 kg-COD/(m3·d) through increasing the inflow rate to 124 L/d which was equal to the permeate flow rate. Under this OLR, the AnMBR kept operating for 60 d. Then, it was running from mesophilic digestion (39 ± 1 °C, m-AnMBR) to thermophilic digestion (55 ± 1 °C, t-AnMBR). The thermophilic digestion was developed for three stage: (1) the digestion temperature raised from 39 °C to 55 °C directly and then the t-AnMBR operation failed after 52 days (stage I); (2) the t-AnMBR went into recovery phase and gradually increased temperature from 39 °C to 55 °C with a rate of 1 °C/d (stage II); (3) the OLR of the t-AnMBR was improved (stage III).

2.4. Physicochemical Analysis

The COD, TSS, VFAs, pH and alkalinity were analyzed according to Standard Methods [16]. The VFAs were detected using a GC-2010 (Shimadzu, Japan) equipped with a flame ionization detector (FID) and a 30 m × 0.25 mm × 0.25 μm capillary column (Rtx-5, Restek, USA). The carrier was nitrogen with flow rate of 30 mL/min and the split was 50 [17]. The CH4 content was determined by a gas chromatography equipped with a thermal conductivity detector (TCD) and a 1.8 m × 3.2 mm stainless-steel column packed with porapak Q (80/100 mesh), the carrier gas was helium with flow rate of 5 mL/min [18]. The sludge particle size distribution of sludge suspension was determined by BT-2003 Laser Particle Size Analyzer (Bettersize Instruments Ltd., Dan Dong, China). The viscidity was analyzed by a rotary viscosimeter to characterize the rheological properties of sludge (NDJ-7, Shanghai Tianping instrument technology co., LTD, Shanghai, China). Lipids content was measured using gravimetry after ether extraction [19]. The method of the extraction and determination for LCFAs referred to the research of Neves et al. [20]. The sample was dried and grinded, and a defined amount was added to the glass vial containing 1.5 mL HCl, 1.5 mL methanol, 2 mL dichloromethane and 2 mL ultra-pure water. The mixture was then vortex-mixed and methyl-esterified at 100 °C for 3.5 h. Subsequently, another 2 mL ultra-pure water was added and the vial was kept in inverted position for 30 min, after which the organic phase was analyzed by a gas chromatography (GC-2010, Shimadzu, Kyoto, Japan) equipped with a flame ionization detector and a capillary column. The carrier gas was helium and the flow was 1.0 mL/min.

2.5. Microbial Community Analysis

Ten samples of M1, M2, T1, T2, T3, R1, R2, T3, T4 and T5 at different stages was taken out from the reactor and stored at −80 °C. M1 and M2 were the sampling time points at the 30th day and 60th day under mesophilic condition. T1, T2 and T3 were the sampling time points at the 70th day, 90th day and 110th day during stage I with the digestion temperature raised from 39 °C to 55 °C directly. R1 and R2 were the sampling time points at the 115th day and 125th day during stage II with the AnMBR going into recovery phase. T3, T4 and T5 were the sampling time points at the 135th day, 165th day and 185th day during stage III with the OLR of the t-AnMBR improved. Total DNA was extracted using PowerSoil DNA Isolation Kit (MO-BIO, Norcross, Georgia, USA) according to the manufacturer’s instruction. The extracted DNA quality needed to meet the requirements that the A260/A280 and A260/A230 were greater than 1.8 and 2.0, respectively. The A260, A280 and A230 represented the absorbance of the DNA, protein and other contaminants (carbohydrate, polypeptides and phenols) at the wavelength of 260 nm, 280 nm and 230 nm, respectively. After the DNA extraction, the high-throughput 16S rRNA sequencing was conducted with bacteria primer pairs (319F: 5′-ACTCCTACGGGAGGCAGCAG-3′, 806R: 5′-GGACTACHVGGGTWTCTAAT-3′) and archaea primer pairs (349F:5′-GYGCASCAGKCGMGAAW-3′, 806R: 5′-GGACTACHVGGGTWTCTAAT-3′) [15,21] to investigate the variations of microbial community structure of the m-AnMBR and t-AnMBR, The sequence analysis was proceeded according to the reference of Xiao et al. [15]. The principle component analysis (PCA) were statistically evaluated using Vegan package of R language (Version 3.5.1) [22].

3. Results and Discussion

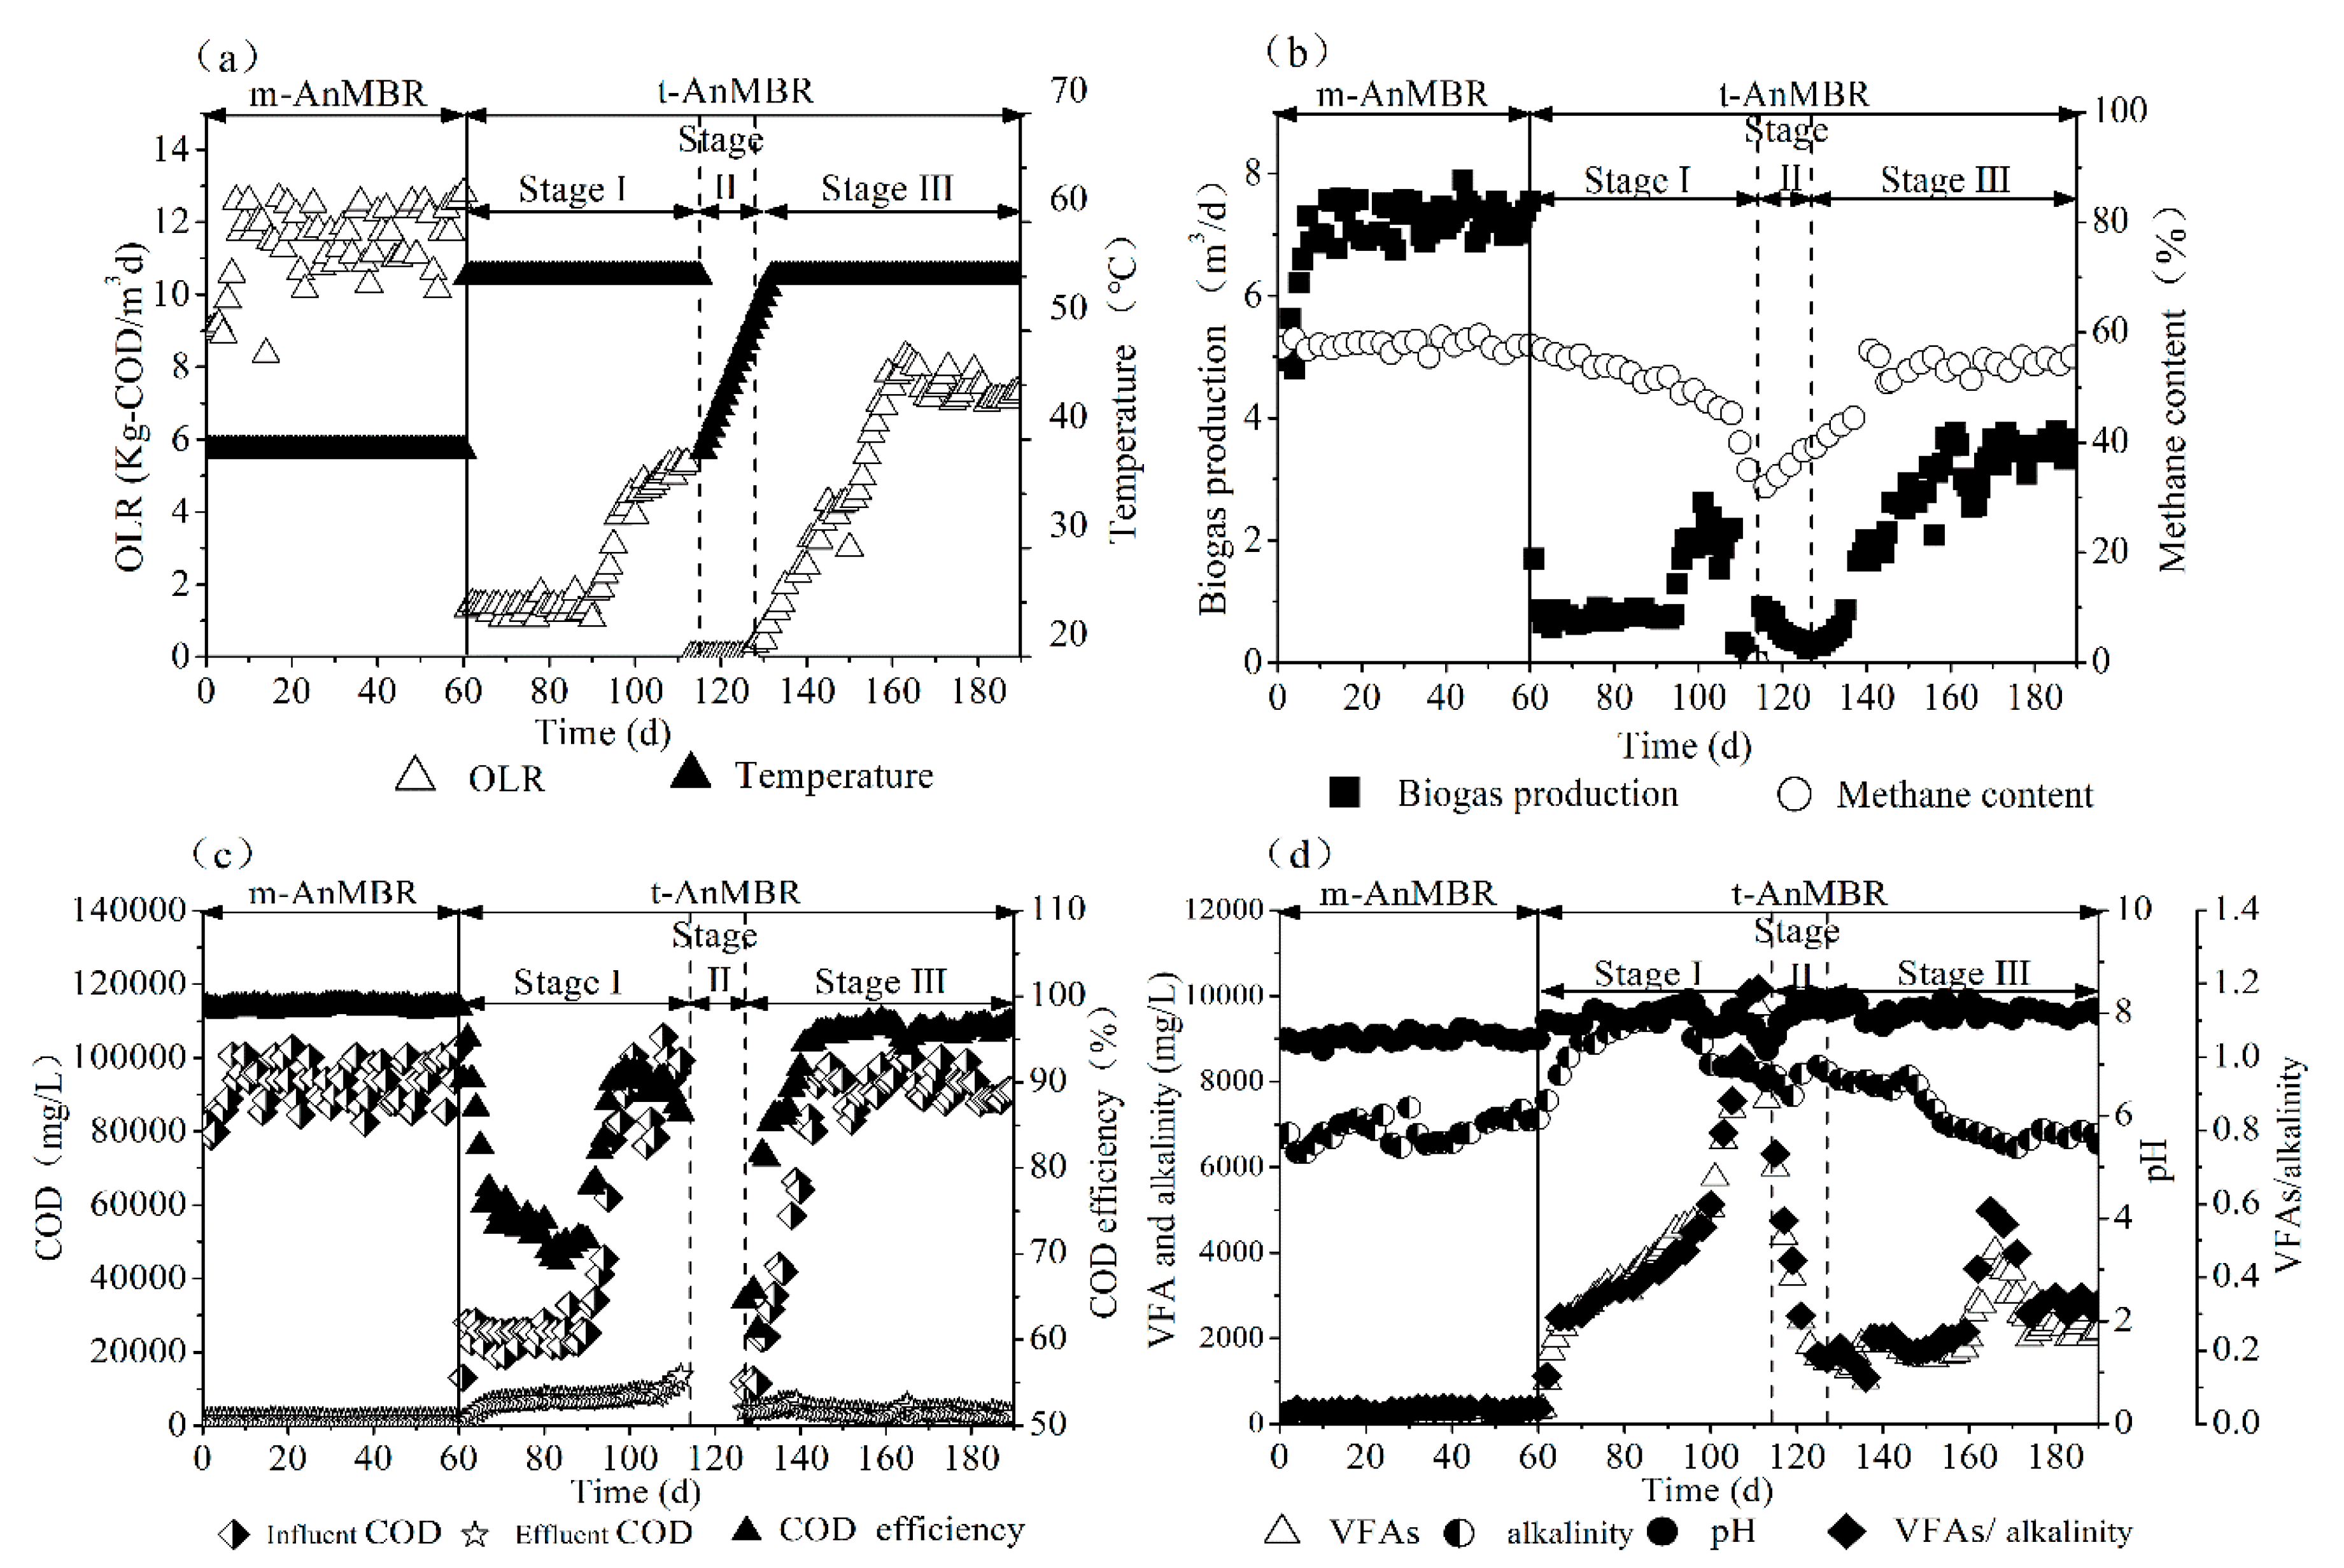
3.1. Digestion Performance

The variations of OLR, biogas production and COD removal efficiency for the AnMBR operating under mesophilic and thermophilic conditions are shown in Figure 2. As described in Section 2.3, the m-AnMBR had been already operating for one year with OLR of 9.3 kg-COD/(m3·d). In this study, the OLR of the m-AnMBR rapidly increased to 12.0 kg-COD/(m3·d) in the first 10 days, and the m-AnMBR had been running steadily for 50 days under this OLR with biogas production and methane content of 7.2 m3/d and 58% (Figure 2a,b). Moreover, the effluent COD kept below 1600 mg/L and the COD removal efficiency was up to 98% (Figure 2c), which showed that the AnMBR presented excellent treatment effect on kitchen waste slurry under mesophilic condition.
After the m-AnMBR operating for 60 days, it was transferred to a high thermophilic digestion phase with temperature going directly from 39 to 55 °C (stage I), and the OLR decreased to 1.3 kg-COD/(m3·d) through diluting the raw kitchen waste slurry with tap water, which adapted the microbes to the change of temperature. Under this low OLR, the t-AnMBR had been running for 30 days (from the 61st d to the 90th d) with no sludge mixture discharge. During this adaption stage, the biogas production was 0.76 m3/d and the methane content decreased from 58% to 52%. From the 91st day to the 113rd day, the OLR gradually increased to 4.6 kg-COD/(m3·d) and the biogas production increased to 2.37 m3/d. However, the methane content continued to decrease to 47.5% (Figure 2b), which showed that the methanogens activity might be inhibited. This could be illustrated that the sudden change in temperature and the sensibility of the methanogens to the environment made some methanogens that are not tolerant to the high temperature gradually die off (Section 3.3.2). Furthermore, the increase of the temperature changed the characteristic of the microbial cell membrane and strength the toxicity of the LCFAs as surface active agent, which inhibited the activity of the methanogens [23]. When the OLR continued to rise, the biogas production decreased sharply and then stopped with the OLR up to 5.3 kg-COD/(m3·d), indicating that the t-AnMBR system collapsed. During stage I, the variation of COD removal efficiency was showed in Figure 2c. At the adaption stage of low OLR (from the 61st d to the 90th d), the influent COD kept at about 25,000 mg/L, while the effluent COD continued to increase from 1600 to 7160 mg/L and the COD removal efficiency decreased from 98% to 71%. Then, the influent COD concentration was gradually improved to the same as that of the raw kitchen waste slurry and the effluent COD accumulated rapidly to 13,500 mg/L. At this moment, the t-AnMBR stopped producing biogas and the system collapsed. This may be illustrated that thermophilic digestion could increase the destruction rate of organic solids (high suspended solid contained in the kitchen waste slurry) and lead to a COD accumulation. Moreover, as the methanogens presented higher sensitivity to the environment change and the inhibitors (LCFAs) than that of the bacteria, the consumption of the VFAs and LCFAs was lower than the production of them. This also resulted in the accumulation of the COD [24]. The details would be explained in the following and Section 3.2.
After the t-AnMBR was broken down, we had immediately taken some strategies to restore the system. Firstly, we used the effluent with COD of 500 mg/L, which was from aerobic membrane bioreactor (MBR) for deep treatment of the kitchen waste slurry at the processing site as the influent of the t-AnMBR to dilute the VFAs accumulated in the reactor. The influent flow rate was 46 L/d and OLR was 0.023 kg-COD/(m3·d). Secondly, the temperature of the digestion reactor decreased to 39 ± 1 °C and then increased to 55 °C at a rate of 1 °C/d, which gradually adapted anaerobes to changes in temperature. During the recovery period of 13 days (from the 113rd day to the 126th day, stage II), the biogas production of the t-AnMBR recovered to 0.5 m3/d and methane yield was 21.74 m3/kg-COD, much higher than the theoretical biogas production value after calculation. This might be illustrated that the microorganism used the accumulated VFAs in the reactor to produce methane.
After the recovery period, the digestion temperature had already risen to 55 °C and the system went into OLR lifting and a stably operating stage (from the 126th day to the end). During this stage, the variation of OLR, biogas production and methane content and COD removal efficiency are shown in Figure 2a–c. The biogas production and methane content increased to 3.5 m3/d and 55%, respectively, with OLR increased to 7.5 kg-COD/(m3·d), while the effluent COD content and COD removal efficiency were 3500 mg/L and 96%. However, biogas production and methane content immediately decreased to 2.5 m3/d and 50%, respectively, when the OLR increased to 8.0 kg-COD/(m3·d), Correspondingly, the effluent COD concentration increased to 5900 mg/L and COD removal efficiency decreased to 94%. Therefore, the OLR was recovered to 7.5 kg-COD/(m3·d) and the AnMBR had been operating for 20 days under this OLR until the biogas and methane content stably maintained at 3.5 m3/d and 55% respectively. The effluent COD concentration and COD removal efficiency kept at 3500 mg/L and 96%.
Generally, one can determine whether the reactor is stable and the OLR can be improved by relying on the value of VFAs/alkalinity. When the VFAs/alkalinity ratio is below 0.3, the reactor has a robust stability and can continue to increase its OLR. While when the ratio is above 0.5, the digester has a risk of acidification and breakdown [25]. During the whole mesophilic digestion process of the m-AnMBR, the VFAs kept at a low level of 300 mg/L and the alkalinity was 6900 mg/L with the OLR of 12.0 kg-COD/(m3·d) (Figure 2d). The low ratio of 0.04 for the VFAs/alkalinity showed that the m-AnMBR presented a robust stability performance under mesophilic conditions. However, when the system was transferred to the thermophilic digestion phase with temperature going directly from 39 to 55 °C (stage I), the VFAs accumulated sharply to 9700 mg/L at the 110th day. The ratio of VFAs/alkalinity peaked to 1.2, showing the collapse of the t-AnMBR. Next, the t-AnMBR turned into recovery stage (stage II). Due to the dilution of the effluent came from the MBR to the accumulated VFAs and the degradation of the microbe to the VFAs, the VFA concentration decreased to 1500 mg/L and the ratio of VFAs/alkalinity fell to about 0.2, indicating of the system recovery. Then, the OLR gradually improved to 7.5 kg-COD/(m3·d). The VFA concentration kept below 2000 mg/L and VFAs/alkalinity was lower than 0.25. When the OLR continued to increase to 8 kg-COD/(m3·d), the VFA concentration increased to 4000 mg/L and VFAs/alkalinity raised to 0.58, showing the loss of stability for the t-AnMBR. Therefore, the OLR fell back to 7.5 kg-COD/(m3·d), and the VFA concentration and VFAs/alkalinity recovered to 2300 mg/L and 0.3. These data showed that the t-AnMBR could maintain a relatively stable state at OLR of 7.5 kg-COD/(m3·d).
By comparing the digestion performance of the m-AnMBR and t-AnMBR for treating kitchen waste slurry, it could be found that the m-AnMBR obtained higher OLR, better COD removal efficiency, stronger stability, and higher methane content than that of the t-AnMBR. This could be illustrated that the hydrolysate of the lipids in the kitchen waste slurry, the LCFAs, exhibited bacteriostatic toxicity to the microbe [26]. The thermophilic anaerobic biomass has been described as being more sensitive to LCFAs than the mesophilic biomass [27]. Thus, better digestion performance had been obtained in m-AnMBR. The details would be further described in Section 3.2.

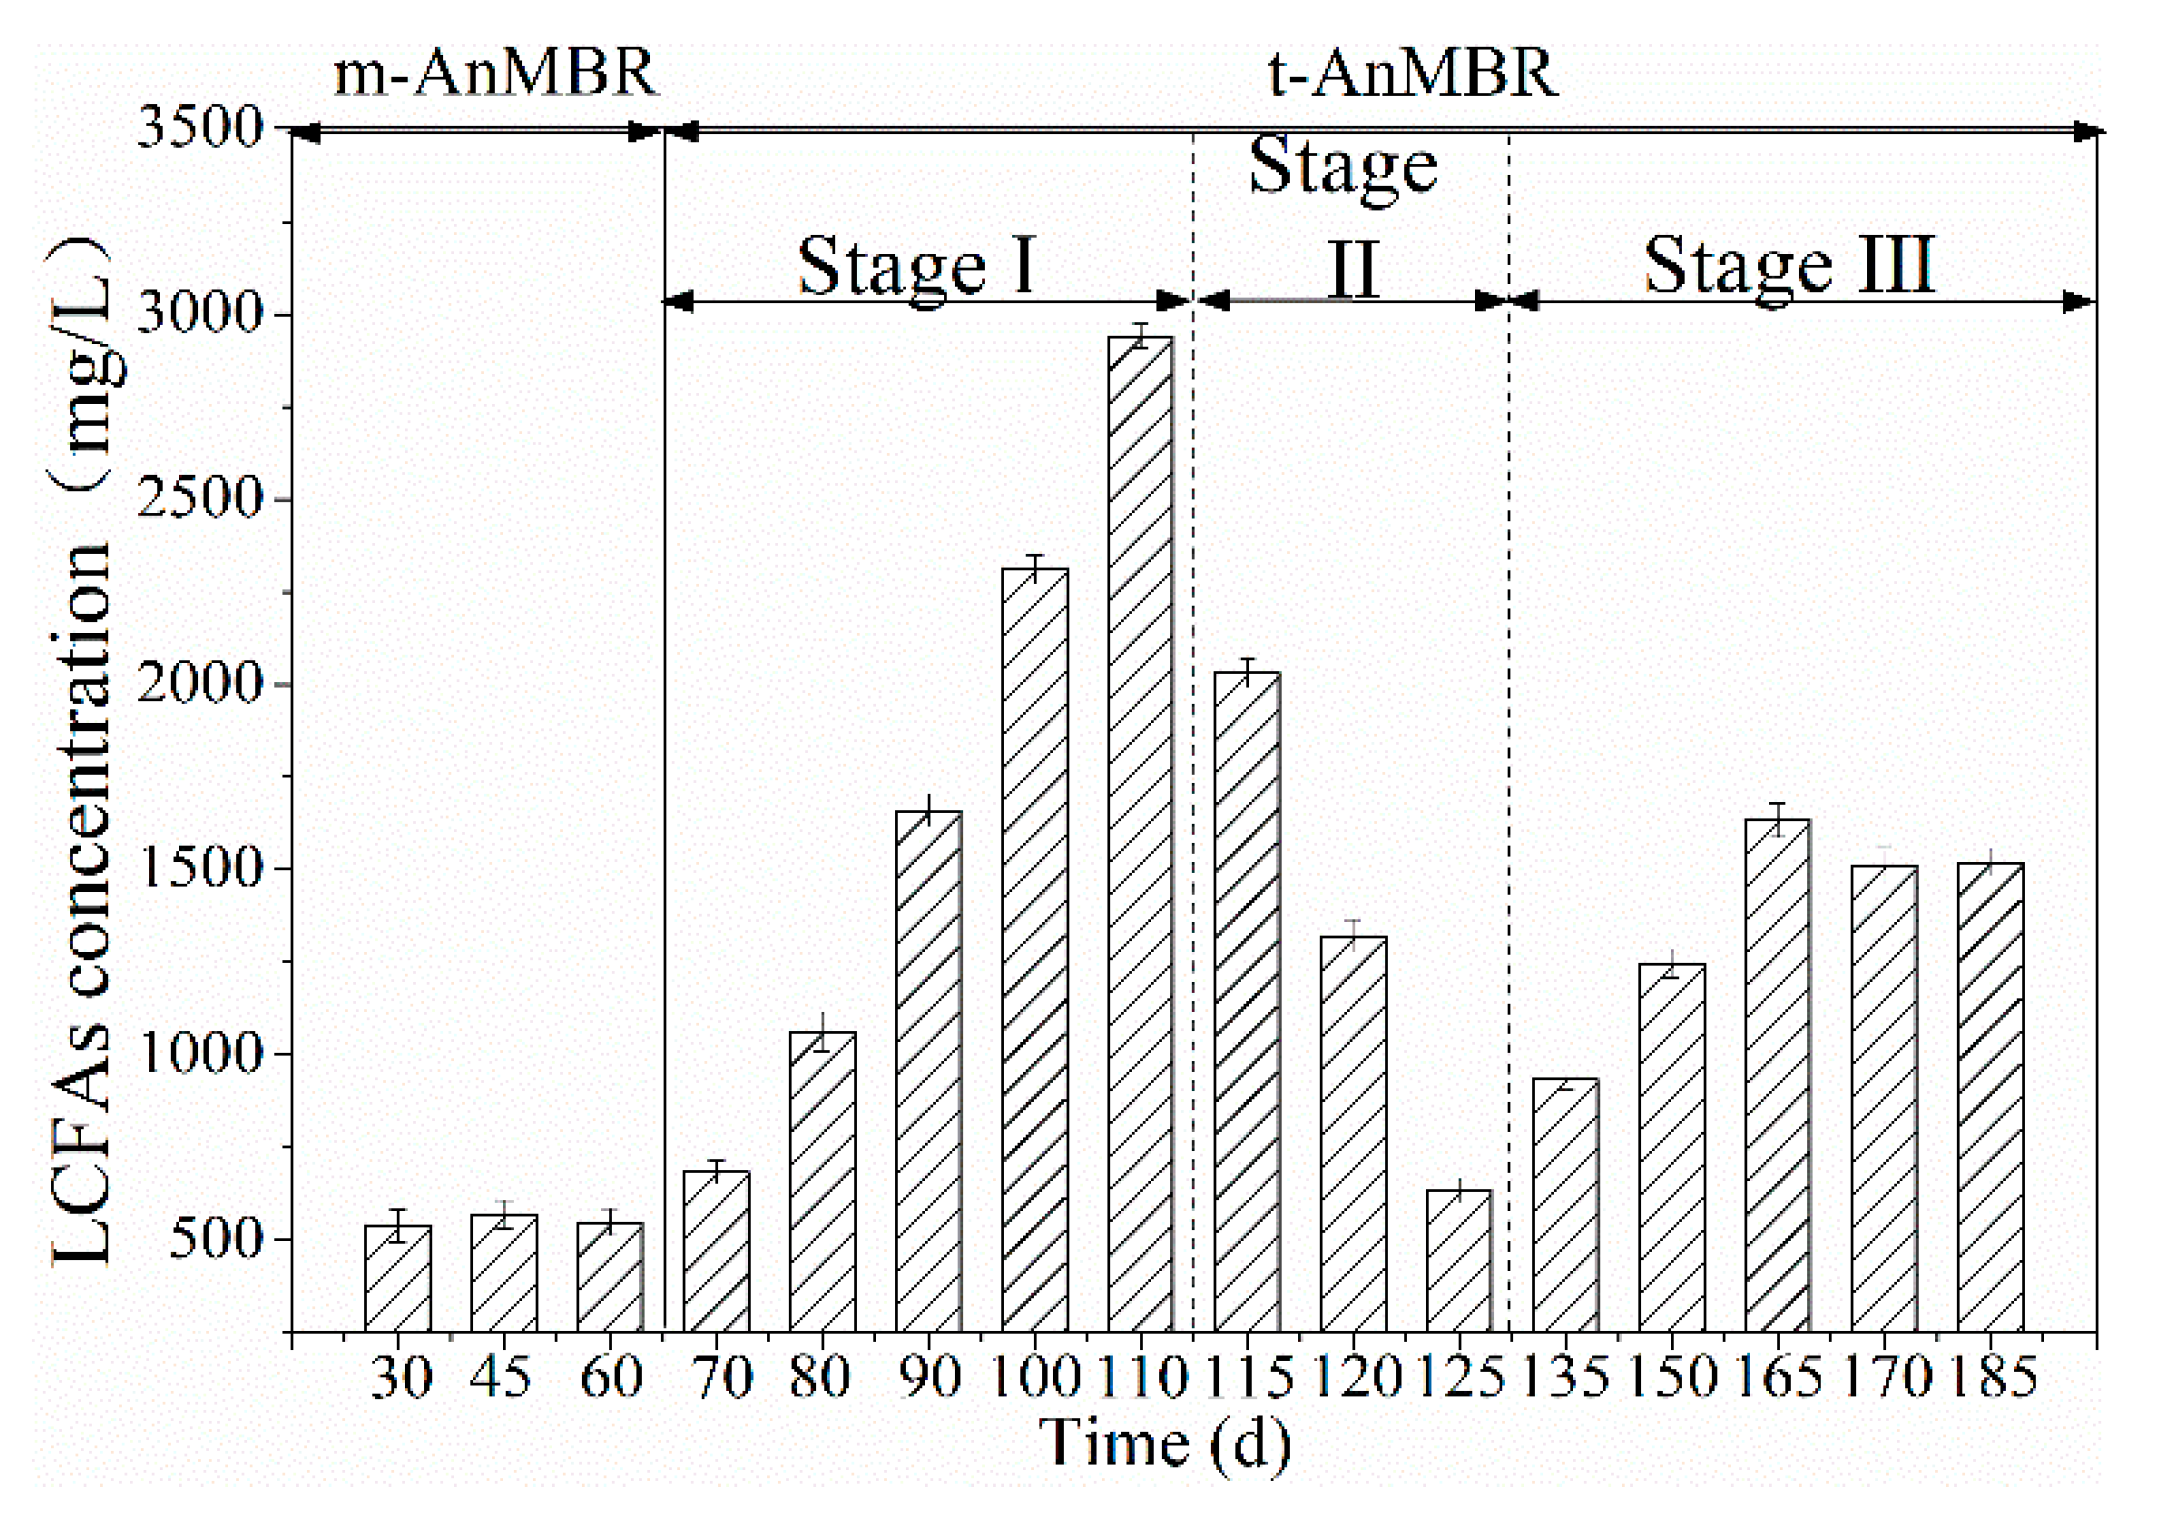
3.2. LCFAs Accumulation

LCFAs are special hydrolysis products of the lipids in the process of treating high-lipid kitchen waste slurry, as it presented higher methane yield compared with protein and carbohydrates [28,29]. The methane yield of the LCFAs can be up to 1.010 L CH4/g [2,3]. However, the LCFAs can be highly inhibitory, particularly of the β-oxidation and methanogenesis steps [30] due to the accumulation of LCFAs. Furthermore, strong bacteriostatic effects will be presented under high temperature [31,32]. Kabouris et al. [33] found that the digestion reactor treating municipal sludge and grease had obtained lower methane yield under thermophilic conditions than under mesophilic conditions. Labatut et al. [12] also reported that the thermophilic digestion with low manure-to-dog food ratio, was not stable and eventually failed as a result of LCFA accumulation. This LCFA accumulation in the thermophilic digestion inhibited the microbe activity and resulted in a worse performance. Therefore, it was important to monitor the variation of LCFA concentration in the process of treating lipids-rich wastewater. The LCFA concentrations under mesophilic and thermophilic digestion are shown in Figure 3. During the stable operation of mesophilic process, when the OLR was 12.0 kg-COD/(m3·d), the LCFAs in the sludge mixture maintained at low level of 550 mg/L. However, when the reactor transferred to stage I of t-AnMBR, the increase of temperature directly from 39 to 55 °C changed the characteristic of the microbial cell membrane and strength the toxicity of LCFAs as surface active agent, which decreased the microbe activity and the degradation rate to the LCFAs. Thus, although the OLR of t-AnMBR was only up to 5.3 kg-COD/(m3·d), the LCFAs accumulated from 550 mg/L to 2940 mg/L rapidly. The high LCFA concentration further inhibited the digestion process and resulted in the system collapse. In the next recovery stage (stage II), the effluent of the AnMBR, which came from the MBR for advanced treatment of the kitchen waste slurry in the plant, diluted the accumulated LCFAs. Moreover, the digestion temperature decreased to 39 °C and then gradually increased to 55 °C, which made the microbe adapted to the thermophilic environment. The microbe recovered activity and began to degrade the LCFAs, resulting in the LCFAs decreasing to 634 mg/L. Then, the LCFAs inhibition was alleviated and the AnMBR went into stage III of OLR improvement. When the OLR was 7.5 kg-COD/(m3·d), the LCFA concentration was 1500 mg/L.
The degree of the LCFAs inhibition not only depends on the LCFA concentration, but also its types. Generally, the palmitic (C16:0) and stearic (C18:0) is easier to accumulate in the reactor, while the oleic (C18:1) is an unsaturated fatty acid that has strong inhibition effect on the thermophilic microorganism [34,35]. Therefore, the specific types of the LCFAs for the m-AnMBR and t-AnMBR under stable operation were detected respectively, and results are shown in Table 2. In the m-AnMBR, the main LCFAs were oleic (C18:1), palmitic (C16:0) and stearic (C18:0), and their concentration were 163.2 mg/L, 179.4 mg/L and 56.5 mg/L, respectively. Data showed that these three LCFAs were most difficult to degrade and easily accumulated in the reactor, presenting toxicity to the microbe. When the system transferred into the thermophilic digestion, the LCFA concentration increased sharply as anaerobic microorganisms was more sensitive to the LCFAs than the mesophilic microorganisms. Especially, the oleic (C18:1) accumulated rapidly and its concentration was up to 535.7 mg/L. This high concentration of LCFAs exhibited serious toxicity to the thermophilic microorganisms and made the t-AnMBR prone to instability.

3.3. Microbial Community Structure

3.3.1. Microbial Diversity

The change of environmental factors would result in a discrepancy of the performance for the system due to the reconstruction of the microbial community structure [36]. Therefore, the microbial community structure under different temperatures was analyzed by illumina high-throughput sequencing. Based on the OTU results as described in Section 2.5, the alpha diversity and beta diversity were compared between mesophilic and thermophilic digestion. The Shannon index and principal component analysis (PCA) were the most recognized indicators to evaluate the alpha and beta diversity, respectively [37,38]. Table 3 showed the Shannon variation of M1, M2, T1, T2, T3, R1, R2, T3, T4 and T5 under different operation stages. As presented in Table 3, during the whole operation for the m-AnMBR and t-AnMBR, the Shannon index value for the bacterial communities was higher than that for the archaea communities, which revealed that the bacterial communities presented more abundant diversity compared with the archaea communities. This finding was agreement with the previous studies in the full-scale biogas digestion [39,40]. Furthermore, compared with the t-AnMBR, the Shannon values for the bacterial and archaea communities of the m-AnMBR were both higher, which explained the reason that digestion performance and stability of the m-AnMBR were better than those of the t-AnMBR. When the m-AnMBR transferred into stage I, a sudden change in temperature caused large quantities of microorganisms that were not resistant to high temperatures to death. The survived microorganisms weakened the resistance ability to toxic LCFAs and microbes further survived. Therefore, in stage I with the digestion temperature raised from 39 to 55 °C directly, the Shannon index decreased sharply and bottomed out at sampling time point of T3 when the system suffered a breakdown. At the recovery phase (stage II), the digestion temperature increased from 39 °C to 55 °C with a rate of 1 °C /d, making the microbe gradually adapt to the change of the temperature. The system recovered and microbial diversity was starting to pick up. The Gannoun and Tow’s researches [37,41] also found the same results, i.e., the dynamic changes in community diversity were due to the selective pressures in this environment. These results showed that the digestion performance and stability of the reactor were closely related to microbial diversity.
PCA was used to evaluate the beta diversity and results are shown in Figure 4. As the AnMBR went through from mesophilic stage (M1 and M2) to direct temperature increasing stage (stage I, TI, T2 and T3), recovery stage (stage II, R1 and R2) and OLR improvement in thermophilic stage (stage III, T4, T5, T6), the PCA result clearly demonstrated that microbial dynamic of both bacterial (Figure 4a) and archaea (Figure 4b) showed a similar pathway, indicating that temperature variation was the dominant environmental factor to affect microbial community structure in this system. Specifically, for the bacteria in Figure 4a, M1 and M2 are far from TI, T2, T3, R1, R2, T4, T5 and T6, indicating obvious differences in microorganisms between mesophilic and thermophilic digestion. Furthermore, in the thermophilic condition, T1, T2 and T3 were far apart from R1, R2, T4, T5 and T6. This was ascribed to that the T1, T2 and T3 being in an unsteady state in the directly increasing temperature stage and their diversity had some discrepancy from R1, R2, T4, T5 and T6. R1, R2 were close to T4, T5, T6, indicating of slightly different in microorganism between recovery stage and OLR improvement in thermophilic stage. Moreover, the PCA of archaea was analyzed in Figure 4b. The distances among the mesophilic stage, direct temperature increasing stage, recovery stage, and OLR improvement in thermophilic stage were far away from each other, suggesting the microorganism in the four stages presented obvious discrepancy. This might be attributed to the sensitivity of the archaea to the environment change. In conclusion, in the operation experiment of thermophilic digestion based on the mesophilic digestion, the microorganisms go through the pathway from steady-state at mesophilic conditions (M1, M2) to unsteady-state with direct increasing temperature (T1, T2, T3), recover state with gradually increasing temperature (R1, R2) and steady-state at thermophilic conditions (T4, T5, T6).

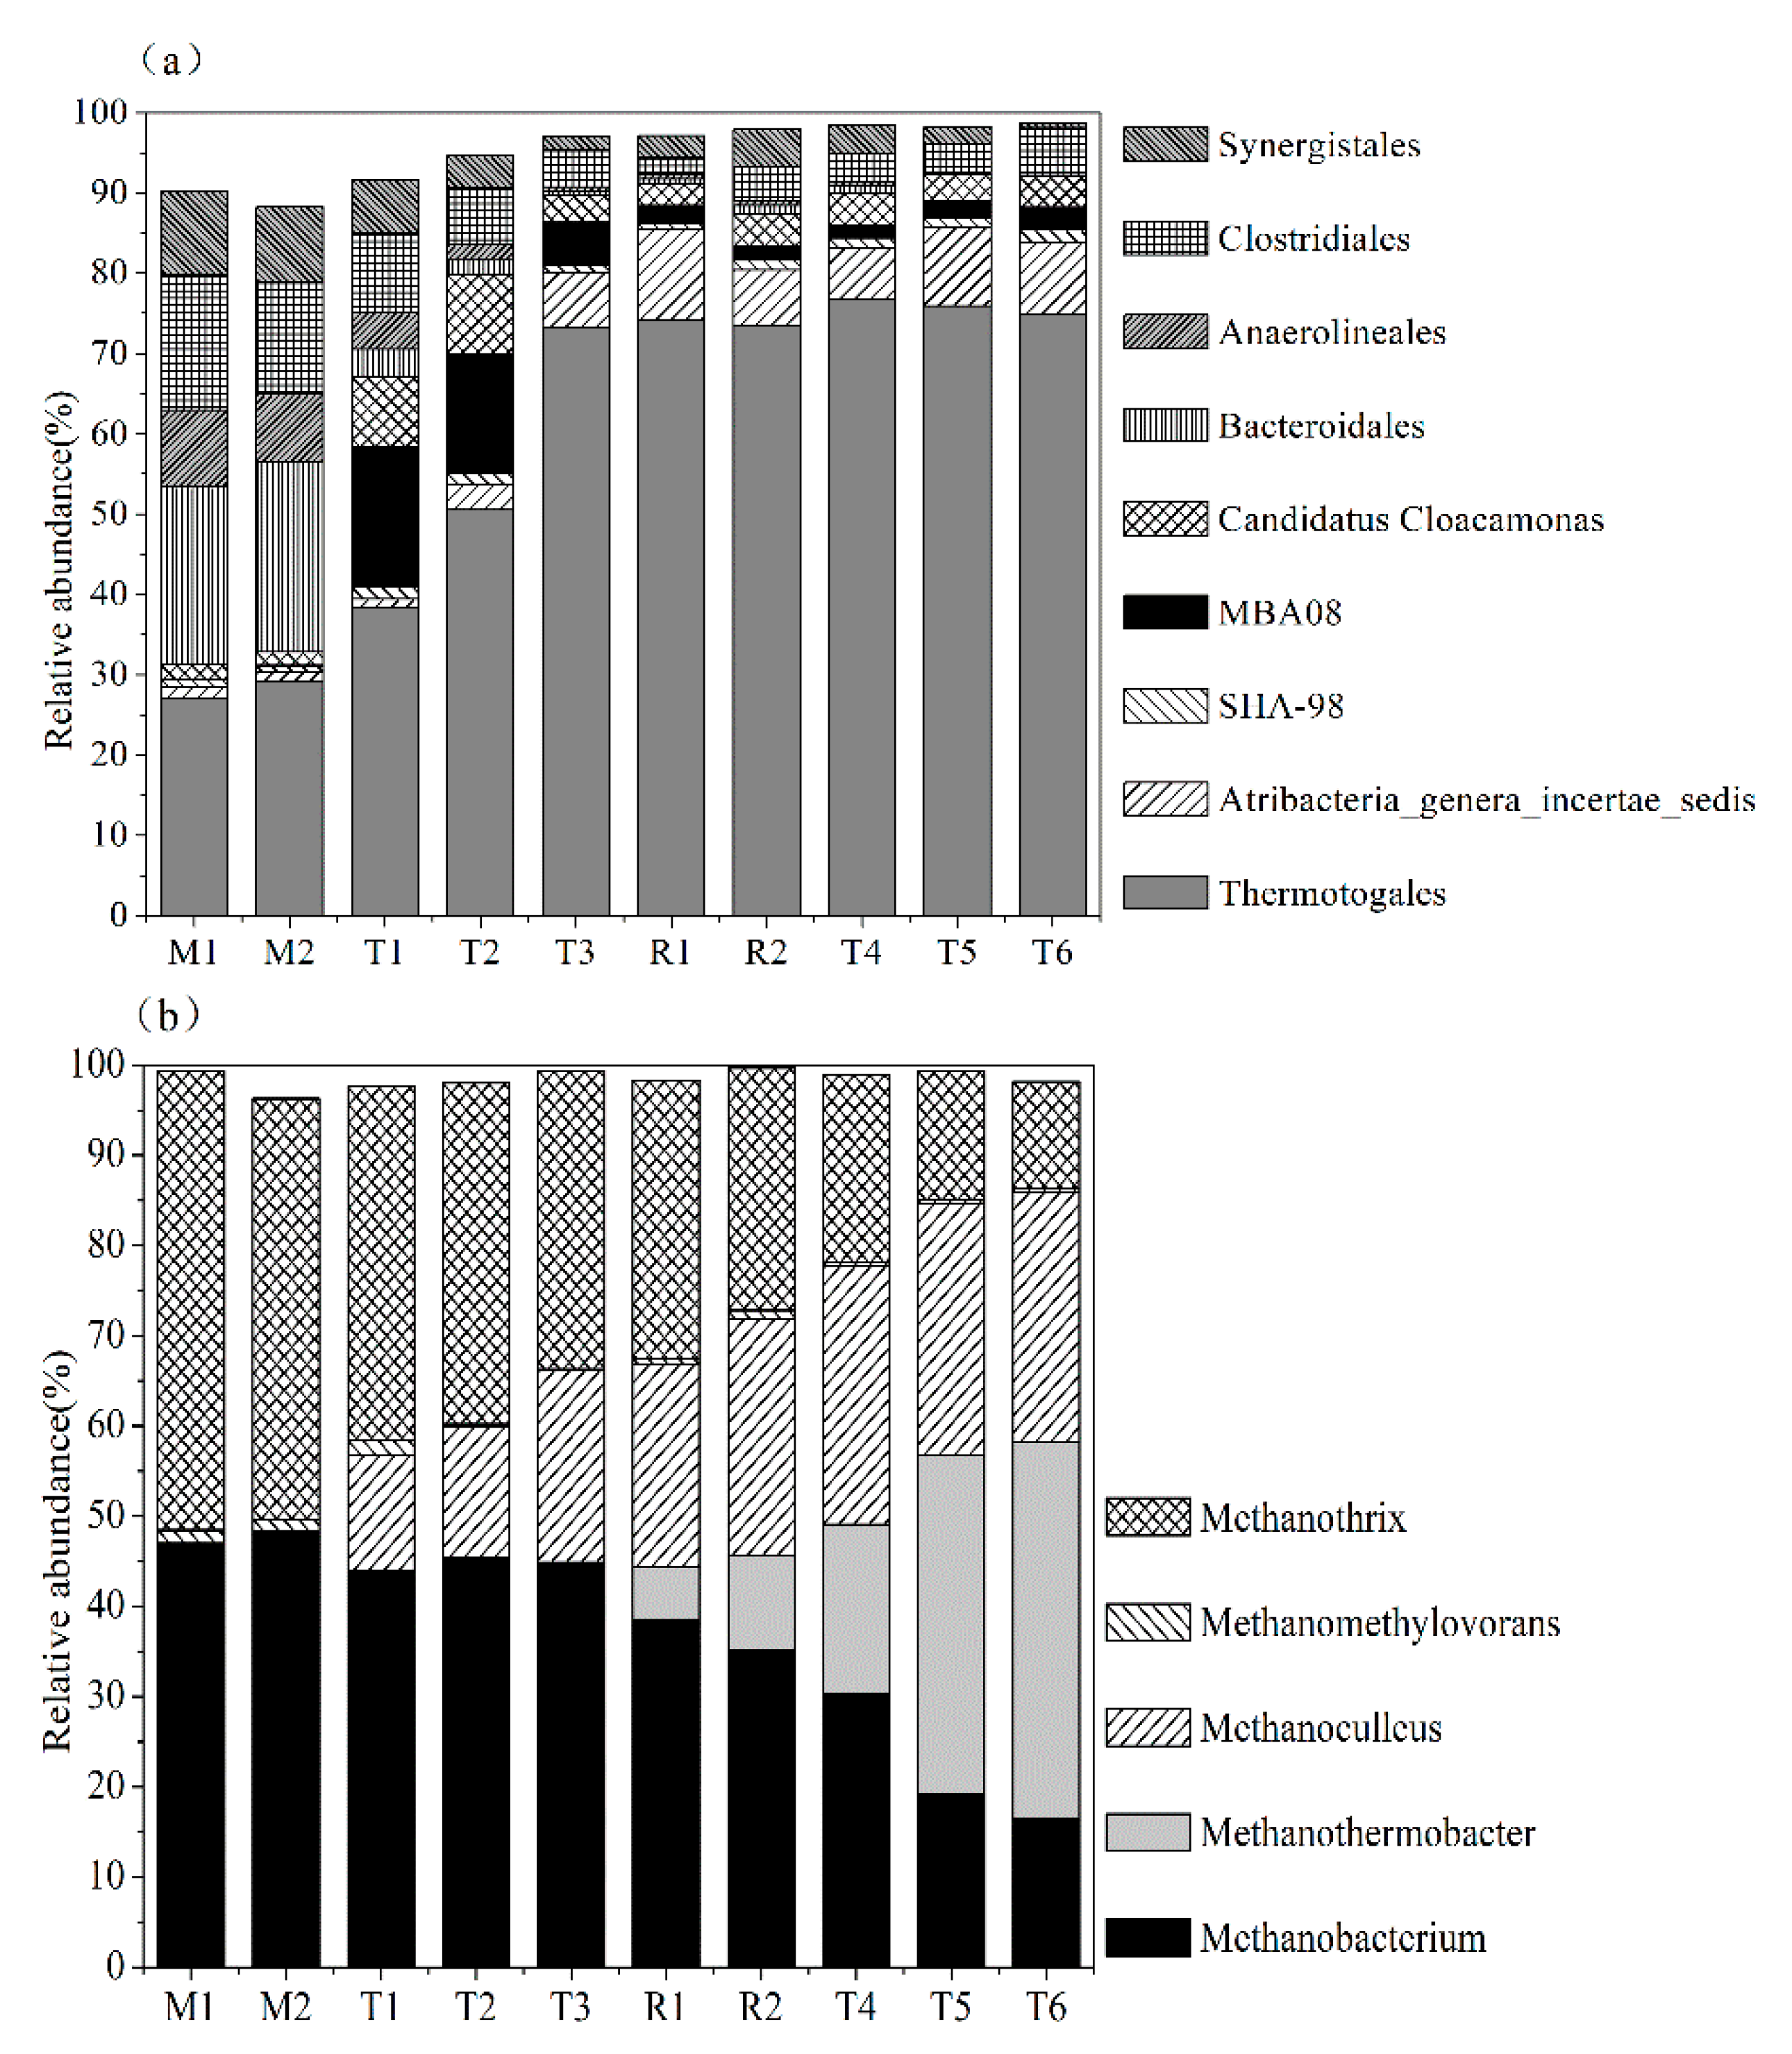
3.3.2. Microbial Relative Abundance

Wang et al. [42] had reported that temperature presented obvious effects on the microbial community structure and its change would cause the reconstruction of microbial community structure. This study also found similar results and the microbial relative abundances of m-AnMBR and t-AnMBR are shown in Figure 5. From Figure 5a, significant differences of the bacteria community structure in order levels were found under mesophilic digestion and thermophilic digestion. In the m-AnMBR, the Thermotogales, living in the high or extremely high temperature environment, also existed in this mesophilic system, and its average relative abundance accounted for 27.6%. This can be illustrated that the Thermotogales had strong adaptive capacity to the extreme environment such as complex substrates and oilfield environments [43], and the composition of the substrate used in this study was also complex and contained high lipids. Recent research had found that the Thermotogales lived in a mesophilic environment [44]. When the digestion temperature increased at sampling point of T1, T2, T3, R1, R2, T4, T5, T6, the relative abundance of Thermotogales increased from 38.4% to 50.54%, 73.24%, 74.14%, 73.54%, 76.74%, 77.94% and 74.84%. This indicated that the Thermotogales lived in thermophilic digestion though it could exist in the mesophilic digestion. Moreover, we had found a kind of thermophilic anaerobic microorganism with average relative abundance of only 1.30% which increased to 9.0% in the later stable operation at thermophilic digestion. It was noticed that species MBA08 appeared in thermophilic digestion and its relative abundance was peaking to 17.5% at sampling point of T1. With the reactor being unsteady state, it gradually decreased to 1.8% in the recovery stage of R2. Then, it increased to 2.8% in the later OLR improvement and stable operation at thermophilic digestion. On the contrary, some non-heat-resistant bacteria such as Bacteroidales and Anaerolineales gradually disappeared when the reactor was transferred into thermophilic digestion. In the whole operation of m-AnMBR and t-AnMBR, a kind of syntrophic acetogenic Clostridiales involved in the β-oxidation process of LCFAs, which played an important role in the degradation of the toxic substance LCFAs and maintaining the system stability [45]. In the m-AnMBR, the average relative abundance of Clostridiales at the sample point of M1 and M2 is 15.4% and decreased to 5.9% in the later stable operation at thermophilic digestion. This may be the main reason for the lower OLR and poorer stability that were obtained in t-AnMBR than that of m-AnMBR.
Furthermore, the archaea community structure in genus level was analyzed and results are shown in Figure 5b. In the m-AnMBR, the main archaea were affiliated to the hydrogenotrophic methanogen, Methanobacterium and the aceticlastic methanogen, Methanothrix and the ratio of the two archaea was basically 1:1, which showed that two paths of methanogenesis existed in the AnMBR. When the reactor was transferred into the thermophilic stage and was operating at a stable operation, the relative abundances of these two methanogens (sample point of T6) decreased by 16.4% and11.9%, respectively, showing that the Methanobacterium and Methanothrix could not tolerate high temperature environments. However, in the stage of directly increasing temperature (stage I, TI, T2 and T3) and recovery stage (stage II, R1 and R2), two new hydrogenotrophic methanogenic species (Methanomethylovorans and Methanoculleus) appeared and the relative abundances were 41.8% and 27.8%. In the later stable operation (sample point of T6) at thermophilic digestion, the total relative abundances of hydrogenotrophic methanogen was up to 86%, showing that the main pathway of methanogenesis was hydrophilic methanogenesis. Moreover, in the t-AnMBR, the toxic LCFA concentration accumulated much more than that of the m-AnMBR, which indicated that the Methanomethylovorans and Methanoculleus could tolerate higher biological toxicity than the Methanobacterium and Methanothrix. The above mention might illustrate the reason that the t-AnMBR can also operate successfully although its OLR and stability was lower than the m-AnMBR.

3.4. Membrane Filtration Performance

The membrane filtration performance of the m-AnMBR and t-AnMBR was monitored during the running process and results are shown in Figure 6a. For the m-AnMBR, the maximum flux was 18 L/m2 h and the average attenuation rate of the flux was 0.197 L/m2 h d. when the digester changed into stage I of directly increasing temperature from 39 to 55 °C, the membrane flux rapidly increased in a short time peaking to 21 L/m2 h. However, with the operation of the AnMBR, the maximum flux gradually decreased to 10.5 L/m2 h and the average flux attenuation rate increased to 0.3 L/m2 h d. This illustrated that the rise of temperature in a short period changed the rheological properties of sludge, which was beneficial for the membrane filtration. However, high temperature for a long time would affect the biochemical properties of the sludge [24]. Therefore, the sludge characteristics such as viscidity and particle size were also monitored for a long term and results are shown in Figure 6b,c. From Figure 6b; we found that the sludge viscidity, a parameter that characterized the rheological properties of sludge, changed from 3.6 mPas to 1.9 mPas when temperature decreased from 39 to 55 °C. The lower sludge viscidity decreased the sludge filtration resistance and thus improved the membrane flux. However, with the reactor operating under thermophilic digestion, it gradually elevated to 3.9 mPas and the membrane filtration resistance increased. Further monitoring the variation of the sludge particle size distribution, it was found that the significant difference existed between m-AnMBR and t-AnMBR. The floc size distribution of sludge for the m-AnMBR was concentrated in the area with high particle size and the average particle size was 8.93 μm. While that for the t-AnMBR was wide and mainly dominated by tiny floc, and the average particle size was 4.36 μm. By comparison, high temperature would be more likely to cause the fragmentation of sludge floc and reduce the floc particle size. Lin et al. [24] also reported that a high temperature could result in sludge flocculation being broken and make the floc particle finer. The fine floc particle was quick to block the membrane pore and form a dense layer with higher resistance, resulting in the increase of the membrane filtration resistance. The research of Meabe et al. [45] also reported the same phenomenon. Furthermore, the broken flocs affected the spatial proximity between microorganisms and the syntrophic metabolism of the LCFAs in the t-AnMBR. This was also an important reason for LCFA accumulation in the thermophilic digestion.

4. Conclusions

In this study, by comparing the performance and microbe community structure of m-AnMBR and t-AnMBR for treating lipids-rich kitchen waste slurry, it was found that the m-AnMBR presented better performance than that of the t-AnMBR, which was further demonstrated by the obtained higher OLR of 12 kg-COD/(m3·d), better COD removal efficiency over 98%, stronger stability with VFAs/alkalinity below 0.04, more preferable membrane filtration with higher flux of 18 L/(m2·h) and lower long chain fatty acids (LCFAs) of 550 mg/L under mesophilic digestion. Directly increasing the temperature to 55 °C based on the m-AnMBR resulted in the t-AnMBR collapse. By acclimating the microbe of the m-AnMBR via raising the temperature in a gradient style made the t-AnMBR operate successfully with OLR, COD removal efficiency and methane content of 7.5 kg-COD/(m3·d), 96% and 55%, respectively. The 16S rRNA gene sequence showed that the t-AnMBR presented lower microbial diversity than that of the m-AnMBR via Shannon index analysis. Furthermore, the PCA indicated that an obvious discrepancy in microorganisms existed between mesophilic and thermophilic digestion. The dominant methanogens in the t-AnMBR shifted from Methanobacterium and Methanothrix in the m-AnMBR to Methanomethylovorans and Methanoculleus, which indicated that the Methanomethylovorans and Methanoculleus are more tolerable to the high temperature and LCFAs and illustrated the reason that the t-AnMBR could also operate successfully although its OLR and stability were lower than those of the m-AnMBR.

Author Contributions

Conceptualization, X.X., and W.R.; Data curation, X.X.; Formal analysis, X.X.; Funding acquisition, W.R.; Investigation, X.X., and W.S.; Methodology, X.X., W.R., and W.S.; Project administration, X.X., and W.R.; Supervision, W.R.; Validation, X.X, and W.S.; Visualization, X.X.; Writing—original draft, X.X.; Writing—review & editing, W.S.

Funding

This research was funded by Jiangsu Key Laboratory of Anaerobic Biotechnology, grant number JKLAB201603; the National Natural Science Foundation of China, grant numbers 21276114 and 21506076.

Conflicts of Interest

The authors declare no conflict of interest.

References

  1. Yin, C.H.; Dong, X.; Lv, L.; Wang, Z.G.; Xu, Q.Q.; Liu, X.L.; Yan, H. Economic production of probiotics from kitchen waste. Food Sci. Biotechenol. 2013, 22, 59–63. [Google Scholar] [CrossRef]
  2. Li, Y.Y.; Sasaki, H.; Yamashita, K.; Saki, K.; Kamigochi, I. High-rate methane fermentation of lipid-rich food wastes by a high-solids co-digestion process. Water Sci. Technol. 2002, 45, 143–150. [Google Scholar] [CrossRef] [PubMed]
  3. Pereira, M.A.; Cavaleiro, A.J.; Mota, M.; Mota, M.; Alves, M.M. Accumulation of long chain fatty acids onto anaerobic sludge under steady state and shock loading conditions: Effect on acetogenic and methanogenic activity. Water Sci. Technol. 2003, 48, 33–40. [Google Scholar] [CrossRef] [PubMed]
  4. Hanaki, K.; Matsuo, T.; Nagase, M. Mechanism of inhibition caused by long chain fatty acids in anaerobic digestion process. Biotechnol. Bioeng. 1981, 23, 1590–1610. [Google Scholar] [CrossRef]
  5. Desbois, A.P.; Smith, V.J. Antibacterial free fatty acids: Activities, mechanisms of action and biotechnological potential. Appl. Microbiol. Biotechnol. 2010, 85, 1629–1642. [Google Scholar] [CrossRef]
  6. Zhang, Y.; Yan, L.; Chi, L.; Long, X.; Mei, Z.; Zhang, Z. Startup and operation of anaerobic EGSB reactor treating palm oil mill effluent. J. Environ. Sci. 2008, 20, 658–663. [Google Scholar] [CrossRef]
  7. Dereli, R.K.; Ersahin, M.E.; Ozgun, H.; Ozturk, I.; Jeison, D.; van der Zee, F.; van Lier, J.B. Potentials of anaerobic membrane bioreactors to overcome treatment limitations induced by industrial wastewaters. Bioresour. Technol. 2012, 122, 160–170. [Google Scholar] [CrossRef]
  8. Xiao, X.; Huang, Z.; Ruan, W.; Yan, L.; Miao, H.; Ren, H.; Zhao, M. Evaluation and characterization during the anaerobic digestion of high-strength kitchen waste slurry via a pilot-scale anaerobic membrane bioreactor. Bioresour. Technol. 2015, 193, 234–242. [Google Scholar] [CrossRef]
  9. Zábranská, J.; Stepova, J.; Wachtl, R.; Jenicek, P.; Dohanyos, M. The activity of anaerobic biomass in thermophilic and mesophilic digesters at differentloading rates. Water Sci. Technol. 2000, 32, 49–56. [Google Scholar] [CrossRef]
  10. Kim, M.; Ahn, Y.H.; Speece, R.E. Comparative process stability and efficiency of anaerobic digestion; mesophilic vs. Thermophilic. Water Res. 2002, 36, 4369–4385. [Google Scholar] [CrossRef]
  11. Khanal, S.K.; Surampalli, R.Y.; Zhang, T.C.; Lamsal, B.P.; Tyagi, R.D.; Kao, C.M. Bioenergy and biofuel from biowastes and biomass. Biomass Fuels 2010, 44. [Google Scholar] [CrossRef]
  12. Labatut, R.A.; Angenent, L.T.; Scott, N.R. Conventional mesophilic vs. thermophilic anaerobic digestion: A trade-off between performance and stability. Water Res. 2014, 53, 249–258. [Google Scholar] [CrossRef] [PubMed]
  13. Bayr, S.; Rantanen, M.; Kaparaju, P.; Rintala, J. Mesophilic and thermophilic anaerobic co-digestion of rendering plant and slaughterhouse wastes. Bioresour. Technol. 2012, 104, 28–36. [Google Scholar] [CrossRef] [PubMed]
  14. Broughton, M.J. Anaerobic batch digestion of sheep tallow. Water Res. 1998, 32, 1423–1428. [Google Scholar] [CrossRef]
  15. Xiao, X.; Shi, W.; Huang, Z.; Ruan, W.; Miao, H.; Ren, H.; Zhao, M. Process stability and microbial response of anaerobic membrane bioreactor treating high-strength kitchen waste slurry under different organic loading rates. Int. Biodeterior. Biodegrad. 2017, 121, 35–43. [Google Scholar] [CrossRef]
  16. APHA; AWWA; WEF. Standard Methods for the Examination of Water and Wastewater, 21st ed.; American Public Health Association: Washington, DC, USA, 2005. [Google Scholar]
  17. Huang, Z.; Yu, X.; Miao, H.; Ren, H.; Zhao, M.; Ruan, W. Enzymatic dynamics of microbial acid tolerance response (ATR) during the enhanced biohydrogen production process via anaerobic digestion. Int. J. Hydrog. Energy 2012, 37, 10655–10662. [Google Scholar] [CrossRef]
  18. Yang, L.; Huang, Y.; Zhao, M.; Huang, Z.; Miao, H.; Xu, Z.; Ruan, W. Enhancing biogas generation performance from food wastes by high-solids thermophilic anaerobic digestion: Effect of pH adjustment. Int. Biodeterior. Biodegrad. 2015, 105, 153–159. [Google Scholar] [CrossRef]
  19. Thiex, N.J.; Anderson, S.; Gildemeister, B. Crude fat, diethyl ether extraction, in feed, cereal grain, and forage (Randall/Soxtec/submersion method): Collaborative study. J. AOAC Int. 2003, 86, 888–898. [Google Scholar]
  20. Neves, L.; Pereira, M.A.; Mota, M.; Alves, M.M. Detection and quantification of long chain fatty acids in liquid and solid samples and its relevance to understand anaerobic digestion of lipids. Bioresour. Technol. 2009, 100, 91–96. [Google Scholar] [CrossRef]
  21. Fadrosh, D.W.; Ma, B.; Gajer, P.; Sengamalay, N.; Ott, S.; Brotman, R.M.; Ravel, J. An improved dual-indexing approach for multiplexed 16S rRNA gene sequencing on the Illumina MiSeq platform. Microbiome 2014, 2, 2049–2618. [Google Scholar] [CrossRef]
  22. Dixon, P. VEGAN, a package of R functions for community ecology. J. Veg. Sci. 2003, 14, 927–930. [Google Scholar] [CrossRef]
  23. Fang, Z. Research Advances in the Inhibition of Long Chain Fatty Acid to Methanogenic Activity in Anaerobic Digestion System. J. Anhui Agric. Sci. 2012, 13, 2389–2393. [Google Scholar]
  24. Lin, H.J.; Xie, K.; Mahendran, B.; Bagley, D.M.; Leung, K.T.; Liss, S.N.; Liao, B.Q. Sludge properties and their effects on membrane fouling in submerged anaerobic membrane bioreactors (SAnMBRs). Water Res. 2009, 43, 3827–3837. [Google Scholar] [CrossRef] [PubMed]
  25. Callaghan, F.J.; Wase, D.A.J.; Thayanithy, K.; Forster, C.F. Continuous co-digestion of cattle slurry with fruit and vegetable wastes and chicken manure. Biomass Bioenergy 2002, 27, 71–77. [Google Scholar] [CrossRef]
  26. Palatsi, J.; Laureni, M.; Andrés, M.V.; Flotats, X.; Nielsen, H.B.; Angelidaki, I. Strategies for recovering inhibition caused by long-chain fatty acids on anaerobic thermophilic biogas reactors. Bioresour. Technol. 2009, 100, 4588–4596. [Google Scholar] [CrossRef]
  27. Silvestre, G.; Illa, J.; Fernández, B.; Bonmatí, A. Thermophilic anaerobic co-digestion of sewage sludge with grease waste: Effect of long chain fatty acids in the methane yield and its dewatering properties. Appl. Energy 2014, 117, 87–94. [Google Scholar] [CrossRef]
  28. Angelidaki, I.; Sanders, W. Assessment of the anaerobic biodegradability of macropollutants. Rev. Environ. Sci. Bio/Technol. 2004, 3, 117–129. [Google Scholar] [CrossRef]
  29. Kim, S.; Han, S.; Shin, H. Kinetics of LCFA Inhibition on Acetoclastic Methanogenesis, Propionate Degradation and β-Oxidation. J. Environ. Sci. Health Part A 2004, 39, 1025. [Google Scholar] [CrossRef]
  30. Neves, L.; Oliveira, R.; Alves, M.M. Fate of LCFA in the co-digestion of cow manure, food waste and discontinuous addition of oil. Water Res. 2009, 43, 5142–5150. [Google Scholar] [CrossRef]
  31. Speece, R.E.; Boonyakitsombut, S.; Kim, M.; Azbar, N.; Ursillo, P. Overview of anaerobic treatment: Thermophilic and propionate implications. Water Sci. Technol. 2006, 78, 460–473. [Google Scholar]
  32. Wilson, C.A.; Murthy, S.M.; Fang, Y. The effect of temperature on the performance and stability of thermophilic anaerobic digestion. Water Sci. Technol. 2008, 57, 297. [Google Scholar] [CrossRef] [PubMed]
  33. Kabouris, J.C.; Tezel, U.; Pavlostathis, S.G.; Engelmann, M.; Dulaney, J.; Gillette, R.A. Methane recovery from the anaerobic codigestion of municipal sludge and FOG. Bioresour. Technol. 2009, 100, 3701–3705. [Google Scholar] [CrossRef] [PubMed]
  34. Novak, J.T.; Kraus, D.L. Degradation of long chain fatty acids by activated sludge. Water Res. 1973, 7, 843–851. [Google Scholar] [CrossRef]
  35. Pereira, M.A.; Pires, O.C.; Mota, M.; Alves, M.M. Anaerobic biodegradation of oleic and palmitic acids: Evidence of mass transfer limitations caused by long chain fatty acid accumulation onto the anaerobic sludge. Biotechnol. Bioeng. 2005, 92, 15–23. [Google Scholar] [CrossRef] [Green Version]
  36. Gao, S.M.; Zhao, M.X.; Chen, Y.; Yu, M.J.; Ruan, W.Q. Tolerance response to in situ ammonia stress in a pilot-scale anaerobic digestion reactor for alleviating ammonia inhibition. Bioresour. Technol. 2015, 198, 372–379. [Google Scholar] [CrossRef]
  37. Gannoun, H.; Khelifi, E.; Omri, I.; Jabari, L.; Fardeau, M.L.; Bouallagui, H.; Godon, J.J.; Hamdia, M. Microbial monitoring by molecular tools of an upflow anaerobic filter treating abattoir wastewaters. Bioresour. Technol. 2013, 142, 269–277. [Google Scholar] [CrossRef]
  38. Deng, Y.; Huang, Z.; Zhao, M.; Ruan, W.; Ren, H. Effects of co-inoculating rice straw with ruminal microbiota and anaerobic sludge: Digestion performance and spatial distribution of microbial communities. Appl. Environ. Microbiol. 2017, 101, 5937–5948. [Google Scholar] [CrossRef]
  39. Regueiro, L.; Veiga, P.; Figueroa, M.; Alonso-Gutierrez, J.; Stams, A.J.M.; Lema, J.M.; Carballa, M. Relationship between microbial activity and microbial community structure in six full-scale anaerobic digesters. Microbiol. Res. 2012, 167, 581–589. [Google Scholar] [CrossRef]
  40. Sundberg, C.; Al-Soud, W.A.; Larsson, M.; Alm, E.; Yekta, S.S.; Svensson, B.H.; Sørensen, S.J.; Karlsson, A. 454 pyrosequencing analyses of bacterial and archaeal richness in 21 full-scale biogas digesters. FEMS Microbiol. Ecol. 2013, 85, 612–626. [Google Scholar] [CrossRef] [Green Version]
  41. Town, J.R.; Links, M.G.; Fonstad, T.A.; Dumonceaux, T.J. Molecular characterization of anaerobic digester microbial communities identifies microorganisms that correlate to reactor performance. Bioresour. Technol. 2014, 151, 249–257. [Google Scholar] [CrossRef]
  42. Wang, T.X.; Ma, X.Y.; Wang, M.M.; Chu, H.J.; Zuo, J.E.; Yang, Y.F. A comparative study of microbial community compositions in thermophilic and mesophilic sludge anaerobic digestion systems. Microbiol. China 2016, 43, 26–35. [Google Scholar]
  43. Huber, R.; Hannig, M. Thermotogales. In The Prokaryotes; Dworkin, M., Falkow, S., Rosenberg, E., Schleifer, K.H., Stackebrandt, E., Eds.; Springer: New York, NY, USA, 2006; pp. 899–922. [Google Scholar]
  44. Nesb, C.L.; Kumaraswamy, R.; Dlutek, M.; Doolittle, W.F.; Foght, J. Searching for mesophilic Thermotogales bacteria: “mesotogas” in the wild. Appl. Environ. Microbiol. 2010, 76, 4896–4900. [Google Scholar] [CrossRef] [PubMed] [Green Version]
  45. Meabe, E.; Déléris, S.; Soroa, S.; Sancho, L. Performance of anaerobic membrane bioreactor for sewage sludge treatment: Mesophilic and thermophilic processes. J. Membr. Sci. 2013, 446, 26–33. [Google Scholar] [CrossRef]
Figure 1. Schematic diagram of the pilot-scale Anaerobic Membrane Reactor (AnMBR).
Processes 07 00879 g001
Figure 2. The comparison of digestion performance and stability between the m-AnMBR and t-AnMBR: (a) OLR and temperature; (b) biogas production and methane content; (c) COD removal efficiency; (d) pH, VFAs, alkalinity and VFAs/Alkalinity.
Processes 07 00879 g002
Figure 3. The comparison of LCFA concentration between the m-AnMBR and t-AnMBR.
Processes 07 00879 g003
Figure 4. The PCA of bacteria (a) and archaea (b) in the m-AnMBR and t-AnMBR.
Processes 07 00879 g004
Figure 5. Relative abundance of the microbe in the m-AnMBR and t-AnMBR reactor: (a) bacteria in orders level; (b) archaea in genus level.
Processes 07 00879 g005
Figure 6. The comparison of membrane filtration and sludge characteristics between the m-AnMBR and t-AnMBR: (a) the flux; (b) the sludge viscidity; (c) the particle size distribution of the sludge.
Processes 07 00879 g006
Table 1. Kitchen waste slurry characterization.
ParametersUnitValue
Total Chemical Oxygen Demand(g/L)90.2 ± 6.9
Total Suspended Solids(g/L)18.5 ± 3.2
Total Volatile Suspended Solids(g/L)16.2 ± 2.6
lipids 5.95 ± 0.28
pH---3.88 ± 0.32
Ammonia Nitrogen(mg/L)325 ± 45
Total Kjeldahl Nitrogen(mg/L)1848 ± 205
Total Phosphorus (mg/L)83.5 ± 5.4
Conductivity(ms/cm)10.64 ± 2.58
Table 2. LCFAs composition at the stable operation stage of the m-AnMBR and t-AnMBR (mean ± standard deviation).
LCFAm-AnMBRt-AnMBR
mg/Lmg/L
Lauric (C12:0)12.5 ± 0.517.7 ± 0.3
Myristic (C14:0)19.6 ± 1.238.3 ± 3.4
Palmitic (C16:0)179.4 ± 10.6417.5 ± 18.8
Palmitoleic (C16:1)9.7 ± 0.928.4 ± 2.5
Stearic (C18:0)56.5 ± 5.3162.3 ± 15.8
Oleic (C18:1)163.2 ± 18.1535.7 ± 23.6
Linoleic (C18:2)38.6 ± 1.398.6 ± 5.3
Linolenic (C18:3)11.7 ± 0.724.6 ± 2.7
Arachidic (C20:0)8.3 ± 0.427.2 ± 1.9
Arachidonic (C20:1)15.3 ± 1.132.9 ± 2.2
Behenic (C22:0)10.6 ± 0.928.4 ± 1.8
Docosahexaenoic (C22:5)9.4 ± 0.516.6 ± 0.8
Others15.2 ± 1.872.4 ± 6.8
Total5501500
Table 3. The Shannon index variation of the bacteria and archaea in the m-AnMBR and t-AnMBR.
Sampling PointShannon Sampling PointShannon
BacteriaM113.13ArchaeaM18.73
M213.65M28.31
T112.52T17.28
T211.93T26.96
T310.62T35.57
R110.64R15.68
R210.87R26.28
T411.32T46.68
T511.87T56.93
T612. 02T67.20

