Effect of Temperature and Microwave Power Levels on Microwave Drying Kinetics of Zhaotong Lignite
by
 ,
,
Pengfei Zhao
1,2, 
Chenhui Liu
1,2,*,
Wenwen Qu
3,
Zhixiu He
1,2,
Jiyun Gao
1,2,
Lijuan Jia
1,2,
Siping Ji
1,2 and
Roger Ruan
4 1
Key Laboratory of Resource Clean Conversion in Ethnic Regions, Education Department of Yunnan Province, School of Chemistry and Environment, Yunnan Minzu University, Kunming 650500, China
2
Key Laboratory of Comprehensive Utilization of Mineral Resources in Ethnic Regions, Yunnan Minzu University, Kunming 650500, China
3
Faculty of Science, Kunming University of Science and Technology, Kunming 650500, China
4
Center for Biorefining, Bioproducts and Biosystems Engineering Department, University of Minnesota, Saint Paul, MN 55101, USA
*
Author to whom correspondence should be addressed.
Processes 2019, 7(2), 74; https://doi.org/10.3390/pr7020074
Submission received: 28 November 2018
/
Revised: 14 January 2019
/
Accepted: 25 January 2019
/
Published: 2 February 2019
(This article belongs to the Special Issue Microwave Applications in Chemical Engineering)
Abstract
:Microwave drying is a promising and effective way to drying and upgrading lignite. The influence of temperature (100–140 °C) and microwave power levels (500–800 W) on thin-layer drying characteristics of Zhaotong lignite under microwave irradiation were investigated. Fourteen thin-layer drying models were used to analyze the microwave drying process while six thin-layer drying models were used to analyze the hot-air drying process. The microwave drying processes at all temperature (100–140 °C) or low microwave power levels (500–700 W) exhibited four periods: a warm-up period, a short constant period, the first and second falling rate period, while one falling rate period was found during hot-air drying. The effective diffusion coefficient of lignite were calculated and it increases with increasing temperature and microwave power levels. During microwave drying, the two-term exponential model is the most suitable model for all applied conditions, while the Modified Page model is the most suitable model to describe the hot-air drying experiments. The apparent activation energy were determined from Arrhenius equation and the values for the first and second falling rate period are 3.349 and 20.808 kJ·mol−1 at different temperatures, while they are 13.455 and 19.580 W·g−1 at different microwave power levels. This implies the apparent activation energy is higher during the second falling rate period, which suggest that the dewatering of absorbed water is more difficult than capillary water. The value of apparent activation energy in hot-air drying is between the first and second falling rate period of microwave drying. Results indicate that microwave drying is more suitable to dewatering free water and capillary water of lignite.
1. Introduction
Presently, with the consumption of energy demands increasing, the storage of high-rank coal has decreased quickly. Lignite is usually characterized with high water content [1], which results in low heat value, and higher fuel consumption and transportation cost [2]. However, lignite accounts for approximately 45% of the world’s coal reserves, due to the advantages of lower mining cost, high reactivity, and low pollution impurities [3], it will be used more widely in the future. Thus, moisture removal is the first essential step to improve the quality of lignite by drying technologies in downstream utilization, such as pyrolysis, gasification, liquefaction, and combustion.
Various lignite dehydration technologies have been developed and researched by evaporation or non-evaporation methods [4]. Solar drying [5], steam-fluidized bed drying [6], and flue gas drum drying [7] are based on evaporation drying, while mechanical thermal expression [8,9] and hydrothermal dewatering [10,11] are based on non-evaporation drying. In traditional drying technologies, heat is transferred from the surface to the interior of the material by convection and conduction while the moisture transferred from the inside of the material to the surface. Most of thermal drying process are operated with combustion gas or superheated water vapor and the configuration of the drying reactor are complicated, which induces high costs of construction. In addition, traditional methods will lead to heating inhomogeneity, which is not beneficial for lignite upgrade. Among these dehydration technologies, microwave drying of low-rank coal is a very promising method due to its unique heating features.
Microwaves are electromagnetic waves with frequencies that range from 300 MHz to 300 GHz [12,13]. Microwave heating is a type of dielectric heating in which microwave energy is converted directly within material into thermal energy in the form of molecular friction or dielectric loss. It offers several advantages, such as non-contact heating, volumetric heating, selective heating, rapid heating. In microwave field, materials can be divided into insulators, conductors, and absorbers. Dipolar molecules in lignite, such as water, have a high dielectric constant and loss factor compared with dry lignite, can absorb microwave energy quickly and turn into thermal energy while the dry lignite particle maintain a low microwave absorbability [14]. Therefore, heat is transferred from the core to the surface of the lignite in microwave heating and the direction is identical with the moisture migration [15]. Consequently, the lignite can be dried quickly by microwave.
Microwave drying methods can be performed at lower temperatures, which can avoid surface overheating due to the removal of water [16]. Second, the moisture removal rate can be greatly promoted, as the mass transfer direction is identical with the thermal energy, which is generated by microwave energy. Third, moisture in the lignite can be heated through direct interaction between microwaves and moisture and a more uniform temperature distribution can be achieved due to volumetric heating [17]. Owing to these distinctive characteristics, numerous heating technologies based on microwaves have been developed to apply in various fields, such as the food processing industry [18], biological industry [15], agriculture industry [19], and mineral processing [20]. Therefore, it should be an effective drying method to upgrade lignite. In addition, microwave heating technology has been widely used in coal processing at lab and industrial scales. For example, in the pretreatment of lignite, microwaves can be used to dry lignite and improve its grinding characteristics, which are effected by the particle size and initial moisture of materials [21,22]. Microwave heating technology also has great potential for the pyrolysis and the production of coke from low-rank coal, which is inappropriate for traditional cooking plants [23,24].
Studies on drying kinetics and mathematical modeling of lignite during the drying process are essential for further understanding the drying mechanism. Researchers have conducted a great deal of work on temperature, particle size, thickness, and power levels of lignite. Zhu et al. [25] investigated the effect of coal particle size and microwave power level on the drying characteristics of lignite and derived that the apparent activation energy of the sample is 77.049 W/g. Li et al. [26] observed the removal of different form water in lignite and obtained that the effective diffusion coefficient are ranging from 0.371 × 10⁻⁸ to 1.672 × 10⁻⁸ m2·min−1 of MWC (raw lignite with molecular water) and from 0.509 × 10⁻⁸ to 3.317 × 10⁻⁸ m2·min−1 of RC (raw lignite with total water). The apparent activation energy of MWC and RC is 28.590 kJ·mol−1 and 24.250 kJ·mol−1, respectively. Fu et al. [12] evaluated the influence of additives on apparent activation energy and energy efficiency of lignite, which were increased with the addition of Na2SO4, Na2CO3 and coal fly ash of lignite. Fu et al. [27] also examined the microwave energy and temperature distribution of compressed lignite spheres and derived that the activation energy for particle sizes of 10 mm and 20 mm are 134.940 and 41.930 W·g−1, respectively.
Although some research has been accomplished on the drying behavior of lignite under different microwave power and temperatures. However, kinetics analysis in different microwave heating temperatures based on two falling rate periods and different microwave output levels are barely reported, especially in different microwave heating temperatures. Researchers have carried out a great deal of work on kinetics of temperature effects using conventional methods such as fluid bed dryer, hydrothermal dewatering and steam-fluidized bed dryer while the research on microwave drying lignite is still less. The present work was undertaken to explore the thin-layer drying kinetics and mathematical modeling of Zhaotong lignite at different temperatures and power levels. The effective diffusion coefficient and activation energy of lignite during the drying process were determined. The observation of this work can provide directions and support for deep processing and further utilization of lignite.
2. Experimental
2.1. Sample Preparation
This study used lignite from the Zhaotong region (Zhaotong, Yunnan Province, China), which is an important producer of lignite in China.
2.2. Experimental Apparatus and Procedure
A schematic of the experimental system is shown in Figure 1. The experiment was performed in a multimode microwave high-temp material treatment system [28], self-made by the Kunming University of Science and Technology (Kunming, China) (frequency: 2.45 GHz, maximum power output: 3000 W) and it can be operated at different power outputs. The microwave source consists of three Panasonic magnetrons (2M167B-M11, Panasonic Appliances Magnetron, Shanghai, China). The workstation was equipped with a fiber optical sensor (FOT-L-SD, Apollo Electronics, Shenzhen, China) with an accuracy of 1 °C to monitor the temperature information of the sample, and the temperature information was adjusted and displayed on the control panel through a PID control system (Kunming University of Science and Technology, Kunming, China) located on the microwave workstation. The workstation was modified by adding an electronic balance with an accuracy of 0.01 g (JJ-500, G&G Measurement Plant, Changshu, China), which was connected to a personal computer for continuously recording the weight change by a data acquisition system. The quartz crucible with a height of 60 mm and diameter of 40 mm was suspended from the balance by a quartz chain to contain the coal sample.
Before the microwave drying experiment, a 50 g sample was first put in the quartz crucible, then, the sample and the quartz crucible both placed in the center of the sample cavity and suspended from the balance by a quartz chain. Then, the microwave drying experiment started at different conditions through adjusting the buttons on the microwave workstation. Meanwhile, the data acquisition system recorded the mass information at 1 min intervals and the temperature measurements were carried out through a fiber optical sensor, which was very thin and it did not affect the measurement of mass change. Each experiment was finished when the sample mass no longer changed.
When considering the effect of temperature, the microwave drying experiment was carried out under 100 °C, 120 °C, and 140 °C. To ensure temperature stability, the sample was periodically irradiated at a constant applied power (500 W). When considering the effect of microwave power levels, applied microwave power was 500 W, 600 W, 700 W, and 800 W, respectively, and the drying experiment was non-isothermal in these conditions. The drying experiment were repeated three times with similar results and the values of the relative deviations for mass and temperature were determined as ±1% and ±3%, respectively. Therefore, the average values were used for further study.
The hot-air drying experiments were carried out in an electric drying oven with forced convection (DHG-9075A, YIHENG, Shanghai, China). The equipment was driven by a 220 V voltage at 50 GHz. The temperature tested ranges of the cavity from 0–300 °C with an accuracy of 0.1 °C. The dimensions of hot-air drying chamber were 450 mm × 400 mm × 450 mm. In each experiment, a 50 g sample was put in the quartz crucible, the sample and the quartz crucible was measured by a digital balance with an accuracy of 0.01 g (JJ-500, G&G Measurement Plant, Changshu, China). The sample’s weight was measured every 10 min during hot air drying. When considering the effect of temperature, the hot-air drying experiments were carried out under 100 °C, 120 °C, and 140 °C. Each experiment was finished when the sample mass did not change.
2.3. Mathematical Modeling
To find the suitable fit model, the moisture ratio data curves obtained from drying experiments at different conditions were fitted by different mathematical models, which are shown in Table 1.
In all experiments, the moisture value (M), drying rate (DR), and moisture ratio (MR) of coal samples were calculated by using the following equations:
where M is the moisture (g/(g db)), Wt (g) is the mass of sample at t, Wd,s is the dry coal mass (g), DR is the drying rate (g/(g db min)), Mt and Mt + dt are the moisture content at t and t + dt (g/(g db)), respectively, MR is the moisture ratio, M0 is the initial water content (g/(g db)), and Me is the moisture content at the end of the drying experiment (g/(g db)), which can be assumed to be zero for microwave drying. Therefore, the mathematical expression of MR was written as Equation (4):
3. Results and Discussion
3.1. Proximate Analysis of Raw Lignite
This study used lignite from the Zhaotong region and the proximate analysis of raw lignite is shown in Table 2.
3.2. The Effect of Temperature during Microwave Drying
The changes in sample mass, moisture ratio, drying rate versus time and drying rate versus moisture ratio of the Zhaotong lignite are shown in Figure 2a–d.
From Figure 2a,b, temperature levels have a significant effect on mass change and drying time. The sample mass decrease rapidly within 300 s and drying time decreases with the increase in temperature levels. As shown from Figure 2b, the drying time for the raw lignite is 1260 s at 100 °C, while it was 900 s and 660 s as the temperature rose to 120 °C and 140 °C.The drying time decreases by about 29% and 48%, respectively. The boiling point of water is 100 °C, and moisture migration of lignite is easier as the temperature increases from 100 °C to 120 °C and 140 °C. Therefore, a higher temperature can lead to the decline of the required microwave drying time.
A turning point, also called the maximum drying rate point, is the demarcation point of the increasing period and the falling rate period. At the turning point, with the migration of a large amount of bulk water from the raw lignite, there is no moisture at the surface due to the insufficient supply of bulk water from the capillaries [47]. As shown in Figure 2c, the drying rate of all samples reach the maximum rate point in about 100 s, which can be attributed to the fact that the thermal energy generated by microwave energy increase with increasing temperature. In addition, the drying rate curves present several different stages between 100–140 °C: a very brief warm-up period (A), a short constant rate period (B), and two obviously different falling rate periods (refer to the first falling rate (C) and the second falling rate (D)).
During the warm-up period, mostly bulk water evaporates, resulting in massive mass loss and, therefore, the drying rate increases significantly. This is due to the high dielectric constant and loss factor of the water [26]. The drying rate is a short constant in the (B) period, which could be attributed to the sufficient supply of bulk water and the balance between the water evaporation energy and the thermal energy generated by microwave energy [12]. However, the constant rate period was detected at all different temperature drying experiment which can be ascribe to the temperature of the sample. Although the maximum temperature studied in this paper is 140 °C, it is still lower than the temperature at different power levels in other research. Zhu et al. [25] revealed that the final temperature of lignite could reach 207 °C when 700 W was applied to the sample. Due to a great deal of bulk water being removed during the warm-up period or the constant rate period, the drying rate became smaller, and that is the falling rate period. In addition, two obviously different periods can be detected in the falling rate period refer to the first falling rate (C) and the second falling rate (D).
As mentioned above, a great deal of bulk water has been removed in the warm-up period or the constant rate period. Therefore, the mass loss is mainly ascribed to the removal of capillary water in the first falling rate period which has lower dielectric constant than the bulk water. However, the water molecule migration force are increase due to the capillary water tightly bound to the solid particles. Therefore the drying rate tends to decrease in the first falling rate period.
Compared to the first falling rate period, the absorbed water is being removed in the second falling rate period, and the drying rate decreases slightly, which can be attributed to the amount of the absorbed water being relatively less and having a lower dielectric loss factor than the capillary water. In addition, the desorption of absorbed water, which is in the state of multilayer and monolayer adsorption, needs to break down the stronger hydrogen bonds [26], therefore, a further reduction of the drying rate can be detected in the second falling rate period.
3.3. The Effect of Microwave Power Levels during Microwave Drying
Temperature variations, drying curves, and drying rate curves about microwave output power levels were shown in Figure 3a–d. The drying time decreases significantly and the drying rate increases sharply as the microwave power level increases from 500 W to 600 W, 700 W, and 800 W, which can be attributed to the fact that the electromagnetic intensity increases simultaneously with the increase in drying power level. A great deal of heat energy is generated in a rapidly alternating electric field.
As can be observed in Figure 3b, the microwave drying time of raw lignite was 1200 s at 500 W, whereas it was only 900 s, 660 s, and 540 s with the microwave power level ascending to 600 W, 700 W, and 800 W. Results show that microwave drying can be an effective and potential ways to upgrade raw lignite for its further utilization. As shown in Figure 3c, the drying rate increases sharply within 100 s and reaches its maximum value rapidly. The maximum drying rate of all samples increased from 0.004 to 0.007 g/g·s−1 with increasing power levels. In this process, two periods are detected in the microwave drying experiment, which is referred to a warm-up period within 60 s and a constant rate period between 60 s and 120 s. The mass change in these two periods was mainly ascribed to the evaporation of bulk water, which mainly exists in the surface of the sample. When the applied microwave power level is 800 W, an obviously constant rate period appears, which is similar to the former researchers’ experimental results. Song et al. [48] found that the constant rate period were discovered under 700 W, while it disappeared at 800 W. This can be explained by a great deal of heat energy generation and higher pressure difference at microwave power levels beyond 700 W, leading to the increasing drying rate and the final temperature of lignite reaching 181 °C, as can be observed in Figure 3a.
Beyond the turning point, two falling rate periods were observed, which are similar with the drying rate curves regarding temperature. However, according to the drying curves in Figure 3d, the changes of drying rate are more obvious between the two falling rate periods compared to the experiments on temperature, which can be related to the larger amount of thermal energy converted from microwaves. During the first falling rate period, the drying rate decreases rapidly. In addition, due to the capillary water migration by molecular diffusion, the resistance increase sharply with the decrease of moisture content. As seen from Figure 3d, the drying rate decrease further in the second falling rate period. During this period, the mass loss mainly attributed to the remove of absorbed water. Due to the existence of hydrophilic oxygen-containing groups in the lignite, the evaporation resistance of moisture is greater than capillary water. Therefore, the drying rate decreases further in this period.
3.4. The Effect of Temperature during Hot-Air Drying
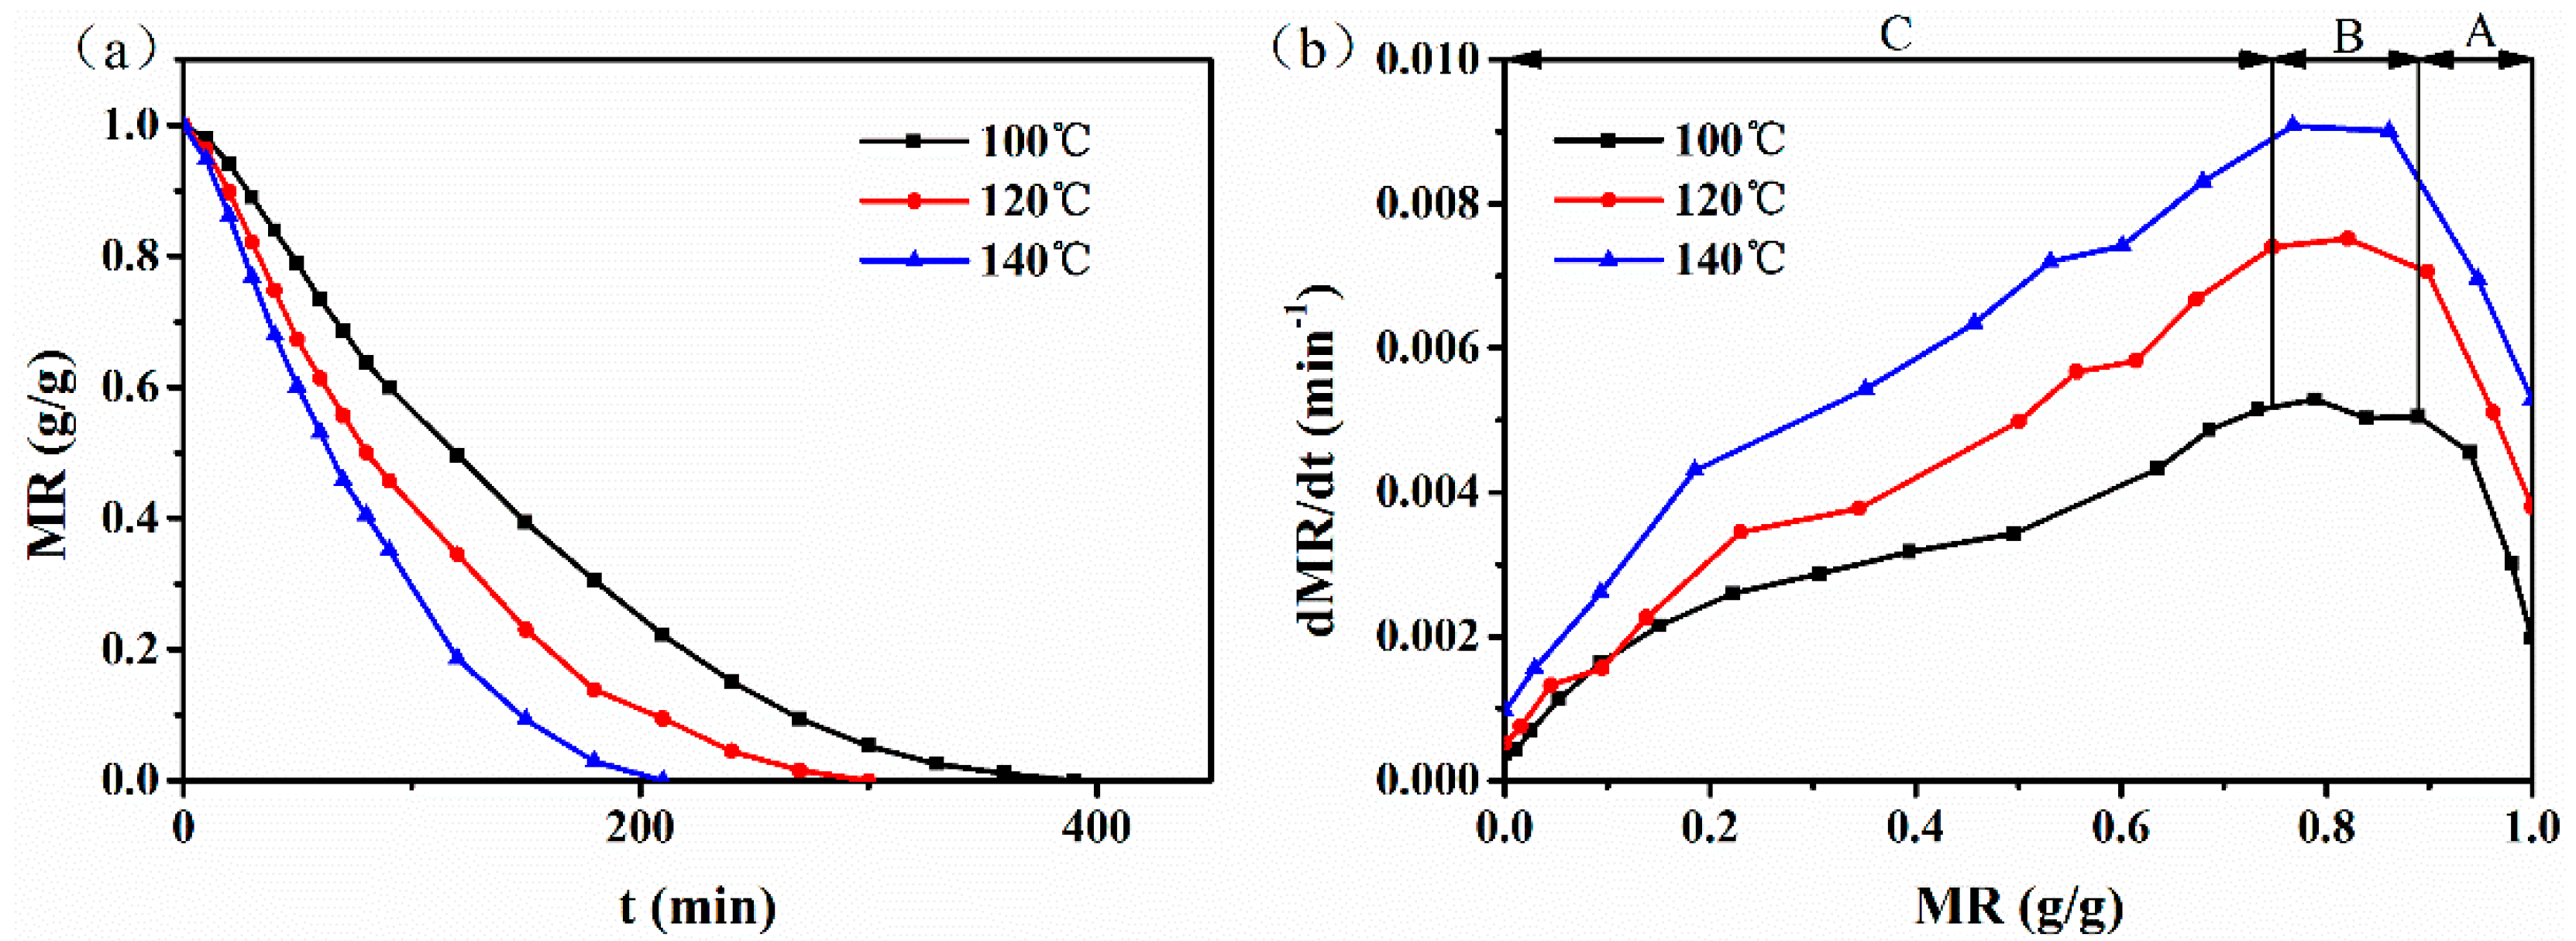
Drying curves and drying rate curves of lignite at different temperature by hot-air drying method was shown in Figure 4a,b. As observed in Figure 4a, the drying time of lignite decrease with increasing temperature due to the increasing drying force. For example, when the drying temperature increases from 100 °C to 120 °C or 140 °C, drying time decreases from 380 min to 300 min and 210 min, decreasing by 27% and 45%, respectively. However, compared with microwave drying, under the same drying conditions, the drying time only needs 1260 s, 900 s and 660 s from 100 °C to 120 °C and 140 °C, respectively.
As seen in Figure 4b, the variation of drying rate of lignite at different temperatures can be roughly divided into three stages: a warm up period (A), a short constant rate period (B), and a falling rate period (C). In the warm up period, the drying rate increase monotonously and reach its maximum in about 40 min at 100 °C and 120 °C, while it is about 30 min at 140 °C. Beyond the maximum drying rate point, the drying rate remains constant for a short time, about 10–30 min. The constant rate period sustain longer at low temperature conditions. The mass change in these two periods was mainly ascribed to the evaporation of bulk water, which mainly exists in the surface of the sample. Compared with microwave drying, two obviously different falling rate periods were not found, only one falling rate period was observed after the constant rate period, which could be ascribed to the drying characteristics of hot-air drying. During the hot-air drying, the heat energy transformed from the surface to the interior of lignite, whereas moisture migrates in the opposite direction. This means that the moisture does not migrate smoothly. The comparisons of the drying characteristics of lignite between microwave drying and hot-air drying indicate that microwave drying has great advantages in drying time and rate.
3.5. Kinetics Modeling of Microwave Drying
In order to obtain drying kinetics information, 14 thin-layer drying models in Table 1 were fitted for all drying experiment. In addition, the coefficient of determination (R2), which was one of the main parameter to evaluate the most suitable model, the reduced chi-square (χ2), the residual sum of square (RSS) and the F-value were used to find the best model for experimental data [49]. The better goodness of fit were determined by higher values of R2 and F-value while lower values of χ2 and RSS.
The fitted results for all drying conditions are presented in Table 3 and Table 4. Considering the effect of temperature and power level, Modified Page, modified Page equationⅡ, and two-term exponential models show good results for all experimental data. The mean values of R2, RSS, χ2, and F-value for the Modified Page model were 0.991, 0.012, 1.011 × 10⁻³, and 1684.663, while the results are 0.991, 0.023, 1.032 × 10⁻³, and 797.817 for the modified Page equationⅡ and 0.993, 0.011, 8.231 × 10⁻⁴, and 1837.998 for the two-term exponential model. Due to the higher values of R2 and F-value while lower values of χ2 and RSS, the two-term exponential is the best model for all experimental data. Therefore, the two-term exponential model is the most suitable model to describe the microwave drying experiments.
3.6. Kinetics Modeling of Hot-Air Drying
In order to obtain drying kinetic information in the falling rate period during the hot-air drying, the page model, Modified Page model, Newton model, logarithmic model, Henderson and Pabis, and Wang and Singh models were used to fit the experiment results. The fitted results for all drying conditions are presented in Table 5. Similar to the analytical methods used previously, the better goodness of fit was determined by higher values of R2 and F-value while having lower values of χ2 and RSS.
The fitted results for all drying conditions are presented in Table 5. Considering the effect of temperature, the Page model, Modified Page model, and Wang and Singh model show good results for all experimental data. The mean values of R2, RSS, χ2, and F-value for the modified Page model are 0.998, 0.004, 0.002, and 11,697.960, while being 0.998, 0.004, 2.62 × 10⁻³, and 11,688.314 for the Page model and 0.998, 0.004, 2.820 × 10⁻⁴, 10,634.21 for Wang and Singh model. Due to the higher values of R2 and F-value while lower values of χ2 and RSS, the Modified Page model is the best model for all experimental data. Therefore, the Modified Page model is the most suitable model to describe the hot-air drying experiments.
3.7. Effective Diffusion Coefficient and Activation Energy
To further analyze the drying behavior of lignite in whole falling rate period, moisture of the lignite was removed from the internal to the external by diffusion, an effective diffusion coefficient could be obtained by Fick’s second law under specific conditions [50]. As the diffusion coefficient demonstrate the mass transfer rate during microwave drying experiment, it could be used to indicate how well moisture was removed per unit time [22]. Based on the assumptions of moisture transport via diffusion, negligible shrinkage, constant coefficient and temperature, the following analytically derived equation could be used to calculate the diffusion coefficient:
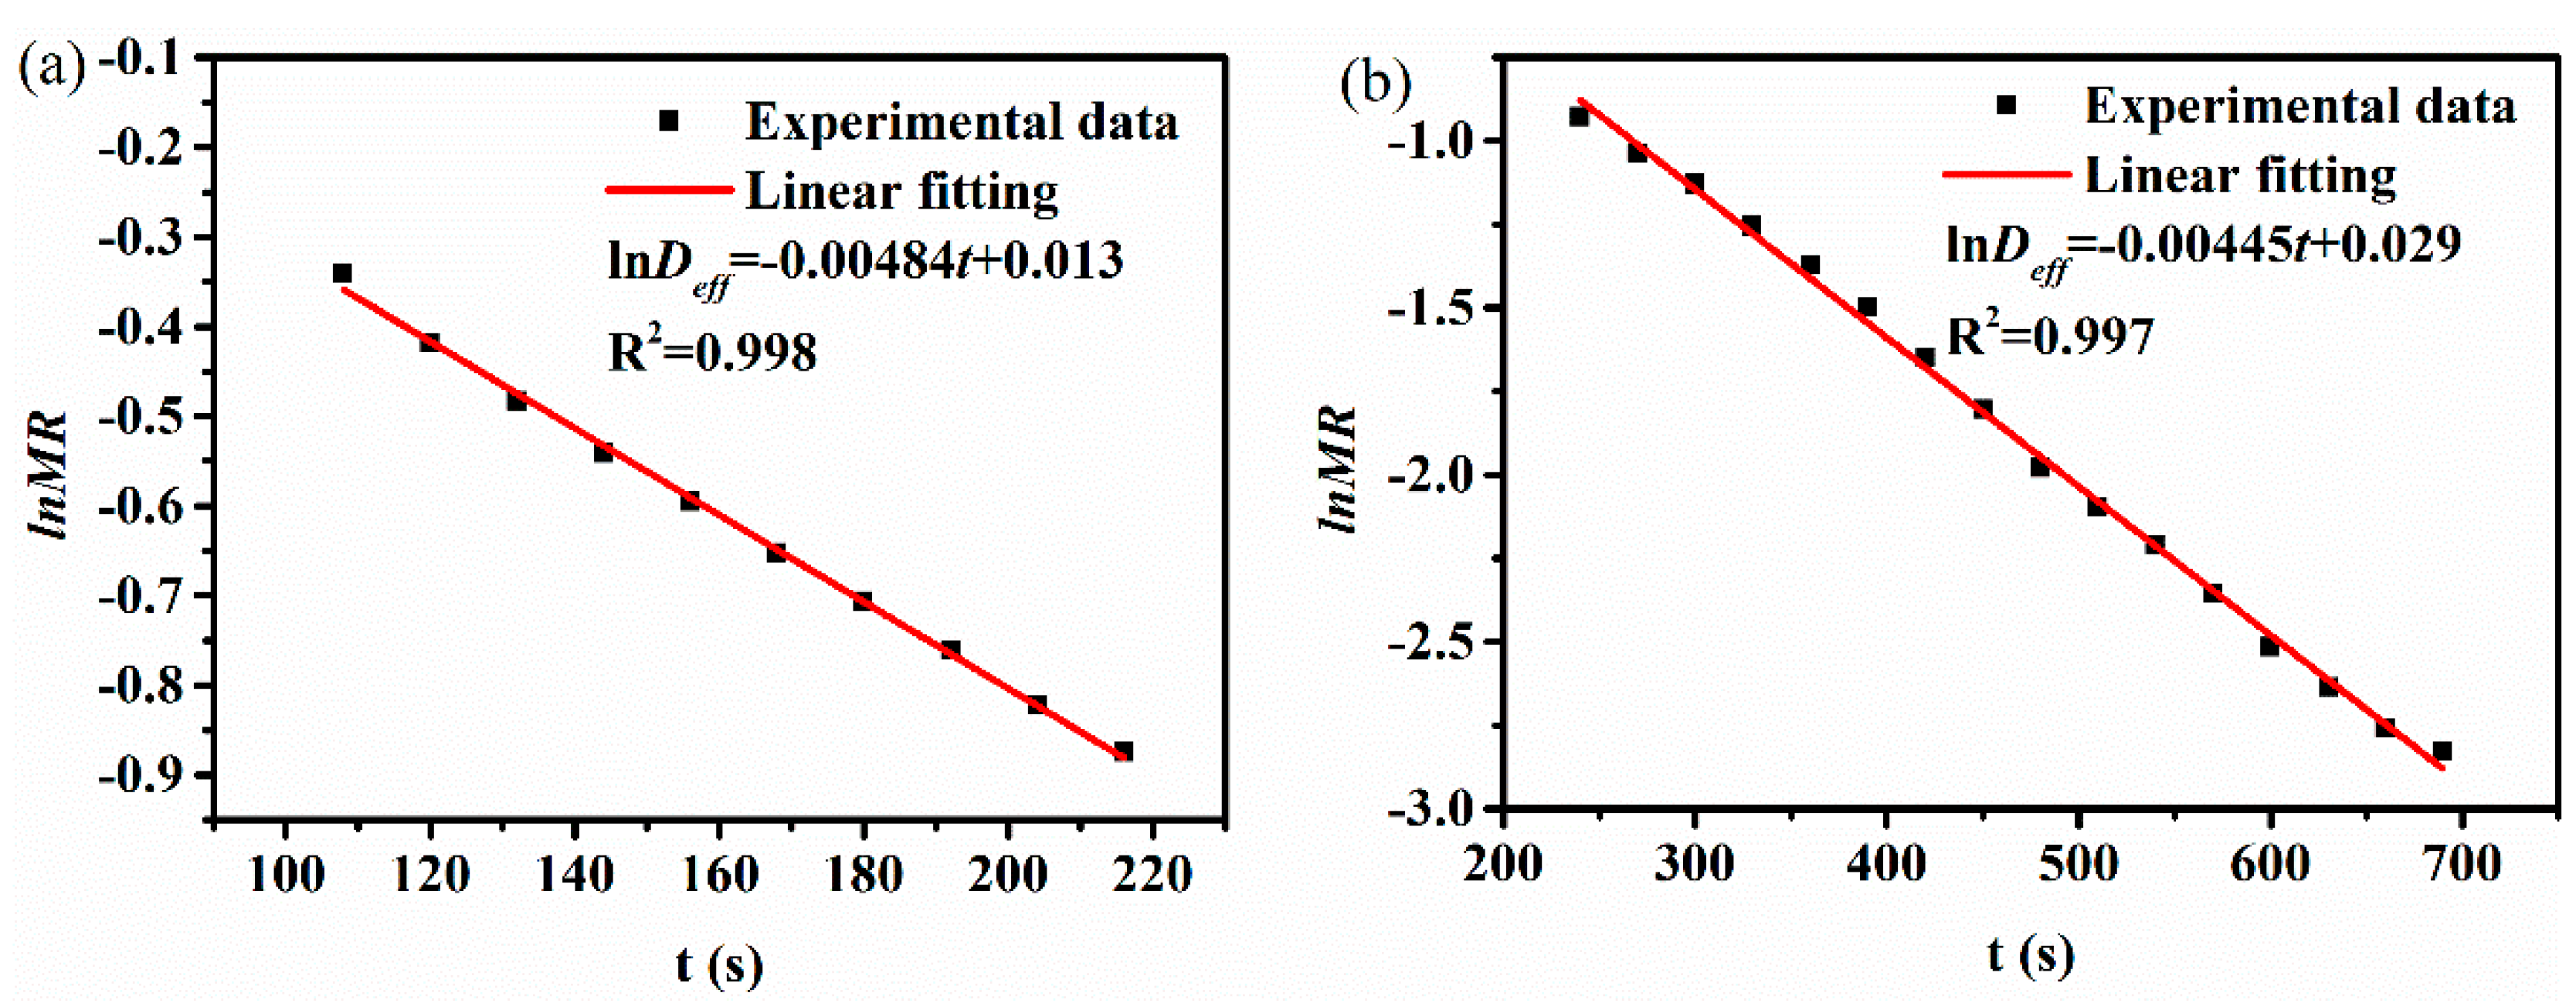
where Deff (m2·s−1) is the effective diffusion coefficient; MR is the moisture ratio of lignite; L is the thickness of the thin-layer, m; and t is the drying time, s. The effective diffusion coefficient under specific conditions can be determined by plotting lnMR versus t.
Based on previous discussions, the whole falling rate period of microwave drying was distinguished into the first falling rate period and the second falling rate period, which could further determine the drying kinetics of lignite in the whole falling rate stage. However, during hot-air drying, only one falling rate period was found. Figure 5 demonstrates the linear fitting between lnMR and t from Equation (5) for the thin-layer in the first falling rate period and the second falling rate period at the experimental temperature of 100 °C. The effective diffusion coefficient of lignite could be determined according to the slope of the fitted lines and the results are presented in Table 6, Table 7 and Table 8 at different conditions.
The effective diffusion coefficient increased gradually with the increasing of temperature or microwave power levels in both periods. With the increase of temperature, the effective diffusion coefficient of the lignite increase from 7.081 × 10⁻⁷ to 7.871 × 10⁻⁷ m2·s−1 during the first falling rate period. In the second falling rate period, it vary from 6.511 × 10⁻⁷ to 1.189 × 10⁻⁶ m2·s−1. The effective diffusion coefficient of the lignite increase from 1.881 × 10⁻⁸ to 3.186 × 10⁻⁸ m2·s−1 during the hot-air drying. This means that increasing temperature helps the migration of moisture due to the drying force of moisture increase with increasing temperature. However, the effective diffusion coefficient during microwave drying is higher than hot-air drying whether in the first falling rate period or the second falling rate period, which could be ascribed to the different drying mechanism. Similarly, with the increase of microwave power level, the effective diffusion coefficient of the lignite increase from 6.247 × 10⁻⁹ to 1.093 × 10⁻⁸ m2·s−1 during the first falling rate period. It varies from 4.696 × 10⁻⁹ to 1.008 × 10⁻⁸ m2·s−1 during the second falling rate period. The temperature of lignite increase with the increase of microwave power levels. Consequently, the drying force increases gradually. Similar results were reported by Fu et al. [12] at the microwave power of 119–700 W. An interesting phenomenon shows that the effective diffusion coefficient at different temperatures are higher than that at different power levels.
Apparent activation energy was determined by using the Arrhenius equation [51]:
where D0, Ea, T, and R are the diffusion factor (m2·s−1), the apparent activation energy, and the temperature of lignite (K) and the gas constant, respectively.
Equation (6) can be linearized as:
Ea and D0 can be evaluated by plotting lnDeff versus 1/T. Due to the microwave drying process under different microwave power levels is not an isothermal process, the activation energy can be obtained by a modified Arrhenius equation:
where m and P are the mass of sample (g) and the microwave power levels, respectively.
Equation (7) can be linearized as:
Ea and D0 can be evaluated by plotting lnDeff versus m/P.
The plots of lnDeff versus m/P and the fitted line are presented in Figure 6, from which the Ea in the first falling rate period and second falling rate period could be determined. The results of microwave drying are presented in Table 9 and Table 10, while the results of hot-air drying are presented in Table 11.
During microwave drying, the values of apparent activation energy for the first and second falling rate periods at different temperatures are 3.349 and 20.808 kJ·mol−1, respectively, and the values of diffusion factors are 2.060 × 10⁻⁶ and 5.091×10⁻⁴ m2·s−1. Similarly, the values of apparent activation energy at different microwave power levels are 13.455 and 19.580 W·g−1, respectively. The values of diffusion factors are 2.396 × 10⁻⁸ and 3.500 × 10⁻⁸ m2·s−1. The apparent activation energy of the second falling rate period is higher than that of the first falling rate period in all microwave drying conditions. In other words, the removal of moisture is easier during the first falling rate period. During the first falling rate period, the mass loss can be mainly attributed to the removal of capillary water compared to absorbed water during the second falling rate period. Capillary water, which exists in the pore channels of lignite, was removed through overcoming the Van der Waals forces and hydrogen bond resistance, which exists among the water molecules [26]. However, the amount of absorbed water is relatively less and it is tightly bounded to the solid particles. In addition, there are a great deal of hydrophilic oxygen-containing groups in the lignite. Therefore, the apparent activation energy is higher during the second falling rate period [26].
In hot-air drying, the value of apparent activation energy for the falling rate period at different temperatures is 17.078 kJ·mol−1 and the value of the diffusion factor is 4.883 × 10⁻⁶ m2·s−1. The value of apparent activation energy in hot-air drying is between the first and second falling rate period of microwave drying. The result indicates that microwave drying is more suitable to dewatering free water and capillary water of lignite.
4. Conclusions
- (1)
- The drying curves of Zhaotong lignite during microwave drying exhibited a warm-up period, a short constant rate period, and the first and second falling rate periods for all applied microwave drying conditions, while only one falling rate period was observed during hot-air drying. This demonstrates different heat transfer mechanisms between these two methods.
- (2)
- The required drying time for lignite decrease by about 48% and 57% with the temperature rising from 100 °C to 140 °C and the power from 500 W to 800 W, respectively. The comparisons of the drying characteristics of lignite between microwave drying and hot-air drying indicate that microwave drying has great advantages in drying time and rate.
- (3)
- The mathematical modeling of lignite was conducted using multiple regression analysis and the two-term exponential model is the most suitable model to describe the all microwave drying experiments, while Modified Page model was the most suitable model to describe the hot-air drying experiments. The results shows different drying kinetic mechanism between conventional and microwave drying.
- (4)
- The drying rate and effective diffusion coefficient increase gradually with increasing temperature and microwave power levels, which indicate that it could promote moisture migration in the lignite. The Arrhenius equation was used to calculate the apparent activation energy and the results during hot-air drying is 17.078 kJ·mol−1 for the falling rate period. However, during microwave drying, for the first and second falling rate periods are 3.349 and 20.808 kJ·mol−1 at different temperatures, while it was 13.455 and 19.580 W·g−1 at different microwave power levels. The values of apparent activation energy are higher during the second falling rate period, which suggest that the dewatering of absorbed water is more difficult than capillary water. The value of apparent activation energy in hot-air drying is between the first and second falling rate period of microwave drying.
Author Contributions
P.Z. wrote the paper; C.L. conceived and designed the study; W.Q. carried out the literature search; J.G. and L.J. performed the the data collection and data interpretation; Z.H. and S.J. analyzed the figures and tables; R.R. contributed performed the the data collection.
Funding
The authors acknowledge the financial supports from the National Natural Science Foundation of China (CN) (no. 51504217), the National Natural Science Foundation of China—Yunnan Joint Fund Project of China (no. U1402274), the Natural Science Foundation of Yunnan Province (CN) (2015FD031), and the Science Research Foundation of Yunnan Provincial Education Department (no. 2018JS306).
Conflicts of Interest
The authors declare no conflicts of interest.
Nomenclature
| M | moisture (g/(g db)) |
| Wt | the mass of sample at t (g) |
| Wd,s | the dry coal mass (g) |
| DR | the drying rate (g/(g db min)) |
| Mt and Mt + dt | the moisture content at t and t + dt (g/(g db)) |
| MR | the moisture ratio |
| M0 | the initial water content (g/(g db)) |
| Me | the moisture content at the end of the drying experiment (g/(g db)) |
| Mad | moisture content |
| Aad | ash content |
| Vad | volatile content |
| FCad | fixed carbon content |
| R2 | coefficient of determination |
| RSS | residual sum of square |
| χ2 | reduced Chi-Square |
| Deff | effective diffusion coefficient (m2·s−1) |
| L | thickness of the thin-layer (m) |
| t | drying time (s) |
| D0 | diffusion factor (m2·s−1) |
| Ea | apparent activation energy (kJ·mol−1) or (W·g−1) |
| T | temperature of lignite (K) |
| R | gas constant (kJ·mol−1·K−1) |
| m | mass of sample (g) |
| P | microwave power levels (W) |
References
- Zhang, Y.; Jing, X.; Jing, K.; Chang, L.; Bao, W. Study on the pore structure and oxygen-containing functional groups devoting to the hydrophilic force of dewatered lignite. Appl. Surf. Sci. 2015, 324, 90–98. [Google Scholar] [CrossRef]
- Feng, L.; Yuan, C.; Mao, L.; Yan, C.; Jiang, X.; Liu, J.; Liu, X. Water occurrence in lignite and its interaction with coal structure. Fuel 2018, 219, 288–295. [Google Scholar] [CrossRef]
- Feng, L.I.; Liu, X.; Song, L.; Wang, X.; Zhang, Y.; Cui, T.; Tang, H. The effect of alkali treatment on some physico–chemical properties of xilinhaote lignite. Powder Technol. 2013, 247, 19–23. [Google Scholar] [CrossRef]
- Li, Y.; Zhao, H.; Song, Q.; Wang, X.; Shu, X. Influence of critical moisture content in lignite dried by two methods on its physicochemical properties during oxidation at low temperature. Fuel 2018, 211, 27–37. [Google Scholar] [CrossRef]
- Liu, M.; Wang, C.; Han, X.; Li, G.; Chong, D.; Yan, J. Lignite drying with solar energy: Thermodynamic analysis and case study. Dry. Technol. 2017, 35, 1117–1129. [Google Scholar] [CrossRef]
- Potter, O.E.; Beeby, C.J.; Fernando, W.J.N.; Ho, P. Drying brown coal in steam-heated, steam-fluidized beds. Dry. Technol. 1983, 2, 219–234. [Google Scholar] [CrossRef]
- Agarwal, P.K.; Genetti, W.E.; Lee, Y.Y. Coupled drying and devolatilization of wet coal in fluidized beds. Chem. Eng. Sci. 1986, 41, 2373–2383. [Google Scholar] [CrossRef]
- Bergins, C.; Hulston, J.; Strauss, K.; Chaffee, A.L. Mechanical/thermal dewatering of lignite. Part 3: Physical properties and pore structure of mte product coals. Fuel 2007, 86, 3–16. [Google Scholar] [CrossRef]
- Hulston, J.; Favas, G.; Chaffee, A.L. Physico-chemical properties of loy yang lignite dewatered by mechanical thermal expression. Fuel 2005, 84, 1940–1948. [Google Scholar] [CrossRef]
- Wu, J.; Liu, J.; Xu, Z.; Wang, Z.; Zhou, J.; Cen, K. Chemical and structural changes in ximeng lignite and its carbon migration during hydrothermal dewatering. Fuel 2015, 148, 139–144. [Google Scholar] [CrossRef]
- Liu, J.; Wu, J.; Zhu, J.; Wang, Z.; Zhou, J.; Cen, K. Removal of oxygen functional groups in lignite by hydrothermal dewatering: An experimental and dft study. Fuel 2016, 178, 85–92. [Google Scholar] [CrossRef]
- Fu, B.A.; Chen, M.Q.; Huang, Y.W.; Luo, H.F. Combined effects of additives and power levels on microwave drying performance of lignite thin layer. Dry. Technol. 2017, 35, 227–239. [Google Scholar] [CrossRef]
- Metaxas, A.C.; Meredith, R.J. Industrial Microwave Heating; The Institution of Engineering and Technology: London, UK, 2008; Volume 4. [Google Scholar]
- Binner, E.; Lester, E.; Kingman, S.; Dodds, C.; Robinson, J.; Wu, T.; Wardle, P.; Mathews, J.P. A review of microwave coal processing. J. Microw. Power Electromagn. Energy 2016, 48, 35–60. [Google Scholar] [CrossRef]
- Metaxas, A.C. Microwave heating. Power Eng. J. 1991, 5, 237–247. [Google Scholar] [CrossRef]
- Pickles, C.A.; Gao, F.; Kelebek, S. Microwave drying of a low-rank sub-bituminous coal. Miner. Eng. 2014, 62, 31–42. [Google Scholar] [CrossRef]
- Song, Z.; Yao, L.; Jing, C.; Zhao, X.; Wang, W.; Ma, C. Drying behavior of lignite under microwave heating. Dry. Technol. 2017, 35, 433–443. [Google Scholar] [CrossRef]
- Koné, K.Y.; Druon, C.; Gnimpieba, E.Z.; Delmotte, M.; Duquenoy, A.; Laguerre, J.C. Power density control in microwave assisted air drying to improve quality of food. J. Food Eng. 2013, 119, 750–757. [Google Scholar] [CrossRef]
- Grigory, T.; Peter, V. Microwave wood modification technology and its applications. For. Prod. J. 2010, 60, 173–182. [Google Scholar]
- Zhao, P.; Zhong, L.; Zhao, Y.; Luo, Z. Comparative studies on the effect of mineral matter on physico-chemical properties, inherent moisture and drying kinetics of chinese lignite. Energy Convers. Manag. 2015, 93, 197–204. [Google Scholar] [CrossRef]
- Zhu, J.-F.; Liu, J.-Z.; Yuan, S.; Cheng, J.; Liu, Y.; Wang, Z.-H.; Zhou, J.-H.; Cen, K.-F. Effect of microwave irradiation on the grinding characteristics of ximeng lignite. Fuel Process. Technol. 2016, 147, 2–11. [Google Scholar] [CrossRef]
- Williams, O.; Eastwick, C.; Kingman, S.; Giddings, D.; Lormor, S.; Lester, E. Investigation into the applicability of bond work index (bwi) and hardgrove grindability index (hgi) tests for several biomasses compared to colombian la loma coal. Fuel 2015, 158, 379–387. [Google Scholar] [CrossRef]
- Lester, E.; Kingman, S.; Dodds, C.; Patrick, J. The potential for rapid coke making using microwave energy. Fuel 2006, 85, 2057–2063. [Google Scholar] [CrossRef]
- Binner, E.; Mediero-Munoyerro, M.; Huddle, T.; Kingman, S.; Dodds, C.; Dimitrakis, G.; Robinson, J.; Lester, E. Factors affecting the microwave coking of coals and the implications on microwave cavity design. Fuel Process. Technol. 2014, 125, 8–17. [Google Scholar] [CrossRef] [Green Version]
- Zhu, J.-F.; Liu, J.-Z.; Wu, J.-H.; Cheng, J.; Zhou, J.-H.; Cen, K.-F. Thin-layer drying characteristics and modeling of ximeng lignite under microwave irradiation. Fuel Process. Technol. 2015, 130, 62–70. [Google Scholar] [CrossRef]
- Li, C.; Liao, J.-J.; Yin, Y.; Mo, Q.; Chang, L.-P.; Bao, W.-R. Kinetic analysis on the microwave drying of different forms of water in lignite. Fuel Process. Technol. 2018, 176, 174–181. [Google Scholar] [CrossRef]
- Fu, B.A.; Chen, M.Q.; Song, J.J. Investigation on the microwave drying kinetics and pumping phenomenon of lignite spheres. Appl. Therm. Eng. 2017, 124, 371–380. [Google Scholar] [CrossRef]
- Jiang, Y.; Liu, B.; Peng, J.; Zhang, L. Dielectric properties and microwave heating of molybdenite concentrate at 2.45 ghz frequency. J. Beijing Inst. Technol. 2018, 27, 83–91. [Google Scholar]
- Page, G.E. Factors Influencing the Maximum Rates of Air Drying Shelled Corn in Thin Layers. Master’s Thesis, Purdue University, West Lafayette, IN, USA, 1949. [Google Scholar]
- Zhang, Q.; Litchfield, J.B. An optimization of intermittemt corn drying in a laboratory scale thin layer dryer. Dry. Technol. 1991, 9, 383–395. [Google Scholar] [CrossRef]
- Overhults, D.G.; White, G.M.; Hamilton, H.E.; Ross, I.J. Drying soybeans with heated air. Am. Soc. Agric. Eng. Trans. ASAE 1973, 16, 112–113. [Google Scholar] [CrossRef]
- Diamante, L.M.; Munro, P.A. Mathematical modelling of hot air drying of sweet potato slices. Int. J. Food Sci. Technol. 2010, 26, 99–109. [Google Scholar] [CrossRef]
- Henderson, S.M. Progress in developing the thin layer drying equation. Trans. ASAE 1974, 17, 1167–1168. [Google Scholar] [CrossRef]
- Rahman, M.S.; Perera, C.O.; Thebaud, C. Desorption isotherm and heat pump drying kinetics of peas. Food Res. Int. 1997, 30, 485–491. [Google Scholar] [CrossRef]
- Sharafeldeen, Y.I.; Blaisdell, J.L.; Hamdy, M.Y. A model for ear-corn drying. Trans. ASAE 1980, 23, 1261–1265. [Google Scholar] [CrossRef]
- O’Callaghan, J.R.; Menzies, D.J.; Bailey, P.H. Digital simulation of agricultural drier performance. J. Agric. Eng. Res. 1971, 16, 223–244. [Google Scholar] [CrossRef]
- Ayensu, A. Dehydration of food crops using a solar dryer with convective heat flow. Sol. Energy 1997, 59, 121–126. [Google Scholar] [CrossRef]
- Liu, Q.; Bakker-Arkema, F.W. Stochastic modelling of grain drying: Part 2. Model development. J. Agric. Eng. Res. 1997, 66, 275–280. [Google Scholar] [CrossRef]
- Westerman, P.W.; White, G.M.; Ross, I.J. Relative humidity effect on the high-temperature drying of shelled corn. Trans. ASAE 1973, 16, 1136–1139. [Google Scholar] [CrossRef]
- Chhinnan, M.S. Evaluation of selected mathematical models for describing thin-layer drying of in-shell pecans. Trans. ASAE 1984, 27, 0610–0615. [Google Scholar] [CrossRef]
- Karathanos, V.T. Determination of water content of dried fruits by drying kinetics. J. Food Eng. 1999, 39, 337–344. [Google Scholar] [CrossRef]
- Yagcioglu, A.; Degirmencioglu, A.; Cagatay, F. Drying characteristics of laurel leaves under different drying conditions. In Proceedings of the 7th International Congress on Agricultural Mechanization and Energy, Adana, Turkey, 26–27 May 2002; Bascetincelik, A., Ed.; Faculty of Agriculture, Çukurova University: Adana, Turkey, 2002; pp. 565–569. [Google Scholar]
- Wang, C.Y.; Singh, R.P. Single Layer Drying Equation for Rough Rice; American Society of Agricultural Engineers: St. Joseph, MI, USA, 1978. [Google Scholar]
- Kassem, A.S. Comparative studies on thin layer drying models for wheat. In Proceedings of the 13th International Congress on Agricultural Engineering, Rabat, Morocco, 2–6 February 1998; Volume 6, pp. 2–6. [Google Scholar]
- Verma, L.R.; Bucklin, R.A.; Endan, J.B.; Wratten, F.T. Effects of drying air parameters on rice drying models. Trans. ASAE 1985, 28, 296–301. [Google Scholar] [CrossRef]
- Midilli, A.; Kucuk, H.; Yapar, Z. A new model for single-layer drying. Dry. Technol. 2002, 20, 1503–1513. [Google Scholar] [CrossRef]
- Fu, B.A.; Chen, M.Q. Thin-layer drying kinetics of lignite during hot air forced convection. Chem. Eng. Res. Des. 2015, 102, 416–428. [Google Scholar] [CrossRef]
- Song, Z.; Yao, L.; Jing, C.; Zhao, X.; Wang, W.; Mao, Y.; Ma, C. Experimental study on the characteristics of ignition during microwave drying of lignite. Energy Technol. 2016, 4, 1077–1083. [Google Scholar] [CrossRef]
- Tahmasebi, A.; Yu, J.; Han, Y.; Zhao, H.; Bhattacharya, S. A kinetic study of microwave and fluidized-bed drying of a chinese lignite. Chem. Eng. Res. Des. 2014, 92, 54–65. [Google Scholar] [CrossRef]
- Kara, C.; Doymaz, İ. Effective moisture diffusivity determination and mathematical modelling of drying curves of apple pomace. Heat Mass Transf. 2015, 51, 983–989. [Google Scholar] [CrossRef]
- Li, H.; Chang, Q.; Gao, R.; Dai, Z.; Chen, X.; Yu, G.; Wang, F. Thin-layer drying characteristics and modeling of lignite under supercritical carbon dioxide extraction and the evolution of pore structure and reactivity. Fuel Process. Technol. 2018, 170, 1–12. [Google Scholar] [CrossRef]
Figure 1.
Schematic illustration of the microwave heating system.

Figure 2.
Drying curves of Zhaotong lignite at different temperature. (a) Mass loss vs. drying time; (b) moisture ratio vs. drying time; (c) drying rate vs. drying time; and (d) drying rate vs. moisture ratio.
Figure 2.
Drying curves of Zhaotong lignite at different temperature. (a) Mass loss vs. drying time; (b) moisture ratio vs. drying time; (c) drying rate vs. drying time; and (d) drying rate vs. moisture ratio.

Figure 3.
Drying curves of Zhaotong lignite at different microwave power levels. (a) Temperature vs. drying time; (b) moisture ratio vs. drying time; (c) drying rate vs. drying time; and (d) drying rate vs. moisture ratio.
Figure 3.
Drying curves of Zhaotong lignite at different microwave power levels. (a) Temperature vs. drying time; (b) moisture ratio vs. drying time; (c) drying rate vs. drying time; and (d) drying rate vs. moisture ratio.

Figure 4.
Drying curves of Zhaotong lignite at different temperature by hot-air drying method. (a) Moisture ratio vs. drying time; (b) drying rate vs. moisture ratio.
Figure 4.
Drying curves of Zhaotong lignite at different temperature by hot-air drying method. (a) Moisture ratio vs. drying time; (b) drying rate vs. moisture ratio.

Figure 5.
Plot of lnMR versus t of lignite at 100 °C. (a) 1st falling rate period; (b) 2nd falling rate period.
Figure 5.
Plot of lnMR versus t of lignite at 100 °C. (a) 1st falling rate period; (b) 2nd falling rate period.

Figure 6.
Plot of lnDeff versus m/P of lignite. (a) 1st falling rate period; (b) 2nd falling rate period.
Figure 6.
Plot of lnDeff versus m/P of lignite. (a) 1st falling rate period; (b) 2nd falling rate period.


Table 1.
Mathematical thin-layer drying models. Reproduced with permission from Zhu, J.-F. et al., Fuel Processing Technology; published by Elsevier [25].
Table 1.
Mathematical thin-layer drying models. Reproduced with permission from Zhu, J.-F. et al., Fuel Processing Technology; published by Elsevier [25].
| Number | Drying Models | Equation |
|---|---|---|
| 1 | Page | exp(−ktn) [29,30] |
| 2 | Modified Page | exp(−(kt)n) [31] |
| 3 | Modified Page equation-II | a exp(−k(t/L2)n) [32] |
| 4 | Simplified Fick’s diffusion | a exp(−c(t/L2)) [32] |
| 5 | Two-term | a exp(−k0t) + b exp(−k1t) [33,34] |
| 6 | Two-term exponential | a exp(−kt) + (1 − a) exp(−kat) [35] |
| 7 | Newton | exp(−kt) [36,37,38] |
| 8 | Henderson and Pabis | a exp(−kt) [39,40] |
| 9 | Modified Henderson and Pabis | a exp(−kt) + b exp(−gt) + c exp(−ht) [41] |
| 10 | Logarithmic | a exp(−kt) + c [42] |
| 11 | Wang and Singh | 1 + at + bt2 [43] |
| 12 | Diffusion approach | a exp(−kt) + (1 − a) exp(−kbt) [44] |
| 13 | Verma | a exp(−kt) + (1 − a) exp(−gt) [45] |
| 14 | Midilli–Kucuk | exp(−ktn) + bt [46] |
Table 2.
Proximate analysis of raw lignite.
| Lignite | Mad | Aad | Vad | FCad |
|---|---|---|---|---|
| wt. (%) | 35.61 | 24.49 | 26.29 | 13.59 |
Mad, Aad, Vad, and FCad refer to the moisture, ash, volatile, and fixed carbon content on an air-dried basis, respectively.
Table 3.
Evaluated results of mathematical thin-layer drying models at different temperatures.
| T (°C) | Coefficients | R2 | RSS | χ2 | F-Value | |
|---|---|---|---|---|---|---|
| Diffusion approach | 100 | k = 0.168, a = −2.477 × 10⁶, b = 1 | 0.987 | 0.021 | 1.000 × 10⁻³ | 880.066 |
| 120 | k = 0.244, a = 1, b = 1 | 0.975 | 0.035 | 3.000 × 10⁻³ | 349.727 | |
| 140 | k = 0.286, a = 1, b = 1 | 0.964 | 0.040 | 4.000 × 10⁻³ | 189.560 | |
| Henderson and Pabis | 100 | k = 0.24173, a = 1.065 | 0.991 | 0.016 | 1.000 × 10⁻³ | 1799.371 |
| 120 | k = 0.26296, a = 1.084 | 0.984 | 0.024 | 2.000 × 10⁻³ | 836.923 | |
| 140 | k = 0.30745, a = 1.085 | 0.976 | 0.030 | 3.000 × 10⁻³ | 434.304 | |
| Midilli-Kucuk | 100 | k = −14.706, a = 4.062 × 10 −7, b = −0.008, n = −0.047 | 0.363 | 1.026 | 5.700 × 10⁻² | 8.543 |
| 120 | k = −11.318, a = 1.202 × 10 −5, b = −0.017, n = −0.559 | 0.227 | 1.012 | 8.400 × 10⁻² | 5.585 | |
| 140 | k = −0.477, a = 0.609, b = −0.064, n = −3.497 × 10⁶ | −0.058 | 1.041 | 1.300 × 10⁻² | 2.983 | |
| Modified Henderdon and Pabis | 100 | k = 0.242, a = 0.355, b = 0.355, c = 0.355 | 0.989 | 0.016 | 1.000 × 10⁻³ | 479.832 |
| 120 | k = 0.263, a = 0.361, b = 0.361, c = 0.361 | 0.978 | 0.024 | 2.000 × 10⁻³ | 199.267 | |
| 140 | k = 0.307, a = 0.362, b = 0.362, c = 0.362 | 0.960 | 0.030 | 5.000 × 10⁻³ | 86.861 | |
| Modified Page | 100 | k = 0.222, n = 1.164 | 0.992 | 0.014 | 7.031 × 10⁻⁴ | 2106.905 |
| 120 | k = 0.235, n = 1.278 | 0.992 | 0.012 | 8.832 × 10⁻⁴ | 1633.806 | |
| 140 | k = 0.274, n = 1.372 | 0.992 | 0.009 | 9.274 × 10⁻⁴ | 1392.609 | |
| Modified Page equationⅡ | 100 | k = 7.967, a = 1.036, L = 5.264, n = 1.118 | 0.992 | 0.013 | 6.952 × 10⁻⁴ | 1065.687 |
| 120 | k = 4.745, a = 1.032, L = 3.819, n = 1.231 | 0.992 | 0.011 | 9.242× 10⁻⁴ | 780.449 | |
| 140 | k = 0.548, a = 1.022, L = 1.511, n = 1.335 | 0.991 | 0.009 | 1.000 × 10⁻³ | 595.534 | |
| Newton | 100 | k = 0.228 | 0.988 | 0.023 | 1.120 × 10⁻³ | 2643.955 |
| 120 | k = 0.244 | 0.978 | 0.035 | 2.000 × 10⁻³ | 1210.594 | |
| 140 | k = 0.286 | 0.970 | 0.040 | 4.000 × 10⁻³ | 695.052 | |
| Page | 100 | k = 0.173, n = 1.165 | 0.988 | 0.023 | 1.000 × 10⁻³ | 2643.955 |
| 120 | k = 0.157, n = 1.278 | 0.978 | 0.035 | 2.000 × 10⁻³ | 1210.594 | |
| 140 | k = 0.286, n = 1.342 | 0.970 | 0.040 | 4.000 × 10⁻³ | 695.052 | |
| Simplified_Ficks diffusion | 100 | a = 1.065, c = 1.519, L = 2.507 | 0.990 | 0.016 | 8.654 × 10⁻⁴ | 1139.602 |
| 120 | a = 1.084, c = 1.135, L = 2.077 | 0.983 | 0.024 | 2.000 × 10⁻³ | 518.096 | |
| 140 | a = 1.085, c = 0.661, L = 1.466 | 0.973 | 0.030 | 3.000 × 10⁻³ | 260.583 | |
| Two-term | 100 | a = 0.532, b = 0.532, k0 = 0.242, k1 = 0.242 | 0.990 | 0.016 | 9.132 × 10⁻⁴ | 809.717 |
| 120 | a = 0.542, b = 0.542, k0 = 0.263, k1 = 0.263 | 0.982 | 0.024 | 2.000 × 10⁻³ | 358.681 | |
| 140 | a = 0.543, b = 0.543, k0 = 0.307, k1 = 0.307 | 0.970 | 0.030 | 4.000 × 10⁻³ | 173.722 | |
| Two-term exponential | 100 | k = 0.310, a = 1.747 | 0.992 | 0.014 | 7.213 × 10⁻⁴ | 2052.358 |
| 120 | k = 0.362, a = 1.909 | 0.993 | 0.011 | 7.981 × 10⁻⁴ | 1808.309 | |
| 140 | k = 0.443, a = 0.068 | 0.99375 | 0.008 | 7.692 × 10⁻⁴ | 1680.382 | |
| Verma | 100 | k = 0.267, a = 1.180, g = 3496.365 | 0.997 | 0.005 | 2.673 × 10⁻⁴ | 3706.411 |
| 120 | k = 0.302, a = 1.252, g = 2.31 × 10⁷ | 0.997 | 0.004 | 2.784 × 10⁻⁴ | 3465.462 | |
| 140 | k = 0.366, a = 1.310, g = 1066.695 | 0.996 | 0.004 | 4.901 × 10 −4 | 1761.785 | |
| Wang and singh | 100 | a = −0.140, b = 0.005 | 0.937 | 0.113 | 6.000 × 10⁻³ | 252.193 |
| 120 | a = −0.169, b = 0.007 | 0.979 | 0.032 | 2.000 × 10⁻³ | 620.447 | |
| 140 | a = −0.205, b = 0.011 | 0.986 | 0.017 | 2.000 × 10⁻³ | 749.792 | |
| Logarithmic | 100 | k = 0.239, a = 1.067, c = −0.003 | 0.990 | 0.016 | 8.611 × 10⁻⁴ | 1145.754 |
| 120 | k = 0.233, a = 1.114, c = −0.047 | 0.987 | 0.018 | 1.000 × 10⁻³ | 677.532 | |
| 140 | k = 0.243, a = 1.162, c = −0.103 | 0.985 | 0.017 | 2.000 × 10⁻³ | 450.334 |
Table 4.
Evaluated results of mathematical thin-layer drying models at different microwave power levels.
Table 4.
Evaluated results of mathematical thin-layer drying models at different microwave power levels.
| Model | W | Coefficients | R2 | RSS | χ2 | F-Value |
|---|---|---|---|---|---|---|
| Diffusion approach | 500 | k = 0.166, a = 1, b = 1 | 0.983 | 0.031 | 2.000 × 10⁻³. | 754.788 |
| 600 | k = 0.232, a = 1.041 × 10¹², b = 1 | 0.975 | 0.036 | 3.000 × 10⁻³ | 363.305 | |
| 700 | k = 0.12721, a = 1.578 × 10¹³, b = 1 | 0.980 | 0.021 | 3.000 × 10⁻³ | 384.447 | |
| 800 | k = 0.30273, a = 1, b = 1 | 0.948 | 0.047 | 7.000 × 10⁻³ | 121.368 | |
| Henderson and Pabis | 500 | k = 0.178, a = 1.080 | 0.990 | 0.019 | 9.942 × 10⁻⁴ | 1938.079 |
| 600 | k = 0.249, a = 1.090 | 0.985 | 0.023 | 2.000 × 10⁻³ | 894.744 | |
| 700 | k = 0.282, a = 1.090 | 0.977 | 0.028 | 3.000 × 10⁻³ | 489.825 | |
| 800 | k = 0.328, a = 1.090 | 0.966 | 0.036 | 4.400 × 10⁻² | 278.231 | |
| Midilli-Kucuk | 500 | k = −9.441, a = 8.219 × 10⁻⁵, b = −0.017, n = −0.048 | 0.399 | 1.015 | 6.000 × 10⁻² | 11.960 |
| 600 | k = −10.555, a = 2.609 × 10⁻⁵, b = −0.017, n = −0.056 | 0.227 | 1.012 | 8.400 × 10⁻² | 5.968 | |
| 700 | k = −10.562, a = 2.532 × 10⁻⁵, b = −0.027, n = −0.053 | 0.038 | 1.004 | 0.126 | 3.526 | |
| 800 | k = −0.189, k = 0.178, a = 0.358, b = −0.395, n = 0.867 | 0.969 | 0.024 | 4.000 × 10⁻³ | 154.053 | |
| Modified Henderdon and Pabis | 500 | b = 0.358, c = 0.358 | 0.987 | 0.019 | 1.000 × 10⁻³ | 510.021 |
| 600 | k = 0.249, a = 0.362, b = 0.362, c = 0.362 | 0.978 | 0.023 | 2.000 × 10⁻³ | 213.034 | |
| 700 | k = 0.328, a = 0.363, b = 0.363, c = 0.363 | 0.961 | 0.028 | 5.000 × 10⁻³ | 97.965 | |
| 800 | b = 0.363, c = 0.363 k = 0.363, a = 0.363, | 0.932 | 0.036 | 9.000 × 10⁻³ | 46.372 | |
| Modified Page | 500 | k = 0.162, n = 1.193 | 0.993 | 0.013 | 6.831 × 10⁻⁴ | 2825.111 |
| 600 | k = 0.223, n = 1.273 | 0.992 | 0.012 | 8.879 × 10⁻⁴ | 1696.047 | |
| 700 | k = 0.251, n = 1.357 | 0.992 | 0.010 | 9.858 × 10⁻⁴ | 1402.093 | |
| 800 | k = 0.292, n = 1.418 | 0.987 | 0.014 | 2.000 × 10⁻³ | 736.068 | |
| Modified Page equation-Ⅱ | 500 | k = 0.376, a = 1.031, n = 1.148, L = 1.598 | 0.993 | 0.012 | 6.870 × 10⁻⁴ | 1405.019 |
| 600 | k = 4.602, a = 1.034, n = 1.223, L = 3.886 | 0.992 | 0.011 | 9.182 × 10⁻⁴ | 820.476 | |
| 700 | k = 4.399, a = 1.027, n = 1.312, L = 3.463 | 0.991 | 0.090 | 1.000 × 10⁻³ | 617.745 | |
| 800 | k = 7.435, a = 1.030, n = 1.368, L = 3.798 | 0.984 | 0.012 | 2.000 × 10⁻³ | 299.810 | |
| Newton | 500 | k = 0.166 | 0.985 | 0.031 | 1.000 × 10⁻³ | 2515.960 |
| 600 | k = 0.231 | 0.978 | 0.036 | 2.000 × 10⁻³ | 1257.561 | |
| 700 | k = 0.261 | 0.970 | 0.040 | 4.000 × 10⁻³ | 748.017 | |
| 800 | k = 0.303 | 0.960 | 0.047 | 5.000 × 10⁻³ | 468.135 | |
| Page | 500 | k = 0.114, n = 1.193 | 0.993 | 0.013 | 6.831 × 10⁻⁴ | 2825.109 |
| 600 | k = 0.231, n = 1.274 | 0.992 | 0.012 | 8.879 × 10⁻⁴ | 1696.032 | |
| 700 | k = 0.154, n = 1.357 | 0.992 | 0.010 | 9.858 × 10⁻⁴ | 1402.087 | |
| 800 | k = 0.174, n = 1.419 | 0.987 | 0.014 | 2.000 × 10⁻³ | 736.064 | |
| Simplified Ficks diffusion | 500 | a = 1.076, c = 6.563, L = 6.066 | 0.989 | 0.019 | 1.000 × 10⁻³ | 1224.052 |
| 600 | a = 1.086, c = 1.285, L = 2.271 | 0.983 | 0.023 | 2.000 × 10⁻³ | 553.889 | |
| 700 | a = 1.089, c = 0.849, L = 1.735 | 0.974 | 0.028 | 3.000 × 10⁻³ | 2993.895 | |
| 800 | a = 1.091, c = 0.574, L = 1.323 | 0.960 | 0.036 | 5.000 × 10⁻³ | 162.302 | |
| Two term | 500 | a = 0.538, b = 0.538, k0 = 0.178, k1 = 0.178 | 0.989 | 0.019 | 1.000 × 10⁻³ | 867.035 |
| 600 | a = 0.543, b = 0.543, k0 = 0.249, k1 = 0.249 | 0.982 | 0.023 | 2.000 × 10⁻³ | 383.461 | |
| 700 | a = 0.544, b = 0.544, k0 = 0.282, k1 = 0.282 | 0.971 | 0.028 | 4.000 × 10⁻³ | 195.930 | |
| 800 | a = 0.545, b = 0.545, k0 = 0.328, k1 = 0.328 | 0.955 | 0.036 | 6.000 × 10⁻³ | 104.337 | |
| Two–term exponential | 500 | a = 1.751, k = 0.226 | 0.993 | 0.014 | 7.448 × 10⁻⁴ | 2590.107 |
| 600 | a = 1.900, k = 0.341 | 0.993 | 0.011 | 8.102 × 10⁻⁴ | 1859.288 | |
| 700 | a = 1.988, k = 0.405 | 0.994 | 0.008 | 7.776 × 10⁻⁴ | 1778.736 | |
| 800 | a = 2.080, k = 0.494 | 0.991 | 0.009 | 1.140 × 10⁻³ | 1096.804 | |
| Verma | 500 | k = 0.191, a = 1.157, g = 0.191 | 0.997 | 0.007 | 3.999× 10⁻⁴ | 3221.211 |
| 600 | k = 0.284, a = 1.242, g = 55.727 | 0.998 | 0.003 | 2.642 × 10⁻⁴ | 3836.985 | |
| 700 | k = 0.332, a = 1.292, g = 224.580 | 0.997 | 0.003 | 3.578 × 10⁻⁴ | 2581.325 | |
| 800 | k = 0.302, a = –0.301, g = 0.303 | 0.948 | 0.047 | 7.000 × 10⁻³ | 121.368 | |
| Wang and Singh | 500 | a = –0.118, b = 0.004 | 0.984 | 0.031 | 2.000 × 10⁻³ | 1189.696 |
| 600 | a = –0.163, b = 0.007 | 0.981 | 0.029 | 2.000 × 10⁻³ | 717.017 | |
| 700 | a = –0.191, b = 0.009 | 0.984 | 0.019 | 2.000 × 10⁻³ | 730.583 | |
| 800 | a = –0.222, b = 0.013 | 0.977 | 0.024 | 3.000 × 10⁻³ | 414.547 | |
| Logarithmic | 500 | a = 1.107, k = 0.155, c = –0.054 | 0.993 | 0.012 | 6.774 × 10⁻⁴ | 1899.599 |
| 600 | a = 1.117, k = 0.220, c = –0.049 | 0.987 | 0.018 | 1.000 × 10⁻³ | 717.731 | |
| 700 | a = 1.173, k = 0.221, c = –0.111 | 0.984 | 0.017 | 2.000 × 10⁻³ | 482.027 | |
| 800 | a = 1.207, k = 0.244, c = –0.144 | 0.975 | 0.023 | 3.000 × 10⁻³ | 253.729 |
Table 5.
Evaluated results of mathematical thin-layer drying models at different temperatures.
| T (°C) | Coefficients | R2 | RSS | χ2 | F-Value | |
|---|---|---|---|---|---|---|
| Page | 100 | k = 0.001, n = 1.351 | 0.997 | 0.006 | 3.381 × 10⁻⁴ | 10,807.829 |
| 120 | k = 0.002, n = 1.282 | 0.998 | 0.002 | 1.982 × 10⁻⁴ | 14,537.140 | |
| 140 | k = 0.002, n = 1.374 | 0.998 | 0.003 | 2.504 × 10⁻⁴ | 9719.974 | |
| Modified Page | 100 | k = 0.007, n = 1.354 | 0.997 | 0.006 | 1.000 × 10⁻³ | 10,814.961 |
| 120 | k = 0.009, n = 1.284 | 0.998 | 0.003 | 2.000 × 10⁻³ | 14,540.871 | |
| 140 | k = 0.012, n = 1.379 | 0.998 | 0.003 | 3.000 × 10⁻³ | 9738.043 | |
| Newton | 100 | k = 0.007 | 0.971 | 0.071 | 4.000 × 10⁻³ | 1939.489 |
| 120 | k = 0.009 | 0.980 | 0.037 | 2.000 × 10⁻³ | 2448.516 | |
| 140 | k = 0.012 | 0.969 | 0.045 | 3.000 × 10⁻³ | 1407.829 | |
| Logarithmic | 100 | a = 0.563, k = –1223.565, c = 0.437 | −1.859 | 6.313 | 0.371 | 0.898 |
| 120 | a = 0.590, k = –1245.021, c = 0.409 | −1.853 | 4.766 | 0.340 | 0.979 | |
| 140 | a = 0.586, k = –1202.048, c = 0.414 | −2.125 | 3.871 | 0.352 | 0.947 | |
| Henderson and Pabis | 100 | a = 1.089, k = 0.007 | 0.982 | 0.041 | 2.000 × 10⁻³ | 1580.406 |
| 120 | a = 1.074, k = 0.009 | 0.988 | 0.022 | 1.000 × 10⁻³ | 1961.657 | |
| 140 | a = 1.079, k = 0.013 | 0.978 | 0.029 | 2.000 × 10⁻³ | 978.989 | |
| Wang and Singh | 100 | a = −0.005, b = 5.997 × 10⁻⁶ | 0.998 | 0.005 | 2.791 × 10⁻⁴ | 13,093.487 |
| 120 | a = −0.006, b = 1.235 × 10⁻⁵ | 0.998 | 0.004 | 2.751 × 10⁻⁴ | 10,472.483 | |
| 140 | a = −0.009, b = 2.012 × 10⁻⁵ | 0.997 | 0.004 | 2.919 × 10⁻⁴ | 8336.658 |
Table 6.
Effective diffusion coefficient of lignite at different temperatures during microwave drying.
Table 6.
Effective diffusion coefficient of lignite at different temperatures during microwave drying.
| T (°C) | 1st Falling Rate | 2nd Falling Rate | ||
|---|---|---|---|---|
| Deff (m2·s−1) | R2 | Deff (m2·s−1) | R2 | |
| 100 | 7.081 × 10⁻⁷ | 0.998 | 6.511 × 10⁻⁷ | 0.997 |
| 120 | 7.213 × 10⁻⁷ | 0.994 | 7.959 × 10⁻⁷ | 0.997 |
| 140 | 7.871 × 10⁻⁷ | 0.997 | 1.189 × 10⁻⁶ | 0.998 |
Table 7.
Effective diffusion coefficient of lignite at different microwave power levels during microwave drying.
Table 7.
Effective diffusion coefficient of lignite at different microwave power levels during microwave drying.
| P (W) | 1st Falling Rate | 2nd Falling Rate | ||
|---|---|---|---|---|
| Deff (m2·s−1) | R2 | Deff (m2·s−1) | R2 | |
| 500 | 6.247 × 10⁻⁹ | 0.996 | 4.696 × 10⁻⁹ | 0.999 |
| 600 | 8.120 × 10⁻⁹ | 0.993 | 7.608 × 10⁻⁹ | 0.999 |
| 700 | 8.325 × 10⁻⁹ | 0.993 | 8.354 × 10⁻⁹ | 0.997 |
| 800 | 1.093 × 10⁻⁸ | 0.995 | 1.008 × 10⁻⁸ | 0.990 |
Table 8.
Effective diffusion coefficient of lignite at different temperatures during hot-air drying.
Table 8.
Effective diffusion coefficient of lignite at different temperatures during hot-air drying.
| T (°C) | Falling Rate Period | |
|---|---|---|
| Deff (m2·s−1) | R2 | |
| 100 | 1.881 × 10⁻⁸ | 0.991 |
| 200 | 2.948 × 10⁻⁸ | 0.991 |
| 300 | 3.186 × 10⁻⁸ | 0.998 |
Table 9.
Activation energy of lignite at different temperatures during microwave drying.
| Condition | 1st Falling Rate | 2nd Falling Rate | ||||
|---|---|---|---|---|---|---|
| Ea (kJ·mol−1) | D0 (m2·s−1) | R2 | Ea (kJ·mol−1) | D0 (m2·s−1) | R2 | |
| T | 3.349 | 2.060 × 10⁻⁶ | 0.712 | 20.808 | 5.091 × 10⁻⁴ | 0.879 |
Table 10.
Activation energy of lignite at different microwave power levels during microwave drying.
| Condition | 1st Falling Rate | 2nd Falling Rate | ||||
|---|---|---|---|---|---|---|
| Ea (W·g−1) | D0 (m2·s−1) | R2 | Ea (W·g−1) | D0 (m2·s−1) | R2 | |
| W | 13.455 | 2.396 × 10⁻⁸ | 0.867 | 19.580 | 3.500 × 10⁻⁸ | 0.928 |
Table 11.
Activation energy of lignite at different temperatures during hot-air drying.
| Condition | Falling Rate Period | ||
|---|---|---|---|
| Ea (kJ·mol−1) | D0 (m2·s−1) | R2 | |
| T | 17.078 | 4.883 × 10⁻⁶ | 0.756 |
© 2019 by the authors. Licensee MDPI, Basel, Switzerland. This article is an open access article distributed under the terms and conditions of the Creative Commons Attribution (CC BY) license (http://creativecommons.org/licenses/by/4.0/).
Share and Cite
MDPI and ACS Style
Zhao, P.; Liu, C.; Qu, W.; He, Z.; Gao, J.; Jia, L.; Ji, S.; Ruan, R. Effect of Temperature and Microwave Power Levels on Microwave Drying Kinetics of Zhaotong Lignite. Processes 2019, 7, 74. https://doi.org/10.3390/pr7020074
AMA Style
Zhao P, Liu C, Qu W, He Z, Gao J, Jia L, Ji S, Ruan R. Effect of Temperature and Microwave Power Levels on Microwave Drying Kinetics of Zhaotong Lignite. Processes. 2019; 7(2):74. https://doi.org/10.3390/pr7020074
Chicago/Turabian StyleZhao, Pengfei, Chenhui Liu, Wenwen Qu, Zhixiu He, Jiyun Gao, Lijuan Jia, Siping Ji, and Roger Ruan. 2019. "Effect of Temperature and Microwave Power Levels on Microwave Drying Kinetics of Zhaotong Lignite" Processes 7, no. 2: 74. https://doi.org/10.3390/pr7020074
Note that from the first issue of 2016, this journal uses article numbers instead of page numbers. See further details here.