A Glucose-Dependent Pharmacokinetic/ Pharmacodynamic Model of ACE Inhibition in Kidney Cells


1
School of Chemical Engineering, Oklahoma State University, Stillwater, OK 74078, USA
2
Harold Hamm Diabetes Center, University of Oklahoma Health Sciences Center, Oklahoma City, OK 73104, USA
*
Author to whom correspondence should be addressed.
Processes 2019, 7(3), 131; https://doi.org/10.3390/pr7030131
Submission received: 29 January 2019
/
Revised: 22 February 2019
/
Accepted: 25 February 2019
/
Published: 4 March 2019
(This article belongs to the Special Issue Systems Biomedicine
)
Abstract
:Diabetic kidney disease (DKD) is a major cause of renal failure. Podocytes are terminally differentiated renal epithelial cells that are key targets of damage due to DKD. Podocytes express a glucose-stimulated local renin-angiotensin system (RAS) that produces angiotensin II (ANG II). Local RAS differs from systemic RAS, which has been studied widely. Hyperglycemia increases the production of ANG II by podocyte cells, leading to podocyte injury. Angiotensin-converting enzyme (ACE) is involved in the production of ANG II, and ACE inhibitors are drugs used to suppress elevated ANG II concentration. As systemic RAS differs from the local RAS in podocytes, ACE inhibitor drugs should act differently in local versus systemic contexts. Experimental and computational studies have considered the pharmacokinetics (PK) and pharmacodynamics (PD) of ACE inhibition of the systemic RAS. Here, a PK/PD model for ACE inhibition is developed for the local RAS in podocytes. The model takes constant or dynamic subject-specific glucose concentration input to predict the ANG II concentration and the corresponding effects of drug doses locally and systemically. The model is developed for normal and impaired renal function in combination with different glucose conditions, thus enabling the study of various pathophysiological conditions. Parameter uncertainty is also analyzed. Such a model can improve the study of the effects of drugs at the cellular level and can aid in development of therapeutic approaches to slow the progression of DKD.
1. Introduction
Hyperglycemia or high blood glucose initiates and aggravates the pathophysiology that can lead to end-stage renal failure in diabetic patients. Diabetic kidney disease (DKD) is one of the common complications of hyperglycemic conditions. In the earlier stages of DKD, the nephrons, which are the basic filtration units of the kidneys, become damaged [1,2]. Blood is filtered in each of thousands of nephrons through a bundle of capillaries known as a glomerulus. Hyperglycemia-induced injury to the glomeruli eventually leads to the loss of renal function. Podocytes are visceral epithelial cells that wrap around the glomerular capillaries and play a vital role in maintaining the structure and function of the glomerular filtration barrier. Because podocytes are terminally differentiated, any damage to them is a critical factor in glomerular injury and diabetic nephropathy. Podocyte injury is a key process in the progression of DKD [3,4,5,6].
The renin-angiotensin system (RAS) is a hormone system responsible for maintaining blood pressure and fluid balance. The RAS network of biochemical reactions involves multiple enzymes and hormones and is known to function at systemic (throughout the body) as well as local (tissue or cellular) levels. Angiotensin (ANG) II is one of the hormones in the RAS and is primarily responsible for regulating blood pressure. The RAS is over-stimulated in diabetic conditions, leading to the up-regulation of ANG II in systemic as well as local levels. Angiotensin-converting enzyme (ACE) is responsible for conversion of the precursor ANG I to ANG II. ACE inhibitors are widely used pharmaceuticals for blood pressure regulation that inhibit the production of ANG II and slow the progression of DKD.
The intracellular RAS within podocytes has been shown to function differently than the systemic RAS in certain pathophysiological conditions such as hyperglycemia [7,8,9,10]. High glucose conditions trigger the RAS to increase ANG II concentration, especially in the podocytes, leading to irreversible podocyte injury [7,11,12]. The progression of DKD can be slowed by controlling the ANG II concentration to prevent irreversible podocyte loss. While ACE inhibitor drugs used to suppress ANG II are frequently prescribed for use in DKD, their effects on the local RAS in podocytes are not well understood. Also, clinical observations indicate that systemic suppression of ANG II by ACE inhibitor drugs is not always accompanied by ANG II suppression in the kidneys [13].
Mathematical models of the reaction network in the systemic RAS have been published [14,15,16]. We previously developed a pharmacokinetic/pharmacodynamic (PK/PD) model for an ACE inhibitor benazepril considering normal and impaired renal functions [15]. We refer to this model as ACEInhibPKPD, which is the name of the corresponding GitHub repository for free distribution of the model code [17]. However, this PK/PD model focused on the systemic RAS and is insufficient to predict the effects of ACE inhibitor drugs on ANG II produced by the local RAS. Podocytes express certain RAS enzymes and hormones differently than the systemic RAS with much higher ANG II concentration [8,9,10]. While several computational models have been proposed for various aspects of renal physiology [18,19,20,21,22,23,24,25,26,27,28,29], models for the mechanism of hyperglycemia-induced podocyte injury in DKD are only recently appearing in the literature. In a previous publication, we created a podocyte-specific local RAS model that had parameters dependent on the glucose concentration [30]. We refer to this model as glucoseRASpodocytes, which is the name of the corresponding GitHub repository [31]. This glucoseRASpodocytes model lacked the effects of drug dosing. Here, we propose a podocyte-specific PK/PD model to describe how an ACE inhibitor benazepril modulates ANG II concentration in the podocyte local RAS. Benazepril is a commonly used ACE inhibitor to treat hypertension and DKD [32,33,34,35]. The objective of this work is to build a physiologically relevant PK/PD model for the local RAS in podocytes to predict ANG II concentration in response to drug dosages and various glucose concentration profiles. The model is detailed in Section 2. In Section 3, we provide results of using subject-specific glucose dynamics data as model input to predict ANG II dynamics. We compare the effects of drug dosages on the ANG II concentration in the local RAS to the systemic RAS in normal and impaired renal function cases and in normal and diabetic glucose conditions. Also, the effects of varying uncertain parameters are explored.
2. Methods
In this section, we develop a PK/PD model for the local RAS in podocytes by combining and adapting features from our previous models: glucoseRASpodocytes [30,31] and ACEInhibPKPD [15,17]. First, we describe the PK model for an ACE inhibitor drug in Section 2.1. Next in Section 2.2, we develop the PD model for the reaction network for the local RAS in podocytes and the effects of the drug on the local RAS. Finally, we summarize the numerical methods used to solve the model equations and provide the location of our code repository and software documentation in Section 2.3.
2.1. Pharmacokinetic Model
Pharmacokinetics describes what happens to a drug in the body and is used to study the time course of drug absorption, distribution, metabolism, and excretion processes. We assume that the concentration of the drug that reaches the podocyte cells through filtration of the blood in a glomerulus is the same as the concentration in the systemic blood plasma. Therefore, we use the same PK model [15] for both the local and the systemic RAS. Briefly, a single-compartment model with first-order absorption and first-order elimination rates for ACE inhibitor drugs after oral administration is used. The analytical solution for the concentration of the biologically active diacid form of the drug for repeated doses over time t with uniform dose size d at constant time intervals is [15,36]
where is the drug concentration after the nth drug dose, is the time after the nth dose, is the absorption rate constant, is the elimination rate constant, and is the ratio of the volume of distribution to the fraction of the drug absorbed. The parameters for benazepril obtained from patients with normal renal function (NRF) and impaired renal function (IRF) are listed in Table 1.
2.2. Pharmacodynamic Model
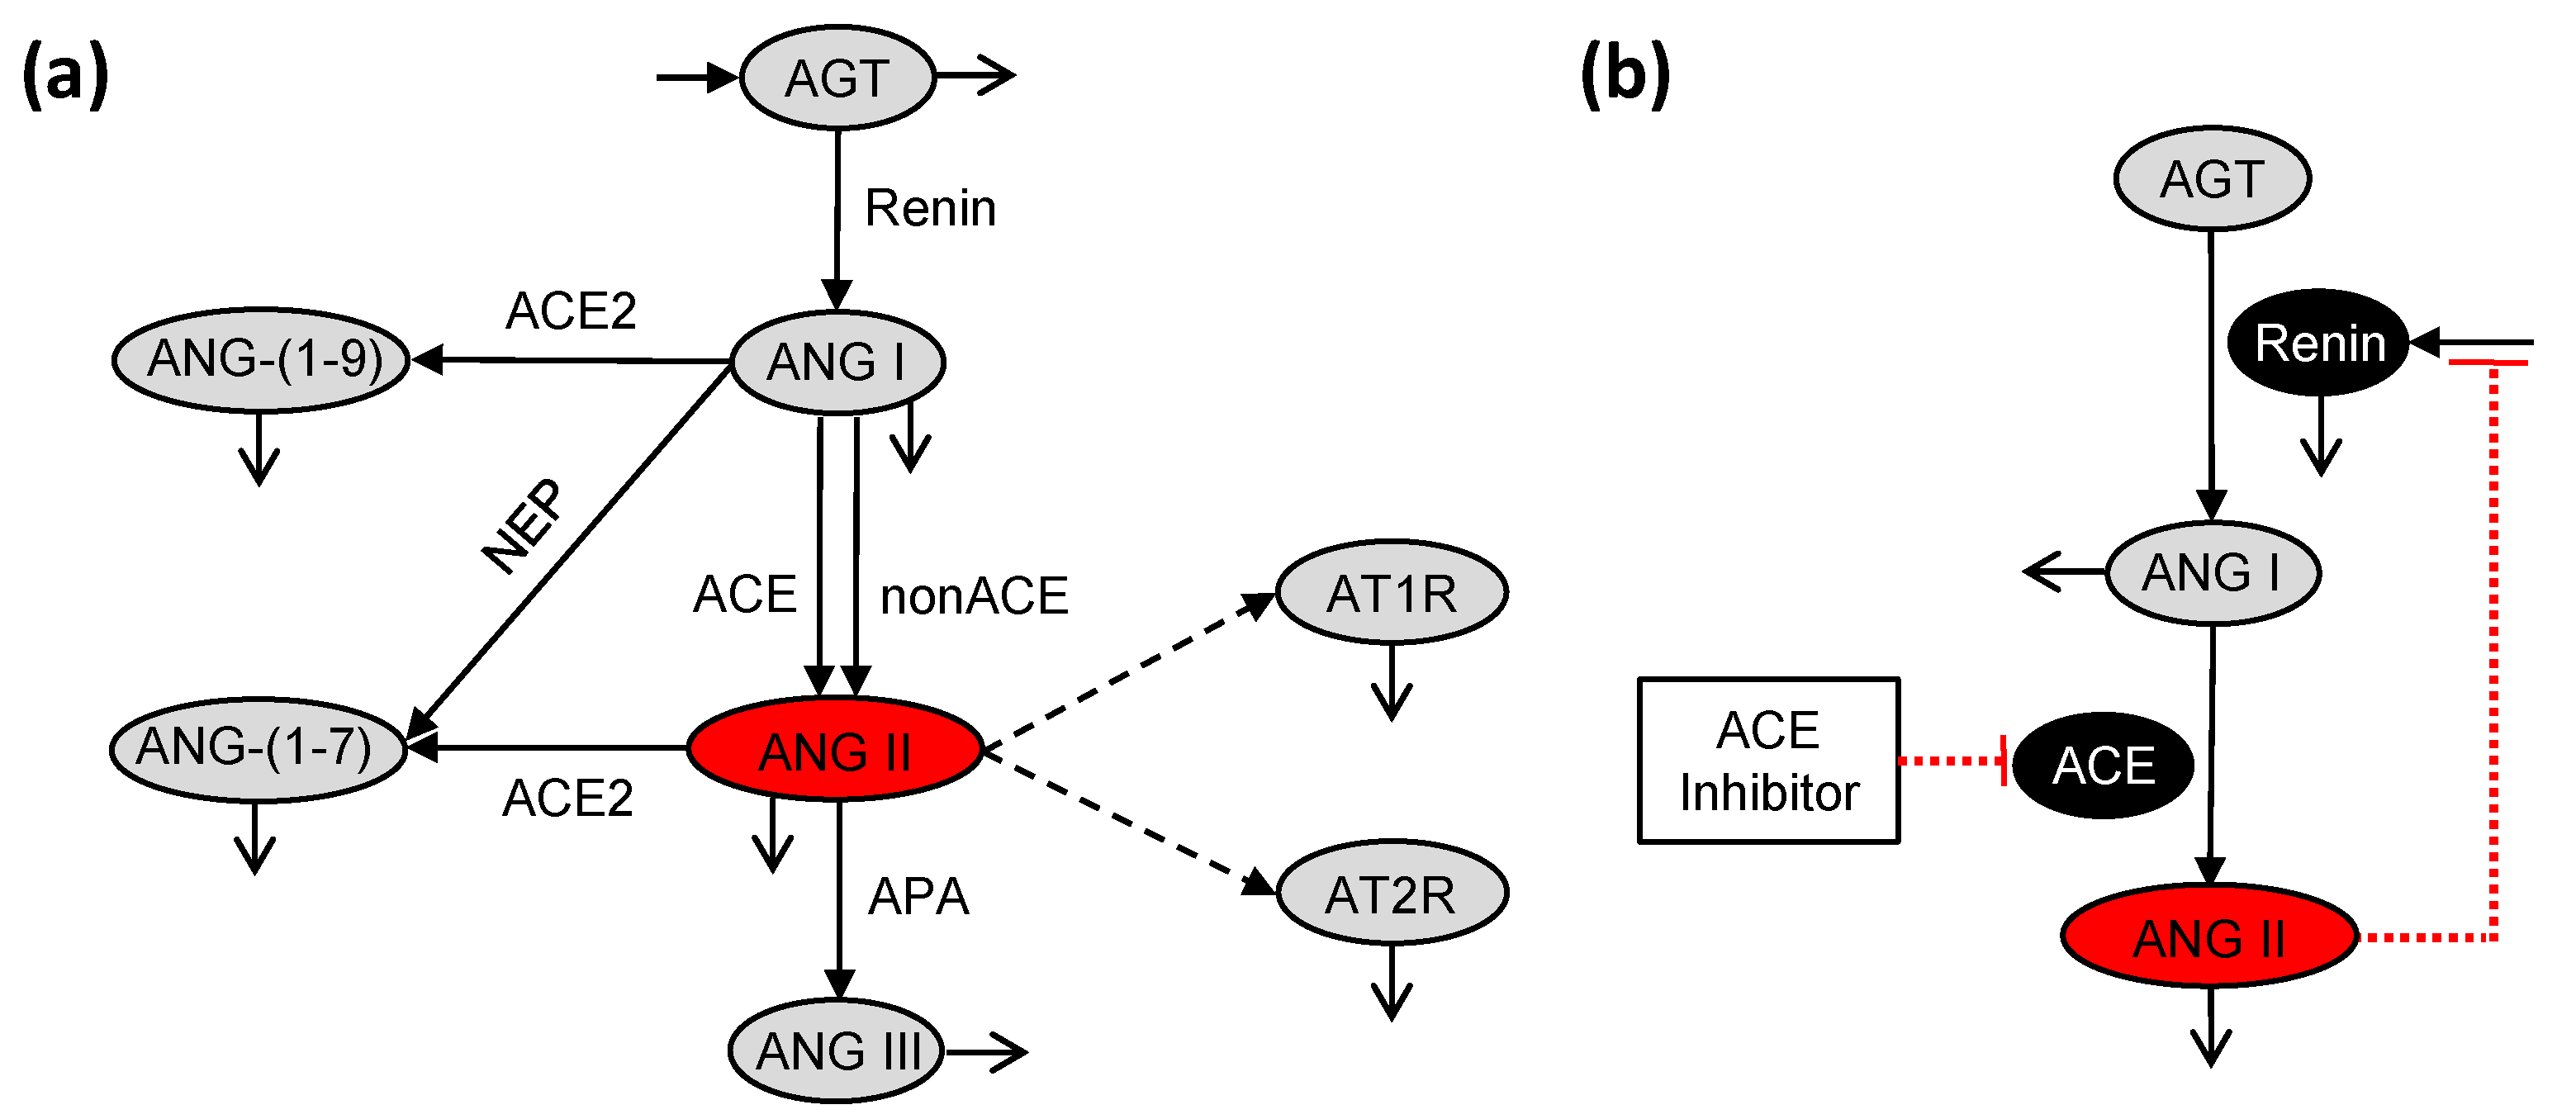
Pharmacodynamics is the study of the mechanism and the effects of the drug on the body. Here, the PD model depends on the reactions in the RAS, where the drug inhibits the conversion of ANG I to ANG II. The local RAS (Figure 1a) differs from the systemic RAS (Figure 1b) with respect to the reaction network and the parameter values [7,30]. Hence, the PD model developed in ACEInhibPKPD [15,17] is not used directly, and we have modified it to be relevant to the local RAS in podocytes.
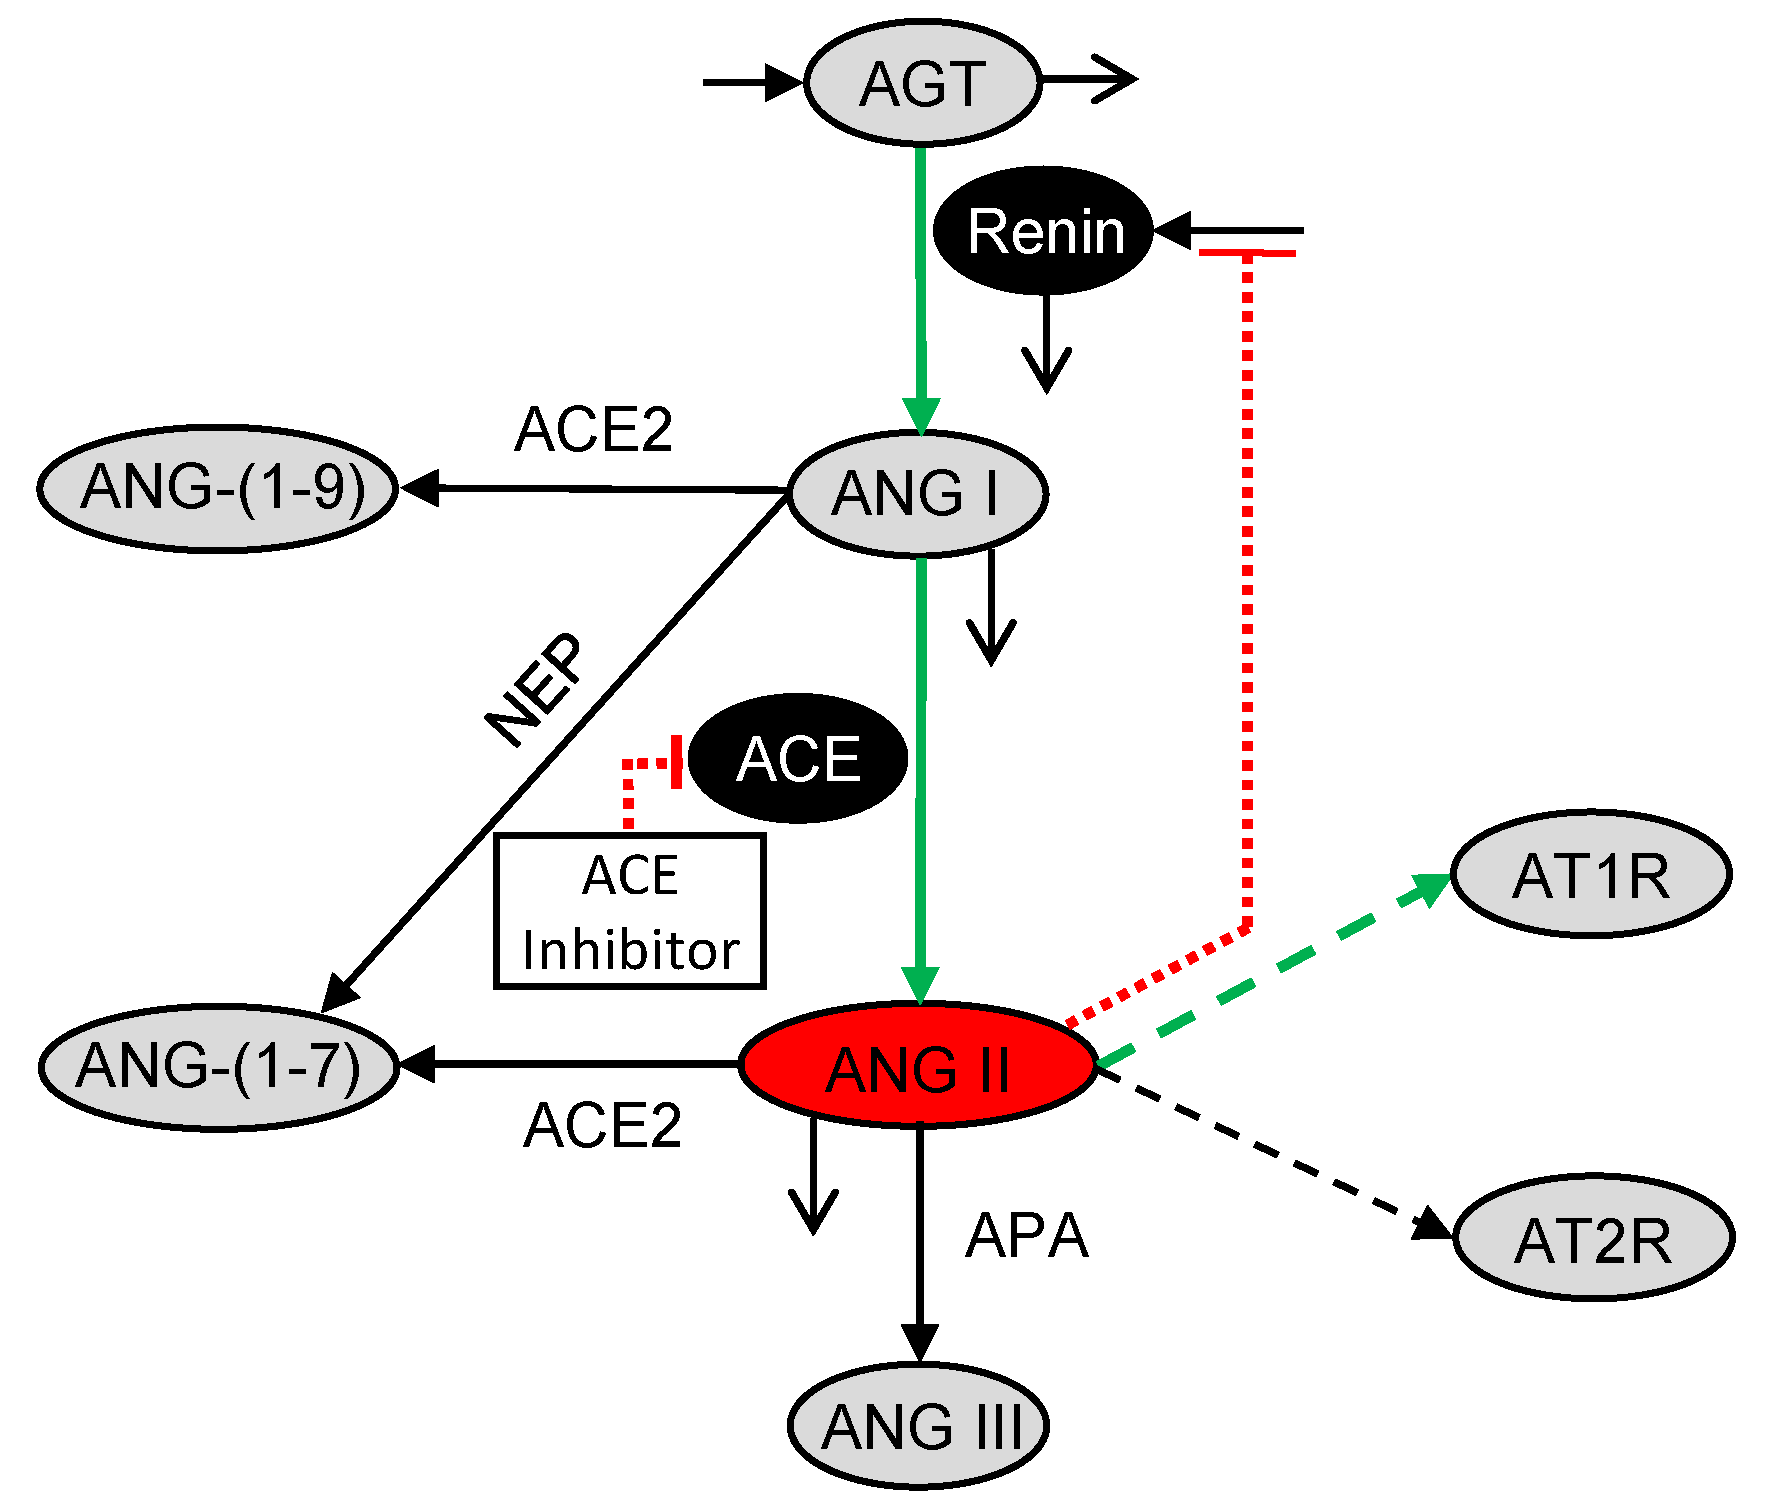
The podocyte local RAS (Figure 1a) as modeled in glucoseRASpodocytes [30,31] has more reactions than the systemic RAS (Figure 1b) as modeled in ACEInhibPKPD [15,17] including the non-ACE pathway for conversion of ANG I to ANG II, production of ANG-(1-9) and ANG-(1-7) from ANG I, production of ANG III and ANG-(1-7) from ANG II, and binding of ANG II to angiotensin II receptor type 1 (AT1R) and angiotensin II receptor type 2 (AT2R). These reactions are specific to the podocyte local RAS and are not considered in ACEInhibPKPD. The reactions for conversion of ANG I to ANG II by ACE and non-ACE enzymes (Figure 1a) are lumped into a single reaction (Figure 2). An ordinary differential equation (ODE) for change in angiotensinogen (AGT) concentration with respect to time was included in glucoseRASpodocytes although it was absent in ACEInhibPKPD. This AGT equation is used in the present model. AGT is a peptide upstream of ANG II that is consumed at a rate sensitive to glucose concentration in podocytes, and the ANG II concentration indirectly depends on the concentration of AGT. The conversion of ANG I and ANG II into downstream peptides and the binding of ANG II to AT1 and AT2 receptors are included here (Figure 2) as in glucoseRASpodocytes. Glucose dependency was incorporated in the glucoseRASpodocytes model through the rate parameters for some of the reactions. This glucose dependency is preserved here (green arrows in Figure 2). glucoseRASpodocytes included ODEs for the concentrations of ANG-(1-7), ANG-(1-9), ANG III, AT1R-bound ANG II, and AT2R-bound ANG II. Here, these species are not tracked explicitly as their concentrations do not influence ANG II.
glucoseRASpodocytes focused on the local RAS, but it did not include the impacts of any drugs on the local RAS. Additionally, the negative feedback of ANG II concentration on the production of renin, which is the enzyme involved in the conversion of AGT to ANG I, was included in ACEInhibPKPD (Figure 1b) but was lacking in glucoseRASpodocytes (Figure 1a). In the present model, we adapt the model from glucoseRASpodocytes for the local RAS by incorporating the effects of an ACE inhibitor drug and the negative feedback of ANG II on renin from ACEInhibPKPD [15]. The resultant glucose-dependent biochemical reaction network for the podocyte local RAS PD model for ACE inhibition is illustrated in Figure 2.
The PD model consists of the constant volume mass balances for four chemical species: AGT, renin, ANG I, and ANG II. Concentrations are denoted by species names inside of square brackets. The glucose-dependent rate parameters are denoted by c’s, and the glucose-independent rate parameters are denoted by k’s.
The mass balance for AGT is [30]
where is the constant production rate of AGT, is the glucose-dependent rate parameter for renin-catalyzed conversion of AGT to ANG I, and is the half-life for the degradation of AGT.
The mass balance for renin is [15]
where is the constant source of renin in the absence of feedback, the second term is the influence of ANG II negative feedback on renin production, is the initial concentration of ANG II, and f are parameters for the feedback, and is the half-life for the degradation of renin. The renin source term is computed at steady state by [15]
where is the initial concentration of renin.
The mass balance for ANG I is [15,30]
where the first term represents the glucose-dependent renin-catalyzed contribution to the production of ANG I from AGT, the second term represents the change to ANG I synthesis from AGT due to the feedback of ANG II on renin with rate constant , the third term is the ACE-catalyzed conversion of ANG I to ANG II that is subject to inhibition I by the drug and has a glucose-dependent rate parameter , the fourth term is the consumption of ANG I to form ANG-(1-7) and ANG-(1-9) with the glucose-independent rate parameters and , respectively, and is the half-life for the degradation of ANG I. The first and second terms in (5) both consider the production of ANG I from AGT catalyzed by renin. The first term is from glucoseRASpodocytes and includes glucose dependence in the absence of the ANG II-renin feedback mechanism. The second term is from ACEInhibPKPD to incorporate the effects of the feedback mechanism on changing the production rate.
The mass balance for ANG II is [15,30]
where the first term is the production of ANG II in the presence of ACE that is subject to inhibition I by the drug; the second term is the consumption of ANG II as it converts into downstream peptides and binds to AT1 and AT2 receptors; is the glucose-dependent rate parameter for binding of ANG II to AT1 receptor; , , and are the glucose-independent rate parameters for binding of ANG II to the AT2 receptor and conversion of ANG II to ANG III and ANG-(1-7), respectively; and is the half-life for degradation of ANG II.
The observed percent inhibition I of benazepril is described by a Hill-type function as [37]
where is the drug concentration that yields 50% inhibition, and m accounts for the degree of sigmoidicity.
Glucose dependency is included in the parameters designated by , where Renin, ACE, and AT1. In glucoseRASpodocytes [30] these parameters were found to be the most sensitive and were each considered to be a linear function of glucose. The glucose-dependent parameters are calculated using [30]
where is the concentration of glucose and the coefficients and in (8)–(10) are obtained from parameter estimation detailed in [30].
The feedback parameters and f were originally estimated for the systemic RAS in ACEInhibPKPD. However, these parameters are formulated in terms of deviation variables in (3). Because the magnitude of initial values and deviations are drastically different in the local RAS as compared to the systemic RAS, we scale the parameters and f for the podocyte local RAS model as
where and are the values of the feedback parameters estimated in [15], is the initial ANG II concentration for the systemic RAS NRF case, and is the initial ANG II concentration for the local RAS (for both NRF and IRF). In Section 3.2, we explore the impacts of the uncertainty in these parameters.
The PD parameter values and their sources are listed in Table 2. For the systemic RAS model, the PK and PD parameters and the initial conditions are different for the NRF and IRF cases. However, due to insufficient information about the local RAS, only the PK parameters (Table 1) are varied for the cases of NRF and IRF, while the PD parameters and initial concentrations (Table 2) for the local RAS model are kept the same for both NRF and IRF.
2.3. Numerical Methods and Code Repository
The podocyte-specific, glucose-dependent RAS PD model in Section 2.2 is connected to the PK model described in Section 2.1 to predict the dose-response relationship of benazepril and glucose dynamics on ANG II. The PK/ PD model (1)–(12) forms a set of ODEs and algebraic equations that are solved simultaneously using the ode45 ODE solver in MATLAB (Version R2017b, The MathWorks, Natick, MA, USA, 2017). The relative tolerance is set to 10. The time step is restricted to an upper bound of , where is the dosage interval. To enable code reuse, the MATLAB codes for the mathematical model including parameter values and documentation are available online in an open-source software repository [38].
3. Results and Discussion
The PK/PD model developed in Section 2 was solved to compute and as functions of time. We considered the following model inputs: drug dose size, number of doses per day, renal function (normal or impaired), and glucose concentration (constant as well as dynamic for a representative normal subject or diabetic subject). We studied combinations of these conditions using the model and compared the local RAS model results to the corresponding scenarios using the systemic RAS model to understand the differences between the local and systemic RAS. The simulations were started at the initial conditions corresponding to the case, i.e., for the local RAS for NRF and IRF, for the systemic RAS for NRF, and for the systemic RAS for IRF. We also analyzed the effects of varying uncertain parameters used in the model.
The local RAS PK/PD model was simulated for constant cases and two cases of dynamic . The constant cases ranged between the extremes of normal glucose (NG) at 5 mmol/L and high glucose (HG) at 25 mmol/L based on experimental studies [11,39,40]. The dynamic cases used representative profiles for normal (non-diabetic) and diabetic subjects [41]. The systemic RAS PK/PD model [15] was used for comparison to the local comparison with podocyte local RAS model developed here.
3.1. Effects of Doses of Benazepril
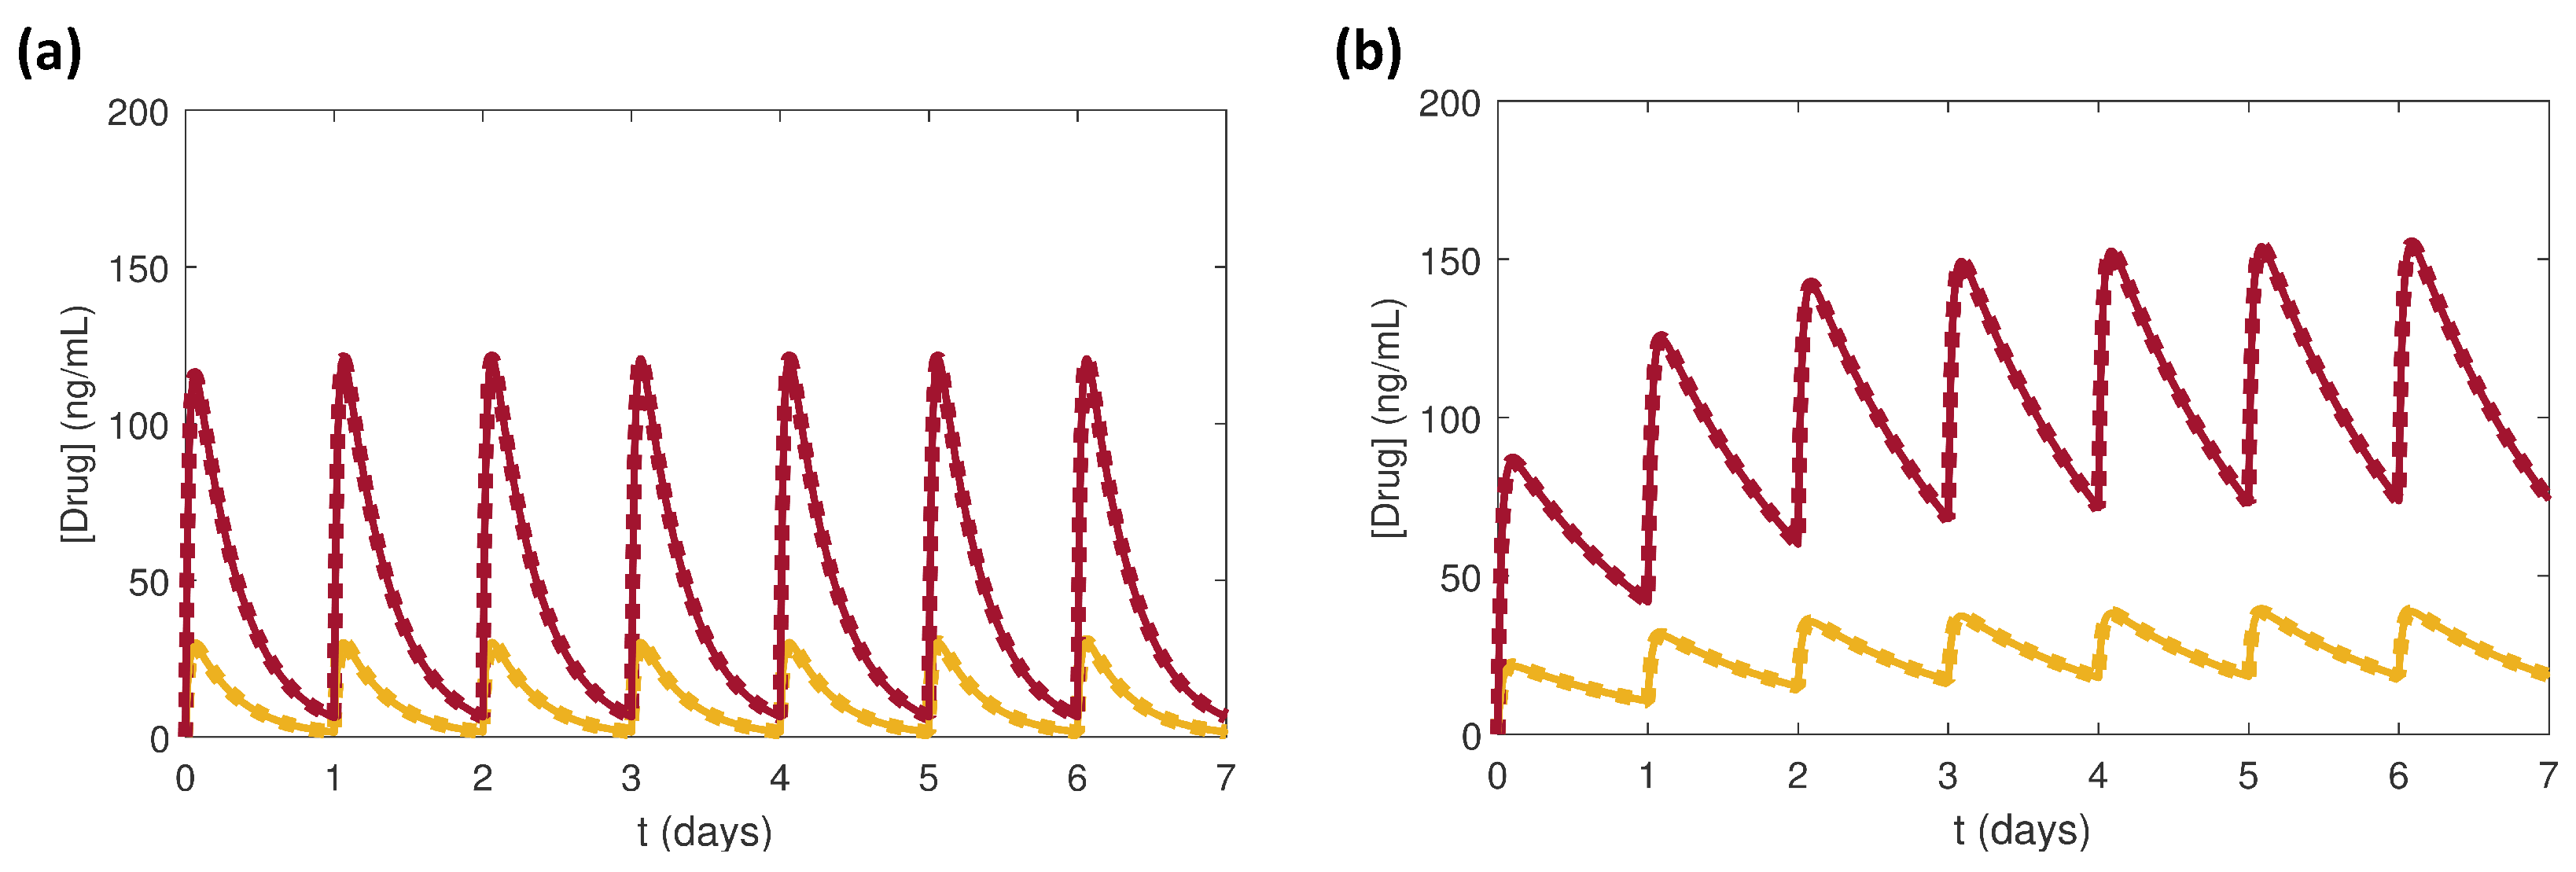
Benazepril doses of 2.5 mg and 10 mg for the cases of NRF and IRF were simulated and compared between the local and systemic RAS. Administration of a once daily dose of benazepril was repeated for seven days. Because the systemic RAS model did not have glucose dependency, the local RAS model was kept at constant NG conditions where = 5 mmol/L for fair comparison between the models. The effects of the drug dosages in the local and systemic PK/PD models were compared for (Figure 3) and (Figure 4).
As mentioned in Section 2.1, the local and systemic RAS models had the same PK parameters, which only varied between the NRF and IRF cases (Table 1). As expected the profiles in the local and systemic RAS overlapped due to the PK parameters (Figure 3).
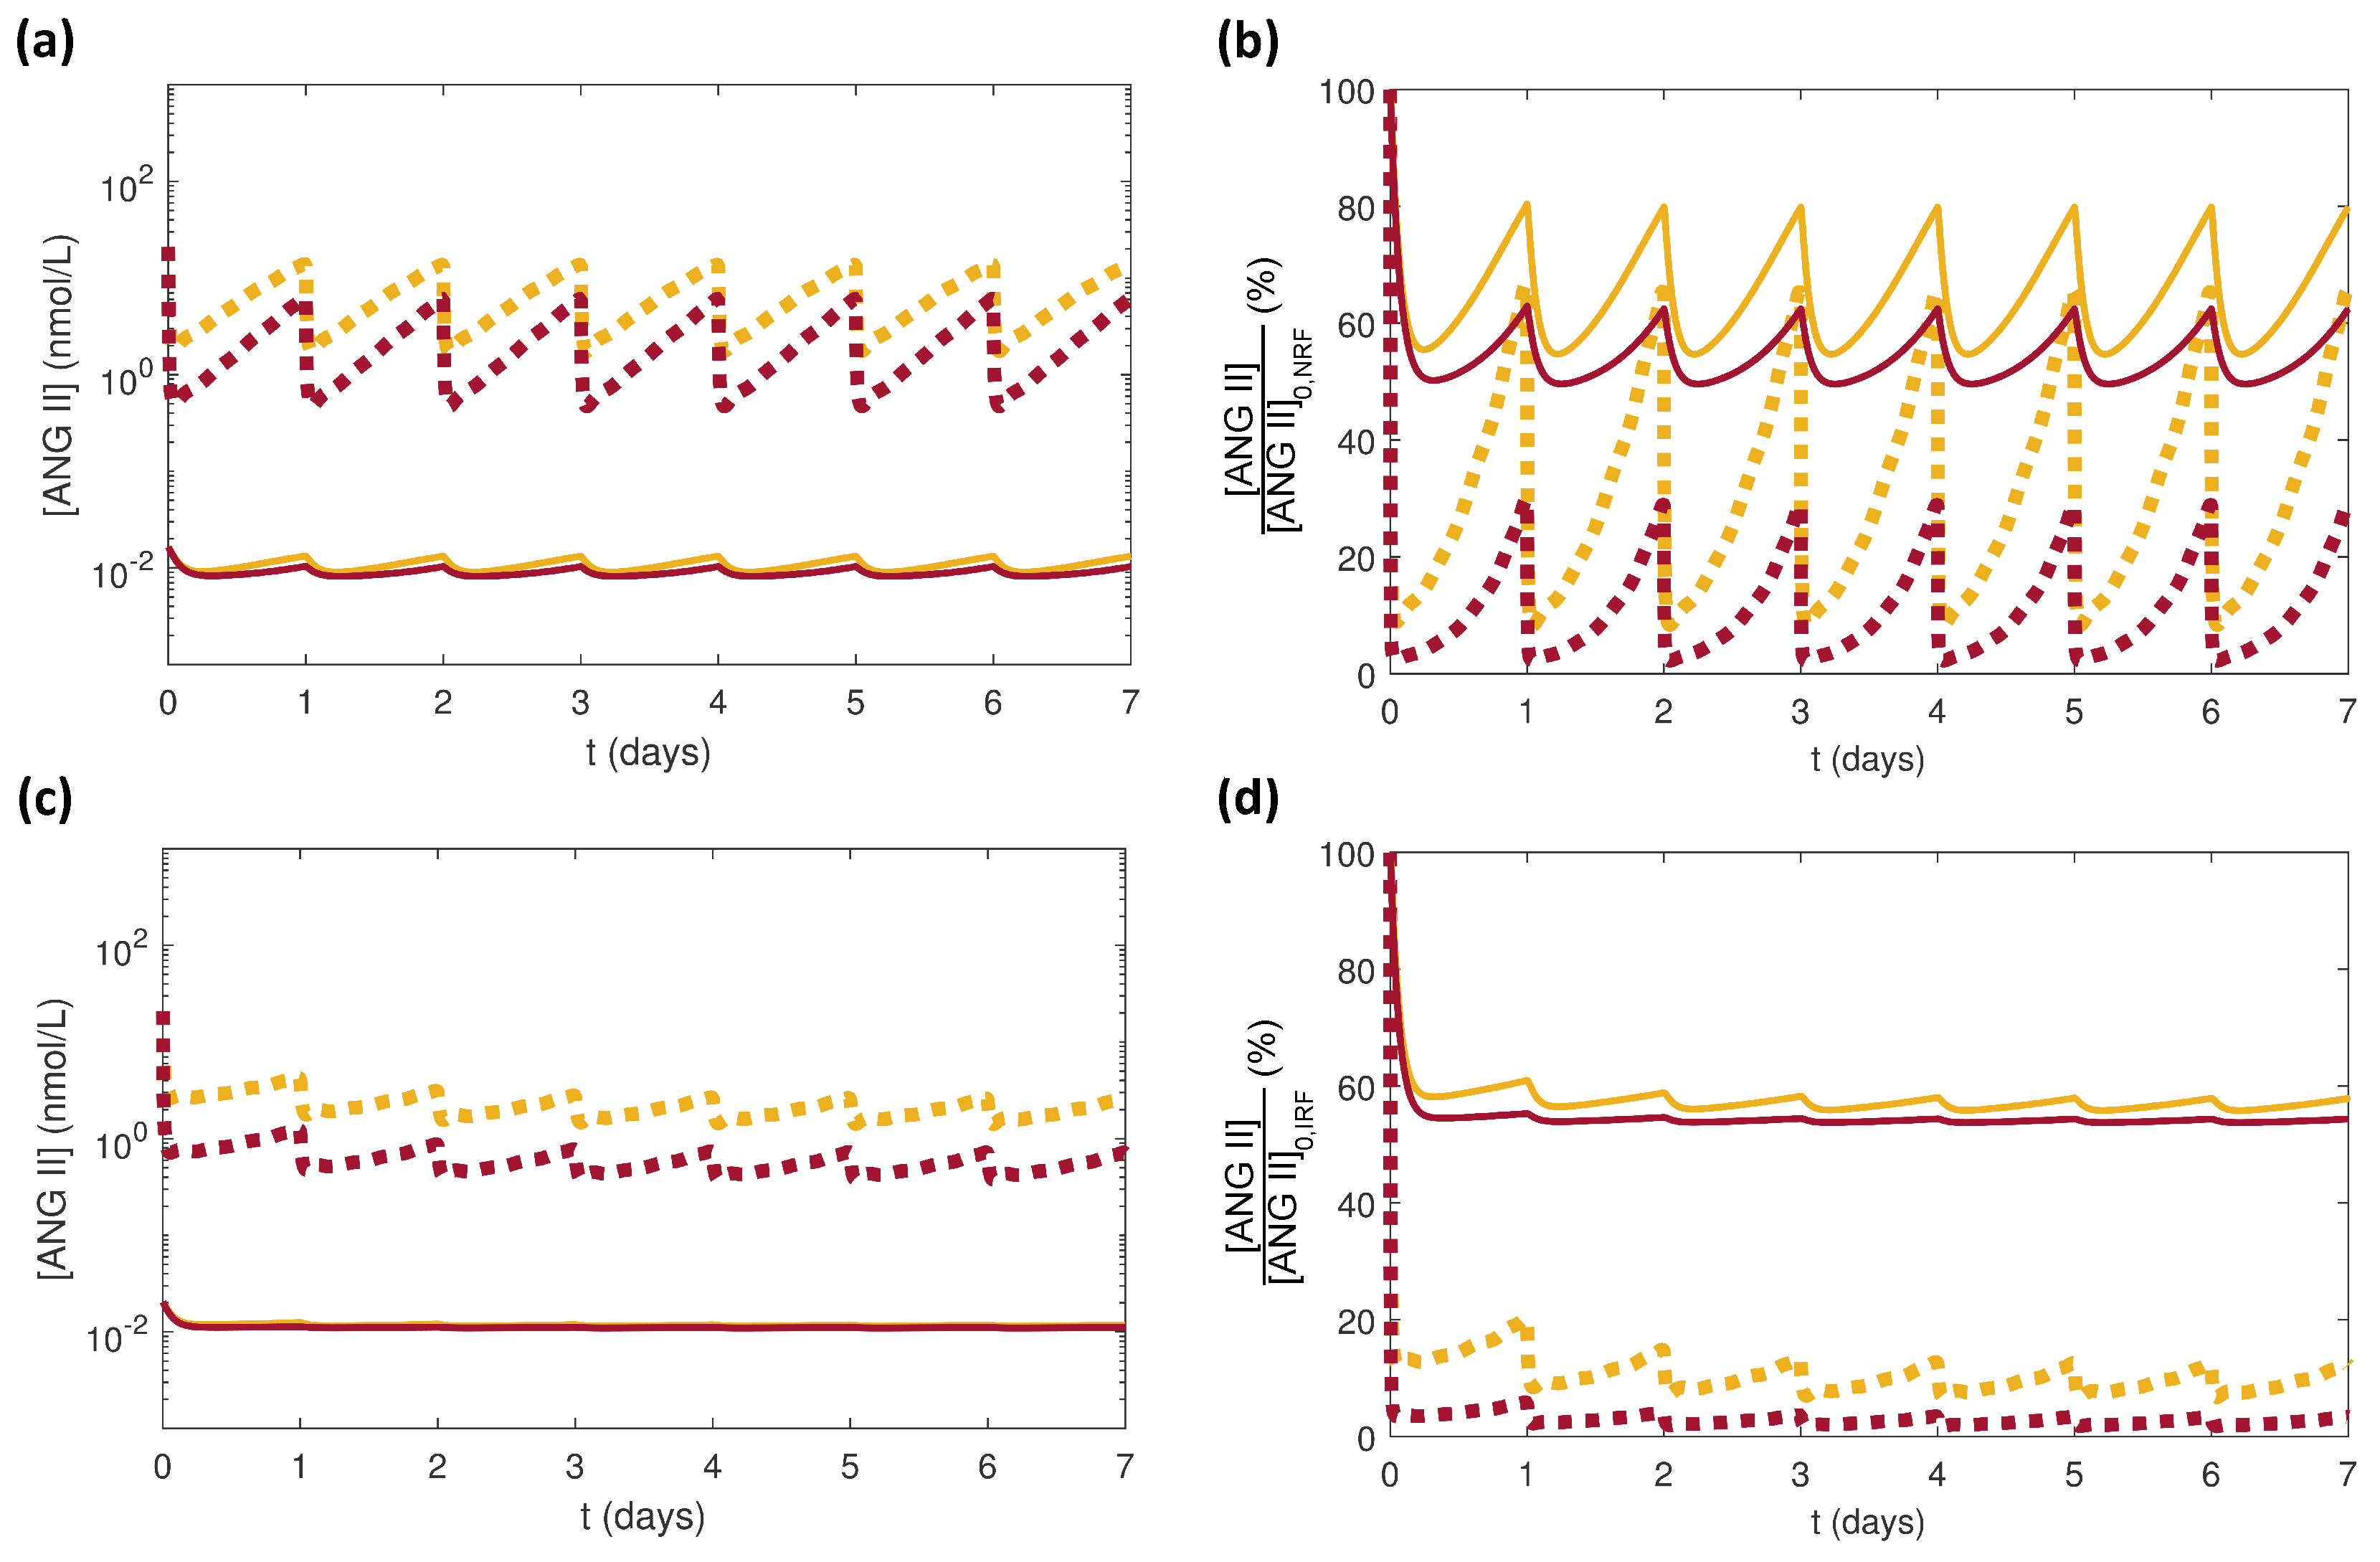
Although there was no difference between profiles for the local and systemic RAS (Figure 3), the resulting effects on were different (Figure 4). For both renal function cases NRF and IRF, was lowered more substantially by the larger dose of benazepril (Figure 4). In all cases, was larger in the local RAS than in the systemic RAS (Figure 4a,c). The normalized decreased more drastically for the local RAS than for the systemic RAS (Figure 4b,d). These results agreed with the clinical observation that the systemic inhibition of ANG II by ACE inhibitors is not always accompanied by elimination of high in kidneys [13]. The differences between NRF (Figure 4a,b) and IRF (Figure 4c,d) responses were due to the enhanced accumulation due to smaller for IRF.
3.2. Effects of Varying the Uncertain Feedback Parameters
Most of the parameters in the local RAS model were either taken from the literature or estimated based on previous experimental observations. The feedback parameters and f were uncertain, as discussed in Section 2.2. Without clinical data to verify the scaled values of and f for the local RAS, we analyzed the effects on of varying these parameters in a wide range. The values for and f calculated from (11) and (12) were considered as the nominal values and were varied by approximately four orders of magnitude above and below their nominal values (Table 3). Fifty random values were selected for each parameter assuming a uniform distribution within its range. Latin hypercube sampling (LHS) [42,43] was used to generate the combinations of and f values. Simulations were performed using the model for these 50 sets of parameters, each set with a random pairing of and f. The simulation conditions were set to NRF and NG, and a single 5 mg dose of benazepril was administered after 24 h.
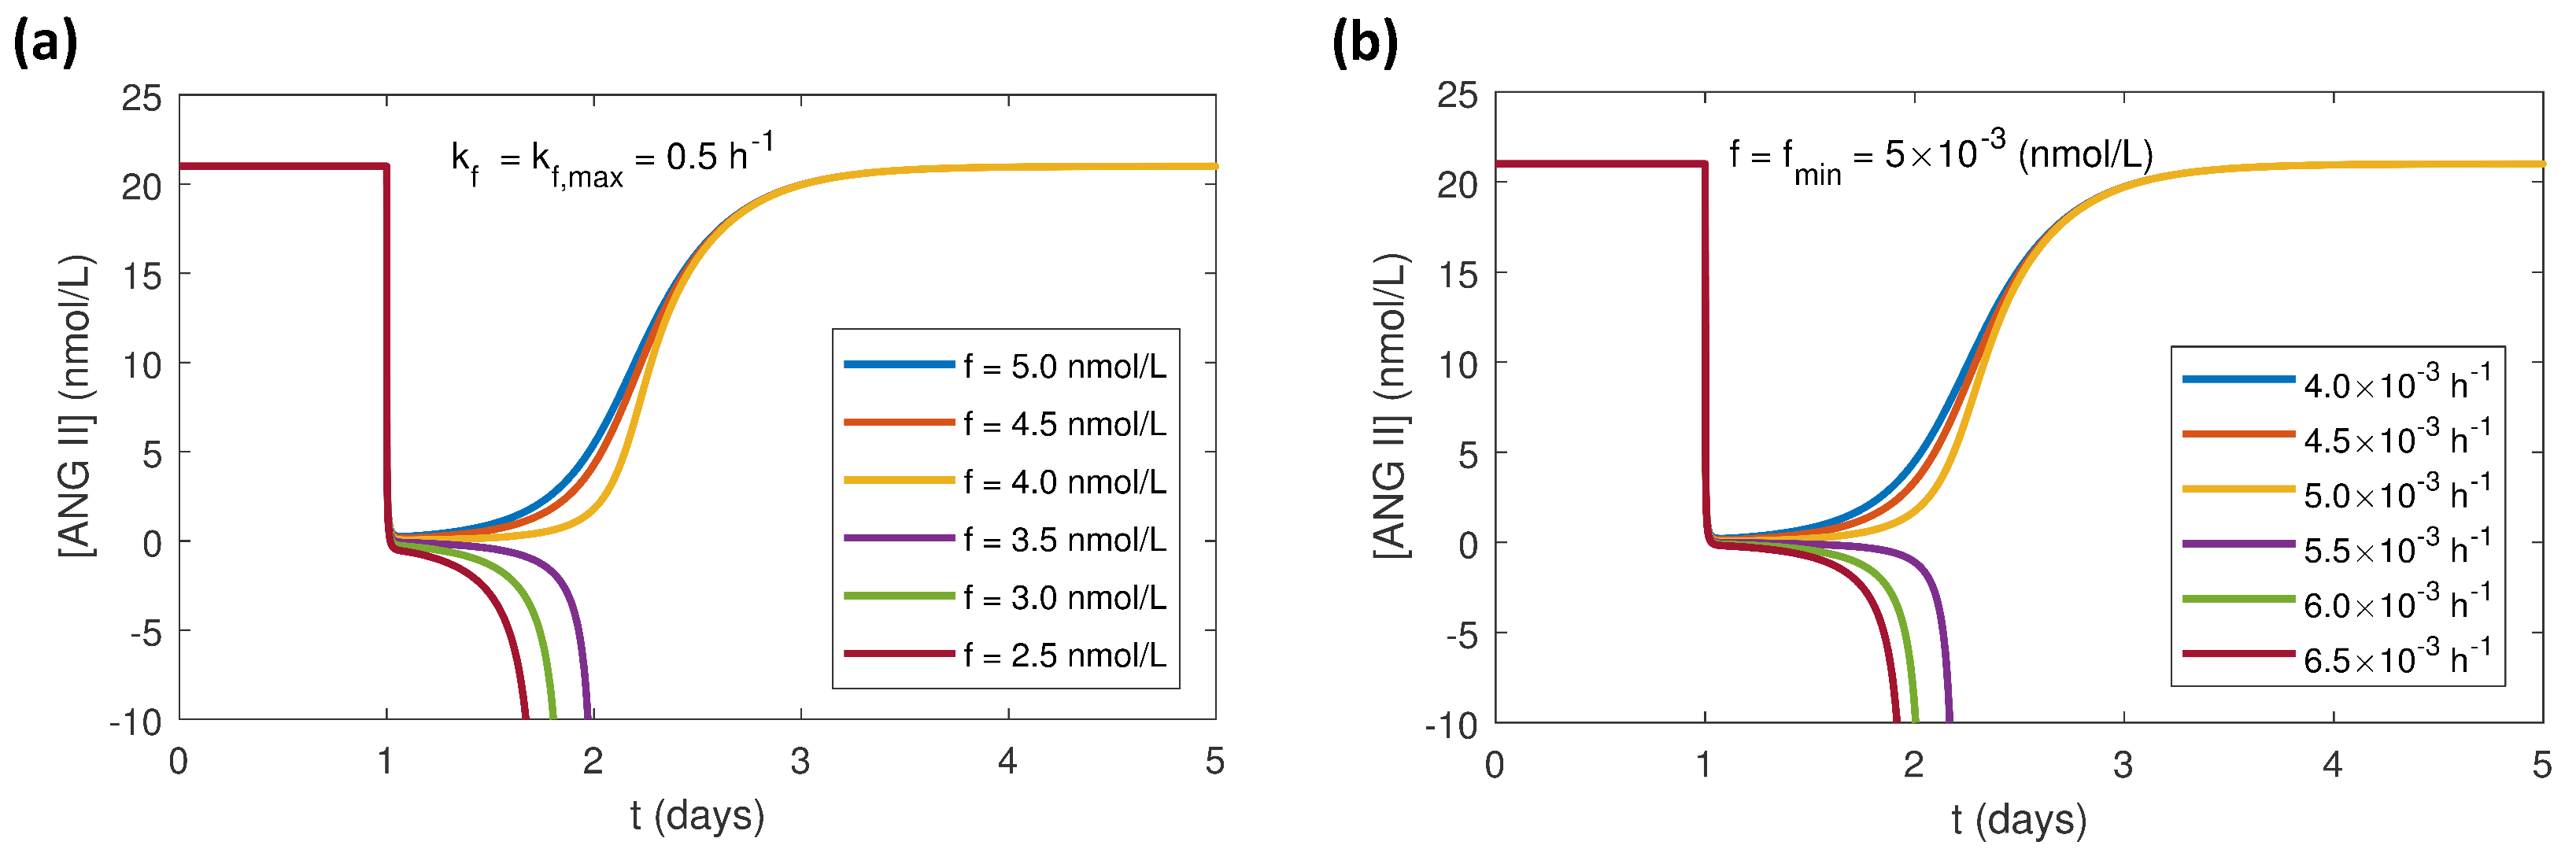
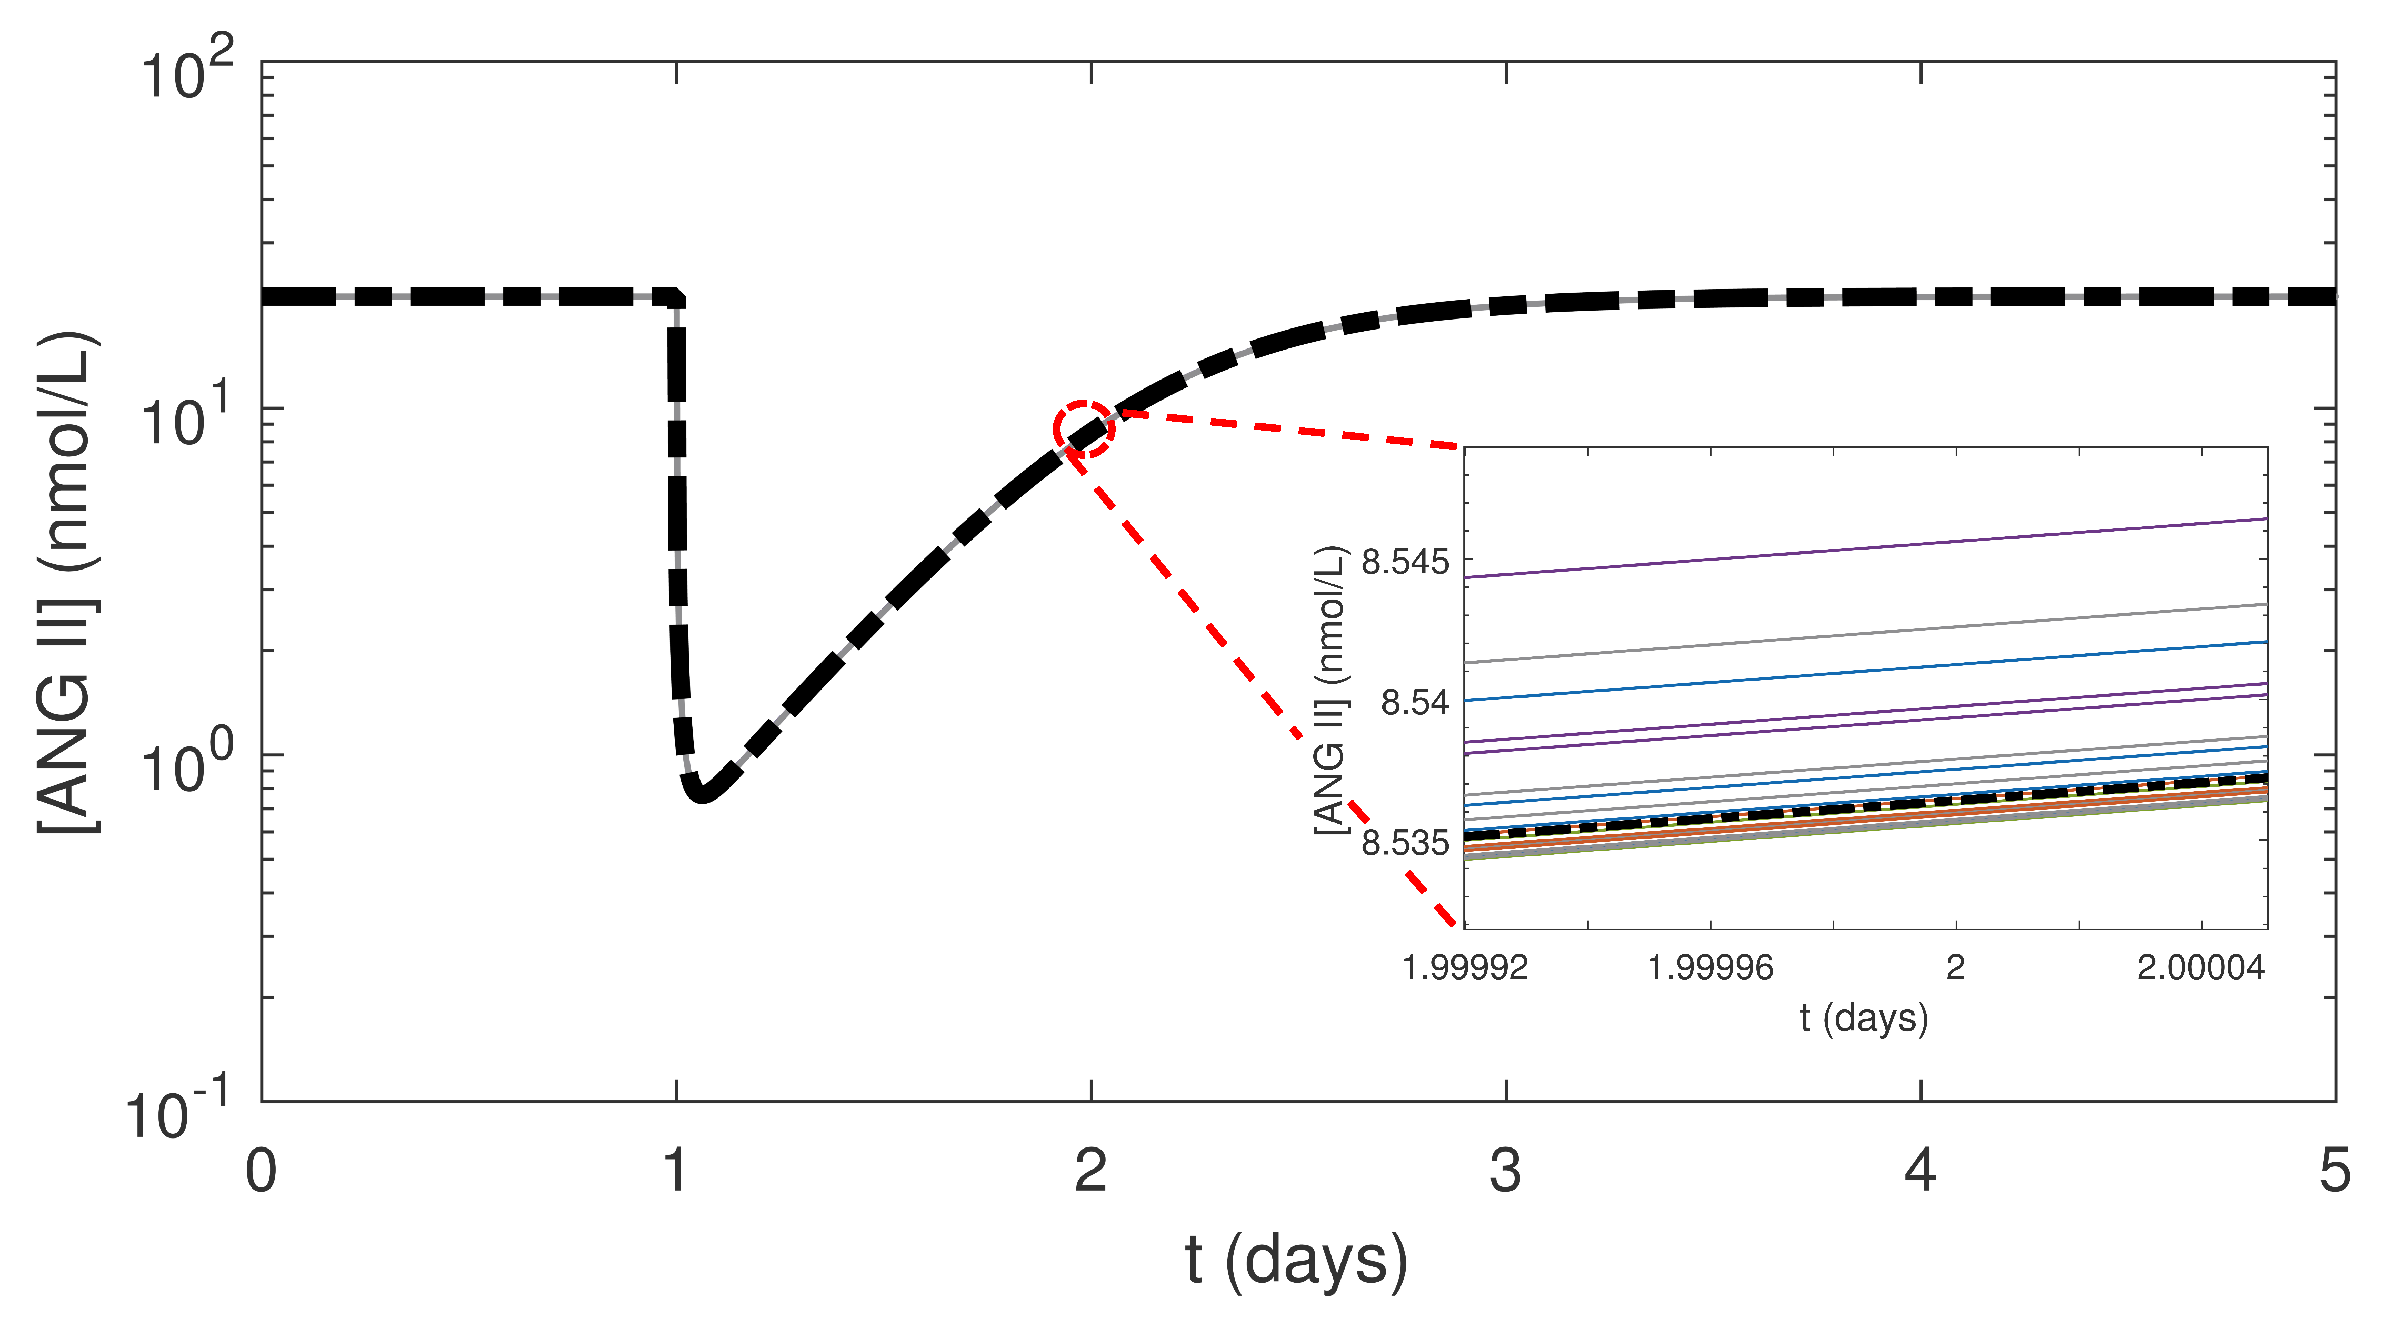
The results (not shown) generated for some simulations, which is not physically possible. To explore the parameter extrema, different combinations of the minimum and maximum values of and f (Table 4) were simulated. The combination of the maximum and the minimum f values was the only case that resulted in . Multiple simulations were run keeping at its maximum value while varying f (Figure 5a) and keeping f at its minimum while varying (Figure 5b) to find a range of values for these parameters that only yield . The results indicated that decreasing f beyond 4 nmol/L while was at its maximum value resulted in . Additionally, increasing above 5 × 10 h while f was at its minimum values resulted in . Based on these results, we defined smaller ranges of six orders of magnitude for (5 × 10 to 5 × 10 h) and f (5 to 5 × 10 nmol/L) that give for all combinations of and f values. The curves for the 50 simulations varied only slightly, and the mean of the results was hardly distinguishable from the aggregate (Figure 6). was insensitive to changes in and f over a wide range of parameter values. The scaled values for and f (Table 3) were well within these ranges, justifying our use of these values in other simulations reported here.
3.3. Effects of Varying PK Parameters
The slopes of the curves for (Figure 3) primarily depend on the rates of absorption and elimination of the drug. Due to the lack of experimental data in the podocyte cells for the values of the absorption and elimination rate constants ( and ), these values for the local RAS PK model were assumed to be the same as in the systemic RAS (Table 1). However, in a physiological system, a drug must cross various biological barriers and cell membranes to move from systemic circulation into tissues or cells. The ability of the drug to reach targeted tissues or cells depends on multiple factors such as concentration gradients, carrier proteins, protein binding, and other physicochemical interactions. Considering all these factors, it is highly probable that and for the local RAS would be different than for the systemic RAS.
We used our model to determine how varying and affected the model prediction of . We considered the values of and given in Table 1 for NRF as the nominal values and varied each of the parameters uniformly within a range of two orders of magnitude (Table 5). We used LHS to generate 50 random sets of and values in their respective ranges. We used the same simulation conditions as in Section 3.2.
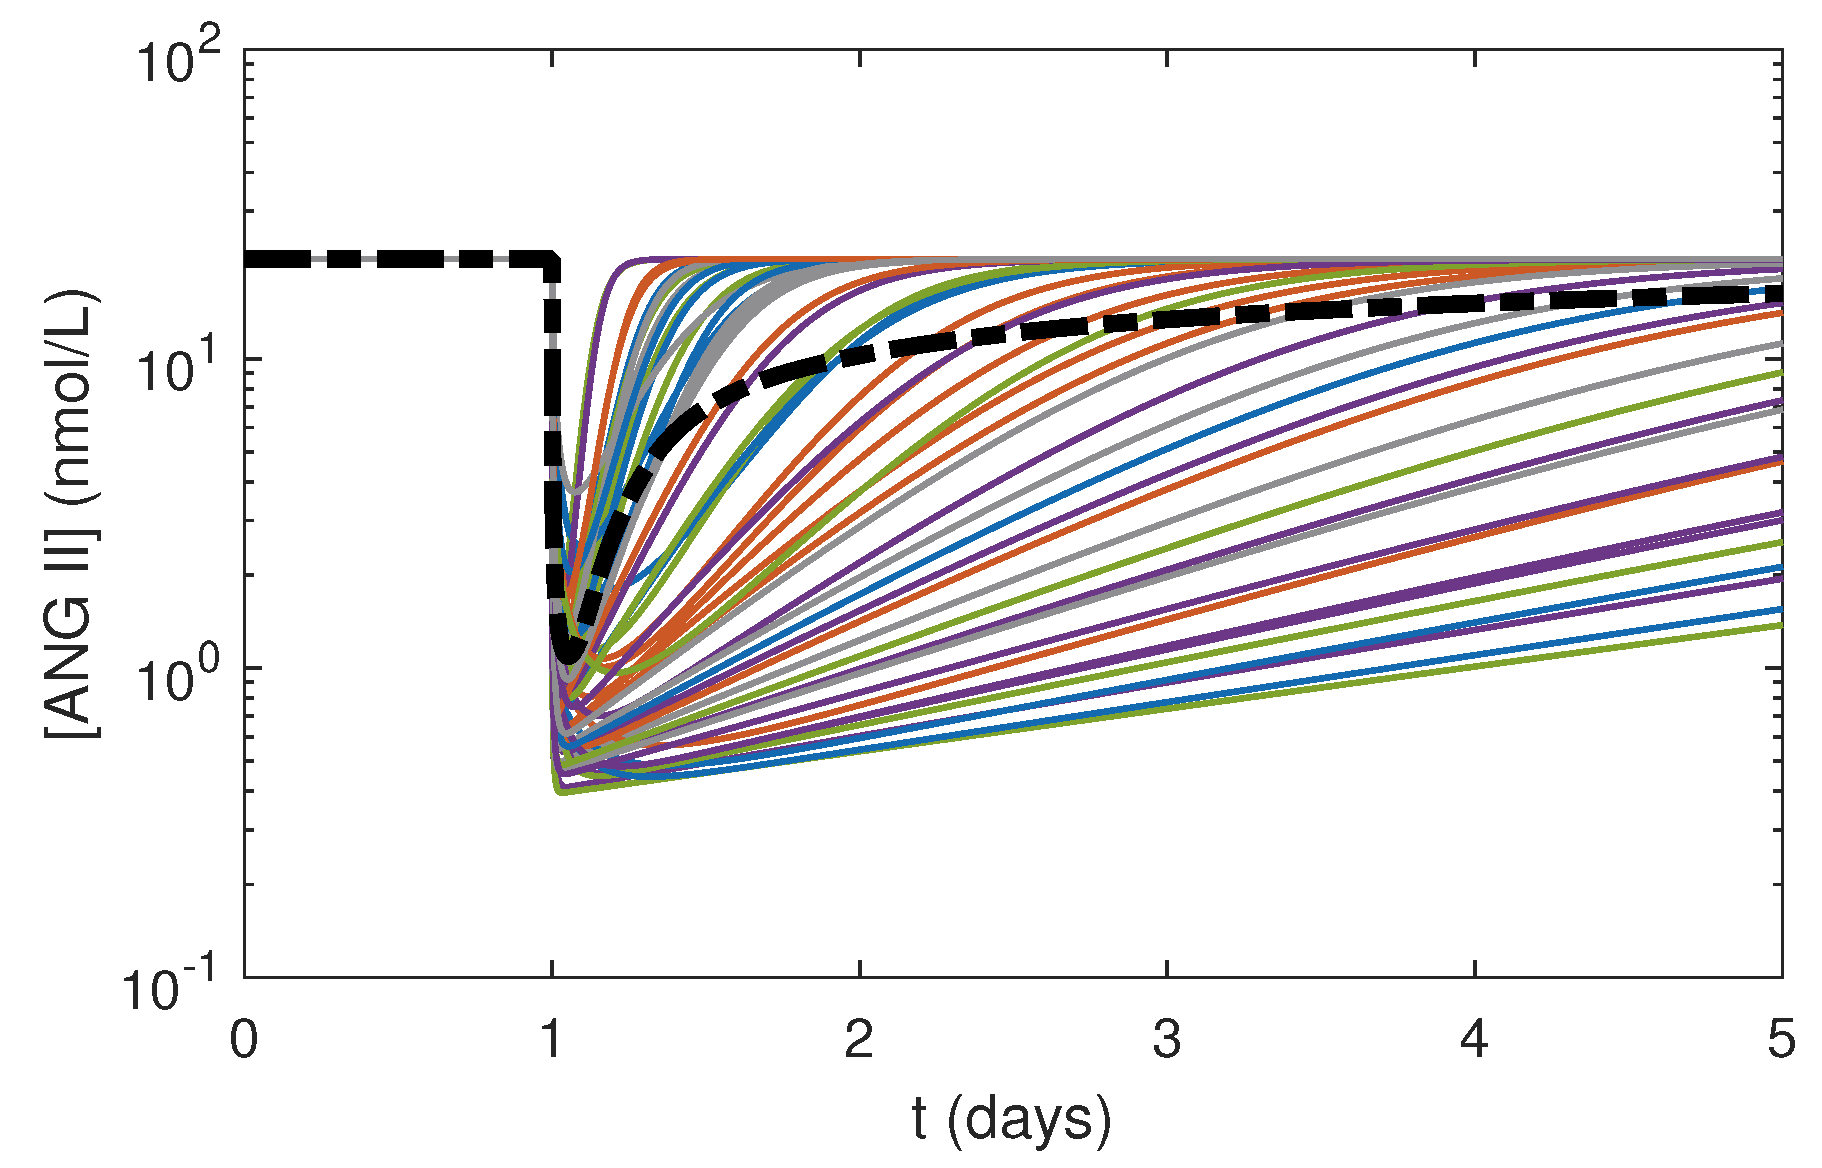
Varying and by small magnitudes had substantial effects on (Figure 7). The profiles spread over a wide range of values with different minimum concentrations and slopes depending upon the values of and . These results indicated that was highly sensitive to both and . Further experimental studies focusing on drug pharmacokinetics in the local system need to be conducted to measure and in kidney tissues to enhance the accuracy of the model predictions.
3.4. Effects of Glucose Conditions
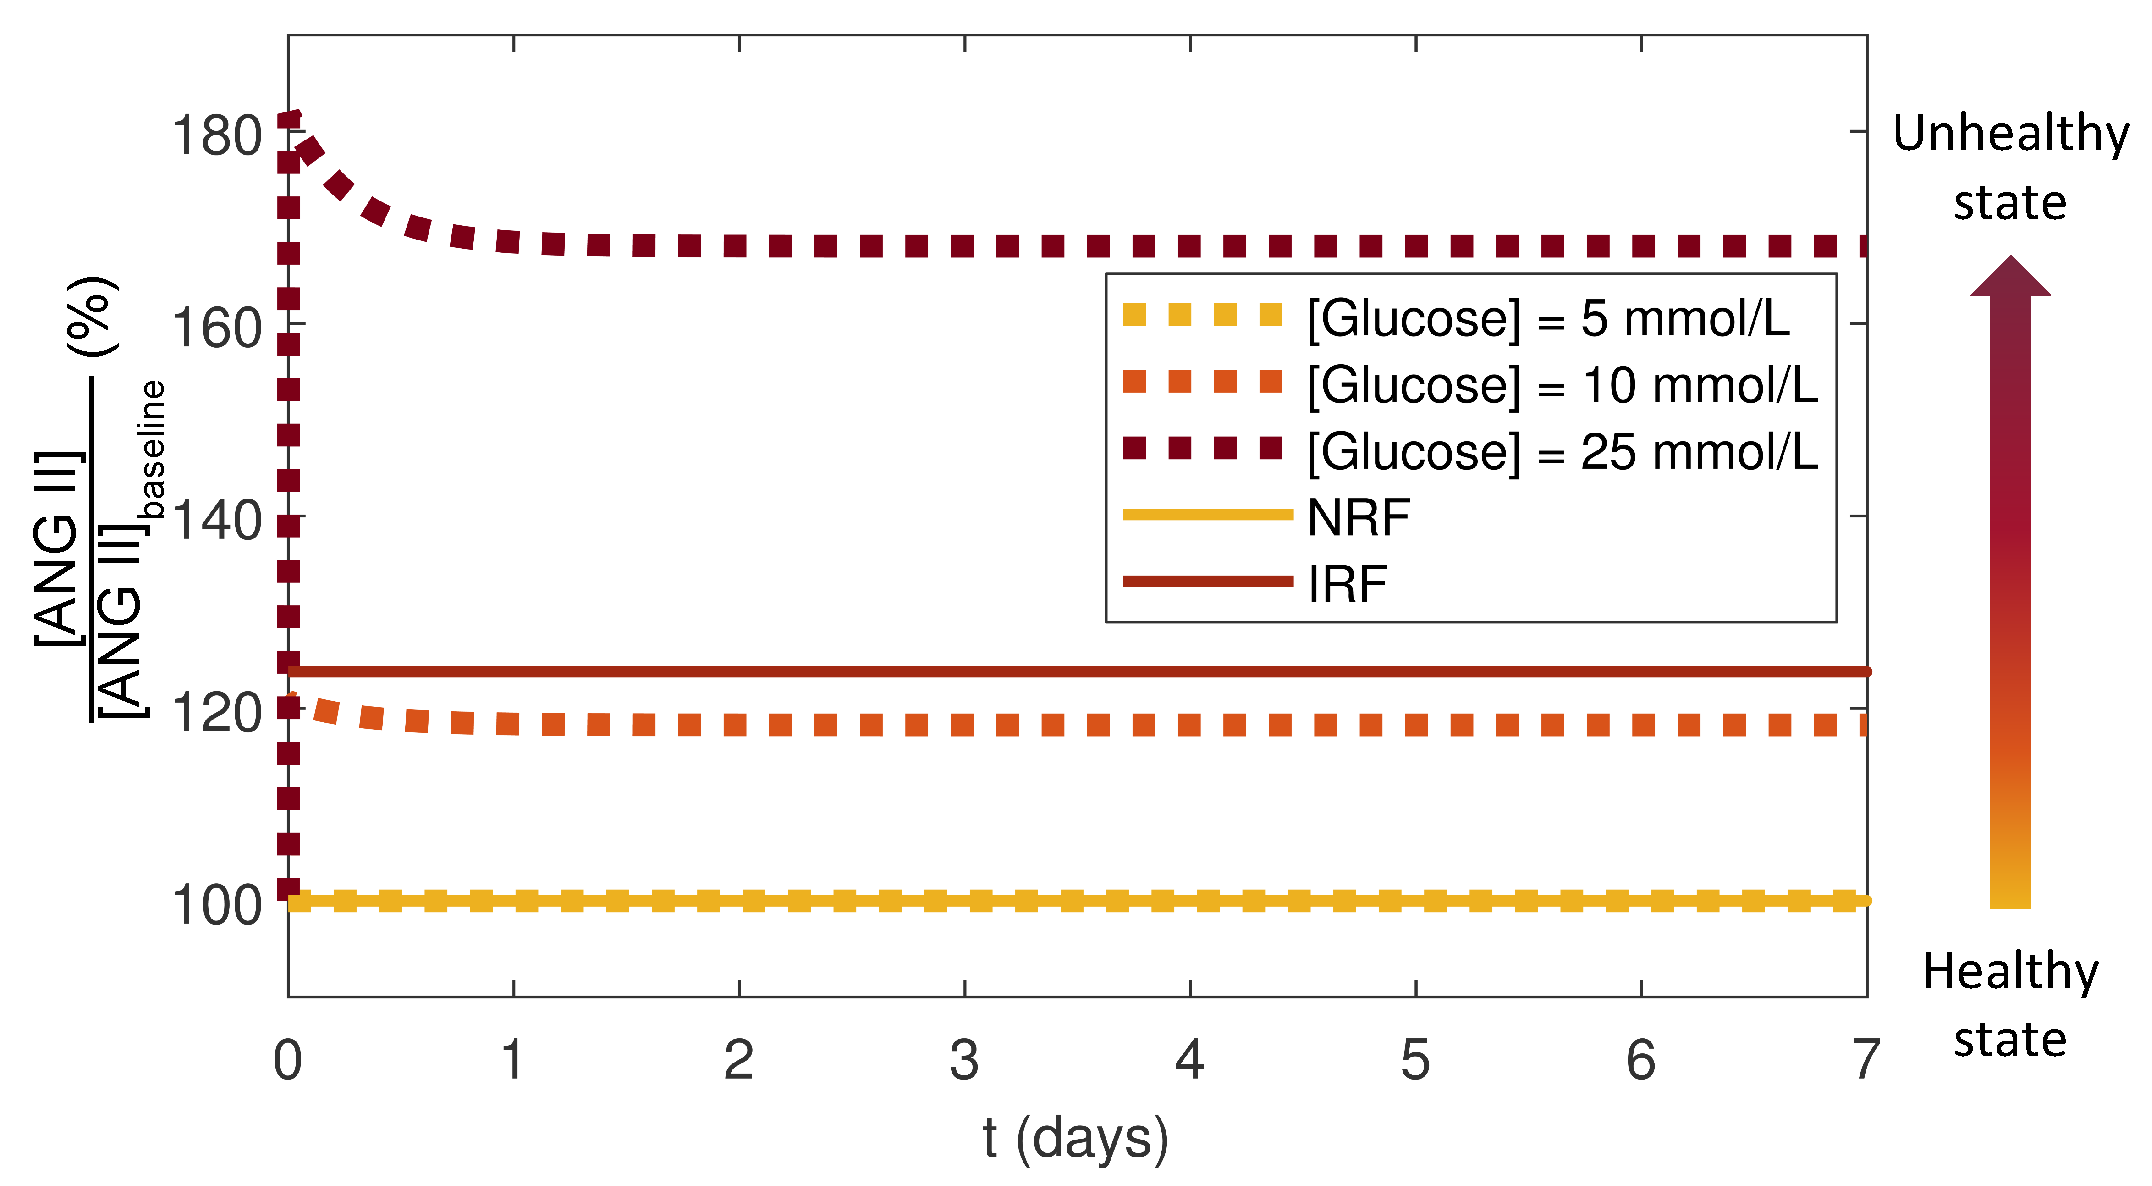
The local RAS was considered to be functioning at a healthy state for the case of NRF and NG, and the initial condition for this healthy state was taken as the ANG II baseline reference: . The local RAS progressed towards an unhealthy state via increases. The systemic RAS was considered to be functioning at a healthy state for NRF and an unhealthy state for IRF. The healthy baseline reference for ANG II for the systemic RAS was . To quantify the deviations from a healthy state in both the local and systemic RAS, values from simulations without a drug dose were normalized by their respective baseline concentrations. Because the magnitude of in the local RAS was larger than that in the systemic RAS, this normalization makes the results of the local and systemic RAS models comparable. The local RAS model was run for NRF over seven days without a drug dose for three cases of constant : 5 mmol/L (NG), 10 mmol/L, and 25 mmol/L (HG). These simulations were compared to the systemic RAS for NRF and IRF cases (Figure 8).
The results showed that the deflected from the healthy state and increased to new steady states as the conditions or renal functions approached an unhealthy state (Figure 8). For the local RAS, the HG case resulted in a 70% increase in as compared to NG. In the systemic RAS, IRF had 23% higher compared to NRF. The normalized steady state for the local RAS at an intermediate value of at 10 mmol/L was similar to that for the systemic RAS for IRF suggesting that some of the impaired characteristics could be recapitulated by a sustained moderately elevated . Studies have suggested a strong link between hyperglycemia-stimulated ANG II and IRF [4,5,44,45]. Thus, our simulation results agreed with these studies showing that increased for the local and systemic RAS models as the conditions moved towards unhealthy states.
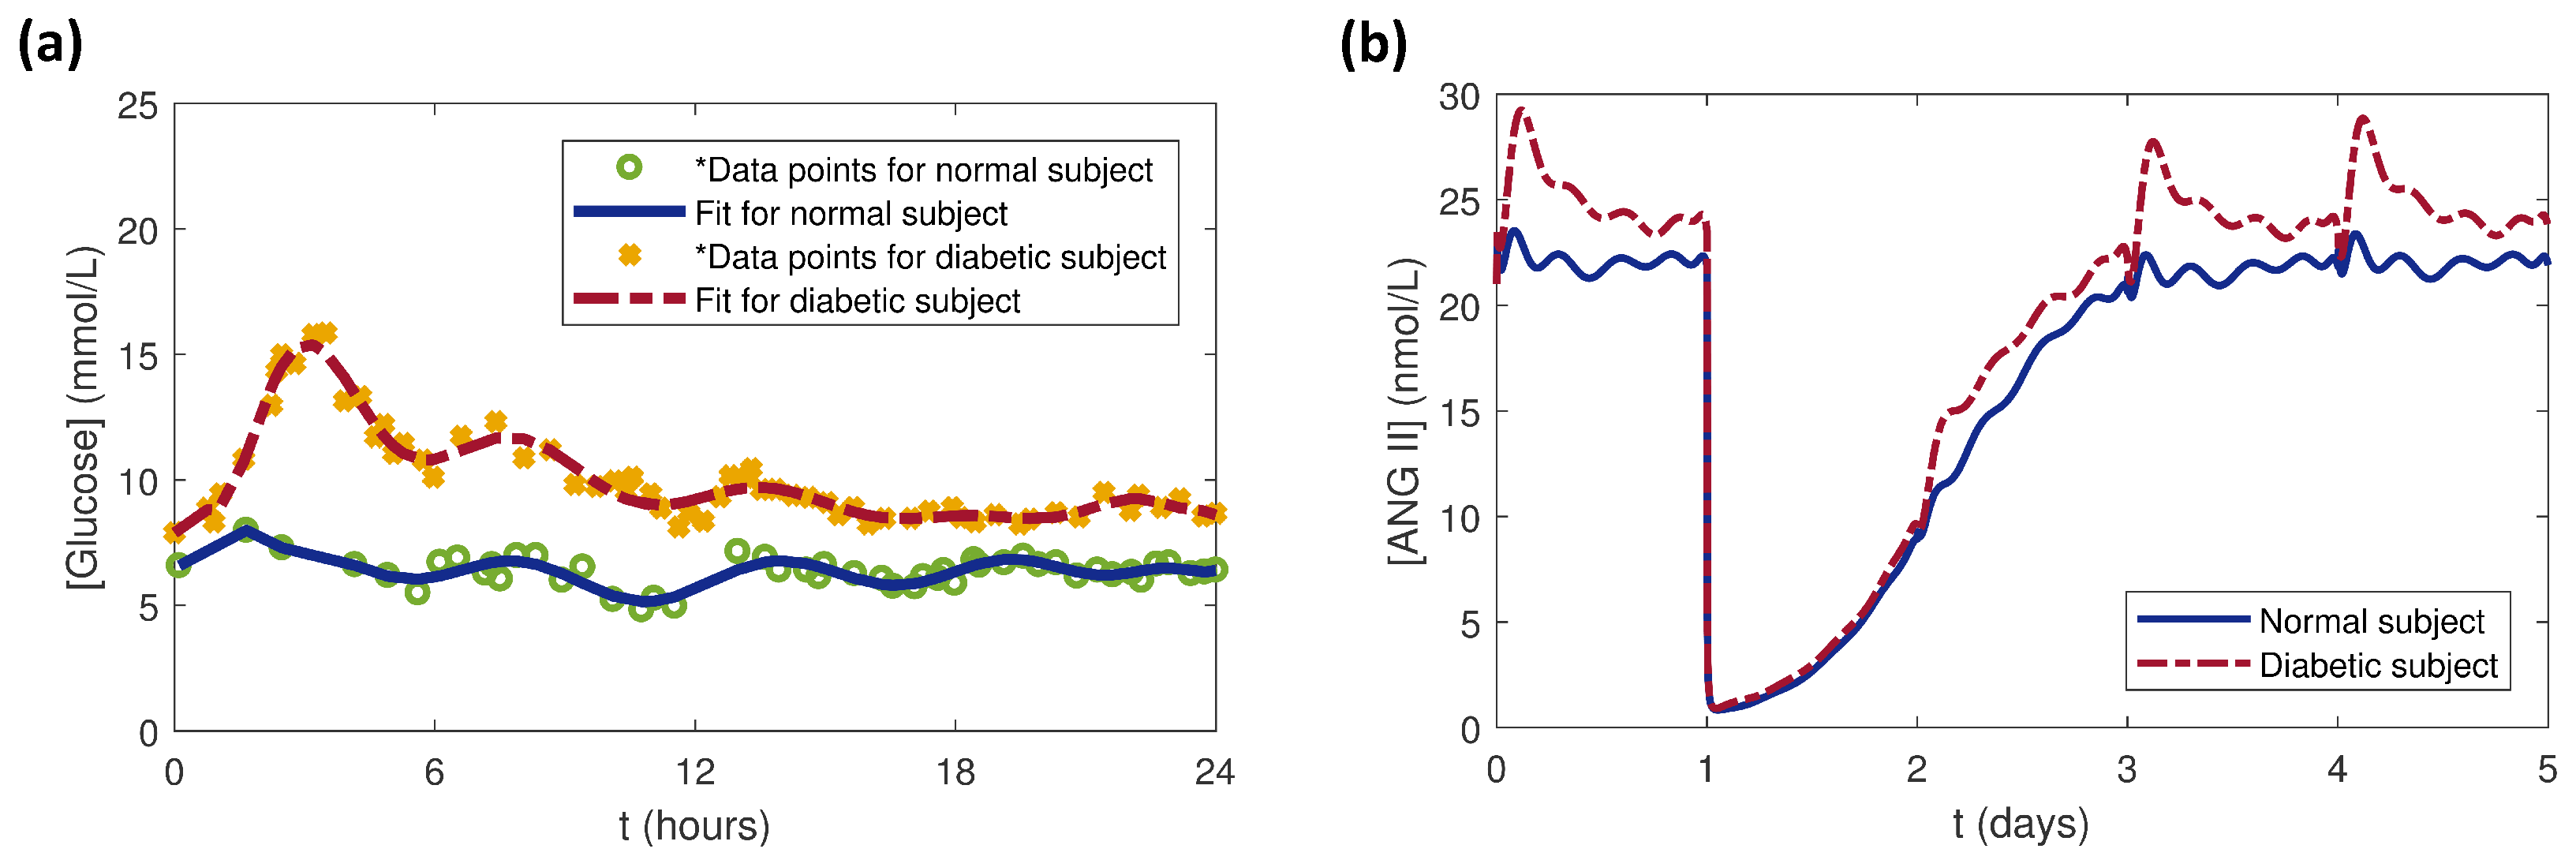
For this study, clinical data for dynamics for normal (non-diabetic) and diabetic human subjects [41] were extracted using Plot Digitizer [46]. The MATLAB functions polyfit and polyval were used to fit curves to the data (Figure 9a). The daily profiles for the normal and diabetic subjects were repeated for five days and used as inputs to the local RAS model. The model was run before and after a single dose of 5 mg benazepril administered at 24 h to examine the effects of the dynamic cases. Before the drug dose ( day), the variations resulted only from dynamics (Figure 9b). Because the PK parameters were same for both the cases, the immediately dropped to the same value upon dosing at day. The rose faster for the diabetic subject than for the normal subject for days as the drug was eliminated around days, at which point the effects began to dominate.
4. Conclusions
In this work, we presented a mathematical PK/PD model to study and simulate the effects of different dosages of the ACE inhibitor drug benazepril and other conditions on in the local RAS in podocyte cells in the kidney. The combination of the impact of renal functions on the PK portion of the model and of glucose dependency on the PD portion of the model made this model more physiologically relevant and tailored for the local RAS and inclusive of drug dosing than our previous models [15,30]. The glucose dependency enabled simulation of constant and dynamic scenarios. The model can be used for patient-specific or population level studies using dynamics for various cases. Also, the model can be run for user-defined dosing intervals and amounts. The benazepril PK portion of the model was parameterized for normal and impaired renal function. The model can be adapted to study the effects of other ACE inhibitor drugs or combinations of drugs for which the PK parameters have been measured.
Using the model, we compared the effects of drug doses on the local RAS to the systemic RAS. The results agreed with previous clinical studies that found that suppression of the systemic RAS by an ACE inhibitor did not necessarily suppress the intrarenal to levels below a threshold that could prevent additional DKD damage. These observations raise the question of adequacy of the current therapeutic approaches and suggest that targeting ACE inhibition therapies specifically towards the cellular local RAS could be an effective strategy to further slow the progression of DKD. This presents an open opportunity for more experimental studies to be directed towards ACE inhibition at the local RAS level. Even though some of the parameters used in the model were based on assumptions or their corresponding values in the systemic RAS, we have accounted for the variability of the parameters and studied their effects on . If more experimental data become available, the model can be validated to a greater extent.
References
Author Contributions
Conceptualization, M.R.P., H.L.Y. and A.N.F.V.; Formal analysis, M.R.P. and A.N.F.V.; Funding acquisition, A.N.F.V.; Investigation, M.R.P.; Methodology, M.R.P., H.L.Y. and A.N.F.V.; Project administration, A.N.F.V.; Software, M.R.P., H.L.Y. and A.N.F.V.; Supervision, A.N.F.V.; Validation, M.R.P.; Visualization, M.R.P. and A.N.F.V.; Writing—original draft, M.R.P.; Writing—review & editing, M.R.P. and A.N.F.V.
Funding
The research results discussed in this publication were made possible in part by funding through the award for project number HR17-057, from the Oklahoma Center for the Advancement of Science and Technology. The work was supported in part by an award from the Harold Hamm Diabetes Center at the University of Oklahoma Health Sciences Center. Additionally, the authors would like to thank Oklahoma State University for startup funds for ANFV. MRP was supported in part by the ACM SIGHPC/Intel Computational and Data Science Fellowship.
Conflicts of Interest
The authors declare no conflict of interest.
References
- Garg, P.; Holzman, L.B. Podocytes: Gaining a foothold. Exp. Cell Res. 2012, 318, 955–963. [Google Scholar] [CrossRef] [PubMed]
- Lopez-Novoa, J.M.; Martinez-Salgado, C.; Rodriguez-Pena, A.B.; Lopez-Hernandez, F.J. Common pathophysiological mechanisms of chronic kidney disease: Therapeutic perspectives. Pharmacol. Ther. 2010, 128, 61–81. [Google Scholar] [CrossRef] [PubMed]
- Lin, J.S.; Susztak, K. Podocytes: The weakest link in diabetic kidney disease? Curr. Diab. Rep. 2016, 16, 45. [Google Scholar] [CrossRef] [PubMed]
- Ilatovskaya, D.V.; Levchenko, V.; Lowing, A.; Shuyskiy, L.S.; Palygin, O.; Staruschenko, A. Podocyte injury in diabetic nephropathy: Implications of angiotensin II-dependent activation of TRPC channels. Sci. Rep. 2015, 5, 17637. [Google Scholar] [CrossRef] [PubMed]
- Dai, H.; Liu, Q.; Liu, B. Research progress on mechanism of podocyte depletion in diabetic nephropathy. J. Diabetes Res. 2017, 2017, 2615286. [Google Scholar] [CrossRef] [PubMed]
- Daehn, I.S. Glomerular endothelial cells stress and cross-talk with podocytes in the development of diabetic kidney disease. Front. Med. 2018, 5, 76. [Google Scholar] [CrossRef] [PubMed]
- Márquez, E.; Riera, M.; Pascual, J.; Soler, M.J. Renin-angiotensin system within the diabetic podocyte. Am. J. Physiol. Ren. Physiol. 2015, 308, F1–F10. [Google Scholar] [CrossRef] [PubMed] [Green Version]
- Danser, A.H.J.; Admiraal, P.J.J.; Derkx, F.H.M.; Schalekamp, M.A.D.H. Angiotensin I-to-II conversion in the human renal vascular bed. J. Hypertens. 1998, 16, 2051–2056. [Google Scholar] [CrossRef] [PubMed]
- Liebau, M.C.; Lang, D.; Böhm, J.; Endlich, N.; Bek, M.J.; Witherden, I.; Mathieson, P.W.; Saleem, M.A.; Pavenstädt, H.; Fischer, K.G. Functional expression of the renin-angiotensin system in human podocytes. Am. J. Physiol. Ren. Physiol. 2006, 290, F710–F719. [Google Scholar] [CrossRef] [PubMed] [Green Version]
- Velez, J.C.Q.; Bland, A.M.; Arthur, J.M.; Raymond, J.R.; Janech, M.G. Characterization of renin-angiotensin system enzyme activities in cultured mouse podocytes. Am. J. Physiol. Ren. Physiol. 2007, 293, F398–F407. [Google Scholar] [CrossRef] [PubMed]
- Durvasula, R.V.; Shankland, S.J. Activation of a local renin angiotensin system in podocytes by glucose. Am. J. Physiol. Ren. Physiol. 2008, 294, F830–F839. [Google Scholar] [CrossRef] [PubMed]
- Yoo, T.H.; Li, J.J.; Kim, J.J.; Jung, D.S.; Kwak, S.J.; Ryu, D.R.; Choi, H.Y.; Kim, J.S.; Kim, H.J.; Han, S.H.; et al. Activation of the renin-angiotensin system within podocytes in diabetes. Kidney Int. 2007, 71, 1019–1027. [Google Scholar] [CrossRef] [PubMed]
- Nishiyama, A.; Seth, D.M.; Navar, L.G. Renal interstitial fluid angiotensin I and angiotensin II concentrations during local angiotensin-converting enzyme inhibition. J. Am. Soc. Nephrol. 2002, 13, 2207–2212. [Google Scholar] [CrossRef] [PubMed]
- Lo, A.; Beh, J.; De Leon, H.; Hallow, M.K.; Ramakrishna, R.; Rodrigo, M.; Sarkar, A.; Sarangapani, R.; Georgieva, A. Using a systems biology approach to explore hypotheses underlying clinical diversity of the renin angiotensin system and the response to antihypertensive therapies. In Clinical Trial Simulations; Kimko, H.H.C., Peck, C.C., Eds.; Springer: New York, NY, USA, 2011; pp. 457–482. [Google Scholar]
- Ford Versypt, A.N.; Harrell, G.K.; McPeak, A.N. A pharmacokinetic/pharmacodynamic model of ACE inhibition of the renin-angiotensin system for normal and impaired renal function. Comp. Chem. Eng. 2017, 104, 311–322. [Google Scholar] [CrossRef]
- Leete, J.; Gurley, S.; Layton, A.T. Modeling sex differences in the renin angiotensin system and the efficacy of antihypertensive therapies. Comp. Chem. Eng. 2018, 112, 253–264. [Google Scholar] [CrossRef] [PubMed]
- Ford Versypt, A.N. ACEInhibPKPD. 2017. Available online: http://github.com/ashleefv/ACEInhibPKPD (accessed on 16 January 2017).
- Deen, W.M.; Bohrer, M.P.; Brenner, B.M. Macromolecule transport across glomerular capillaries: Application of pore theory. Kidney Int. 1979, 16, 353–356. [Google Scholar] [CrossRef] [PubMed]
- Thomas, S.R. Kidney modeling and systems physiology. WIREs Syst. Biol. Med. 2009, 1, 172–190. [Google Scholar] [CrossRef] [PubMed]
- Edwards, A. Modeling transport in the kidney: Investigating function and dysfunction. Am. J. Physiol. Ren. Physiol. 2010, 298, F475–F484. [Google Scholar] [CrossRef] [PubMed]
- Layton, A.T. Mathematical modeling of kidney transport. WIREs Syst. Biol. Med. 2013, 5, 557–573. [Google Scholar] [CrossRef] [PubMed] [Green Version]
- Fry, B.C.; Edwards, A.; Sgouralis, I.; Layton, A.T. Impact of renal medullary three-dimensional architecture on oxygen transport. Am. J. Physiol. Ren. Physiol. 2014, 307, F263–F272. [Google Scholar] [CrossRef] [PubMed] [Green Version]
- Weinstein, A.M. A mathematical model of rat proximal tubule and loop of Henle. Am. J. Physiol. Ren. Physiol. 2015, 308, F1076–F1097. [Google Scholar] [CrossRef] [PubMed]
- Weinstein, A.M. A mathematical model of the rat nephron: Glucose transport. Am. J. Physiol. Ren. Physiol. 2015, 308, F1098–F1118. [Google Scholar] [CrossRef] [PubMed]
- Arciero, J.C.; Ellwein, L.; Ford Versypt, A.N.; Makrides, E.; Layton, A.T. Modeling blood flow control in the kidney. In Applications of Dynamical Systems in Biology and Medicine; Jackson, T., Radunskaya, A., Eds.; Springer: New York, NY, USA, 2015; pp. 55–74. [Google Scholar]
- Ford Versypt, A.N.; Makrides, E.; Arciero, J.C.; Ellwein, L.; Layton, A.T. Bifurcation study of blood flow control in the kidney. Math. Biosci. 2015, 263, 169–179. [Google Scholar] [CrossRef] [PubMed] [Green Version]
- Sgouralis, I.; Layton, A.T. Mathematical modeling of renal hemodynamics in physiology and pathophysiology. Math. Biosci. 2015, 264, 8–20. [Google Scholar] [CrossRef] [PubMed] [Green Version]
- Layton, A.T.; Vallon, V.; Edwards, A. A mathematical model of the rat nephron: Glucose transport. Am. J. Physiol. Ren. Physiol. 2016, 310, F1269–F1283. [Google Scholar] [CrossRef] [PubMed]
- Tan, H.; Yi, H.; Zhao, W.; Ma, J.X.; Zhang, Y.; Zhou, X. Intraglomerular crosstalk elaborately regulates podocyte injury and repair in diabetic patients insights from a 3D multiscale modeling study. Oncotarget 2016, 7, 73130–73146. [Google Scholar] [CrossRef] [PubMed]
- Pilvankar, M.R.; Higgins, M.A.; Ford Versypt, A.N. Mathematical model for glucose dependence of the local renin-angiotensin system in podocytes. Bull. Math. Biol. 2018, 80, 880–905. [Google Scholar] [CrossRef] [PubMed]
- Pilvankar, M.R.; Higgins, M.A.; Ford Versypt, A.N. glucoseRASpodocytes. 2017. Available online: http://github.com/ashleefv/glucoseRASpodocytes (accessed on 11 June 2017).
- Mishina, M.; Watanabe, T. Development of hypertension and effects of benazepril hydrochloride in a canine remnant kidney model of chronic renal failure. J. Vet. Med. Sci. 2008, 70, 455–460. [Google Scholar] [CrossRef] [PubMed]
- Kobori, H.; Mori, H.; Masaki, T.; Nishiyama, A. Angiotensin II blockade and renal protection. Curr. Pharm. Des. 2013, 19, 3033–3042. [Google Scholar] [CrossRef] [PubMed]
- Campbell, R.; Sangalli, F.; Perticucci, E.; Aros, C.; Viscarra, C.; Perna, A.; Remuzzi, A.; Bertocchi, F.; Fagiani, L.; Remuzzi, G.; et al. Effects of combined ACE inhibitor and angiotensin II antagonist treatment in human chronic nephropathies. Kidney Int. 2003, 63, 1094–1103. [Google Scholar] [CrossRef] [PubMed] [Green Version]
- Van der Meer, I.M.; Cravedi, P.; Remuzzi, G. The role of renin angiotensin system inhibition in kidney repair. Fibrogenesis Tissue Repair 2010, 3, 7. [Google Scholar] [CrossRef] [PubMed] [Green Version]
- Byers, J.P.; Sarver, J.G. Chapter 10: Pharmacokinetic modeling. In Pharmacology: Principles and Practice; Hacker, M., Bachmann, K., Messer, W., Eds.; Academic Press: New York, NY, USA, 2009; pp. 201–277. [Google Scholar]
- Shionoiri, H.; Ueda, S.I.; Minamisawa, K.; Minamisawa, M.; Takasaki, I.; Sugimoto, K.; Gotoh, E.; Ishii, M. Pharmacokinetics and pharmacodynamics of benazepril in hypertensive patients with normal and impaired renal function. J. Cardiovasc. Pharmacol. 1992, 20, 348–357. [Google Scholar] [CrossRef] [PubMed]
- Pilvankar, M.R.; Yong, H.L.; Ford Versypt, A.N. COMBINEDglucoseRASpodocytesACEInhibPKPD. 2018. Available online: http://github.com/ashleefv/COMBINEDglucoseRASpodocytesACEInhibPKPD (accessed on 27 January 2019).
- Yard, B.; Feng, Y.; Keller, H.; Mall, C.; van der Woude, F. Influence of high glucose concentrations on the expression of glycosaminoglycans and N-deacetylase/N-sulphotransferase mRNA in cultured skin fibroblasts from diabetic patients with or without nephropathy. Nephrol. Dial. Transplant. 2002, 17, 386–391. [Google Scholar] [CrossRef] [PubMed]
- Das, F.; Ghosh-Choudhury, N.; Dey, N.; Bera, A.; Mariappan, M.M.; Kasinath, B.S.; Choudhury, G.G. High glucose forces a positive feedback loop connecting Akt kinase and FoxO1 transcription factor to activate mTORC1 kinase for mesangial cell hypertrophy and matrix protein expression. J. Biol. Chem. 2014, 289, 32703–32716. [Google Scholar] [CrossRef] [PubMed]
- Praet, S.F.; Manders, R.J.; Meex, R.C.; Lieverse, A.; Stehouwer, C.D.; Kuipers, H.; Keizer, H.A.; Van Loon, L.J. Glycaemic instability is an underestimated problem in type II diabetes. Clin. Sci. 2006, 111, 119–126. [Google Scholar] [CrossRef] [PubMed]
- McKay, M.D.; Beckman, R.J.; Conover, W.J. A comparison of three methods for selecting values of input variables in the analysis of output from a computer code. Technometrics 1979, 21, 239–245. [Google Scholar]
- Marino, S.; Hogue, I.B.; Ray, C.J.; Kirschner, D.E. A methodology for performing global uncertainty and sensitivity analysis in systems biology. J. Theor. Biol. 2008, 254, 178–196. [Google Scholar] [CrossRef] [PubMed] [Green Version]
- Schena, F.P.; Gesualdo, L. Pathogenetic mechanisms of diabetic nephropathy. J. Am. Soc. Nephrol. 2005, 16, S30–S33. [Google Scholar] [CrossRef] [PubMed]
- Schrijvers, B.F.; De Vriese, A.S.; Flyvbjerg, A. From hyperglycemia to diabetic kidney disease: the role of metabolic, hemodynamic, intracellular factors and growth factors/cytokines. Endocr. Rev. 2004, 25, 971–1010. [Google Scholar] [CrossRef] [PubMed]
- SourceForge. Plot Digitizer. 2015. Available online: http://plotdigitizer.sourceforge.net/ (accessed on 2 January 2017).
Figure 1.
Reaction network for (a) the podocyte local renin-angiotensin system (RAS) as modeled in glucoseRASpodocytes [30,31] and (b) the systemic RAS as modeled in ACEInhibPKPD [15,17]. Peptides are shown in gray ovals, enzymes are denoted over the reaction arrows, enzymes that are influenced by inhibitory reactions are shown in black ovals, and the angiotensin-converting enzyme (ACE) inhibitor is labeled in the white box. Angiotensin II (ANG II) is highlighted in a red oval as the key peptide of interest. Solid lines denote reactions, open arrow tips indicate degradation reactions, dashed lines denote binding of ANG II to receptors, and red dotted lines with flat ends instead of arrows indicate inhibitory reactions.

Figure 2.
Glucose-dependent biochemical reaction network for the podocyte local RAS pharmacodynamic model. Peptides are shown in gray ovals, enzymes are denoted over the reaction arrows, enzymes that are influenced by inhibitory reactions are shown in black ovals, and the ACE inhibitor is labeled in the white box. ANG II is highlighted in a red oval as the key peptide of interest. Solid lines denote reactions, open arrow tips indicate degradation reactions, dashed lines denote binding of ANG II to receptors, and red dotted lines with flat ends instead of arrows indicate inhibitory reactions. Thick green lines highlight the processes with glucose-dependent rate parameters.

Figure 3.
Simulation results in response to once daily 2.5 mg (yellow) or 10 mg (red) doses of benazepril in the local RAS (dotted curves) and the systemic RAS (solid curves) for for (a) normal renal function (NRF) and (b) impaired renal function (IRF).
Figure 3.
Simulation results in response to once daily 2.5 mg (yellow) or 10 mg (red) doses of benazepril in the local RAS (dotted curves) and the systemic RAS (solid curves) for for (a) normal renal function (NRF) and (b) impaired renal function (IRF).

Figure 4.
Simulation results in response to once daily 2.5 mg (yellow) or 10 mg (red) doses of benazepril in the local RAS (dotted curves) and the systemic RAS (solid curves) at constant NG for (a) for NRF, (b) for NRF normalized by , (c) for IRF, and (d) for IRF normalized by . Please note that the local RAS NRF and IRF cases only differ in the PK parameters used to obtain . for the local RAS.

Figure 5.
Simulation results of response to one 5 mg dose of benazepril at 24 h in the local RAS at constant normal glucose (NG) for NRF for (a) set at its maximum value of 0.5 h and f decreased from 5 to 2.5 nmol/L and (b) f set at its minimum value of 5 × 10 nmol/L and increased from 4 × 10 to 6.5 × 10 h.

Figure 6.
Simulation results of response to one 5 mg dose of benazepril at 24 h in the local RAS at constant NG for NRF with 50 random combinations of parameters sampled from the refined ranges of (5 × 10 to 5 × 10 h) and f (5 to 5 × 10 nmol/L) generated using Latin hypercube sampling (LHS) (colored curves). The mean of from the 50 simulations is shown by the bold black dashed-dotted curve. The inset zooms in around 2 days, which was the time for greatest variations in Figure 5.

Figure 7.
Simulation results of response to one 5 mg dose of benazepril at 24 h in the local RAS at constant NG for NRF with 50 random combinations of and in the ranges in Table 5 generated using LHS (colored curves). The mean of from the 50 simulations is shown by the bold black dashed-dotted curve.

Figure 8.
Simulation results of normalized by the reference concentrations for the healthy cases for the local RAS () and for the systemic RAS () without a drug dose. The healthy state (yellow) transitions towards the unhealthy state (dark red) for the local RAS (dotted curves) via increasing and for the systemic RAS (solid curves) from normal to impaired renal function.

Figure 9.
(a) as a function of time for normal and diabetic subjects with data extracted from [41] and curves fitted with the polyfit function in MATLAB. (b) Simulation results of response to one 5 mg dose of benazepril at 24 h and dynamics in the local RAS.
Figure 9.
(a) as a function of time for normal and diabetic subjects with data extracted from [41] and curves fitted with the polyfit function in MATLAB. (b) Simulation results of response to one 5 mg dose of benazepril at 24 h and dynamics in the local RAS.


Table 1.
Pharmacokinetic parameter values used for both the systemic and the local renin-angiotensin system (RAS) models for benazepril for renal function cases of normal renal function (NRF) and impaired renal function (IRF).
Table 1.
Pharmacokinetic parameter values used for both the systemic and the local renin-angiotensin system (RAS) models for benazepril for renal function cases of normal renal function (NRF) and impaired renal function (IRF).
| Parameter | NRF | IRF | Units | Sources |
|---|---|---|---|---|
| 1.907 | 1.645 | h | [15,37] | |
| 1.33 × 10 | 3.45 × 10 | h | [15,37] | |
| 7.09 × 10 | 1.07 × 10 | mL | [15,37] |
Table 2.
Pharmacodynamic parameter values for the podocyte local RAS model for benazepril.
| Parameter | Value | Units | Sources |
|---|---|---|---|
| nmol/L/h | [30] | ||
| h | [15] | ||
| h | [30] | ||
| h | [30] | ||
| h | [30] | ||
| h | [30] | ||
| h | [14,30] | ||
| h | [15] | ||
| h | [14,30] | ||
| h | [14,30] | ||
| 2.20 | ng/mL | [15,37] | |
| m | 0.99 | - | [15,37] |
| L/mmol/h | [30] | ||
| h | [30] | ||
| L/mmol/h | [30] | ||
| 163 | h | [30] | |
| L/mmol/h | [30] | ||
| 464 | h | [30] | |
| h | [15] | ||
| nmol/L | [15] | ||
| nmol/L | [30] | ||
| nmol/L | [15] | ||
| 271 | nmol/L | [30] | |
| nmol/L | [30] | ||
| nmol/L | [15] | ||
| nmol/L | [15] |
Table 3.
Values and ranges for varying feedback parameters and f to generate random samples to study the effects on .
Table 3.
Values and ranges for varying feedback parameters and f to generate random samples to study the effects on .
| Parameter | Nominal Value | Min | Max | Units | Range |
|---|---|---|---|---|---|
| 4.91 × 10 | 5 × 10 | 5 × 10 | h | ||
| f | 5.04 × 10 | 5 × 10 | 5 × 10 | nmol/L |
Table 4.
Combinations of minimum and maximum values of and f from Table 3 used to study the effects on after a drug dose.
Table 4.
Combinations of minimum and maximum values of and f from Table 3 used to study the effects on after a drug dose.
| Combination | f | ||
|---|---|---|---|
| 1 | min | min | |
| 2 | min | max | |
| 3 | max | max | |
| 4 | max | min |
Table 5.
Values and ranges for varying parameters and to generate random samples to study the effects on .
Table 5.
Values and ranges for varying parameters and to generate random samples to study the effects on .
| Parameter | Nominal Value | Min | Max | Units | Range |
|---|---|---|---|---|---|
| 1.907 | 1.907 × 10 | 1.907 × 10 | h | ||
| 0.133 | 0.133 × 10 | 0.133 × 10 | h |
© 2019 by the authors. Licensee MDPI, Basel, Switzerland. This article is an open access article distributed under the terms and conditions of the Creative Commons Attribution (CC BY) license (http://creativecommons.org/licenses/by/4.0/).
Share and Cite
MDPI and ACS Style
Pilvankar, M.R.; Yong, H.L.; Ford Versypt, A.N. A Glucose-Dependent Pharmacokinetic/ Pharmacodynamic Model of ACE Inhibition in Kidney Cells. Processes 2019, 7, 131. https://doi.org/10.3390/pr7030131
AMA Style
Pilvankar MR, Yong HL, Ford Versypt AN. A Glucose-Dependent Pharmacokinetic/ Pharmacodynamic Model of ACE Inhibition in Kidney Cells. Processes. 2019; 7(3):131. https://doi.org/10.3390/pr7030131
Chicago/Turabian StylePilvankar, Minu R., Hui Ling Yong, and Ashlee N. Ford Versypt. 2019. "A Glucose-Dependent Pharmacokinetic/ Pharmacodynamic Model of ACE Inhibition in Kidney Cells" Processes 7, no. 3: 131. https://doi.org/10.3390/pr7030131
Note that from the first issue of 2016, this journal uses article numbers instead of page numbers. See further details here.