Single-Cell Receptor Quantification of an In Vitro Coculture Angiogenesis Model Reveals VEGFR, NRP1, Tie2, and PDGFR Regulation and Endothelial Heterogeneity


1
Department of Biomedical Engineering, Washington University, St. Louis, MO 63130, USA
2
Carl R. Woese Institute for Genomic Biology, University of Illinois at Urbana Champaign, Urbana, IL 61801, USA
*
Author to whom correspondence should be addressed.
Processes 2019, 7(6), 356; https://doi.org/10.3390/pr7060356
Submission received: 5 March 2019
/
Revised: 29 May 2019
/
Accepted: 5 June 2019
/
Published: 10 June 2019
(This article belongs to the Special Issue Systems Biomedicine
)
Abstract
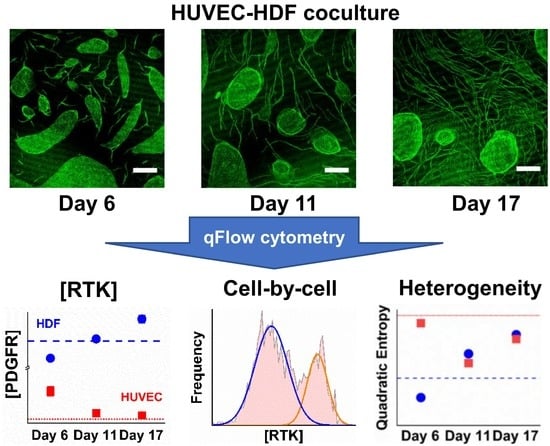
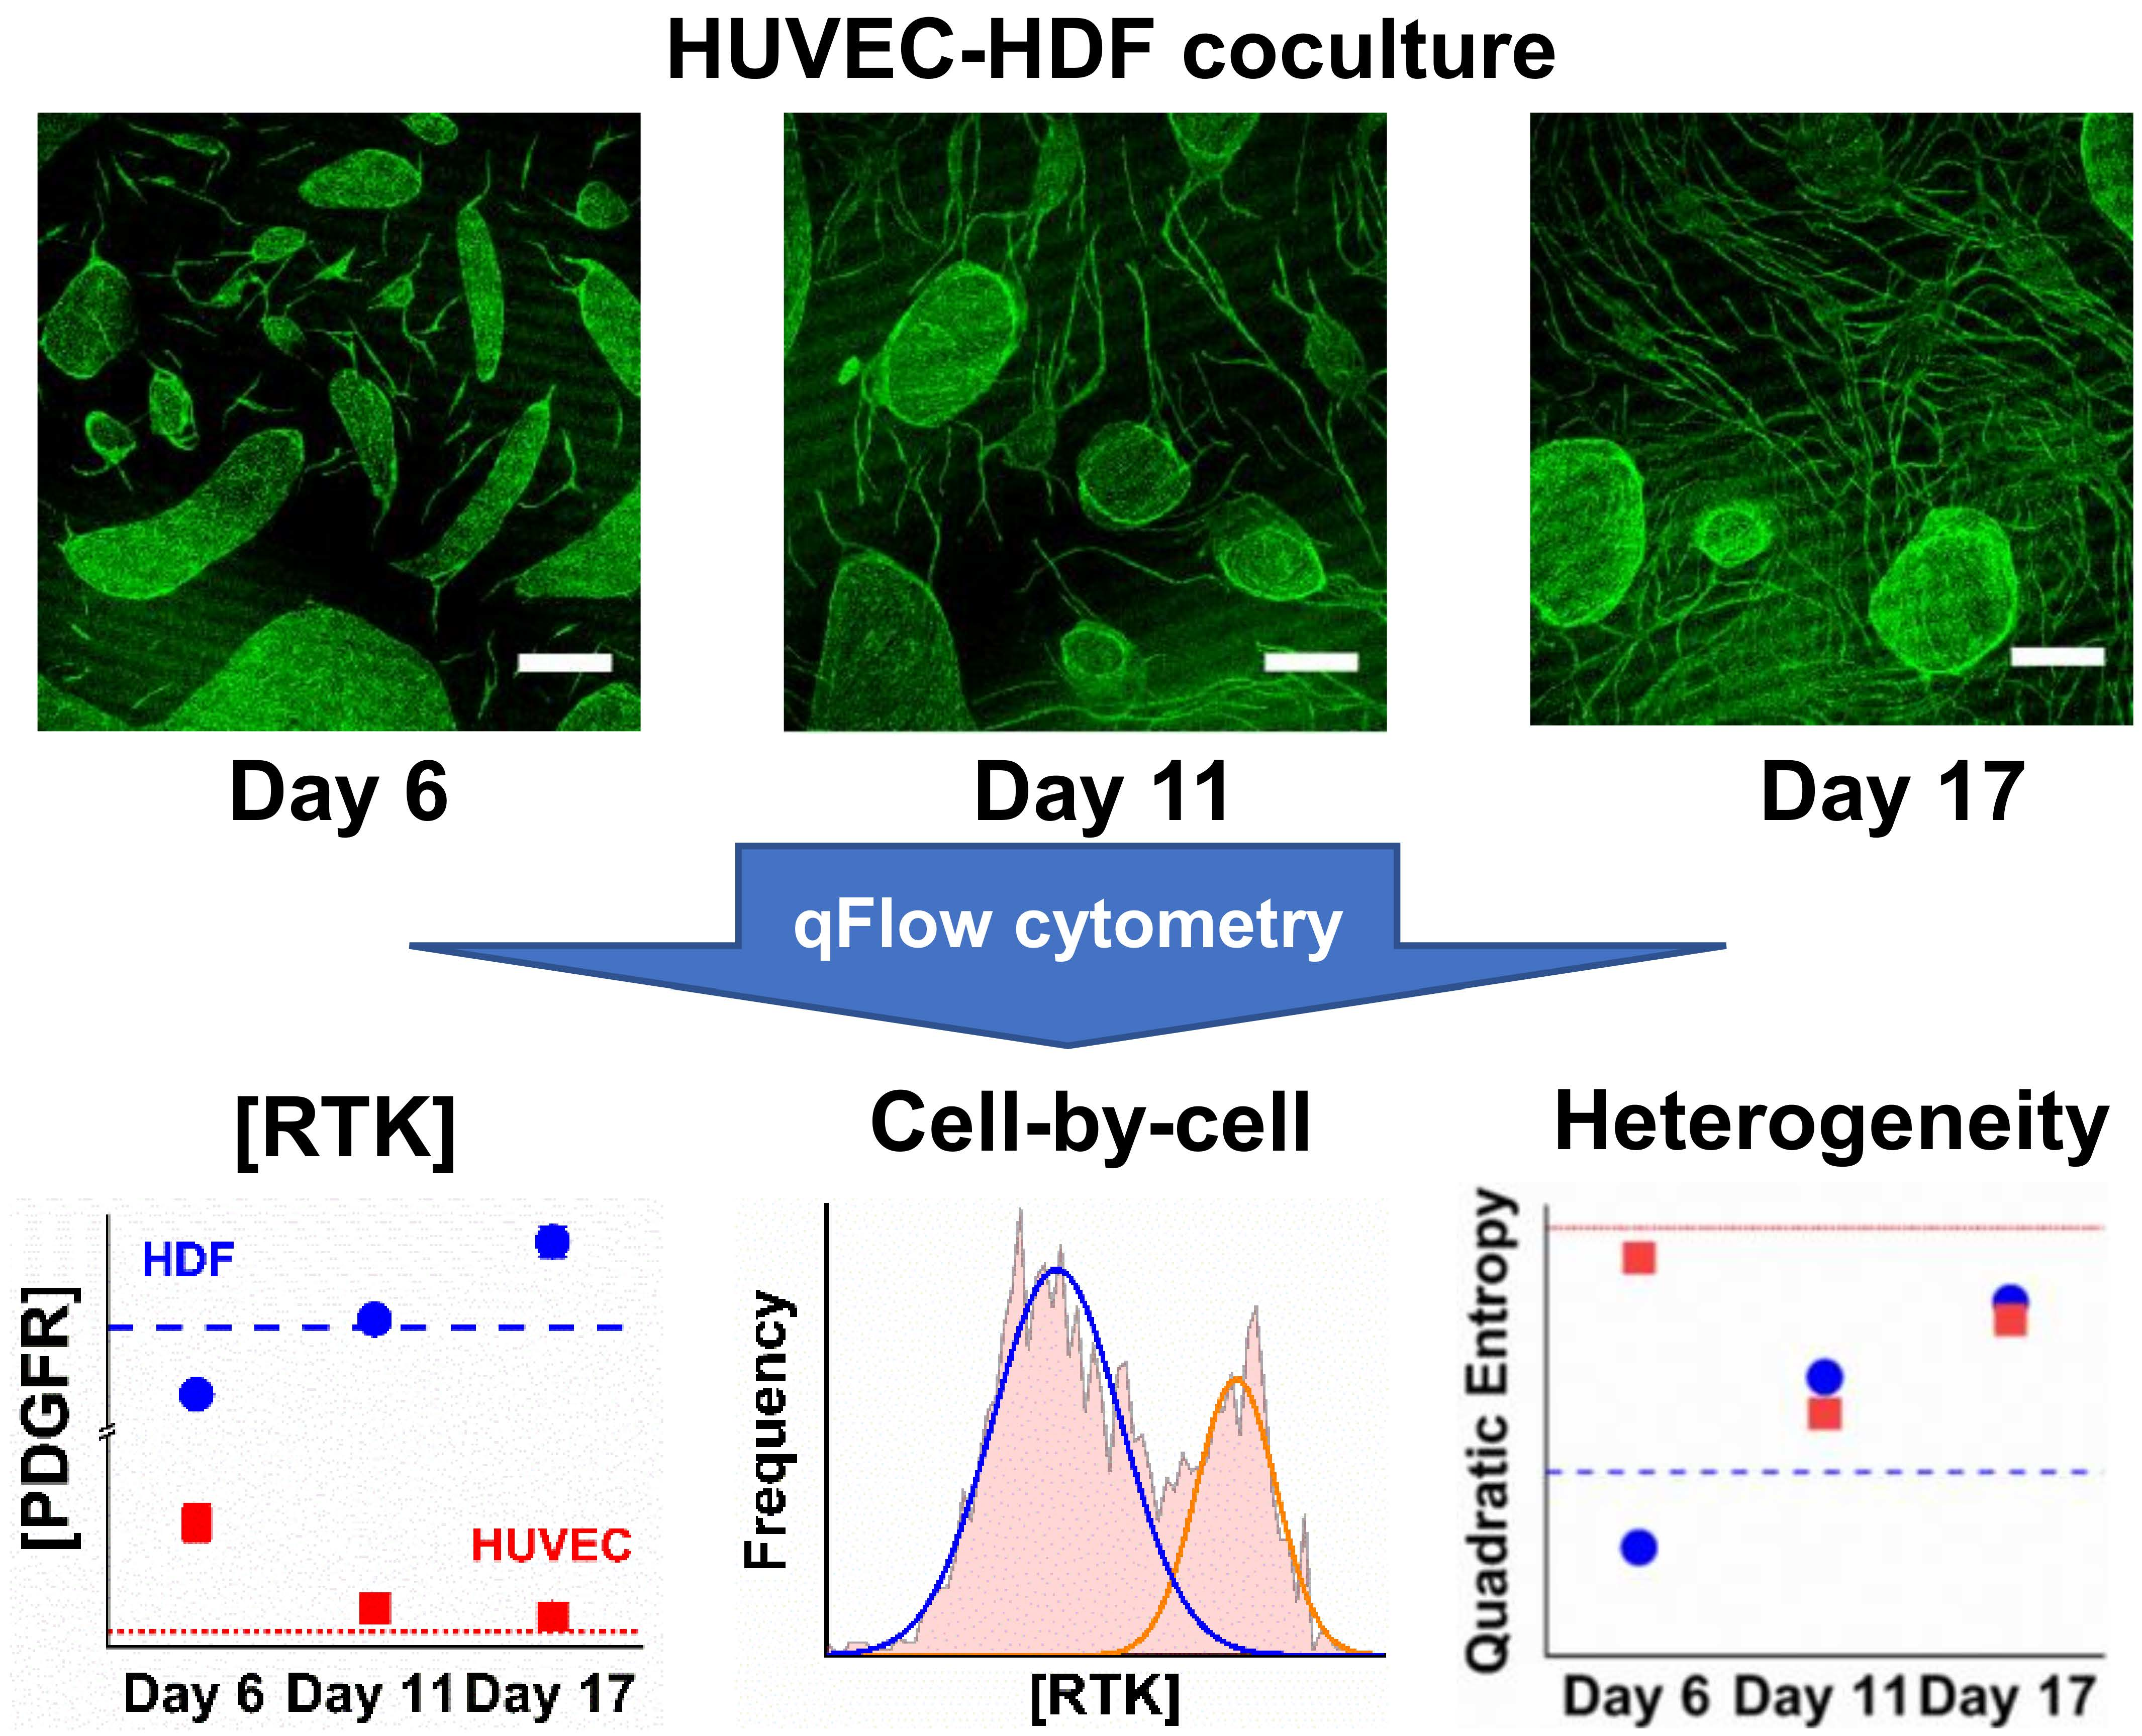
:Angiogenesis, the formation of new blood vessels from pre-existing ones, is essential for both normal development and numerous pathologies. Systems biology has offered a unique approach to study angiogenesis by profiling tyrosine kinase receptors (RTKs) that regulate angiogenic processes and computationally modeling RTK signaling pathways. Historically, this systems biology approach has been applied on ex vivo angiogenesis assays, however, these assays are difficult to quantify and limited in their potential of temporal analysis. In this study, we adopted a simple two-dimensional angiogenesis assay comprised of human umbilical vein endothelial cells (HUVECs) and human dermal fibroblasts (HDFs) and examined temporal dynamics of a panel of six RTKs and cell heterogeneity up to 17 days. We observed ~2700 VEGFR1 (vascular endothelial growth factor receptor 1) per cell on 24-h-old cocultured HDF plasma membranes, which do not express VEGFR when cultured alone. We observed 4000–8100 VEGFR2 per cell on cocultured HUVEC plasma membranes throughout endothelial tube formation. We showed steady increase of platelet-derived growth factor receptors (PDGFRs) on cocultured HDF plasma membranes, and more interestingly, 1900–2900 PDGFRβ per plasma membrane were found on HUVECs within the first six hours of coculturing. These quantitative findings will offer us insights into molecular regulation during angiogenesis and help assess in vitro tube formation models and their physiological relevance.
1. Introduction
Angiogenesis, the sprouting and formation of new vessels from pre-existing vessels, is an essential process of both normal development and numerous pathologies, including diabetic retinopathy, ischemia, tumor growth, and metastasis. The principle cells involved are endothelial cells (ECs), which are the primary cell structure of capillaries and form the lining of all other vessels. The angiogenic process includes (1) stimulation of ECs by binding of angiogenic growth factors like vascular endothelial growth factor (VEGF), to receptors on ECs; (2) EC invasion by production and release of proteases, which degrade the extracellular matrix and basement membrane; (3) EC proliferation and migration; (4) EC differentiation and tube formation; and (5) stabilization of newly formed blood vessels by pericyte [1,2].
In healthy tissue, this process is tightly regulated by a signaling network comprising pro- and antiangiogenic growth factors, tyrosine kinase receptors (RTKs), extracellular matrix (ECM), and neighboring cells. However, under pathologic conditions, such as cancer, the signaling network is altered to stimulate new blood vessels to sustain tumor growth, development, and metastasis. As such, insights into signaling networks and how they transition between healthy and diseased states can advance our understanding of complex biological processes such as angiogenesis.
To better understand angiogenesis, RTKs that regulate angiogenic processes have been extensively profiled [3,4,5,6,7,8] and computationally modeled [9,10,11,12], some include: Vascular endothelial growth factor receptors (VEGFRs) and their neuropilin (NRP) coreceptors, platelet-derived growth factor receptors (PDGFRs), and Tie receptors. Computational models, based on mass-action kinetics of the RTK signaling axis, have characterized VEGF–VEGFR binding in both healthy and diseased tissue [13,14], VEGF spatial distribution in skeletal muscle [15,16,17], angiogenic sprouting in skeletal muscle [18,19], and VEGF gradients in peripheral artery disease (PAD) [20]. A recent computational model, which incorporated ex vivo VEGFR concentrations from breast cancer xenografts [4], has successfully predicted that tumors having “high” concentrations of plasma membrane VEGFR1 could be resistant to anti-VEGF drugs (angiogenesis inhibitors) [9,21]. Platelet-derived growth factor (PDGF) models have also been developed, which examined PI3K and MAPK pathways in fibroblasts [22,23]. This systems biology approach, which combines computational modeling and quantitative profiling of the biological system, can offer valuable insights; however, it is important to apply this approach on physiologically relevant experimental models [24].
Historically, in vivo and ex vivo animal models have been the preferred method to study these receptors and their roles in angiogenesis. However, these experimental models are limited in their throughput, reproducibility, and potential of temporal analysis. Thus, advancement of accurate angiogenesis models, in vitro, is paramount to further advancing our understanding of angiogenesis regulation.
Over the past 20 years, various in vitro assays have been developed to study the angiogenesis hallmarks, including: EC proliferation, migration, sprouting and tube formation, among others [25]. While these in vitro assays are robust, fast, and easy to perform, they are limited by how reflective the assay is to the in vivo state. EC proliferation and migration assays are well-established [25,26], and can be used for focused characterization of EC behavior, but only recapitulate certain phases of angiogenesis, namely EC proliferation and migration, thus cannot reflect the complexity of angiogenesis in vivo. Traditional Matrigel cord-forming or collagen I angiogenic invasion assays are used for evaluation of tube formation, however, the tubes formed by Matrigel ECs are not physiologically accurate because they have incomplete lumens [27]. A coculture assay of fibroblasts and ECs developed by Bishop et al. is another commonly used in vitro model for the evaluation of EC differentiation and tube formation [28]. Although the human umbilical vein endothelial cells (HUVEC)–human dermal fibroblasts (HDF) coculture is limited by the absence of pericyte biology, fibroblasts serve a similar mural cell function by secreting ECM components that support tube formation [29,30]. In addition, this coculture model demonstrates its relevancy to in vivo angiogenesis: Morphological features of tubules formed in the coculture assay more closely resemble capillaries in vivo than Matrigel tubes [27], and recapitulates most phases of the angiogenic process, including EC proliferation, migration, differentiation, and tube formation [31]. To examine how reflective the coculture model is to in vivo or ex vivo studies, it is important to correlate the temporal dynamics of signaling network throughout tube formation with in vivo or ex vivo characterizations.
Here, we demonstrate that a method combining our optimized RTK quantitative flow (qFlow) cytometry approach [3,4,5,7,8,9,32] and the HUVEC–HDF coculture model developed by Bishop et al. presents opportunities to characterize temporal dynamics of several important signaling pathways during angiogenesis. We start by optimizing the angiogenesis assay by coculturing HUVECs and HDFs at different seeding ratio, in different media type and seeding order. To confirm the growth of EC tubes, we quantify several morphological characteristics. We monitor the concentration, cell-by-cell distribution, and heterogeneity of a panel of key angiogenic receptors: VEGFR1, VEGFR2, Tie2, NRP1, PDGFRα, and PDGFRβ throughout the tube formation. These quantitative data give insights into RTK regulation during angiogenesis and provide physiologically-relevant RTK concentrations for computational models.
2. Materials and Methods
HUVEC–HDF coculture in microwell plates. According to previous reports by Bishop et al. [28], HUVEC–HDF coculture were prepared by seeding mixtures of HDFs and HUVECs on polystyrene cell culture surfaces. Fibroblasts secrete extracellular matrix proteins, as well as growth factors such as VEGF and Ang-1, which are necessary for EC tube formation [33,34,35,36]. HDFs and HUVECs were harvested from 80–90% confluent monocultures before mixing and seeding for coculturing. Monocultures of HDFs and HUVECs were cultured as previously described [37]. To determine the optimized seeding ratio between these two cell types, we seeded mixtures of 1 × 10⁴ HDFs and 1 × 10⁴, 5 × 10⁴ or 2 × 10³ HUVECs in each well of a 24-microwell plate (BD Biosciences/Falcon, Heidelberg, Germany) and cultured at 37 °C, 5% CO2 in coculture media (see Media comparison). To determine if seeding order has an effect on the coculture assay, 1 × 10⁴ HDFs were cultured at 37 °C, 5% CO2, in 200 µL Dulbecco’s modified eagle media (DMEM) with 4.5 g/L glucose, L-glutamine, and sodium pyruvate (Cellgro, Corning, NY, USA), supplemented with 5% (v/v) fetal bovine serum (FBS, Thermo Fisher Scientific, MA, USA) and 1% (v/v) penicillin/streptomycin (Thermo Fisher Scientific, MA, USA) for 3 days, then media was removed and 5 × 10⁴ HUVECs were seeded on top of HDFs in coculture media [38].
Media comparison. In order to evaluate the effect of different media on tubule formation and key angiogenic receptor levels, cocultures were maintained in two different media: (1) Endothelial growth media-2 (EGM-2, Lonza, IL, USA), and (2) DMEM with 4.5 g/L glucose, L-glutamine, and sodium pyruvate (Cellgro, Corning, NY, USA), supplemented with 5% (v/v) FBS (Thermo Fisher Scientific, MA, USA) and 1% (v/v) penicillin/streptomycin (Thermo Fisher Scientific, MA, USA). The 200 µL media was added to each well of 24-microwell plate (BD Biosciences/Falcon, Heidelberg, Germany), and 12.5 mL media was added for T75 flasks. Media was routinely renewed every other day.
Immunofluorescent imaging. Immunofluorescent staining of fibroblast–EC cocultures in 24-well plates were performed according to an established protocol [27,28]. In brief, cocultures were fixed with ice-cold 4% paraformaldehyde (PFA) for 10 min and then incubated in 1% bovine serum albumin (BSA, Fisher Scientific, Hanover Park, IL, USA), 0.3 M glycine (Sigma-Aldrich, St. Louis, MO, USA) in PBST (phosphate-buffered saline (PBS) supplemented with 1% Tween 20) for 1 h at room temperature. To differentiate HUVECs from HDFs, cocultures were labelled with 1:500 diluted fluorescein isothiocyanate (FITC)-conjugated mouse anti-human CD31 antibody (R&D, Minneapolis, MN, USA) for 45 min at room temperature or overnight at 4 °C. To identify cell nucleus, cocultures were incubated with 1:1000 diluted DAPI (4′,6-diamidino-2-phenylindole) for 5 min. After three PBS washes, stained cocultures were stored at 4 °C upon imaging. For angiogenesis analysis, four biological replicates were cultured, and 2–4 images per well were taken with objectives 4× and 10× using a FluoView® FV3000 confocal laser scanning microscope (Olympus, Inc., Tokyo, Japan). Each image was captured at a resolution of 1024 × 1024 pixels (0.32 × 0.32 mm2). To optimize contrast and brightness, images were processed using ImageJ software (Version 1.8.0, https://imagej.nih.gov/ij/index.html) prior to angiogenesis analysis.
Angiogenesis analysis. Tubule networks were formed in cocultures. To characterize the growth of tubule networks, several morphometric parameters of the network were obtained using the free software AngioTool (Version 0.6a, https://ccrod.cancer.gov/confluence/display/ROB2/Home) [39]. This software is applied directly on processed images to extract quantitative information related to the growth of tubule networks: tubule density (% tubules/total area), branching index (junctions/mm2), and total tubule length. Tubule density measures the percentage of area occupied by tubules, thus serves as a quantitative indicator of how dense tubules are. Branching points computes the number of branch points per unit area, therefore provides a measure of angiogenic sprouting activity. Total tubule length returns the sum of Euclidean distances between the pixels of all the tubules in the image, hence it provides a measure of the growth of tubules and branches.
HUVEC–HDF coculture in flasks. Mixtures of 2 × 10⁶ HUVECs and 2 × 10⁶ HDFs were harvested from 80–90% confluent monocultures and seeded on to T75 flasks (Corning, NY, USA). Cocultures were maintained in HUVEC standard media, EGM-2, at 37 °C, 5% CO2 up to 17 days. Media was renewed every other day.
Coculture dissociation. After 24 h, 6 days, 11 days, or 17 days of culturing, EC-fibroblast cocultures were washed twice with 1× PBS, followed by 5–7-min incubation in CellStripperTM (Corning, NY, USA) at 37 °C. Lifted coculture tissues were transferred to a Petri dish, where Hank’s balanced salt solution (HBSS) with 2 mM Ethylenediaminetetraacetic acid (EDTA, VWR, Chicago, IL, USA) and 0.2% BSA (Fisher Scientific, Hanover Park, IL, USA) was added to the tissues as they were minced into 2 mm × 2 mm squares. Minced tissues were then incubated with 0.2% collagenase IV for 5 min at 4 °C. After the incubation, the collagenase-treated tissues were vortexed for 3–5 min with 1-min interval to achieve optimal tissue dissociation. Dissociated tissues were then added bovine serum albumin (BSA)-supplemented stain buffer [32], and filtered through cell strainers (size 70 µm) to ensure single-cell suspension. Cell suspensions were spun down at 500 ×g for 5 min, resuspended at 4 × 10⁶ cells/mL in stain buffer, and then kept on ice until antibody staining.
Monoculture cell dissociation. We have previously shown that quantification of plasma membrane RTKs, including NRP1 and PDGFRβ, can be affected by enzymatic cell dissociation solution, such as TrypLETM (Thermo Fisher Scientific, MA, USA) [5,32]. To assess the effect of the coculture dissociation protocol, which includes a 5-min incubation with collagenase IV and some rigorous mixing, we dissociated HUVEC and HDF monocultures using two methods: (1) The traditional method where HUVECs and HDFs monocultures were lifted and dissociated using a nonenzymatic dissociation buffer, CellStripperTM (Corning, NY, USA), as described previously [8,32]; (2) The coculture dissociation mimicry where CellStripperTM -lifted cells were incubated with HBSS with 2 mM EDTA (VWR, Chicago, IL, USA) and 0.2% BSA for 2–3 min, then with 0.2% collagenase IV for 5 min at 4 °C, vortexed for 3–5 min with 1-min interval, filtered through 70-µm cell strainers (Fisher Scientific, Hanover Park, IL, USA ) and resuspended in ice-cold stain buffer at 4 × 10⁶ cells/mL. qFlow cytometry analysis showed insignificant differences of monoculture RTK concentrations between the coculture dissociation method and the traditional method (Figure S2).
Plasma membrane receptor staining. 25 µL aliquots of cells (1 × 10⁵ cells) were added to 5 mL polystyrene round-bottom tubes (BD Biosciences, NJ, USA). FITC-anti-hCD31 (R&D, Minneapolis, MN, USA) or APC-anti-hCD34 (R&D, Minneapolis, MN, USA) at recommended concentration by their manufacturers were added to each sample tube to differentiate HUVECs from HDFs. Then, phycoerythrin (PE)-conjugated monoclonal antibodies (R&D, Minneapolis, MN, USA) were added at their respective concentrations: 14 µg/mL for VEGFR1 and VEGFR2, 7.1 µg/mL for NRP1 [5], and 9.4 µg/mL for PDGFRs. Sample tubes were protected from light and incubated for 40 min on ice. Cells were washed, centrifuged at 500 ×g twice with 4 mL stain buffer, and resuspended in 300 µL stain buffer. The precision and accuracy of qFlow cytometry profiling has been rigorously tested [37,40,41,42].
Quantitative flow cytometry. Flow cytometry was performed on a LSR Fortessa flow cytometer (BD Biosciences, San Jose, CA, USA); BD FACSDIVATM software (Version 7.0, BD Biosciences, San Jose, CA, USA) was used for data acquisition, and FlowJo (Version 10.5.3, Tree Star, Ashland, OR, USA) software was used for data analysis. To distinguish between live and dead cells, 5 μg/mL Sytox Blue (Thermo Fisher Scientific, MA, USA) was added to all samples. Tubes were vortexed immediately prior to placement in the flow cytometer. From each tube, 8000–10,000 live cells were collected. To subtract cell autofluorescence and background noise, one to two tubes of unlabeled cell samples were collected as well. Sytox Blue was excited with a 403-nm violet laser, and PE was excited with a 561-nm blue laser. Fluorescence of Sytox Blue was obtained with band filters at 450/50 nm, and fluorescence of PE was obtained with band filters at 582/15 nm. To help convert fluorescence intensity to number of molecules, Quantibrite PE beads (BD Biosciences, San Jose, CA, USA) [43,44] were collected and analyzed under the same compensation and voltage settings as cell fluorescence data. Quantibrite PE beads comprise a combination of polystyrene beads conjugated with different density of PE molecules: Low (474 PE molecules per bead), medium-low (5359 PE molecules per bead), medium-high (23,843 PE molecules per bead), and high (62,336 PE molecules per bead).
Statistical analysis: Ensemble averages. Plasma membrane receptor concentration was calculated using PE calibration standards as previously described [5,8,32]. Briefly, a calibration curve that correlates PE fluorescence intensity with the number of PE molecules was determined by fitting the geometric mean of fluorescence histograms of the aforementioned four PE bead populations to a linear regression: y = mx + b, where x = log10 (Number of PE molecules per bead), y = log10 (PE geometric mean), where m and b represented the slope and intercept of the linear regression, respectively. Ensemble average of number of PE molecules per labeled cell, [PE], was calculated using the equation below:
Assuming one receptor-bound antibody was conjugated with one PE molecule, number of bound receptors per cell was equal to number of PE molecules per cell.
Statistical analysis: Cell-by-cell analysis. A 2D histogram of receptor concentration within a cell population was calculated using cell-by-cell PE fluorescence intensity as described previously [32]. Briefly, we derived a signal-to-noise ratio by dividing the weighted integral of the labeled cell signal with the unlabeled cell signal, and deriving the histogram of receptor concentration using this signal-to-noise ratio:
where Hsignal is the histogram of PE fluorescence from labeled cells, Hreceptor is the histogram of receptor concentration, PElabeled and PEunlabeled are the fluorescence signal from labeled cells and unlabeled cells, respectively, and N is the number of cells in a dataset (contains two to three biological replicates). The cell-by-cell analysis was performed using MATLAB software (Version 9.4.0, The MathWorks, Inc., Natick, MA, USA), and the cell-by-cell histograms were plotted using Origin software (Version 9.60, OriginLab, Corp., Northampton, MA, USA).
Statistical analysis: Heterogeneity analysis. To examine cell heterogeneity based on each receptors we examined, Bayesian information criterion (BIC)-assisted Gaussian mixture modeling was performed to obtain number of subpopulations within each cell type from cocultures; quadratic entropy (QE) was calculated for each receptor distribution as a quantitative measure of cell heterogeneity defined by receptor concentration [7]. In addition to BIC, we applied three criteria to exclude subpopulations that are likely outliers or instrument and background noise: (1) Subpopulations with an average receptor concentration higher than 107 receptors per cell are excluded, (2) subpopulations with a density lower than 5% are excluded, and (3) all subpopulations with an average receptor concentration lower than 600 receptors per cell are grouped together as one subpopulation. Studies have determined that G proteins may number between hundreds of thousands and millions per cell [45,46], as such, cell subpopulations with a higher than 107 receptors-per-cell concentration were considered outliers. We found the cutoff for nonspecific binding was ~600 PE molecules per cell previously, thus we considered subpopulations with receptor concentration lower than 600 receptors per cell are nondifferentiating.
3. Results
3.1. HUVEC–HDF Cocultures Formed Tubule Networks in a Two-Dimensional Environment
To establish a coculture assay, we adapted the HUVEC–HDF coculture model from Bishop et al. [28], and assessed the following culturing conditions: Media, HUVEC:HDF seeding ratio, and seeding order. When cultured alone, HUVECs and HDFs organized into typical cell monolayers (Figure S1a,e), whereas they showed variability in cell behavior and organization when cultured together. Cocultures with 1:5 HDFs-to-HUVECs seeding ratio formed tubules at day 17, and displayed HUVEC overgrowth regardless of the seeding order, as observed by confluent patches of HUVECs, stained green with FITC-conjugated CD31 antibody (Figure S1b,g). Cocultures with 1:1 HDFs-to-HUVECs seeding ratio (Figure S1c) presented smaller EC clusters and more microvessel-like structures compared to 5:1 HDFs-to-HUVECs (Figure S1d). HDFs were able to proliferate in DMEM supplemented with 10% FBS, however, DMEM media was not able to support growth of HUVECs in cocultures, as observed by lack of HUVECs stained green and lack of microvessel-like structures (Figure S1f,h). When HDFs were seeded three days before HUVECs, we did not observe tubule structures up to 17 days in EGM-2 or DMEM (Figure S1g,h). As such, we established that the following culturing logistics is optimal for having the most tubular structures and network within 17 days: HUVECs and HDFs seeded together at 1:1 ratio (3 × 10⁴ cells/cm2) and cocultured in EGM-2. The following characterization are performed using this optimal coculturing condition unless stated otherwise.
We observed morphological changes and the growth of tubule networks in cocultures up to 17 days. After 24 h, HUVECs were seen dispersed in loosened clusters or single ECs with HDFs surrounded (Figure S2). By day 6, HDFs grew confluent, while HUVECs organized into dense clusters (Figure 1A, left panel, top). Microvessel-like structures were seen to originate from the HUVECs clusters. Between day 6 and day 17, HUVECs continued to proliferate, migrate, and formed lengthened tubule structures and network, which superficially resembled a capillary bed (Figure 1A, left panel, middle and bottom). To quantify the growth of tubule network in cocultures, we measured tubule density, branching index, and total tubule length using AngioTool software (Version 0.6a, https://ccrod.cancer.gov/confluence/display/ROB2/Home). We showed significant increases in these morphometric parameters in day-11 and day-17 cocultures when compared to the day-6 coculture (Figure 1B).
3.2. Co-Culturing Induced a Rapid Increase of VEGFR1 on HDFs within 24 Hours
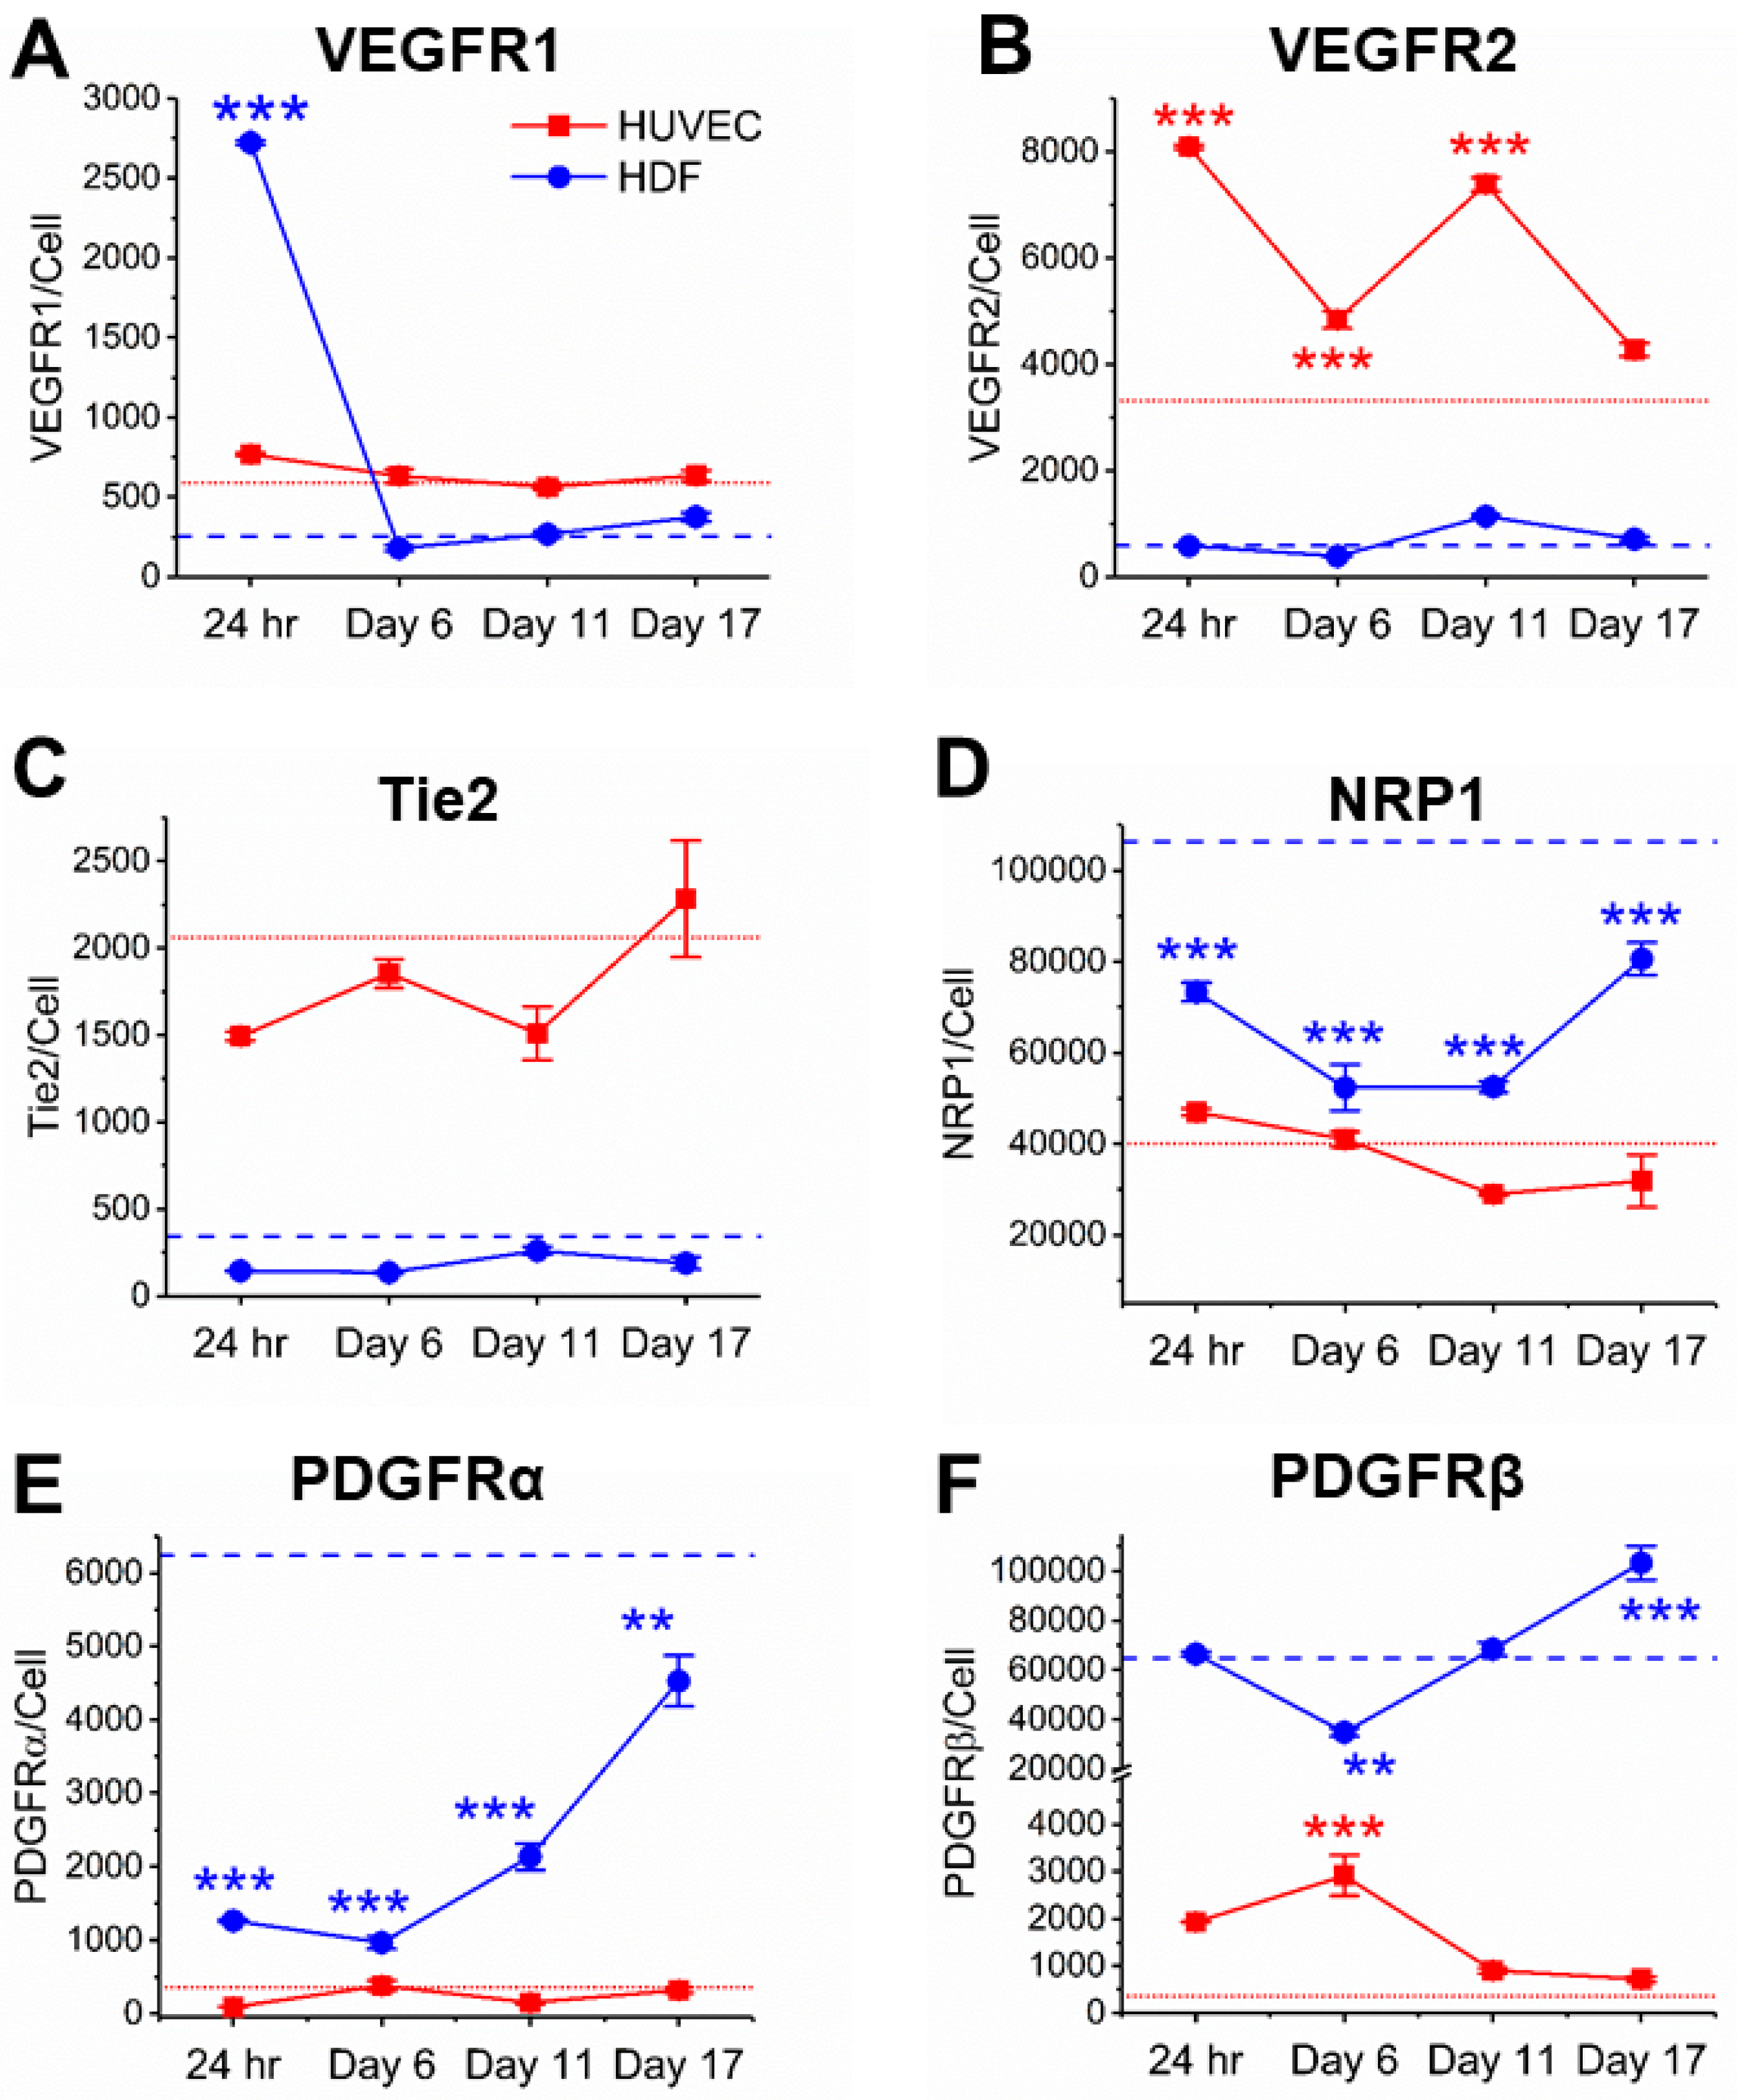
VEGFRs are key regulators of angiogenesis, however, the exact role of VEGFR1 has been controversial: VEGFR1 is conventionally described as a decoy receptor that does not produce intracellular signals, due to its high VEGF affinity but low phosphorylation compared to VEGFR2 [47], however, emerging evidences suggest an active VEGFR1 signaling role [3,48,49]. As such, VEGFR1 quantification can offer insights into how VEGFR1 signaling supports vessel growth. We found that HUVECs in cocultures presented fewer than 800 plasma membrane VEGFR1 per cell from the initial HUVEC–HDF contact to 17 days of tubule development (Figure 2A). This concentration of VEGFR1 is similar to its concentration on confluent HUVEC monocultures that received the same procedure of cell harvesting as cocultures (~600 VEGFR1 per cell) (ANOVA, p > 0.05). On the contrary, HDFs presented high concentrations of plasma membrane VEGFR1 (~2700 receptors per cell) within 24 h in contact with HUVECs (Figure 2A). By day 6, VEGFR1 concentration on HDF plasma membranes reduced to below the detection limit of qFlow cytometry (~600 receptors per cell) [32] and remained below the detection limit up to 17 days. To confirm collagenase do not affect plasma membrane receptor concentrations, we compared receptor concentrations on collagenase-treated HUVECs and HDFs with untreated cells, and found no significant changes (Figure S3).
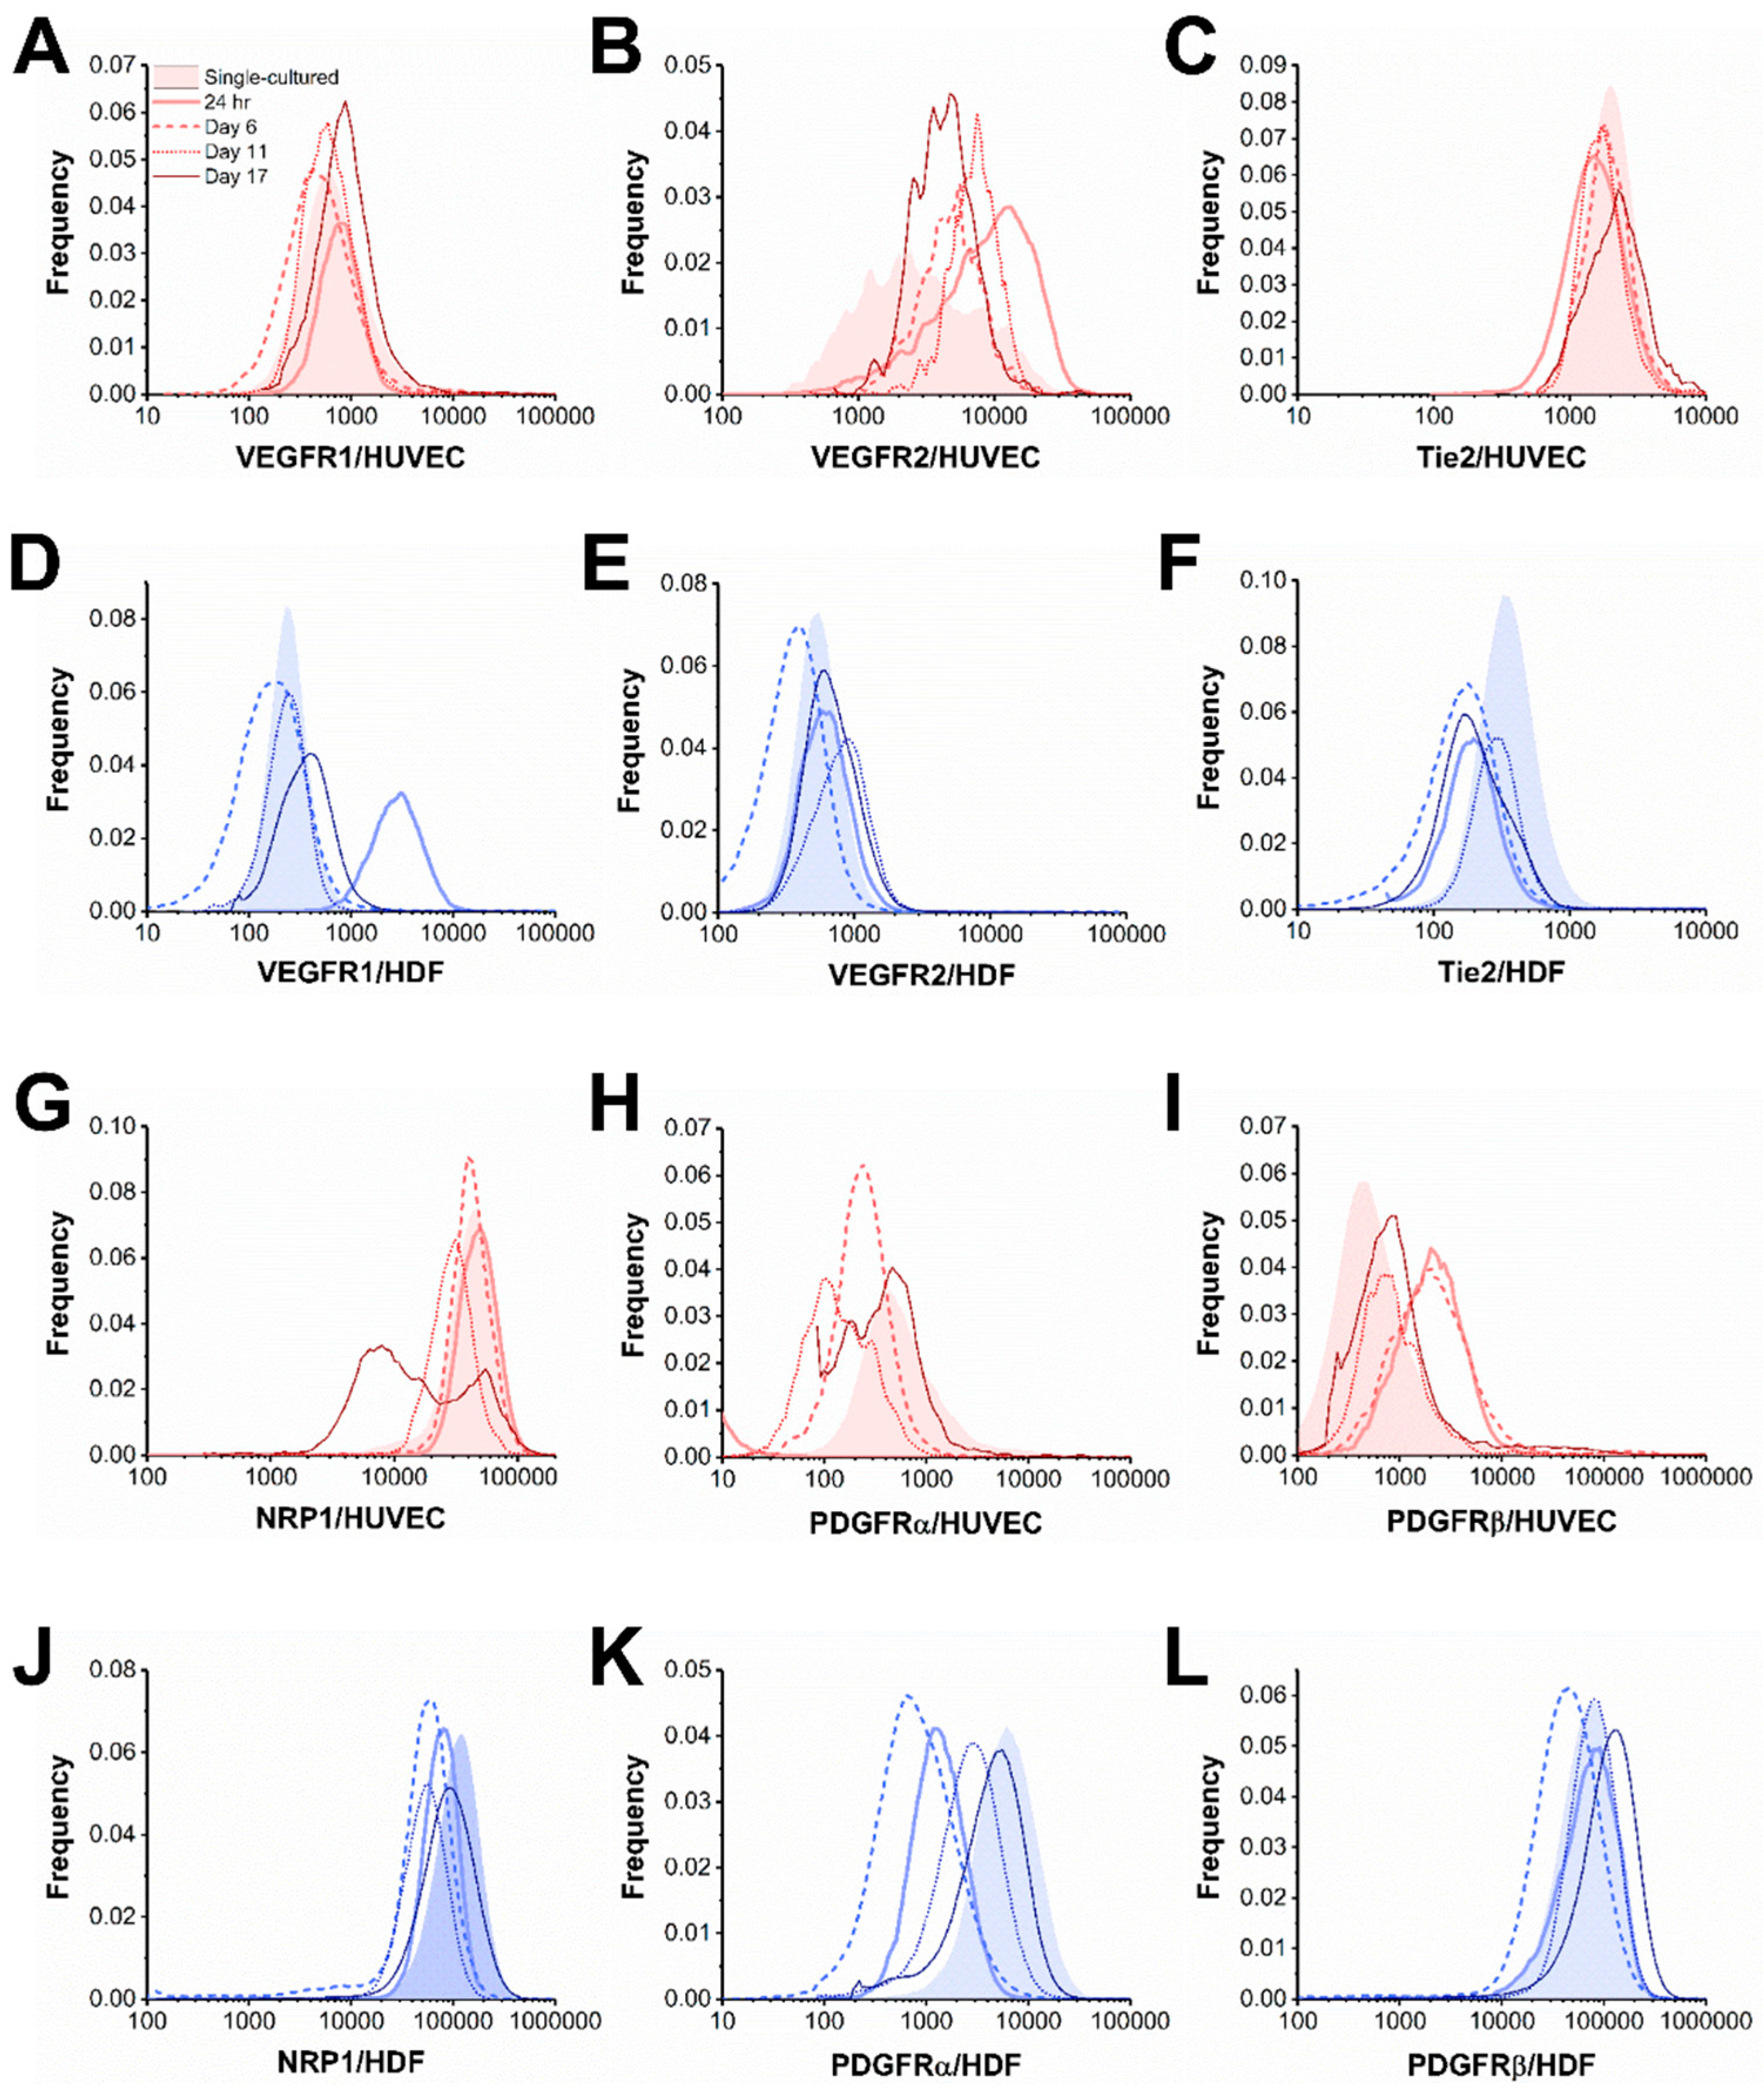
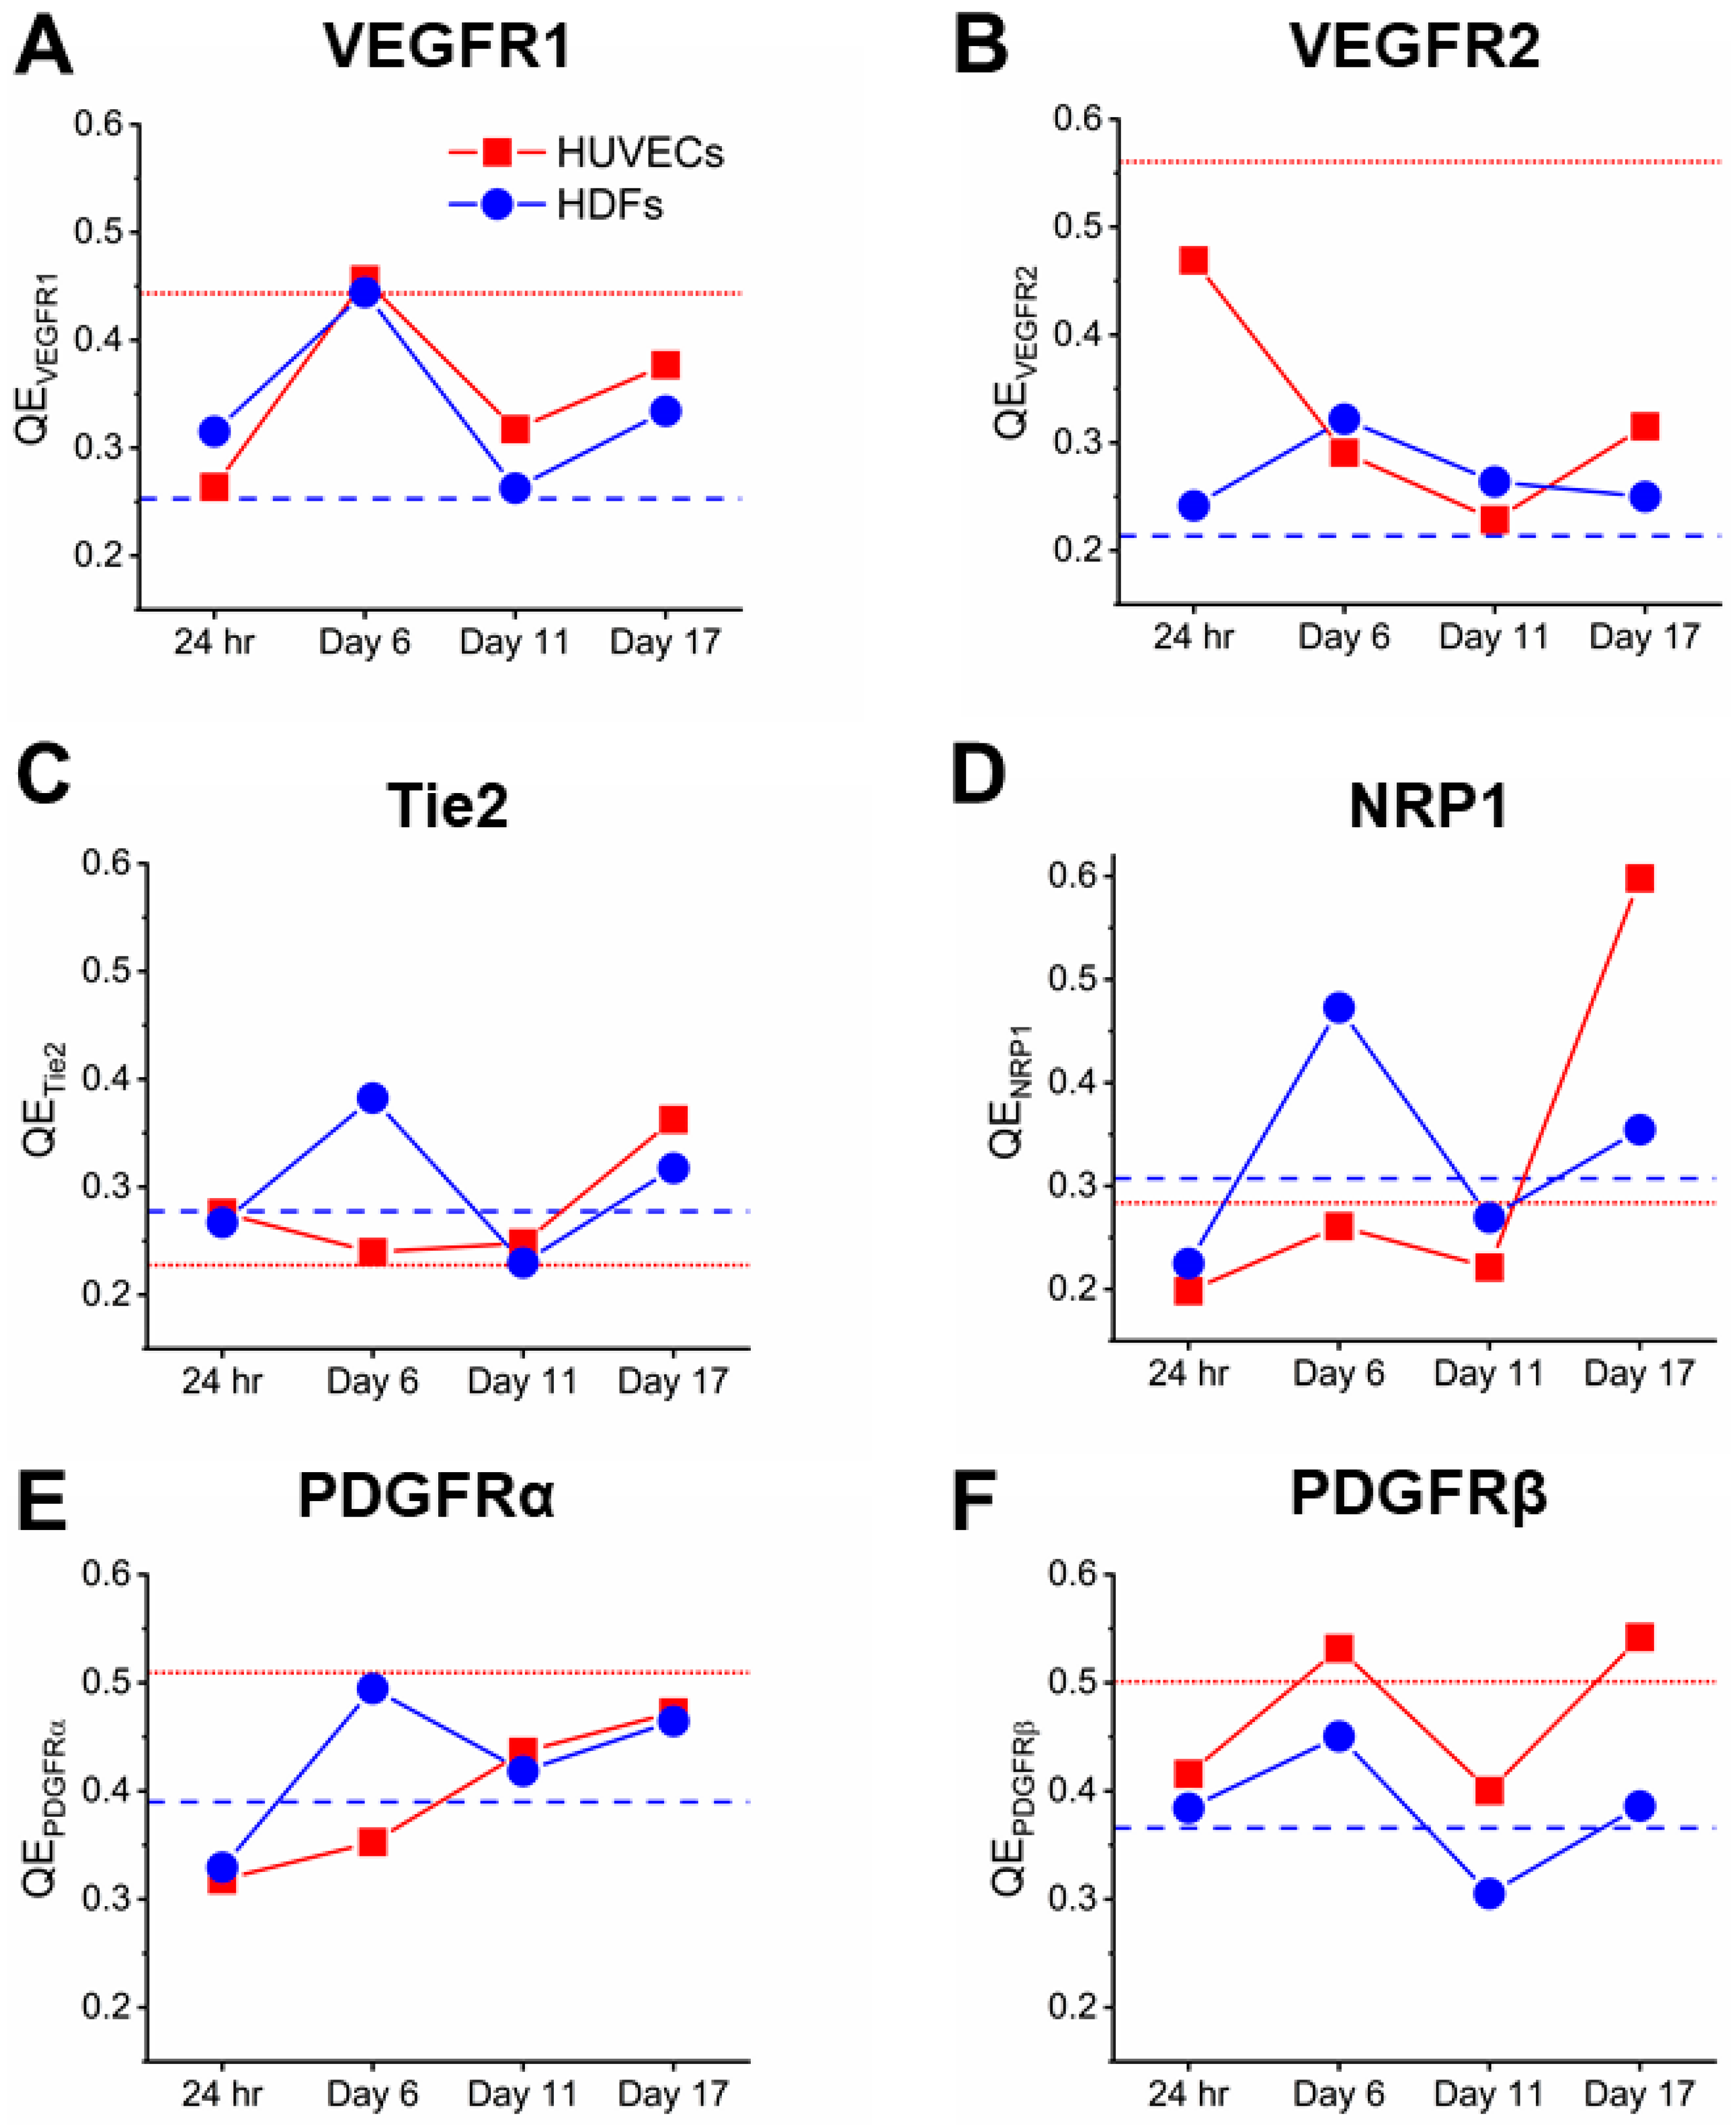
Cell-by-cell analysis of both cocultured HUVECs and HDFs showed homogeneity in VEGFR1 throughout coculturing, as observed by Gaussian lognormal-shaped distributions (Figure 3A,D). The rapid increase of VEGFR1 concentration in cocultured HDFs was reflected by a rightward shift in the cell-by-cell distribution comparing to HDF monoculture (Figure 3D). To quantify the cell heterogeneity within cocultures, we employed quadratic entropy (QE), which divides each cell-by-cell distribution into 500 equally spaced bins, and then sums weighted differences of two bins based on their means and distance between these two bins [50,51,52]. Thus, QE is a measure of cell heterogeneity based on their plasma membrane RTK expression. We confirmed the relatively low cell heterogeneity in VEGFR1 concentration within a HUVEC–HDF coculture, as QE of both cell types remained below 0.45 up to 17 days (Figure 4A).
3.3. Cocultured HUVECs Showed Higher VEGFR2 Concentration than Monoculture throughout Tubule Development
VEGF–VEGFR2 signaling is widely studied, because this signaling is considered to be proangiogenic [53,54]. In line with a VEGFR2 proangiogenic role, we observed significantly higher plasma membrane VEGFR2 concentrations on cocultured HUVECs (4300–8100 receptors per cell) compared to confluent HUVEC monocultures (3300 receptors per cell) (Figure 2B). HDF plasma membranes express low to no VEGFR2s when cocultured alone; similarly, cocultured HDFs had low plasma membrane VEGFR2 (390–1100 receptors per cell) throughout the 17 days of tubule development (Figure 2B).
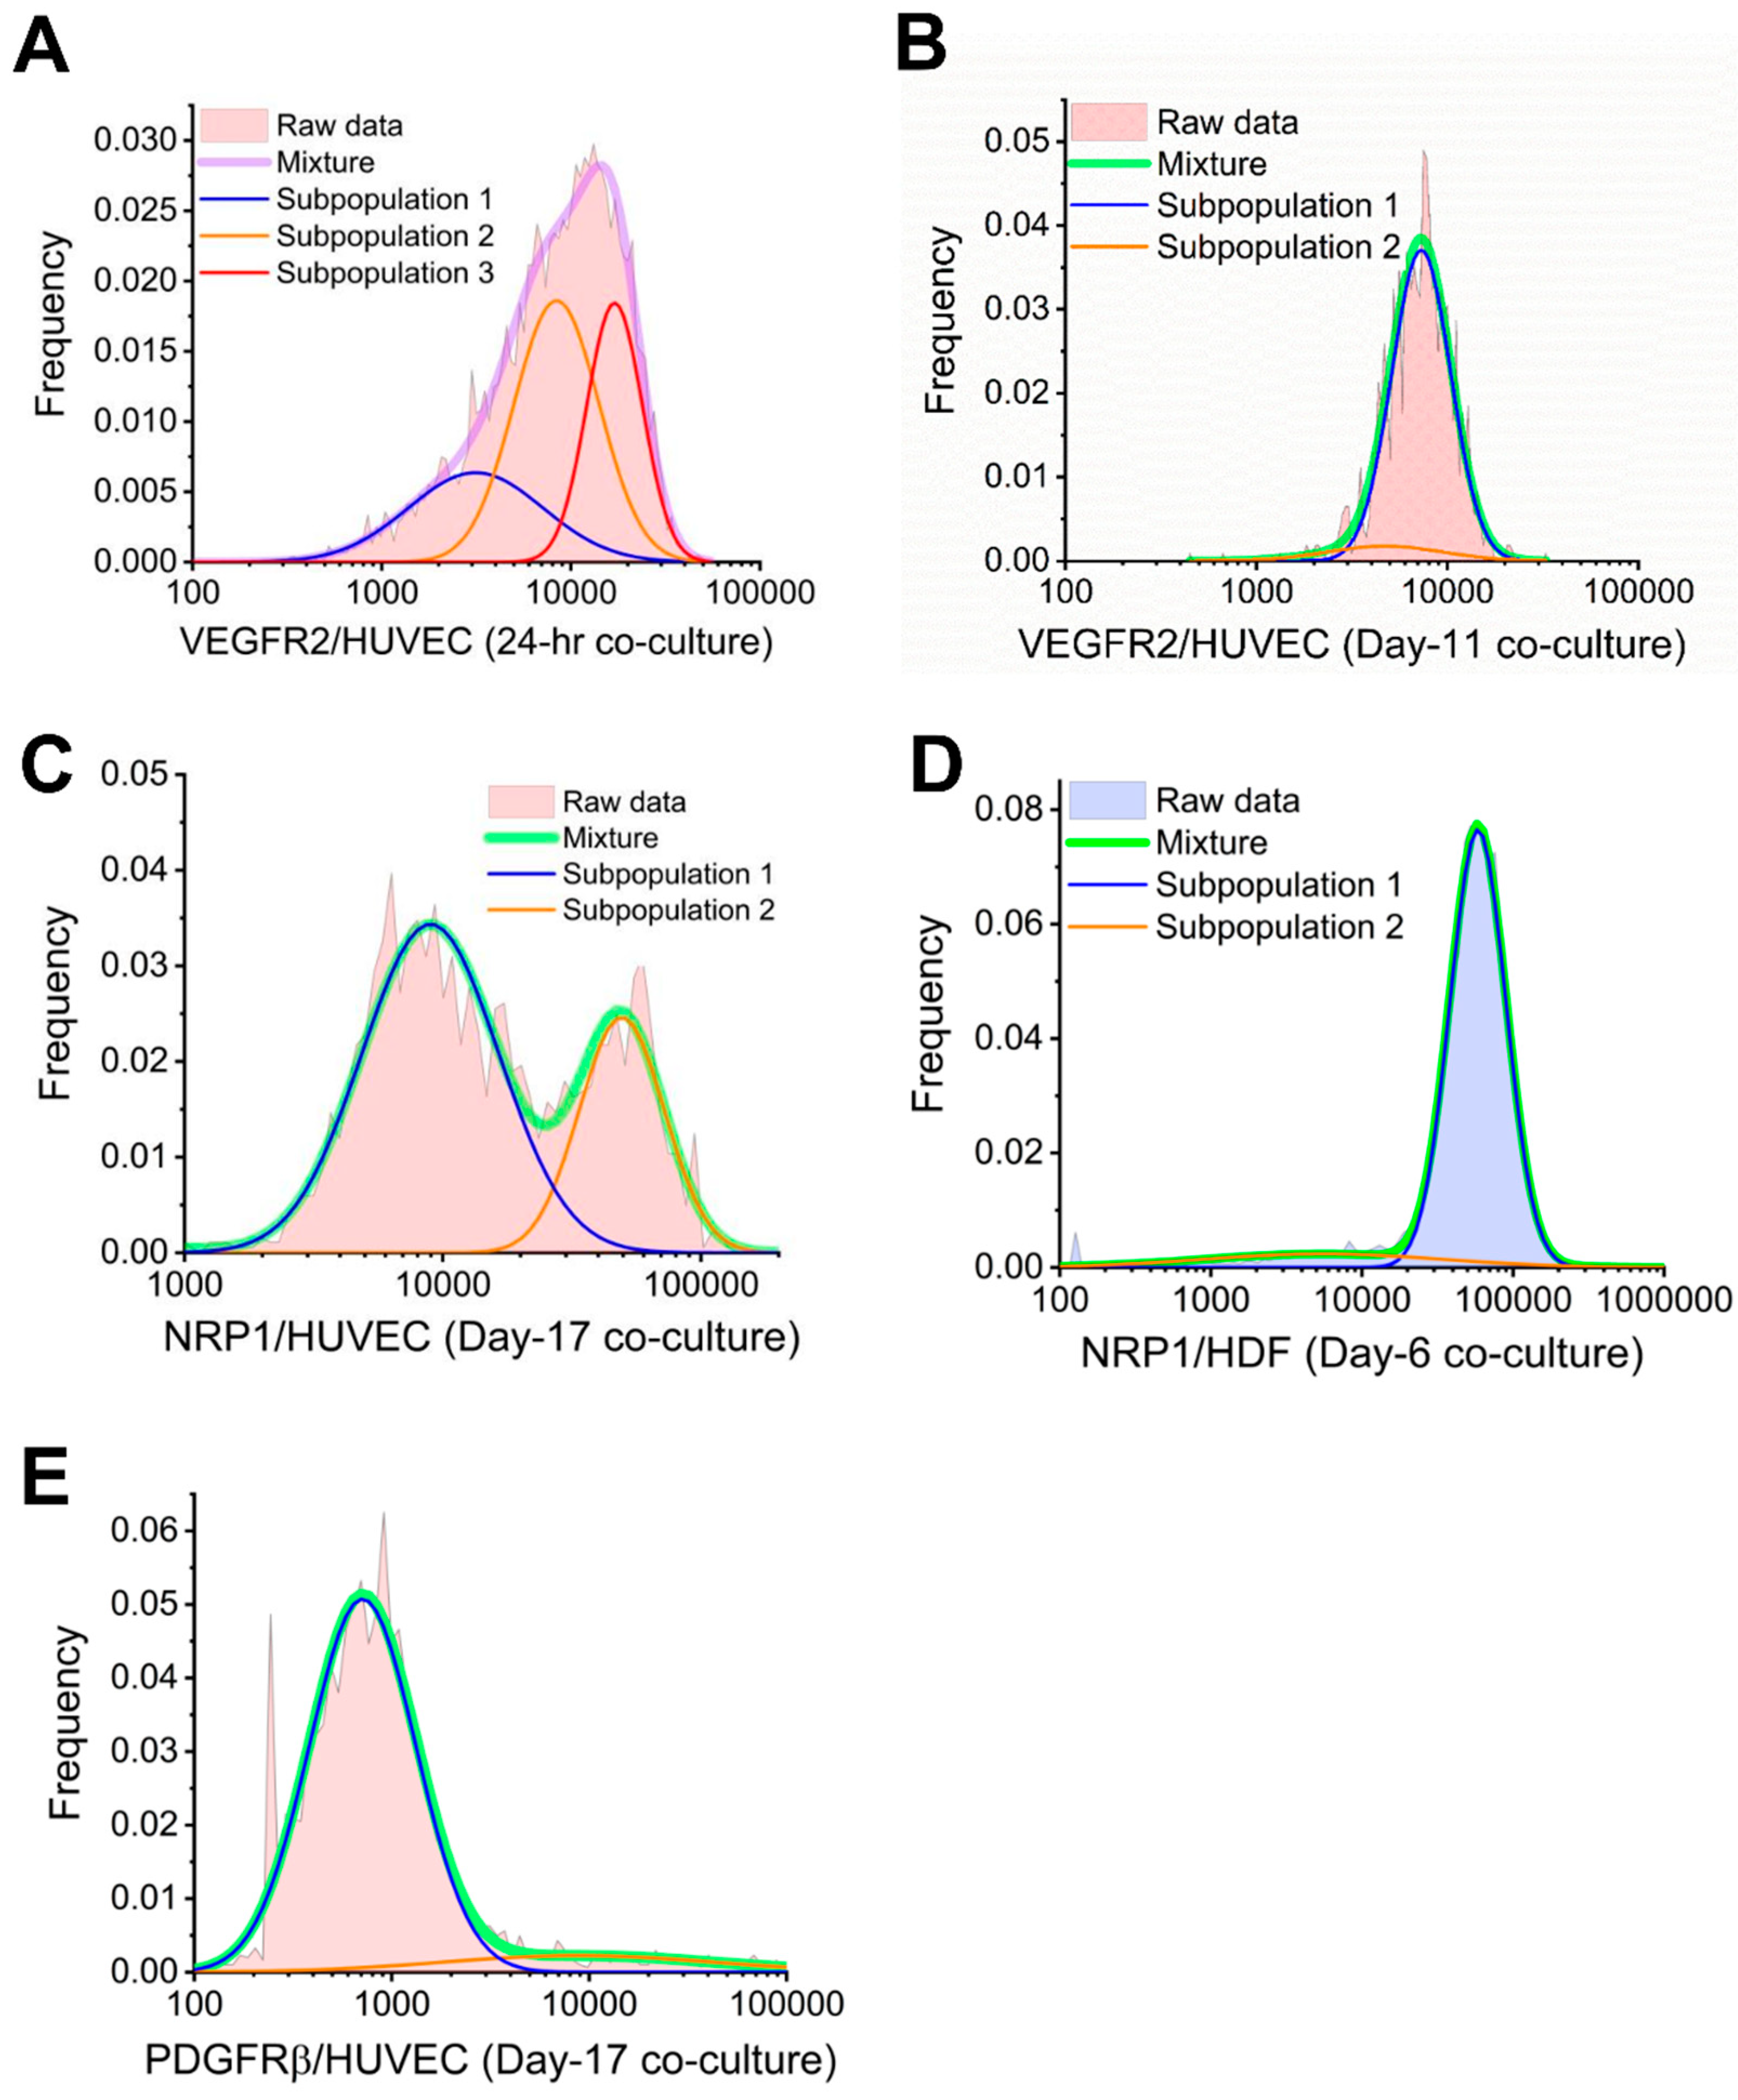
Cell-by-cell analysis suggest subpopulations of varying VEGFR2 concentration among cocultured HUVECs (Figure 3B). This high cell heterogeneity in VEGFR2 plasma membrane concentration was also captured by QE, as QE of 24-h VEGFR2 was approximately two-fold higher than day 6–17 (Figure 4B). The subpopulations within VEGFR2 cell-by-cell distribution and their characteristics were further determined by Gaussian mixture modeling [4,9], a method we employed to identify log-normal subpopulations described by their mean, standard deviation, and density. Particularly, BIC-assisted Gaussian mixture model showed 25% of the HUVECs from 24-h cocultures had 3100 plasma membrane VEGFR2 per cell on average, 46% had an average of 8400 plasma membrane VEGFR2s per cell, and 29% had an average of 17,000 plasma membrane VEGFR2 per cell (Figure 5A). Furthermore, BIC-assisted Gaussian mixture model showed 9% of the HUVECs from day-11 cocultures had 4700 plasma membrane VEGFR2 per cell on average, while 91% had an average of 7300 plasma membrane VEGFR2 per cell (Figure 5B). This HUVEC heterogeneity represented by subpopulations on day 11 was not captured by QE, which was as low as 0.23 (Figure 4B). In contrast, cell-by-cell analysis showed that the majority of HDFs were below 1000 plasma membrane VEGFR2 per cell for both HDF monoculture and cocultured HDFs (Figure 3E). These quantitative results showed that VEGFR2 signaling played an active role in angiogenic ECs throughout tubule formation.
3.4. Tie2 Concentrations on Cocultured HUVECs are Similar to Monocultures
Tie2 maintains the vascular integrity of mature vessels and is thought to mediate quiescence of blood vessels through angiopoietin (Ang)–Tie2 signaling [55]. Although the ensemble average did not reveal significant changes in plasma membrane Tie2 concentrations through 24 h to 17 days of tubule development (1500–2300 Tie2 per cell), when compared to confluent HUVEC monocultures (2100 Tie2 per cell), ensemble averages showed a 50% increase in plasma membrane Tie2 concentration from day 11 to day 17 (Figure 2C). This increase in Tie2 concentration was reflected by a rightward shift of cell-by-cell analysis on day 17 when compared to cocultures at earlier stages (Figure 3C). In contrast, cell-by-cell analysis of HDFs showed that most HDFs, monocultured and cocultured, expressed little to no Tie2 on their plasma membranes (Figure 3F). Cocultured HUVECs showed homogeneity of Tie2 concentration across cells according to cell-by-cell analysis, and the low heterogeneity is confirmed by a relatively low QE, which remained lower than 0.4 throughout tubule formation (Figure 4C).
3.5. NRP1 Concentration Decreased on Cocultured Cells within 11 Days
NRP1, a VEGFR coreceptor, is highly expressed on both ECs and fibroblasts, where we have measured 35,000–73,000 plasma membrane NRP1 per EC and 70,000–120,500 plasma membrane NRP1 per fibroblast in vitro [5,8]. We observed a downregulation of NRP1 on cocultured HUVECs from the initial HUVEC–HDF contacts to day 11 (Figure 2D). Quantitatively, plasma membrane NRP1 concentration on cocultured HUVECs decreased from 47,000 receptors per cell to 28,900 receptors per cell after 11 days, and remained steady until day 17. However, we did not observe any significant difference in plasma membrane NRP1 concentration between HUVEC monocultures and cocultures. In contrast, cocultured HDFs present significantly lower number of NRP1s on their plasma membranes throughout tubule development when compared to monocultures (p < 0.001, Figure 2D). Throughout tubule development, plasma membrane NRP1 concentration on cocultured HDFs decreased from 73,300 receptors per cell to 52,400 receptors per cell within 6 days, and bounced back to 77,800 receptors per cell on day 17.
Cell-by-cell analysis of NRP1 concentration revealed high heterogeneity among cocultured HUVECs on day 17 (Figure 3G), which was confirmed by a high QE of 0.6 (Figure 4D). BIC-assisted Gaussian mixture model identified a low-NRP1 subpopulation (9000 NRP1 per cell, 67%) and a high-NRP1 subpopulation (49,300 NRP1 per cell, 29%) within cocultured HUVECs on day 17 (Figure 5C). For cocultured HDFs, cell-by-cell analysis confirmed the changes in NRP1 plasma membrane concentration by a right-shifted distribution (Figure 3J), while QE remained lower than 0.35 except for day 6 (Figure 4D). In contrast, cocultured HDFs showed low heterogeneity in NRP1 plasma membrane concentrations, as observed by the Gaussian lognormal-shaped distributions (Figure 3J). QE for cocultured HDFs remained similar to or lower than monocultured HDFs except for day 6, suggesting subpopulations (Figure 4D). A further analysis of cocultured HDFs on day 6 revealed a low-NRP1 subpopulation (5500 NRP1 per cell, 12%) and a high-NRP1 subpopulation (58,500 NRP1 per cell, 88%) using a two-component mixture model (Figure 5D).
3.6. PDGFRα and PDGFRβ Showed a Steady Increase on Cocultured HDFs from Day 6
PDGFRs, typically expressed by perivascular cells including pericytes and fibroblasts, serve important roles in supporting vasculature and tissue repair [8,34,35,56,57]. We have previously quantified 4600 plasma membrane PDGFRα per cell and 93,300 plasma membrane PDGFRβ per cell on confluent HDF monoculture, and how growth factors regulate PDGFRs [8]. While plasma membrane PDGFRα concentration on cocultured HDFs remained two- to six-fold lower than monocultured HDFs, we observed a steady increase of plasma membrane PDGFRα from 1,000 receptors per cell on day 6 to 4500 receptors per cell on day 17 (Figure 2E). Similarly, as tubules started to form on day 6, PDGFRβ plasma membrane concentration increased from 34,800 receptors per cell to 103,300 receptors per cell on day 17 (Figure 2F). Cell-by-cell analysis of cocultured HDFs confirmed this increase in both PDGF receptors throughout tubule development (Figure 3K,L). HDF heterogeneity in PDGFR plasma membrane concentrations was relatively low according to the cell-by-cell analysis, which is confirmed by a QE lower than 0.5 for both PDGFRα and PDGFRβ (Figure 4E,F).
3.7. PDGFRβ Observed on Cocultured HUVECs but Not PDGFRα
Almost most macrovascular ECs do not natively express PDGFRs [32,58,59], however, multiple studies have reported PDGFR expression on ECs undergoing angiogenesis [60,61,62]. Aligned with these findings, we observed low to no PDGFRβ plasma membrane expression on HUVEC monocultures, and consistent PDGFRβ expression (~600–2900 PDGFRβ per cell) on cocultured HUVECs throughout tubule development (Figure 2F). In contrast to the steady increase of PDGFRs on HDFs from day 6 to day 17, PDGFRβ plasma membrane concentration on HUVECs were higher during the initial HUVEC–HDF contacts (1900 PDGFRβ per HUVEC after 24 h) and cluster formation (2900 PDGFRβ per HUVEC on day 6), but decreased as tubules develop. Cell-by-cell analysis confirmed the increase in PDGFRβ plasma membrane concentration by day 6, evidenced by a rightward shift of cell-by-cell distribution (Figure 3I). Although ensemble average of PDGFRβ plasma membrane concentration was low on day 17, high-PDGFRβ subpopulation was observed among cocultured HUVECs. A two-component mixture model determined a low-PDGFRβ subpopulation (700 receptors per cell, 90%) and a high-PDGFRβ subpopulation (8800 receptors per cell, 10%) within cocultured HUVECs on day 17 (Figure 5E). This heterogeneity was also captured by a high QE of 0.55 as well as a two-fold increase from day 11 to day 17 (Figure 4F). These quantitative findings showed HUVECs, when interacting with fibroblasts, may express transmembrane PDGF receptors.
In contrast to the consistent PDGFRβ expression on cocultured HUVECs, we found little to no plasma membrane PDGFRα up to 17 days (Figure 2E). Cell-by-cell distributions showed HUVEC heterogeneity in PDGFRα plasma membrane concentrations (Figure 3H), along with a QE higher than 0.3 (Figure 4E). However, this heterogeneity can be due to background noise and nonspecific antibody binding since the receptor concentration is below the measuring limit of qFlow cytometry [32].
4. Discussion
The study of angiogenesis can be advanced when we apply systems biology, the approach combining computational models and quantitative characterization of biological organisms, on experimental models that reflect in vivo systems. However, assessing how in-vivo-like a model is has long been a challenge in the field of angiogenesis [25]. While characterizing morphological features like tube length and network is essential, it is important to incorporate morphological characterization with molecular profiling when assessing the suitability of an in vitro model. This study proposes that profiling temporal dynamics of angiogenic RTKs on single cell membranes during an angiogenesis assay can give us insights into how closely it reflects the in vivo state. We adopted a two-dimensional (2D) HUVEC–HDF coculture assay and measured single-cell RTK concentrations and cell-to-cell heterogeneity as endothelial tubule networks form. We found that the initial contact of HUVECs and HDFs induced an increase of VEGFR1 on HDF plasma membranes within 24 h, whereas monocultured HDFs expressed low to no VEGFRs on their plasma membranes. VEGFR1 on cocultured HUVECs remained a similar concentration as HUVEC monocultures throughout tubule development, whereas VEGFR2 remained a relatively high concentration, suggesting different roles they play during angiogenesis. We observed a ~50% increase in Tie2 concentration on HUVECs during late-stage tube formation, which aligns with the role of Ang–Tie2 signaling mediating quiescence of blood vessels. PDGFRs showed a steady increase on cocultured HDFs from day 6 to day 17, indicating an active role of PDGFRs as fibroblasts support tubule development. Further, we observed PDGFRβ but not PDGFRα on cocultured HUVECs as tubules develop, suggesting different roles PDGFRα and PDGFRβ may play during angiogenesis. In following paragraphs, we will discuss these key findings in detail and compare them with profiles of angiogenic receptors we found in literatures.
The HUVEC–HDF coculture model we adopted from Bishop et al. [28] has several advantages over EC monocultures. Traditionally, EC monocultures in vitro have been used in angiogenesis assays including EC proliferation assays, migration assays, and tube formation assays. Although EC-only models have some advantages in studying certain EC-specific elements, the multicellular processes of angiogenesis call for a more complex experimental model. Indeed, one study found that the morphology of tubules formed in coculture assays were significantly more heterogeneous and more closely resembled capillaries in vivo than Matrigel tubules [27]. In another study, pericytes-EC cocultures showed much narrower and elongated EC tubes compared to EC-only tubes which grow wider and less elongated with time [25,63]. The pairing of ECs and fibroblasts may be the ideal choice for a simple 2D model without adding complex proteins or ECM components. We observed microvessel-like structures, surrounded by fibroblasts, emerged from EC plagues, and lengthened to form a network by day 17 (Figure S1c); while HUVECs by themselves cultured on a 2D flask did not form tubules (Figure S1a), which is consistent with previous studies that cocultured ECs with fibroblasts [28,64]. It makes sense because fibroblasts secret angiogenic factors, such as VEGF and Ang-1, as well as ECM proteins, which are necessary for EC sprouting [33,34,35,36]. One study found that ECs failed to form tubules on smooth muscle cells [64]. Bishop et al. also reported that direct admixture of smooth muscle cells or pericytes with ECs failed to induce tubule formation, likely due to the insufficient amount of ECM components being produced [28]. While pericyte-EC cocultures are more close to capillaries in vivo, fibroblasts may produce more ECM proteins, are easier to obtain and purify than pericytes [65,66], and they express some pericyte markers like PDGFRβ [8,66]. A more in-vivo-like angiogenesis model may be a multiculture with three cell types: ECs which are the main component of vessels, fibroblasts which provide ECM components and growth factors, and pericytes which wrap around vessels and stabilize vessel growth.
The average of ~2700 VEGFR1s per cocultured HDF within 24 h, represents a significant number of VEGFRs, given that HDFs show low to no VEGFR1 when cultured alone [8]. This cannot be contamination from HUVECs, because cell-by-cell analysis of VEGFR1 on cocultured HUVECs shows no subpopulations having higher VEGFR1 concentration that might overlap with VEGFR1–HDF cell-by-cell histogram (Figure 3A,D). The high-VEGFR1 and low-VEGFR2 levels we observe on cocultured HDF plasma membranes after 24 h correlate with previous ex vivo studies showing high-VEGFR1 (36,000 VEGFR1s per cell) and low-VEGFR2 levels on BALB/c derived mouse fibroblasts [6], while the high-VEGFR1 surface-level differs from HDF monoculture and NIH3T3s, both of which do not natively express VEGFR1 or VEGFR2 in vitro [8,67]. Evidence suggests that VEGFR1 may have a functional role of inducing fibroblast migration [68]. The migratory role of VEGFR1 may explain the low to no VEGFR1s on cocultured HDFs on day 6 and onward, comparing to 24-h time point, because fibroblast migration in a coculture may slow down after fibroblasts grow confluent after three days (data not shown). Another study found hypoxia enhance the production of VEGF and soluble VEGFR1 (sVEGFR1) in oviductal stromal fibroblasts, and suggest that fibroblasts can control the growth and permeability of the surrounding microvessel by regulating the production of VEGF and its naturally occurring inhibitor, sVEGFR1 [69]. This antiangiogenic role of VEGFR1 can explain why VEGFR1 on both cocultured HUVECs and HDFs remained low (<800 VEGFR1 per cell) from day 6 to day 17. Further study should examine more time points following the HUVEC/HDF mixing, especially prior to 24 h and between 24 h and 6 days, to gain a more complete understanding of the migratory and antiangiogenic role of VEGFR1 signaling.
VEGF-A stimulation of VEGFR2 induces endothelial cell proliferation, survival, migration, and differentiation resulting in blood vessel formation and sprouting [70]. In line with the critical role VEGFR2 plays in angiogenesis, we observed relatively high VEGFR2 plasma membrane concentrations on cocultured HUVECs (4000–8000 VEGFR2 per cell), comparing to monoculture (~3200 VEGFR2 per cell), suggesting cocultured HUVECs are at a more angiogenic state. Furthermore, our mixture model revealed a make-up of three subpopulations having differential VEGFR2 plasma membrane concentrations within the 24-h cocultured HUVECs (Figure 5A), suggesting that HDF–HUVEC coculture may have induced EC differentiating into multiple phenotypes. These results are consistent with previous reports on relative expression levels of VEGFR2 playing a crucial role in EC differentiation: The highest levels of mRNA and protein of VEGFR2 were found in tip cells [60,71]. One study measured the fold difference between HUVECs with tip cell phenotype and the ones without, and found VEGFR2 expression is ~5.9-fold higher in tip cells, which aligns with our results of a ~5.5-fold higher VEGFR2 transmembrane protein concentration on 29.6% high-VEGFR2 HUVEC subpopulation than 24.7% low-VEGFR2 subpopulation (Figure 5A). Future experiments should include further analysis of sorted high-VEGFR2 HUVECs and their functional characteristics.
We found a 50–150% increase of Tie2 plasma membrane concentration in cocultured HUVEC on day 17 comparing to previous time points we measured (Figure 2C), suggesting the role of Tie2 in maintaining mature vasculature and quiescence. Indeed, Ang–Tie signaling pathways are known to play a role in both promoting angiogenesis and quiescence [72,73,74]. The expression of Tie2 protein on EC plasma membrane aligns with previous studies of ECs in vitro [31,32,75,76] and in vivo [77]. Furthermore, Ang–Tie signaling pathways have been identified as one of the escaping mechanisms tumor vasculature develops in response to anti-VEGF treatment, which made Ang–Tie a novel drug target for antiangiogenesis therapy [78,79]. Using qFlow cytometry, future studies can quantitatively examine how antiangiogenic drugs like Bevacizumab regulates Tie2 concentrations. This will give us insights in whether a 2D HUVEC–HDF coculture system can be used as a tool to study anti-VEGF resistance.
Our findings of PDGFRβ plasma membrane expression on cocultured HUVECs suggest that PDGFRβ may be a biomarker for angiogenic ECs in vivo. It is known that ECs secret PDGFs to recruit perivascular cells like pericytes [56,80], however, the mechanism of how PDGFR defines ECs phenotypes is still unclear, given that cultured ECs do not express PDGFR natively [8,32]. One study showed PDGFRβ proteins on endothelial sprouts (tip-cell-like ECs) but not nonangiogenic ECs (stalk-cell-like ECs) [61]. This dynamic expression of PDGFRβ on ECs is consistent with our findings of a 10% subpopulation of cocultured HUVECs on day 17 with an average of 8800 PDGFRβs per HUVEC, while the rest of HUVECs having much lower PDGFRβ concentration. Another study showed that tip cells are distinguished from stalk cells by their strong expression of PDGF-B mRNA and VEGFR2 mRNA and their proteins in an in situ model of early postnatal retina [60]. Our lab and others have found PDGFR proteins on endothelial-like cells in disease tissues, including glioblastoma (GBM) [7,81], breast carcinoma [82], and ischemic tissues [83]. Particularly, we found ~3000 plasma membrane PDGFRβ per cell on endothelial-like cells using a GBM39 patient-derived xenograft model [7], which is similar to the 2920 PDGFRβ per cell we found on day-6 cocultured HUVECs (Figure 2F). Therefore, the quantification of PDGFRβ will help us identify the angiogenic EC phenotype, which can be used to evaluate the physiological relevance of the model.
EC heterogeneity, including variations in cell morphology, protein expression, and function, is a hallmark of vasculatures in vivo [7,84,85]; recent advances in single-cell technologies [32,86,87,88,89] have allowed for characterization of such heterogeneity. To quantify heterogeneity of each cell population, we used two statistical methods in this study: Quadratic entropy (QE) and BIC-assisted Gaussian mixture modeling. Interestingly, both cocultured HDFs and HUVECs showed relatively low heterogeneity determined by a 0.2–0.6 QE, whereas ECs from a GBM xenograft had higher QE (0.6–1.3) [7], suggesting that our fibroblast–EC coculture may be closer to in vitro monocultures than in vivo tissue as to cell-to-cell receptor variation. The discrepancy of QE between our coculture model and GBM tissue could be due to the lack of physical variables like levels of oxygen, flow, pressure, 3D environment, etc. in the 2D coculture system. Therefore, characterizing EC heterogeneity in coculture models is necessary to develop in vitro models that are biologically faithful. Alternatively, BIC-assisted Gaussian mixture model determines the number of mixture components within each cell population, thus, is a measurement of cell heterogeneity. Generally, one to two mixture components are considered low heterogeneity [32], while more than two components is considered highly heterogeneous [4,7,9]. In this study, BIC-assisted Gaussian modeling revealed two to three subpopulations among cocultured HUVECs with varying concentrations of VEGFR2, NRP1, and PDGFRβ, which was not seen in monocultures previously, suggesting that introducing HDFs, even in vitro, may have a determining effect on EC differentiation, and thus, one step closer to angiogenic ECs in vivo.
5. Conclusions
In summary, we adopted a simple 2D human angiogenesis assay comprised of HUVECs and HDFs, and examined temporal dynamics of concentrations and heterogeneity of a panel of 6 angiogenic receptors up to 17 days. Particularly, we optimized and established the seeding conditions so that HUVECs supported by HDFs form capillary-like structures during the 17 days. Within 24 h coculturing, we observed ~2700 VEGFR1 per cell on HDFs, which do not natively express VEGFR when cultured alone. In line with the proangiogenic role of VEGFR2, we observed 20–140% increase in plasma membrane VEGFR2 concentrations (4000–8100 receptors per cell) on cocultured HUVECs as tubules develop when compared to monocultures. We observed a ~50% increase in Tie2 concentration on HUVECs during late-stage tube formation, which aligns with the theory that Ang–Tie2 signaling mediates quiescence of blood vessels. We showed steady increase of PDGFRs on HDFs; in particular, PDGFRβs were found on HUVECs during the first 6 h of coculturing (1900–2900 PDGFRβs per cell). These quantitative findings showcased for the first time how EC-stromal contact affects plasma membrane receptor concentrations when compared to EC monocultures.
A robust, in-vivo-like, quantifiable angiogenesis model will not only advance pharmacologic validation of antiangiogenic drugs, but will also provide accurate parameters to computational models. Traditional in vitro assays investigating angiogenesis utilize complex protein mixture (e.g., Matrigel) to induce EC differentiation and tubule formation; however, the tubules formed in these assays suffer from a lack of heterogeneity and debatable lumens [90,91]. Our coculture assay is technically simple, reproducible, and inexpensive; coculture models have several advantages, including the incorporation of stromal cells (e.g., fibroblasts that secrete growth factors and ECM) and heterogeneous cell–cell contact. One disadvantage of coculture assays is that interactions between ECs and stromal cells are undefined and the method is less well-characterized [27,90]. Therefore, reliable, quantified coculture assays like ours are necessary to study EC–stromal interactions. Another limitation of 2D assays is the lack of biomechanical forces (e.g., shear stress) present in vivo [24,85,92,93], recent advances in microfluidics have allowed the development of perfused vascular 3D models [94]. Future studies should extend the single-cell receptor quantification to vessels in vivo and other types of preclinical angiogenesis models to evaluate their physiological relevance.
The VEGFRs and PDGFRs belong to the same RTK class, immunoglobulin (Ig)-like RTKs [53,95]. Ig-like RTKs are equipped with an extracellular ligand-binding domain consists of immunoglobulin (Ig)-like domains. This RTK class include several important receptors including receptors for fibroblast growth factor (FGF) [96], which are involved in the regulation of angiogenesis [97]. Therefore, quantification of other RTKs with similar Ig-like extracellular domains will be a good extension of this study.
Supplementary Materials
The following are available online at https://www.mdpi.com/2227-9717/7/6/356/s1, Figure S1: HUVEC–HDF coculture tubule formation dependent on seeding conditions; Figure S2: Representative fluorescence image of the 24-h-old HUVEC–HDF cocultures; Figure S3: Comparison of receptor concentrations on monocultured cells dissociated using CellStripperTM and cells dissociated using 0.2% collagenase type IV with intermittent vortexing.
Author Contributions
Conceptualization, S.C. and P.I.I.; methodology, S.C. and P.I.I.; software, S.C..; validation, S.C. and P.I.I.; formal analysis, S.C.; investigation, S.C. and P.I.I.; resources, P.I.I.; data curation, S.C. and P.I.I.; writing—original draft preparation, S.C. and P.I.I.; writing—review and editing, S.C. and P.I.I.; visualization, S.C. and P.I.I.; supervision, P.I.I.; project administration, S.C. and P.I.I.; funding acquisition, P.I.I.
Funding
This research was funded by National Science Foundation (1653925) and the American Heart Association (16SDG26940002).
Acknowledgments
The authors would like to thank Michael Vahey at Washington University in Saint Louis for his assistance with the FluoView® FV3000 confocal laser scanning microscope. The authors would also like to acknowledge Kareem Al-Qadi, Brent Wu, and Brendan Mathias for their assistance with experiments and helpful discussion.
Conflicts of Interest
The authors declare no conflict of interest.
Abbreviation
| HUVEC | Human umbilical vein endothelial cell |
| HDF | Human dermal fibroblasts |
| VEGF | Vascular endothelial growth factor |
| Ang | Angiopoietin |
| PDGF | Platelet-derived growth factor |
| FGF | Fibroblast growth factor |
| NRP | Neuropilin |
| PFA | Paraformaldehyde |
| BSA | Bovine serum albumin |
| FBS | Fetal bovine serum |
| DMEM | Dulbecco’s Modified Eagle Media |
| EGM | Endothelial Growth Media |
| EDTA | Ethylenediaminetetraacetic acid |
| HBSS | Hank’s Balanced Salt Solution |
| PE | Phycoerythrin |
| FITC | Fluorescein isothiocyanate |
| DAPI | 4′,6-diamidino-2-phenylindole |
| QE | Quadratic entropy |
| ECM | Extracellular matrix |
| GBM | Glioblastoma |
| Ig | Immunoglobulin |
References
- Folkman, J.; D’Amore, P.A. Blood Vessel Formation: What Is Its Molecular Basis? Cell 1996, 87, 1153–1155. [Google Scholar] [CrossRef] [Green Version]
- Folkman, J. Tumor angiogenesis: Therapeutic implications. N. Engl. J. Med. 1971, 285, 1182–1186. [Google Scholar] [PubMed]
- Imoukhuede, P.I.; Dokun, A.O.; Annex, B.H.; Popel, A.S. Endothelial cell-by-cell profiling reveals the temporal dynamics of VEGFR1 and VEGFR2 membrane localization after murine hindlimb ischemia. Am. J. Physiol. Hear. Circ. Physiol. 2013, 304, H1085–H1093. [Google Scholar] [CrossRef] [PubMed] [Green Version]
- Imoukhuede, P.I.; Popel, A.S. Quantitative fluorescent profiling of VEGFRs reveals tumor cell and endothelial cell heterogeneity in breast cancer xenografts. Cancer Med. 2014, 3, 225–244. [Google Scholar] [CrossRef] [PubMed]
- Imoukhuede, P.I.; Popel, A.S. Quantification and cell-to-cell variation of vascular endothelial growth factor receptors. Exp. Cell Res. 2011, 317, 955–965. [Google Scholar] [CrossRef] [PubMed] [Green Version]
- Imoukhuede, P.I.; Popel, A.S. Expression of VEGF receptors on endothelial cells in mouse skeletal muscle. PLoS ONE 2012, 7, e44791. [Google Scholar] [CrossRef]
- Chen, S.; Le, T.; Harley, B.A.C.; Imoukhuede, P.I. Characterizing Glioblastoma Heterogeneity via Single-Cell Receptor Quantification. Front. Bioeng. Biotechnol. 2018, 6, 92. [Google Scholar] [CrossRef] [PubMed] [Green Version]
- Chen, S.; Guo, X.; Imarenezor, O.; Imoukhuede, P.I. Quantification of VEGFRs, NRP1, and PDGFRs on Endothelial Cells and Fibroblasts Reveals Serum, Intra-Family Ligand, and Cross-Family Ligand Regulation. Cell. Mol. Bioeng. 2015, 8, 383–403. [Google Scholar] [CrossRef]
- Weddell, J.C.; Imoukhuede, P.I. Quantitative characterization of cellular membrane-receptor heterogeneity through statistical and computational modeling. PLoS ONE 2014, 9, e97271. [Google Scholar] [CrossRef]
- Finley, S.D.; Engel-Stefanini, M.O.; Imoukhuede, P.I.; Popel, A.S. Pharmacokinetics and pharmacodynamics of VEGF-neutralizing antibodies. BMC Syst. Biol. 2011, 5, 193. [Google Scholar] [CrossRef]
- Gabhann, F.M.; Popel, A.S. Systems Biology of Vascular Endothelial Growth Factors. Microcirculation 2008, 15, 715–738. [Google Scholar] [CrossRef] [PubMed] [Green Version]
- Finley, S.D.; Chu, L.-H.; Popel, A.S. Computational systems biology approaches to anti-angiogenic cancer therapeutics. Drug Discov. Today 2014, 20, 187–197. [Google Scholar] [CrossRef] [PubMed] [Green Version]
- Qutub, A.A.; Mac Gabhann, F.; Karagiannis, E.D.; Vempati, P.; Popel, A.S. Multiscale models of angiogenesis. IEEE Eng. Med. Biol. Mag. 2009, 28, 14–31. [Google Scholar] [CrossRef] [PubMed] [Green Version]
- Mac Gabhann, F.; Qutub, A.A.; Annex, B.H.; Popel, A.S. Systems biology of pro-angiogenic therapies targeting the VEGF system. Wiley Interdiscip. Rev. Syst. Biol. Med. 2010, 2, 694–707. [Google Scholar] [CrossRef] [PubMed]
- Vempati, P.; Popel, A.S.; Mac Gabhann, F. Formation of VEGF isoform-specific spatial distributions governing angiogenesis: Computational analysis. BMC Syst. Biol. 2011, 5, 59. [Google Scholar] [CrossRef] [PubMed]
- Vempati, P.; Mac Gabhann, F.; Popel, A.S. Quantifying the proteolytic release of extracellular matrix-sequestered VEGF with a computational model. PLoS ONE 2010, 5, e11860. [Google Scholar] [CrossRef] [PubMed]
- Mac Gabhann, F.; Ji, J.W.; Popel, A.S. VEGF gradients, receptor activation, and sprout guidance in resting and exercising skeletal muscle. J. Appl. Physiol. 2007, 102, 722–734. [Google Scholar] [CrossRef] [PubMed] [Green Version]
- Liu, G.; Qutub, A.A.; Vempati, P.; Mac Gabhann, F.; Popel, A.S. Module-based multiscale simulation of angiogenesis in skeletal muscle. Theor. Biol. Med. Model. 2011, 8, 6. [Google Scholar] [CrossRef]
- Qutub, A.A.; Popel, A.S. Elongation, proliferation & migration differentiate endothelial cell phenotypes and determine capillary sprouting. BMC Syst. Biol. 2009, 3, 13. [Google Scholar]
- Ji, J.W.; Mac Gabhann, F.; Popel, A.S. Skeletal muscle VEGF gradients in peripheral arterial disease: Simulations of rest and exercise. Am. J. Physiol. Heart Circ. Physiol. 2007, 293, H3740–H3749. [Google Scholar] [CrossRef]
- Weickhardt, A.J.; Williams, D.S.; Lee, C.K.; Chionh, F.; Simes, J.; Murone, C.; Wilson, K.; Parry, M.M.; Asadi, K.; Scott, A.M.; et al. Vascular endothelial growth factor D expression is a potential biomarker of bevacizumab benefit in colorectal cancer. Br. J. Cancer 2015, 113, 37–45. [Google Scholar] [CrossRef] [PubMed] [Green Version]
- Cirit, M.; Haugh, J.M. Data-driven modelling of receptor tyrosine kinase signalling networks quantifies receptor-specific potencies of PI3K- and Ras-dependent ERK activation. Biochem. J. 2012, 441, 77–85. [Google Scholar] [CrossRef]
- Park, C.S.; Schneider, I.C.; Haugh, J.M. Kinetic analysis of platelet-derived growth factor receptor/phosphoinositide 3-kinase/Akt signaling in fibroblasts. J. Biol. Chem. 2003, 278, 37064–37072. [Google Scholar] [CrossRef] [PubMed]
- Chen, S.; Ansari, A.; Sterrett, W.; Hurley, K.; Kemball, J.; Weddell, J.C.; Imoukhuede, P.I. Current State-of-the-Art and Future Directions in Systems Biology. Prog. Commun. Sci. 2014, 1, 12–26. [Google Scholar]
- Nowak-Sliwinska, P.; Alitalo, K.; Allen, E.; Anisimov, A.; Aplin, A.C.; Auerbach, R.; Augustin, H.G.; Bates, D.O.; van Beijnum, J.R.; Bender, R.H.F.; et al. Consensus guidelines for the use and interpretation of angiogenesis assays. Angiogenesis 2018, 21, 425–532. [Google Scholar] [CrossRef] [PubMed] [Green Version]
- Auerbach, R. Angiogenesis Assays: A Critical Overview. Clin. Chem. 2003, 49, 32–40. [Google Scholar] [CrossRef] [Green Version]
- Donovan, D.; Brown, N.J.; Bishop, E.T.; Lewis, C.E. Comparison of three in vitro human ‘angiogenesis’ assays with capillaries formed in vivo. Angiogenesis 2001, 4, 113–121. [Google Scholar] [CrossRef]
- Bishop, E.T.; Bell, G.T.; Bloor, S.; Broom, I.J.; Hendry, N.F.; Wheatley, D.N. An in vitro model of angiogenesis: Basic features. Angiogenesis 1999, 3, 335–344. [Google Scholar] [CrossRef]
- Lin, S.-L.; Kisseleva, T.; Brenner, D.A.; Duffield, J.S. Pericytes and Perivascular Fibroblasts Are the Primary Source of Collagen-Producing Cells in Obstructive Fibrosis of the Kidney. Am. J. Pathol. 2008, 173, 1617–1627. [Google Scholar] [CrossRef] [Green Version]
- Ross, R.; Raines, E.W.; Bowen-Pope, D.F. The biology of platelet-derived growth factor. Cell 1986, 46, 155–169. [Google Scholar] [CrossRef]
- Wolfe, A.; O’Clair, B.; Groppi, V.E.; McEwen, D.P. Pharmacologic Characterization of a Kinetic In Vitro Human Co-Culture Angiogenesis Model Using Clinically Relevant Compounds. J. Biomol. Screen. 2013, 18, 1234–1245. [Google Scholar] [CrossRef] [PubMed] [Green Version]
- Chen, S.; Weddell, J.C.; Gupta, P.; Conard, G.; Parkin, J.; Imoukhuede, P.I. qFlow cytometry-based receptoromic screening: A high-throughput quantification approach informing biomarker selection and nanosensor development. In Methods in Molecular Biology; Hurst Petrosko, S., Day, E., Eds.; Springer: New York, NY, USA, 2017; pp. 117–138. [Google Scholar]
- Evensen, L.; Micklem, D.R.; Blois, A.; Berge, S.V.; Aarsæther, N.; Littlewood-Evans, A.; Wood, J.; Lorens, J.B. Mural Cell Associated VEGF Is Required for Organotypic Vessel Formation. PLoS ONE 2009, 4, e5798. [Google Scholar] [CrossRef] [PubMed]
- Andrae, J.; Gallini, R.; Betsholtz, C. Role of platelet-derived growth factors in physiology and medicine. Genes Dev. 2008, 22, 1276–1312. [Google Scholar] [CrossRef] [PubMed] [Green Version]
- Gaengel, K.; Genové, G.; Armulik, A.; Betsholtz, C. Endothelial-mural cell signaling in vascular development and angiogenesis. Arterioscler. Thromb. Vasc. Biol. 2009, 29, 630–638. [Google Scholar] [CrossRef] [PubMed]
- Nicosia, R.F. The aortic ring model of angiogenesis: A quarter century of search and discovery. J. Cell. Mol. Med. 2009, 13, 4113–4136. [Google Scholar] [CrossRef]
- Willett, C.G.; Boucher, Y.; di Tomaso, E.; Duda, D.G.; Munn, L.L.; Tong, R.T.; Chung, D.C.; Sahani, D.V.; Kalva, S.P.; Kozin, S.V.; et al. Direct evidence that the VEGF-specific antibody bevacizumab has antivascular effects in human rectal cancer. Nat. Med. 2004, 10, 145. [Google Scholar] [CrossRef] [PubMed]
- Friis, T.; Kjaer Sorensen, B.; Engel, A.-M.; Rygaard, J.; Houen, G. A quantitative ELISA-based co-culture angiogenesis and cell proliferation assay. APMIS 2003, 111, 658–668. [Google Scholar] [CrossRef] [PubMed]
- Zudaire, E.; Gambardella, L.; Kurcz, C.; Vermeren, S. A computational tool for quantitative analysis of vascular networks. PLoS ONE 2011, 6, e27385. [Google Scholar] [CrossRef]
- Bergers, G.; Song, S.; Meyer-Morse, N.; Bergsland, E.; Hanahan, D. Benefits of targeting both pericytes and endothelial cells in the tumor vasculature with kinase inhibitors. J. Clin. Investig. 2003, 111, 1287–1295. [Google Scholar] [CrossRef] [Green Version]
- Erber, R.; Thurnher, A.; Katsen, A.D.; Groth, G.; Kerger, H.; Hammes, H.-P.; Menger, M.D.; Ullrich, A.; Vajkoczy, P. Combined inhibition of VEGF and PDGF signaling enforces tumor vessel regression by interfering with pericyte-mediated endothelial cell survival mechanisms. FASEB J. 2004, 18, 338–340. [Google Scholar] [CrossRef]
- Casanovas, O.; Hicklin, D.J.; Bergers, G.; Hanahan, D. Drug resistance by evasion of antiangiogenic targeting of VEGF signaling in late-stage pancreatic islet tumors. Cancer Cell 2005, 8, 299–309. [Google Scholar] [CrossRef] [PubMed] [Green Version]
- Lyer, S.; Bishop, J.; Abrams, B.; Maino, V.; Ward, A.; Christian, T.; Davis, K. QuantiBRITE: A new standard for PE flourescence quantitation. In White Paper; Becton Dickinson Immunocytometry Systems: San Jose, CA, USA, 1997. [Google Scholar]
- Kulwinder, K.P.; Edward, T.J.; Sujata, B.I. Performance evaluation of quantiBRITE phycoerythrin beads. Cytometry 2001, 45, 250–258. [Google Scholar]
- Caré, B.R.; Soula, H.A.; Heffetz, D.; Yehiel, Z.; Flörke, R.; Schnaith, K.; Passlack, W.; Wichert, M.; Kuehn, L.; Fabry, M.; et al. Impact of receptor clustering on ligand binding. BMC Syst. Biol. 2011, 5, 48. [Google Scholar] [CrossRef] [PubMed]
- Mahama, P.A.; Linderman, J.J. A Monte Carlo study of the dynamics of G-protein activation. Biophys. J. 1994, 67, 1345–1357. [Google Scholar] [CrossRef] [Green Version]
- Shibuya, M. Vascular endothelial growth factor receptor-1 (VEGFR-1/Flt-1): A dual regulator for angiogenesis. Angiogenesis 2006, 9, 225–230. [Google Scholar] [CrossRef] [PubMed]
- Stefanini, M.O.; Wu, F.T.H.; Mac Gabhann, F.; Popel, A.S. Increase of plasma VEGF after intravenous administration of bevacizumab is predicted by a pharmacokinetic model. Cancer Res. 2010, 70, 9886–9894. [Google Scholar] [CrossRef]
- Weddell, J.C.; Chen, S.; Imoukhuede, P.I. VEGFR1 promotes cell migration and proliferation through PLCγ and PI3K pathways. NPJ Syst. Biol. Appl. 2018, 4, 1. [Google Scholar] [CrossRef] [PubMed]
- Rao, C.R. Diversity and dissimilarity coefficients: A unified approach. Theor. Popul. Biol. 1982, 21, 24–43. [Google Scholar] [CrossRef]
- Pavoine, S.; Dolédec, S. The apportionment of quadratic entropy: A useful alternative for partitioning diversity in ecological data. Environ. Ecol. Stat. 2005, 12, 125–138. [Google Scholar] [CrossRef]
- Botta-Dukát, Z. Rao’s quadratic entropy as a measure of functional diversity based on multiple traits. J. Veg. Sci. 2005, 16, 533–540. [Google Scholar] [CrossRef]
- Olsson, A.-K.; Dimberg, A.; Kreuger, J.; Claesson-Welsh, L. VEGF receptor signalling—In control of vascular function. Nat. Rev. Mol. Cell Biol. 2006, 7, 359–371. [Google Scholar] [CrossRef] [PubMed]
- Koch, S.; Claesson-Welsh, L. Signal transduction by vascular endothelial growth factor receptors. Cold Spring Harb. Perspect. Med. 2012, 2, a006502. [Google Scholar] [CrossRef] [PubMed]
- Fukuhara, S.; Sako, K.; Minami, T.; Noda, K.; Kim, H.Z.; Kodama, T.; Shibuya, M.; Takakura, N.; Koh, G.Y.; Mochizuki, N. Differential function of Tie2 at cell–cell contacts and cell–substratum contacts regulated by angiopoietin-1. Nat. Cell Biol. 2008, 10, 513–526. [Google Scholar] [CrossRef] [PubMed]
- Hellström, M.; Kalén, M.; Lindahl, P.; Abramsson, A.; Betsholtz, C. Role of PDGF-B and PDGFR-beta in recruitment of vascular smooth muscle cells and pericytes during embryonic blood vessel formation in the mouse. Development 1999, 126, 3047–3055. [Google Scholar] [PubMed]
- Zhang, J.; Cao, R.; Zhang, Y.; Jia, T.; Cao, Y.; Wahlberg, E. Differential roles of PDGFR-alpha and PDGFR-beta in angiogenesis and vessel stability. FASEB J. 2009, 23, 153–163. [Google Scholar] [CrossRef] [PubMed]
- Raines, E.W.; Bowen-Pope, D.F.; Ross, R. Platelet-Derived Growth Factor. In Peptide Growth Factors and Their Receptors I; Springer: New York, NY, USA, 1991; pp. 173–262. [Google Scholar]
- Lindner, V.; Reidy, M.A. Platelet-derived growth factor ligand and receptor expression by large vessel endothelium in vivo. Am. J. Pathol. 1995, 146, 1488–1497. [Google Scholar] [PubMed]
- Gerhardt, H.; Golding, M.; Fruttiger, M.; Ruhrberg, C.; Lundkvist, A.; Abramsson, A.; Jeltsch, M.; Mitchell, C.; Alitalo, K.; Shima, D.; et al. VEGF guides angiogenic sprouting utilizing endothelial tip cell filopodia. J. Cell Biol. 2003, 161, 1163–1177. [Google Scholar] [CrossRef]
- Battegay, E.J.; Rupp, J.; Iruela-Arispe, L.; Sage, E.H.; Pech, M. PDGF-BB modulates endothelial proliferation and angiogenesis in vitro via PDGF beta-receptors. J. Cell Biol. 1994, 125, 917–928. [Google Scholar] [CrossRef]
- Smits, A.; Hermansson, M.; Nister, M.; Karnushina, I.; Heldin, C.-H.; Westermark, B.; Funa, K. Rat Brain Capillary Endothelial Cells Express Functional PDGF B-Type Receptors. Growth Factors 1989, 2, 1–8. [Google Scholar] [CrossRef]
- Stratman, A.N.; Malotte, K.M.; Mahan, R.D.; Davis, M.J.; Davis, G.E. Pericyte recruitment during vasculogenic tube assembly stimulates endothelial basement membrane matrix formation. Blood 2009, 114, 5091–5101. [Google Scholar] [CrossRef] [Green Version]
- Sieveking, D.P.; Buckle, A.; Celermajer, D.S.; Ng, M.K.C. Strikingly different angiogenic properties of endothelial progenitor cell subpopulations: Insights from a novel human angiogenesis assay. J. Am. Coll. Cardiol. 2008, 51, 660–668. [Google Scholar] [CrossRef] [PubMed]
- Bryan, B.A.; D’Amore, P.A. Pericyte isolation and use in endothelial/pericyte coculture models. Methods Enzymol. 2008, 443, 315–331. [Google Scholar] [PubMed]
- Armulik, A.; Genové, G.; Betsholtz, C. Pericytes: Developmental, physiological, and pathological perspectives, problems, and promises. Dev. Cell 2011, 21, 193–215. [Google Scholar] [CrossRef] [PubMed]
- Takahashi, T.; Shibuya, M. The 230 kDa mature form of KDR/Flk-1 (VEGF receptor-2) activates the PLC-γ pathway and partially induces mitotic signals in NIH3T3 fibroblasts. Oncogene 1997, 14, 2079–2089. [Google Scholar] [CrossRef] [PubMed]
- Berthaut, A.; Mirshahi, P.; Benabbou, N.; Azzazene, D.; Bordu, C.; Therwath, A.; Legeais, J.; Mirshahi, M. Vascular endothelial growth factor receptor-1 (VEGFR-1) expression in human corneal fibroblast decreased with age. Mol. Vis. 2009, 15, 1997–2007. [Google Scholar] [PubMed]
- Itoh, H.; Nasu, K.; Matsumoto, H.; Kawano, Y.; Yoshimatsu, J.; Narahara, H. Hypoxia regulates vascular endothelial growth factor and soluble fms-like tyrosine kinase-1 secretion by human oviductal epithelial cells and stromal fibroblasts. Fertil. Steril. 2006, 85, 1097–1102. [Google Scholar] [CrossRef] [PubMed]
- Shibuya, M.; Claesson-Welsh, L. Signal transduction by VEGF receptors in regulation of angiogenesis and lymphangiogenesis. Exp. Cell Res. 2006, 312, 549–560. [Google Scholar] [CrossRef]
- Siemerink, M.J.; Klaassen, I.; Van Noorden, C.J.F.; Schlingemann, R.O. Endothelial tip cells in ocular angiogenesis: Potential target for anti-angiogenesis therapy. J. Histochem. Cytochem. 2013, 61, 101–115. [Google Scholar] [CrossRef]
- Adams, R.H.; Alitalo, K. Molecular regulation of angiogenesis and lymphangiogenesis. Nat. Rev. Mol. Cell Biol. 2007, 8, 464–478. [Google Scholar] [CrossRef]
- Eklund, L.; Olsen, B.R. Tie receptors and their angiopoietin ligands are context-dependent regulators of vascular remodeling. Exp. Cell Res. 2006, 312, 630–641. [Google Scholar] [CrossRef]
- Saharinen, P.; Eklund, L.; Miettinen, J.; Wirkkala, R.; Anisimov, A.; Winderlich, M.; Nottebaum, A.; Vestweber, D.; Deutsch, U.; Koh, G.Y.; et al. Angiopoietins assemble distinct Tie2 signalling complexes in endothelial cell-cell and cell-matrix contacts. Nat. Cell Biol. 2008, 10, 527–537. [Google Scholar] [CrossRef] [PubMed]
- Goettsch, W.; Gryczka, C.; Korff, T.; Ernst, E.; Goettsch, C.; Seebach, J.; Schnittler, H.-J.; Augustin, H.G.; Morawietz, H. Flow-dependent regulation of angiopoietin-2. J. Cell. Physiol. 2008, 214, 491–503. [Google Scholar] [CrossRef] [PubMed]
- Obi, S.; Masuda, H.; Shizuno, T.; Sato, A.; Yamamoto, K.; Ando, J.; Abe, Y.; Asahara, T. Fluid shear stress induces differentiation of circulating phenotype endothelial progenitor cells. Am. J. Physiol. Physiol. 2012, 303, C595–C606. [Google Scholar] [CrossRef] [PubMed]
- Kelly-Goss, M.R.; Ning, B.; Bruce, A.C.; Tavakol, D.N.; Yi, D.; Hu, S.; Yates, P.A.; Peirce, S.M. Dynamic, heterogeneous endothelial Tie2 expression and capillary blood flow during microvascular remodeling. Sci. Rep. 2017, 7, 9049. [Google Scholar] [CrossRef] [PubMed]
- Biel, N.M.; Siemann, D.W. Targeting the Angiopoietin-2/Tie-2 axis in conjunction with VEGF signal interference. Cancer Lett. 2016, 380, 525–533. [Google Scholar] [CrossRef] [PubMed]
- Huang, H.; Bhat, A.; Woodnutt, G.; Lappe, R. Targeting the ANGPT–TIE2 pathway in malignancy. Nat. Rev. Cancer 2010, 10, 575–585. [Google Scholar] [CrossRef] [PubMed]
- Hirschi, K.K.; Rohovsky, S.A.; D’Amore, P.A. PDGF, TGF-beta, and Heterotypic Cell-Cell Interactions Mediate Endothelial Cell-induced Recruitment of 10T1/2 Cells and Their Differentiation to a Smooth Muscle Fate. J. Cell Biol. 1998, 141, 805–814. [Google Scholar] [CrossRef]
- Cobbs, C.; Khan, S.; Matlaf, L.; McAllister, S.; Zider, A.; Yount, G.; Rahlin, K.; Harkins, L.; Bezrookove, V.; Singer, E.; et al. HCMV glycoprotein B is expressed in primary glioblastomas and enhances growth and invasiveness via PDGFR-alpha activation. Oncotarget 2014, 5, 1091–1100. [Google Scholar] [CrossRef]
- Bhardwaj, B.; Klassen, J.; Cossette, N.; Sterns, E.; Tuck, A.; Deeley, R.; Sengupta, S.; Elliott, B. Localization of platelet-derived growth factor beta receptor expression in the periepithelial stroma of human breast carcinoma. Clin. Cancer Res. 1996, 2, 773–782. [Google Scholar]
- Krupinski, J.; Issa, R.; Bujny, T.; Slevin, M.; Kumar, P.; Kumar, S.; Kaluza, J. A Putative Role for Platelet-Derived Growth Factor in Angiogenesis and Neuroprotection After Ischemic Stroke in Humans. Stroke 1997, 28, 564–573. [Google Scholar] [CrossRef]
- Aird, W.C. Molecular heterogeneity of tumor endothelium. Cell Tissue Res. 2009, 335, 271–281. [Google Scholar] [CrossRef]
- Aird, W.C. Spatial and temporal dynamics of the endothelium. J. Thromb. Haemost. 2005, 3, 1392–1406. [Google Scholar] [CrossRef] [PubMed]
- Passarelli, M.K.; Ewing, A.G. Single-cell imaging mass spectrometry. Curr. Opin. Chem. Biol. 2013, 17, 854–859. [Google Scholar] [CrossRef] [PubMed] [Green Version]
- Islam, S.; Zeisel, A.; Joost, S.; La Manno, G.; Zajac, P.; Kasper, M.; Lönnerberg, P.; Linnarsson, S. Quantitative single-cell RNA-seq with unique molecular identifiers. Nat. Methods 2014, 11, 163–166. [Google Scholar] [CrossRef] [PubMed]
- Heath, J.R.; Ribas, A.; Mischel, P.S. Single-cell analysis tools for drug discovery and development. Nat. Rev. Drug Discov. 2016, 15, 204–216. [Google Scholar] [CrossRef]
- Shi, Q.; Qin, L.; Wei, W.; Geng, F.; Fan, R.; Shin, Y.S.; Guo, D.; Hood, L.; Mischel, P.S.; Heath, J.R. Single-cell proteomic chip for profiling intracellular signaling pathways in single tumor cells. Proc. Natl. Acad. Sci. USA 2012, 109, 419–424. [Google Scholar] [CrossRef]
- Staton, C.A.; Stribbling, S.M.; Tazzyman, S.; Hughes, R.; Brown, N.J.; Lewis, C.E. Current methods for assaying angiogenesis in vitro and in vivo. Int. J. Exp. Pathol. 2004, 85, 233–248. [Google Scholar] [CrossRef]
- Staton, C.A.; Reed, M.W.R.; Brown, N.J. A critical analysis of current in vitro and in vivo angiogenesis assays. Int. J. Exp. Pathol. 2009, 90, 195–221. [Google Scholar] [CrossRef]
- Styp-Rekowska, B.; Hlushchuk, R.; Pries, A.R.; Djonov, V. Intussusceptive angiogenesis: Pillars against the blood flow. Acta Physiol. 2011, 202, 213–223. [Google Scholar] [CrossRef]
- Dela Paz, N.G.; Walshe, T.E.; Leach, L.L.; Saint-Geniez, M.; D’Amore, P.A. Role of shear-stress-induced VEGF expression in endothelial cell survival. J. Cell Sci. 2012, 125, 831–843. [Google Scholar] [CrossRef] [Green Version]
- Moya, M.L.; Hsu, Y.-H.; Lee, A.P.; Hughes, C.C.W.; George, S.C. In Vitro Perfused Human Capillary Networks. Tissue Eng. Part C Methods 2013, 19, 730–737. [Google Scholar] [CrossRef] [PubMed]
- Grassot, J.; Gouy, M.; Perrière, G.; Mouchiroud, G. Origin and Molecular Evolution of Receptor Tyrosine Kinases with Immunoglobulin-Like Domains. Mol. Biol. Evol. 2006, 23, 1232–1241. [Google Scholar] [CrossRef] [PubMed] [Green Version]
- Sarabipour, S.; Hristova, K. Mechanism of FGF receptor dimerization and activation. Nat. Commun. 2016, 7, 10262. [Google Scholar] [CrossRef] [PubMed]
- Taeger, J.; Moser, C.; Hellerbrand, C.; Mycielska, M.E.; Glockzin, G.; Schlitt, H.J.; Geissler, E.K.; Stoeltzing, O.; Lang, S.A.; Jemal, A.; et al. Targeting FGFR/PDGFR/VEGFR impairs tumor growth, angiogenesis, and metastasis by effects on tumor cells, endothelial cells, and pericytes in pancreatic cancer. Mol. Cancer Ther. 2011, 10, 2157–2167. [Google Scholar] [CrossRef]
Figure 1.
Analysis of angiogenesis in human umbilical vein endothelial cells (HUVEC)-human dermal fibroblasts (HDF) cocultures of 6, 11, and 17 days after seeding. (A) Representative images of day-6 (top), day-11 (middle), and day-17 (bottom) cocultures (left panel; green: Fluorescein isothiocyanate (FITC)-conjugated CD31 antibody), processed images with cell clusters cleared out and their skeletonized images (middle panels), and a representative, enlarged part of the skeletonized images (right panel). The vessels outlines are represented in yellow, the skeleton in red, and the branching points in blue. Scale bar is 0.5 mm. (B) Graphical representations of the analysis with AngioTool performed on four biological replicates and two to three images per replicate. Statistical analysis was by ANOVA test (Tukey) *, p < 0.05; **, p < 0.01; ***, p < 0.001.
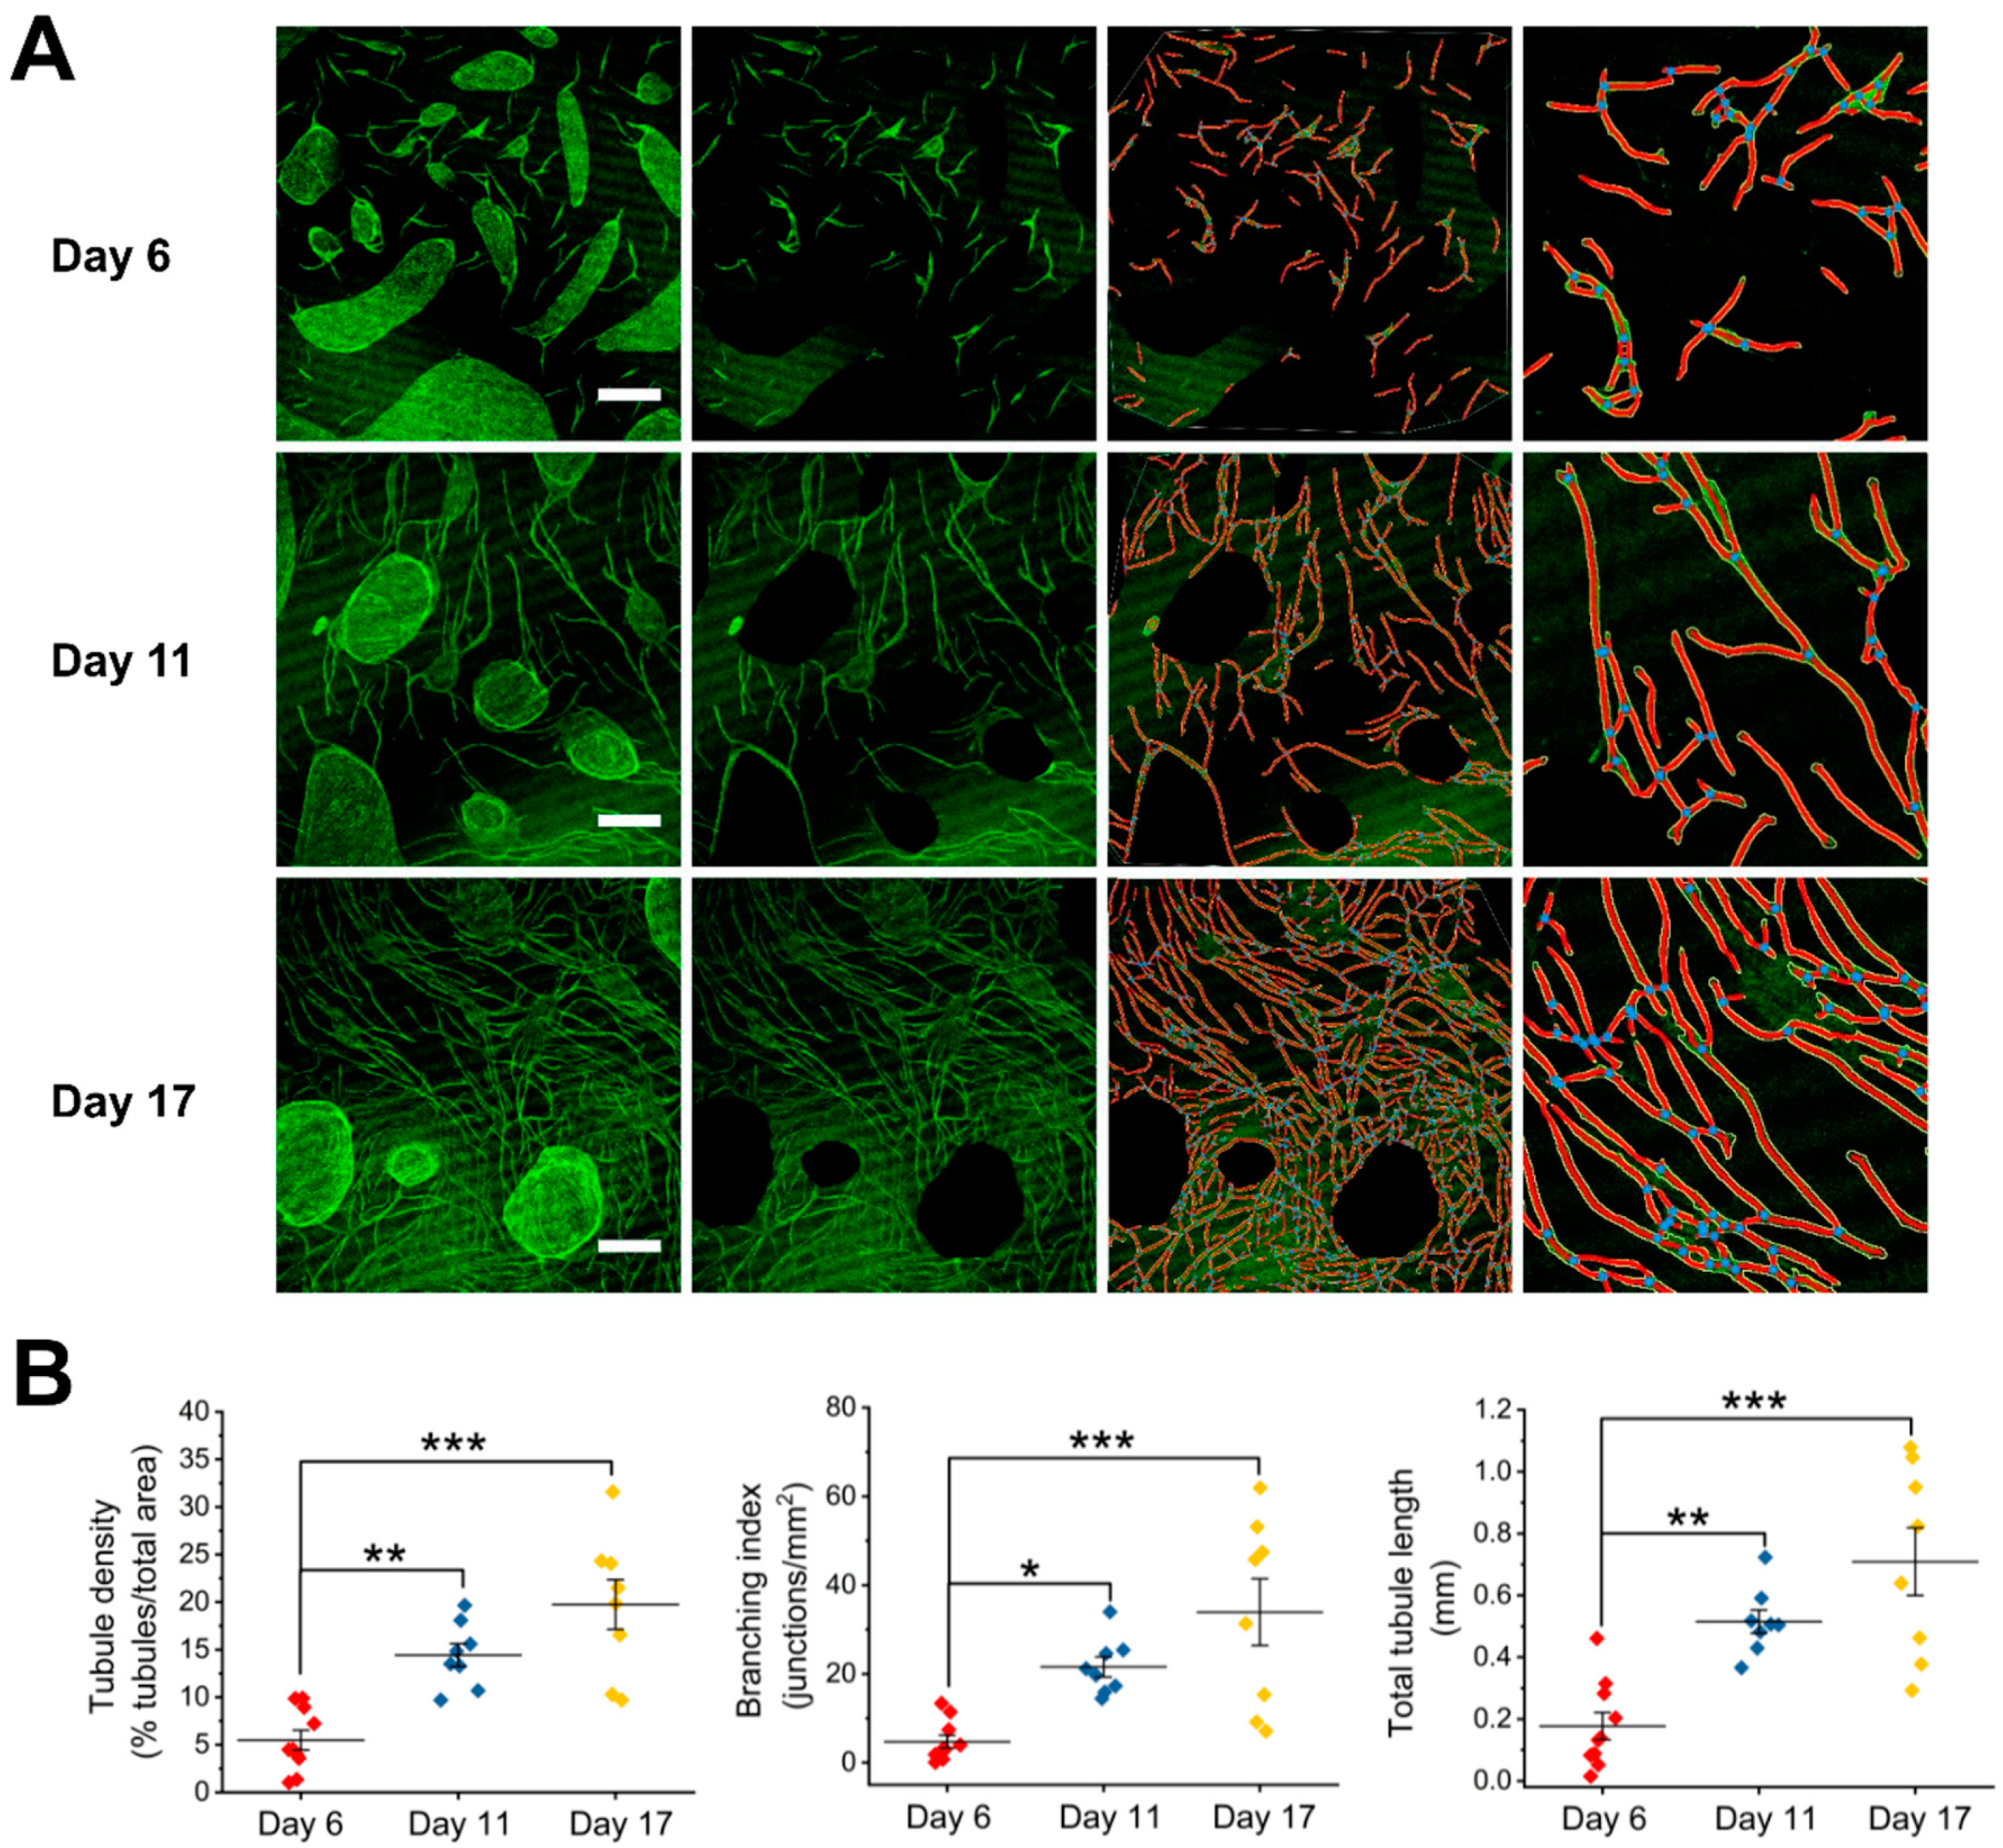
Figure 2.
Quantification of angiogenic receptor concentrations on HUVECs and HDFs following 24-h, 6-day, 11-day, and 17-day coculturing. Dashed lines represent receptor concentrations of collagenase-treated monocultures when they reach 80–90% confluency. Red: HUVECs; Blue: HDFs. Mean ± SEM of receptor concentrations in cocultures were compared to monocultures and ANOVA Tukey test was performed to determine the significant differences (* indicates p < 0.05, ** indicates p < 0.01, and *** indicates p < 0.001). VEGFR: Vascular endothelial growth factor receptor; PDGFR: Platelet-derived growth factor receptor; NRP: Neuropilin.

Figure 3.
Cell-by-cell analysis of HUVEC–HDF coculture up to 17 days. We showed receptor distributions of (A,D) VEGFR1, (B,E) VEGFR2, (C,F) Tie2, (G,J) NRP1, (H,K) PDGFRα, and (I,L) PDGFRβ on HUVECs and HDFs from co-cultures and collagenase-treated monocultures.
Figure 3.
Cell-by-cell analysis of HUVEC–HDF coculture up to 17 days. We showed receptor distributions of (A,D) VEGFR1, (B,E) VEGFR2, (C,F) Tie2, (G,J) NRP1, (H,K) PDGFRα, and (I,L) PDGFRβ on HUVECs and HDFs from co-cultures and collagenase-treated monocultures.

Figure 4.
Quadratic entropy (QE) of co-cultured HUVECs and HDFs up to 17 days. We showed QE of (A) VEGFR1, (B) VEGFR2, (C) Tie2, (D) NRP1, (E) PDGFRα, and (F) PDGFRβ on HUVECs and HDFs from 24-h, 6-day, 11-day, and 17-day co-cultures. Dashed lines represent receptor concentrations of collagenase-treated monocultures. Red: HUVECs; Blue: HDFs.

Figure 5.
Bayesian information criterion (BIC)-assisted Gaussian mixture modeling identifies subpopulations within mixtures. (A) The 24-h cocultured HUVECs have three subpopulations expressing 3100 VEGFR2 per cell, 8400 VEGFR2 per cell, and 17,000 VEGFR2 per cell on their plasma membranes. (B) Day-11 cocultured HUVECs have two subpopulations expressing 4700 plasma membrane VEGFR2 per cell and 7300 plasma membrane VEGFR2 per cell. (C) Day-17 cocultured HUVECs have two subpopulations expressing 9,000 plasma membrane NRP1 per cell and 49,300 plasma membrane NRP1 per cell. (D) Day-6 cocultured HDFs have two subpopulations expressing 5500 plasma membrane NRP1 per cell and 58,500 plasma membrane NRP1 per cell. (E) Day-17 cocultured HUVECs have two subpopulations expressing 700 and 8800 plasma membrane PDGFRβ per cell.

© 2019 by the authors. Licensee MDPI, Basel, Switzerland. This article is an open access article distributed under the terms and conditions of the Creative Commons Attribution (CC BY) license (http://creativecommons.org/licenses/by/4.0/).
Share and Cite
MDPI and ACS Style
Chen, S.; Imoukhuede, P.I. Single-Cell Receptor Quantification of an In Vitro Coculture Angiogenesis Model Reveals VEGFR, NRP1, Tie2, and PDGFR Regulation and Endothelial Heterogeneity. Processes 2019, 7, 356. https://doi.org/10.3390/pr7060356
AMA Style
Chen S, Imoukhuede PI. Single-Cell Receptor Quantification of an In Vitro Coculture Angiogenesis Model Reveals VEGFR, NRP1, Tie2, and PDGFR Regulation and Endothelial Heterogeneity. Processes. 2019; 7(6):356. https://doi.org/10.3390/pr7060356
Chicago/Turabian StyleChen, Si, and P. I. Imoukhuede. 2019. "Single-Cell Receptor Quantification of an In Vitro Coculture Angiogenesis Model Reveals VEGFR, NRP1, Tie2, and PDGFR Regulation and Endothelial Heterogeneity" Processes 7, no. 6: 356. https://doi.org/10.3390/pr7060356
Note that from the first issue of 2016, this journal uses article numbers instead of page numbers. See further details here.