Synthesis of Porous Fe/C Bio-Char Adsorbent for Rhodamine B from Waste Wood: Characterization, Kinetics and Thermodynamics

College of Materials Science and Engineering, Nanjing Forestry University, Nanjing 210039, China
*
Author to whom correspondence should be addressed.
Processes 2019, 7(3), 150; https://doi.org/10.3390/pr7030150
Submission received: 26 December 2018
/
Revised: 4 March 2019
/
Accepted: 5 March 2019
/
Published: 9 March 2019
(This article belongs to the Special Issue Wastewater Treatment Processes)
Abstract
:In the past decades, dyes waste waters produced from industries have become a major source of environmental pollution causing the destruction of aquatic communities in the ecosystem and greatly threatened human health. Herein, a novel magnetic adsorbent was synthesized by carbonizing iron (III) 2,4-pentanedionate (Fe(acac)3) pre-enriched forestry waste wood at a pyrolysis temperature of 1000 °C. The characterization of the adsorbent conducted via SEM, EDS, VSM, XRD, XPS, and FT-IR spectroscopy. The adsorption trend followed the pseudo-second order kinetics model. The corresponding adsorption performance was efficient with an equilibrium time of only 1 min. Affect factors on the adsorption performance, such as adsorbent dosage, contact time and temperature, were investigated. The magnetic bio-char showed a high adsorption capacity and an efficient adsorption toward RhB, implying great potential application in the treatment of colored wastewaters.
1. Introduction
In recent decades, people have gained economic benefits with the rapid development of industrial society, however our living environment has been seriously destroyed. Many environmental problems have been raised such as water pollution, visual pollution, the destruction of the ecosystem and so on. Among these environmental problems, water pollution seems to be the most acute problem. At present, more than 500 billion m3 of wastewater is discharged into the natural water source every year, which pollutes 5.5 trillion m3 of the natural water source, equivalent to nearly 14 percent of the total global runoff [1]. According to the United Nations, 1.1 billion people are short of safe drinking water and more than 5 million people die each year from water-related diseases. The pollution sources of water are mainly from industrial productions, such as printing and dyeing industries and especially from the textile industry. 3000 to 4000 tons of wastewater generated in textile dyeing are directly discharged into the natural water source every day and this data keeps increasing with the growth of the manufacturing economy. There are nearly 100,000 commercial dyes with an estimated over 70,000 tons production, among which 15% is lost during the dyeing processes [2]. In addition, dyes cannot be easily removed because of their complex structures, poor degradabilities and high solubilities. Being ingested by humans and animals, these dyes may cause canceration of organs, directly affecting human health and the ecological balance [3]. Therefore, effective wastewater treatments are in urgent need, and the corresponding research has drawn great interest.
For decades, scientists have proposed many ways to deal with dyeing wastewater, such as ozone oxidation [4], extraction [5], flocculation [6], filtration [7] and electrochemical methods [8], as well as fungal decolorization by microbial degradation [9]. The ozone oxidation and the electrochemical method can destroy the dye quickly and remove the macromolecular organic matter from the wastewater, to effectively remove the refractory organic matter in different wastewaters [10,11]. The anionic water-soluble reactive dyes in dyeing wastewater are removed and recovered by the extraction method using reverse micelles, and the recovered dyes have better dyeing properties for cotton fabrics [12]. Compared with other handling methods, flocculation is one of the most commonly used water treatment methods, removing colored wastewater at a lower cost. Flocculation can improve the oxidation efficiency of wastewater and promotes biological treatment [13]. Moreover, fungal decolorization by microbial degradation is a mature and common method to treat wastewater and water pollution for the reason that, unlike bacteria, fungus have a strong ability to degrade complex organic compounds [14].
However, these methods have disadvantages for their practical industrial applications. For example, the Ozone method and extraction method require a lot of oxidants or release a lot of organic sol in the purification processes, easily causing secondary pollution. The membrane used in the filtration processes normally require high-quality materials, which resist acid or alkali corrosion, and its physical flux of water treatment may decrease with time elapsing. Electrochemical treatments require high energy consumption and expensive equipment [15]. The removal efficiency of microorganisms is easily affected by the non-degradable heterocyclic aromatic hydrocarbons in dyes. Compared with these methods, adsorption technology is proven to be more effective in water reuse [16]. The adsorbent materials include carbon materials, diatomite, resin, etc. Among these adsorbent materials, magnetic porous carbon adsorbents have many advantages [17]. Magnetic carbon with the porous structure has a large specific surface area and strong adsorption capacity [18]. With the magnetic properties, the porous carbon can be applied to high velocity colored wastewater, and it is easy to separate from wastewater and recycled water. The magnetic porous carbon of biomass made from waste wood or other by-products has drawn great interest from scientists [19,20].
Herein, we synthesized a novel porous magnetic carbon with biomass waste wood as an effective adsorbent for Rhodamine B (RhB). The porous magnetic carbon made by pressure impregnating and pyrolysis, was characterized using SEM, EDS, XRD, XPS, VSM and FT-IR. The effects of adsorbent dosage, contact time, initial dye concentration and temperature on RhB adsorption by porous magnetic carbon were investigated.
2. Materials and Methods
2.1. Materials
Acetylpyruvate iron [Fe(acac)3], dimethylformamide (DMF) and RhB were of analytical grade and purchased from Aldrich (Darmstadt, Germany). The raw material of wood comes from discarded poplar wood and its by-products, which were obtained from JM Arts & Crafts Co., in Fuyang, Anhui, China. All aqueous solutions were prepared with deionized water, which was purified with the Milli-Q Plus water purification system. Unless otherwise specified, the experimental processes were performed in aqueous solution and room temperature without adjusting the pH value.
2.2. Synthesis of Adsorbent
The magnetic carbon was prepared via pressure impregnation of acetylacetone iron followed by pyrolysis. Firstly, the poplar waste wood, which was cut into 40 mm × 40 mm × 3 mm, were dried until the corresponding moisture content reached 10%. The dried chips were then extracted with a mixture of water and ethanol (Vwater:Vethanol = 1:2), in order to remove the free fatty acids in the logs and improve the patency rate of the conduit and the bordered hole in the wood. Then, the treated woods were dried to 10% moisture content again. Secondly, the pretreated wood was impregnated in the DMF solution of Fe(acac)3 with a concentration of 0.12 g/mL, under the pressure of 0.08 MPa for 2.5 h. Then, 0.8 MPa pressure was introduced for another 2.5 h. The impregnated wood was taken out and dried in a vacuum.
Finally, the dried wood was transferred to the tube furnace, and nitrogen was kept in the furnace for 30 min to ensure that the air was expelled. After this, the temperature was increased to 220 °C with a rate of 5 °C/min and then kept for 1 h. Then, the temperature was further increased to 320 °C with a rate of 5 °C/min and kept for another 1 h. The temperature of the system was further increased to 1000 °C with a rate of 5 °C/min and kept for 4 h. Then, the carbonized wood was taken out. After this, the magnetic carbon was prepared and ready for the adsorption investigation for RhB.
2.3. Adsorption Experiment
RhB stock solution was prepared by adding 5 g of RhB powder into 500 mL deionized water, under slight ultrasonic. Then, the obtained original concentration was 10 g/L. The RhB samples with different concentrations were prepared by diluting the stock solution with different ratios. The standard quantitation curve of RhB samples was determined by measuring the optical density (OD) of RhB aqueous solutions at 550 nm with concentrations ranging from 1 mg/L to 15 mg/L, which was used to calculate the concentration of each experiment.
2.3.1. The Adsorption Capacity q (mg/L) and Efficiency η (%) Values of the Magnetic Adsorbent
The q and η values were calculated using Equations (1) and (2).
where C0 is the initial RhB concentration and C1 is RhB concentration in the supernatant solution (mg/L). V0 and V1 are the volumes of the initial RhB solution and the supernatant solution (L). madsorbent is the mass of the adsorbent (g).
2.3.2. Effect of Adsorbent Dosage
Magnetic carbon adsorbents with different dosages from 12 mg to 42.8 mg were added into RhB solution (100 mg/L). The RhB solution with magnetic carbon adsorbent was incubated overnight in a thermostatic culture oscillator (temperature: 25 °C, rotation speed: 150 r/min). After the incubation and the followed magnetic separation processes in an external magnetic field, the balanced concentrations of RhB solution in supernatant solution were calculated out according to the standard curve, measured by a UV spectrophotometer.
2.3.3. Effect of Contact Time
30 mg magnetic carbon adsorbent was added into RhB solution (100 mg/L). The RhB solution with magnetic carbon adsorbent was incubated in a constant temperature culture oscillator (temperature: 25 °C, rotation speed: 150 r/min). The samples were taken at constant time intervals, and the aqueous phase was separated via magnetic decantation for 5 min. After magnetic separation, the residual concentrations of RhB solution in supernatant solution were calculated out according to the standard curve, measured by a UV spectrophotometer. These data were used to determine the effect of contact time on adsorption efficiency.
2.3.4. Effect of Temperature
24 mg magnetic carbon adsorbent was added into RhB solution (100 mg/L). RhB solution with magnetic carbon adsorbent was put into a thermostatic culture oscillator and vibrated overnight. The incubation temperature was respectively controlled at 288 K, 298 K, 308 K, 318 K and 328 K.
2.4. Characterization
UV–vis spectroscopy was carried out by a UV-3500 UV–Vis-NIR spectrophotometer produced by Shimadzu. Scanning electron microscopy (SEM) was used to analyze the carbon materials before and after carbonization. EDS mapping was used to analyze the composition and distribution of elements. XRD data were collected on an X-ray diffractometer employing Cu-Kα radiation at 40 kV and 40 mA with 200 mg of each sample. X-ray photoelectron spectroscopy (XPS) was used to determine the composition of elements in materials. Magnetic measurements were carried out using a Lake Shore 7407 VSM provided by East Changing Technologies, Inc. (Beijing, China). Each sample was dried in vacuum and weighed 80 mg. The IR spectra were recorded by a Fourier transform infrared spectrophotometer (FT-IR), and each sample together with KBr was pressed to form a tablet.
3. Results and Discussion
3.1. Characterization
The morphologies of the untreated wood and magnetic pyrolyzed wood were characterized by SEM, as shown in Figure 1. From Figure 1A, it can be seen that the untreated wood had many holes. However, the surface of the holes was rough with the phenomenon of being blocked and the holes as shown by blue arrows were relatively small and the hole walls were thicker. After the pyrolysis processes, the corresponding porous structure of the wood did not change, and the hole walls of pyrolysis wood became thinner, so that the hole diameters became larger with a larger specific surface area. The porous structure of the wood was preserved, and the observed large holes of the catheter and the dramatically increased surface areas were supposed to dramatically improve the adsorption capacity of magnetic porous carbon [21]. As shown in Figure 1D–G, the EDS mapping results provided the insights into the elemental distribution of C, O and Fe in the samples. It could be seen that, both C and O elements were equably distributed in natural wood before carbonization while the signal strength of O elements was obviously weakened after carbonization. It is worth noting that Fe elements were mainly distributed in the puffy layer that attached to the inner surface of the porous structures, and their localizations were observed to coincide with the clusters, implying that these clusters consisted of the element Fe. Additionally, from the EDS data, the composition of the Fe-biochar was 65.93% and 26.93% for C (wt %) and Fe (wt %) respectively.
The crystal structure and phase composition of magnetic porous carbon was studied by wide-angle XRD, as shown in Figure 2A. When the temperature reached 1000 °C, the formation of ferric carbides (Fe3C) was identified by the observed peaks at 2θ = 37.6°, 39.8°, 40.6°, 42.8°, 43.7°, 44.5°, 45.0°, 45.8°, 48.6°, 49.1° and 51.8°, corresponding respectively to the reflections of (210), (002), (201), (211), (102), (220), (031), (131), (221) and (122) [22]. A graphite-like phase resulting from wood carbonization could be proven by the peak at 26.1°, which is supposed to be attributed to the self-carbonization of waste wood at high temperatures and the catalysis of Fe-containing compound [23]. The chemical composition of magnetic carbon was further determined by the high-resolution XPS spectra of Fe 2P at Figure 2B. The spectra of Fe 2p with double satellite signals was resolved by deconvolution and Gaussian curve fitting. The binding energies at ∼708.0 and ∼722.0 eV were the characteristic doublet from Fe 2p3/2 and Fe 2p1/2 core-level electrons, indicating the formation of Fe3C in the samples [24]. This was in accordance with the results of XRD. According to the Scherrer equation with corresponding parameters from the most intense peak (031), the average size of single Fe3C particle was 15.8 nm. However, the observed size of the particles in SEM images in Figure 1D,E was 100–200 nm, indicating these particles were clusters consisting of nano-size Fe3C.
The magnetic properties of magnetic porous carbon were investigated by VSM. A typical hysteresis loop is shown in Figure 2C. The obtained saturation magnetizations values were 36.309 emu/g. This indicated that the adsorbent was magnetic and could respond very quickly to the external magnetic field. Therefore, the adsorbents were easy to separate and recovered in an external magnetic field.
Figure 2D shows the FT-IR spectra for magnetic porous carbon before (Figure 2D(a)) and after (Figure 2D(b)) the adsorption processes. In the spectrum of magnetic porous carbon before adsorption (a), the peak at 3440 cm−1 corresponded to the vibration of O-H in water molecules attached inside magnetic porous carbon, and the bands at 1630 and 1660 cm−1 represented the bending vibration of O-H in water molecules [25]. The peaks at 2950 and 2890 cm−1 stood out to the stretching vibration of C-H. Besides, the bands between 1380 and 1440 cm−1 showed the vibration of C=C. Moreover, the peak at 1260 cm−1 represented the skeletal vibration of C-C and the peak at 1160 cm−1 corresponded to the vibration of C-O [26]. The peak at 1030 cm−1 was attributed to the stretching vibration of C-O while the bands between 567 to 769 cm−1 represented respectively the flexural vibration and stretching vibration of Fe-C.
The FT-IR adsorption spectra of magnetic porous carbon/RhB after absorption (b), was compared with that of magnetic porous carbon before adsorption (a). The additional peak at around 1740 cm−1 corresponded to the vibration of C=O, and the additional peak at 1580 cm−1 represented the C=C skeletal vibration of the benzene ring in RhB according to the FT-IR spectrum of pure RhB in Figure 2E and the corresponding molecular formula in Figure 2F. Moreover, the peak at 1030 cm−1 became stronger, which was supposed to be due to the C-O symmetric stretching vibrations of O and the benzene ring in the RhB structure. FT-IR results showed that RhB could be adsorbed on magnetic porous carbon.
3.2. Adsorption Studies
3.2.1. Effect of Adsorbent Dosage
The effect of adsorbent dosage on the adsorption of RhB was investigated. It can be seen from Figure 3A that the absorption peak intensity at 550 nm decreased when the adsorption dose increased, and the peak disappeared almost completely after the treatment of magnetic carbon adsorbent with 34.8 mg, indicating the removal of RhB from the solution by the adsorption of the magnetic porous carbon as shown in Figure 2C. Figure 3B shows that the removal proportion of RhB increased with the increase in the dosage of adsorbent. This phenomenon was expected because RhB solution can obtain more interchangeable surface sites with the increase of adsorbent dosage [26]. However, the adsorption capacity of the adsorbent decreases gradually with the increase of adsorbent dosage. This is because the high solid content in one system will increase the probability of the collision among these adsorbent particles, resulting in their aggregations and decreasing the corresponding total surface area, thus being unfavorable for the adsorption behavior of magnetic carbon. The experimental results showed that the adsorption efficiency had a threshold. When the threshold value was reached, simply increasing the amount of magnetic porous carbon could no longer significantly improve the adsorption efficiency. For RhB, when the amount of adsorbent was between a and b, increasing the amount of adsorbent could effectively improve the adsorption efficiency. Therefore, the appropriate amount of porous carbon should be selected according to the initial concentration of RhB and the required absorption efficiency [27].
3.2.2. Effect of Contact Time and Adsorption Kinetics
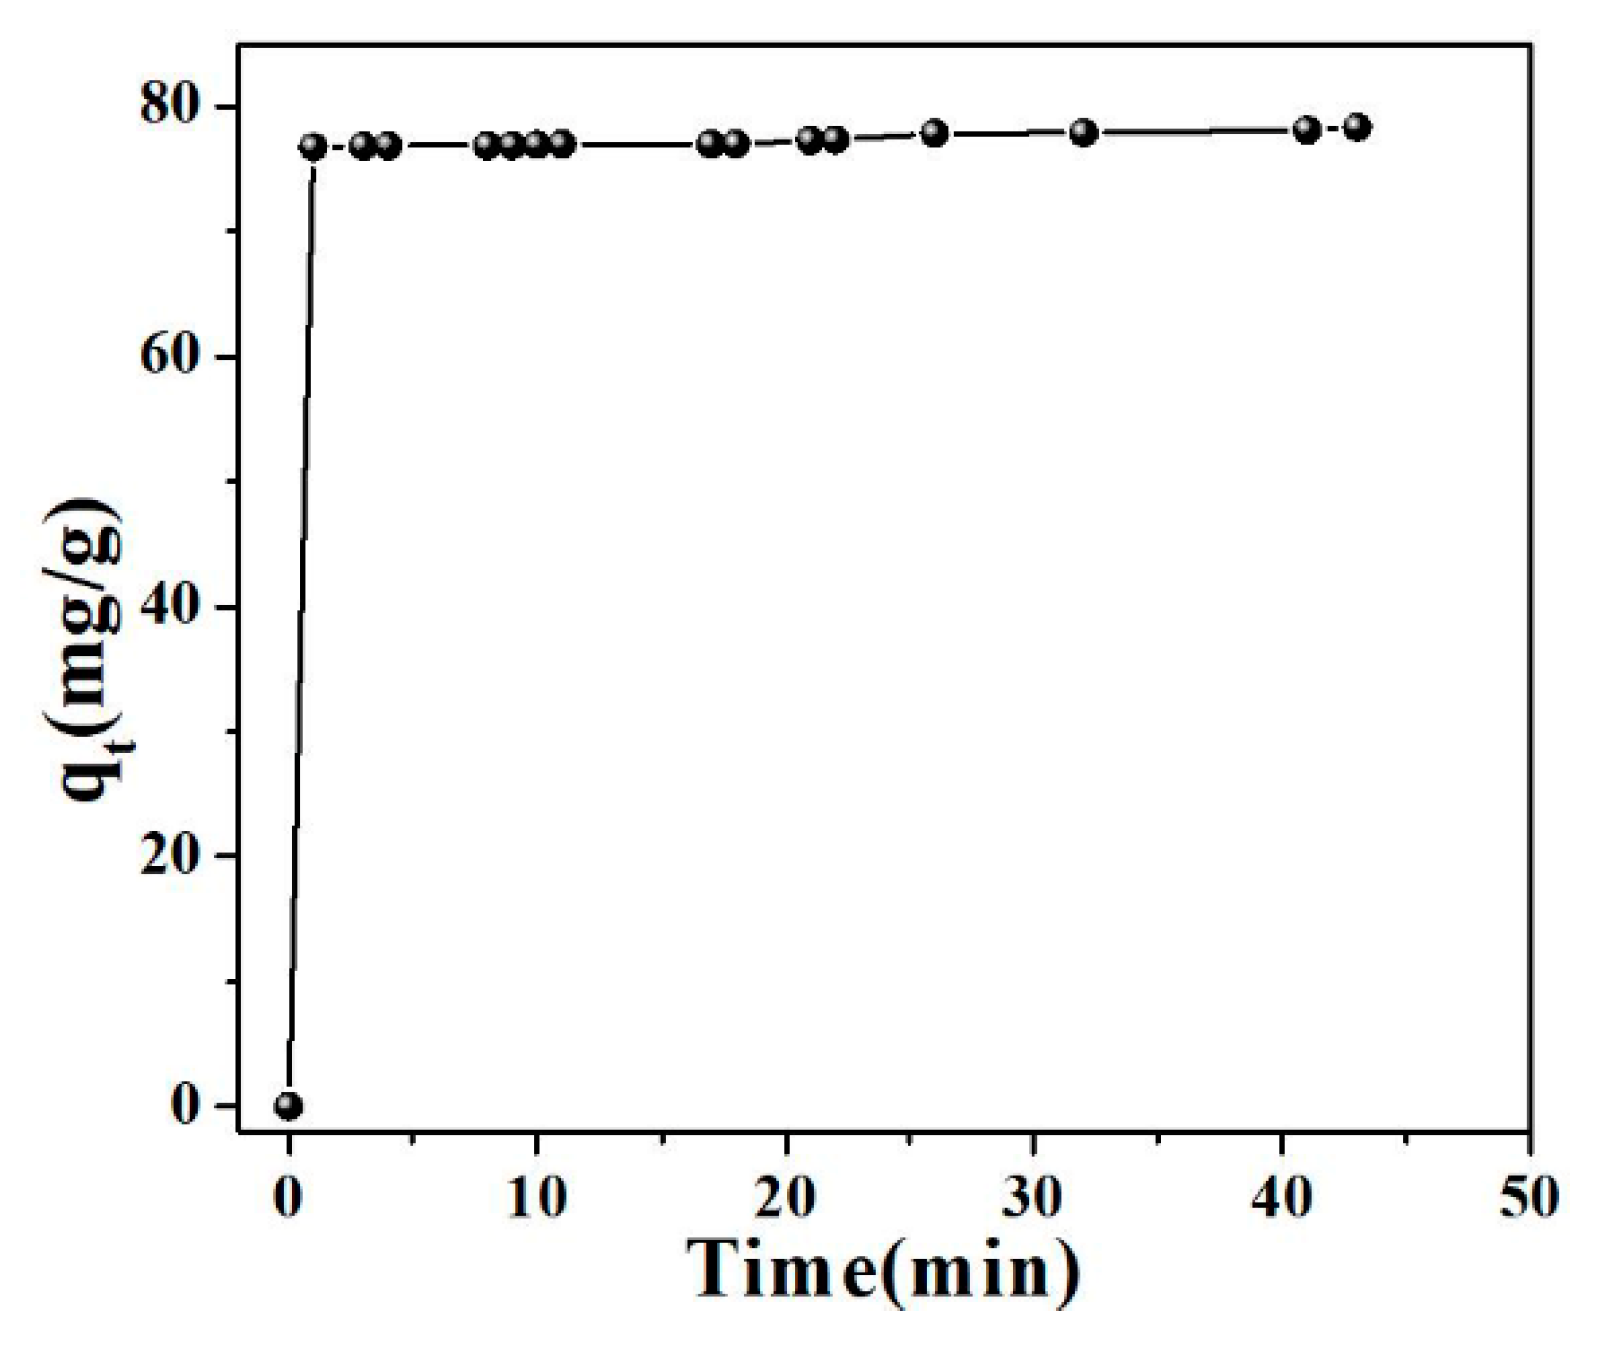
The effect of RhB solution on adsorption efficiency is shown in Figure 4. It can be seen from the result that the adsorption process was divided into two stages: Rapid removal rate and slow removal rate until the reaction was in equilibrium. The adsorption was basically balanced within 1 min, with nearly 76.8% removal efficiency of RhB, indicating that the adsorption process of RhB by magnetic adsorbent was extraordinarily quick and effective. This high efficiency was supposed to be mainly attributed to the resultant high specific surface area and the electrostatic interaction between the negatively charged surface of adsorbent and the positively charged RhB (as shown in Figure 2F).
In order to evaluate the adsorption kinetics of magnetic carbon adsorbent on RhB solution, four models were used to fit the experimental data, as shown in Table 1. Assuming pseudo-first order kinetics, the rate of adsorption interaction can be calculated by Equation (a) in Table 1, where qt and qe are the amounts of RhB per unit mass at any time t and at equilibrium, respectively [28]. The constant k1 is the rate constant of the pseudo-first order kinetics, which can be obtained according to the slope of the simulated linear line in Figure 5A. The detailed calculated parameters are listed in Table 1 and the linear regression is presented in Figure 5A. It can be seen from Figure 5A that the data had a bad linearity (the red line is the linear fitting, and the correlation coefficient (r2) was 0.4886, which was less than 0.99). Therefore, it can be concluded that the adsorption process of RhB on magnetic carbon materials does not follow pseudo-first-order kinetics.
Pseudo-second-order dynamic model was introduced to investigate the kinetics mechanism of the adsorption process following Equation (b) as shown in Table 1. The corresponding parameters are also listed in Table 1, the constant k2 is the rate constant of the pseudo-second-order kinetics which can be obtained according to the slope of the simulated linear line in Figure 5B and h is the initial sorption rate along with the correlation coefficient (r2) [29]. The linear regression is presented in Figure 5B. It can be seen that the data had good linearity, and the correlation coefficient (r2) was 0.9999, which was greater than 0.99, implying that the corresponding theoretical data was ideally consistent with the experimental value. These results suggest that the pseudo second order adsorption was the predominant mechanism and the overall rate constant was determined by the chemisorption process.
To explore whether the activation energy changed significantly during the reaction, the adsorption data could also be analyzed using the Elovich equation given by Equation (c) in Table 1, where α is the initial adsorption rate constant and β is the desorption constant, which could be obtained from the slope value and intercept value of the simulation result in Figure 5C, respectively [30]. As shown in Figure 5C, the red line was linear fitting, the slope had a good linear relationship, and the correlation coefficient (r2) was 0.6066, which was much less than 0.99, implying that there was a deviation between the experimental value and the corresponding theoretical data. The Elovich equation could not be used to explain the adsorption process of RhB on magnetic carbon materials.
The nature of the rate-limiting step in a batch system can also be assessed from the properties of the solute and adsorbent. If intra-particle diffusion is the rate-controlling factor, uptake of the adsorbate varies with the square root of time, explaining the intra-particle diffusion equation given by Equation (d) in Table 1, where k3 is the intra-particle diffusion rate constant and C is a constant, giving an idea about the thickness of the boundary layer [26]. The linear regression is presented in Figure 5D, where the red line is linear fitting, and the intercept of the fitting curve is the value of formula C. However, the formula itself did not provide a zero intercept, indicating that the adsorption process may have not been controlled by the diffusion in the particles.
3.2.3. Effect of Temperature and Adsorption Thermodynamics
The effect of temperature on adsorption efficiency is shown in Figure 6A. As can be seen, the higher the temperature was, the more conducive it was to adsorption, implying that adsorption was an endothermic reaction.
Two available isotherm models, Freundlich and Langmuir, were used to predict the absorptivity of RhB [31]. The linear forms of the two models are shown in Figure 6B,C, the detailed calculated isotherm parameters are shown in Table 2. As can be seen from the figure, the Freundlich curve showed that the straight line had a good linearity, the red curve was linear fitting, and the correlation coefficient (R2) was greater than 0.999, while the Langmuir curve had a poor fit. Therefore, the adsorption process of RhB on magnetic carbon material follows the Freundlich model, implying that the adsorption process is single-layer and heterogeneous for surface adsorption.
4. Conclusions
In this study, a novel porous magnetic carbon was synthesized from biomass waste wood as an effective adsorbent for RhB, through a facile method combining pressure impregnation and pyrolysis. The magnetic porous carbon adsorbent could respond quickly to the external magnetic field, being conducive to the separation of the adsorbent. The equilibrium was established within 1 min, indicating an excellent adsorption efficiency. The adsorption trend of the magnetic porous carbon followed the pseudo-second order kinetics model and Freundlich model, implying that the adsorption process is a chemical reaction, and the adsorption process is single-layer and heterogeneous surface adsorption. These experimental results indicate that the synthesized magnetic porous carbon has great prospects in wastewater treatment.
Author Contributions
Y.Z. and Z.L. conceived and designed the experiment, analyzed the results and wrote the manuscript. C.W. and W.W. did all the SPR experiments. J.C. supervised the project. All the authors contributed to the general discussion.
Funding
This research was funded by National Natural Science Foundation of China (No. 61601227), China Postdoctoral Science Foundation (2017M621598), Nature Science Foundation of Jiangsu Province (BK20160939), Natural Science Foundation of the Jiangsu Higher Education Institutions of China (16KJB180010), Research and Demonstration of Green Integrated Technology of Fast-growing poplar (1704a07020076), Student Practice Innovation and Training Program of Jiangsu Province (201710298017Z), and Student Practice Innovation and Training Program of Nanjing Forestry University (2017NFUSPITP105, 2017NFUSPITP092).
Acknowledgments
Financial support from the National Natural Science Foundation of China (No. 61601227), China Postdoctoral Science Foundation (2017M621598), Nature Science Foundation of Jiangsu Province (BK20160939), Natural Science Foundation of the Jiangsu Higher Education Institutions of China (16KJB180010), Research and Demonstration of Green Integrated Technology of Fast-growing poplar (1704a07020076), Student Practice Innovation and Training Program of Jiangsu Province (201710298017Z), and Student Practice Innovation and Training Program of Nanjing Forestry University (2017NFUSPITP105, 2017NFUSPITP092).
Conflicts of Interest
The authors declare no conflicts of interest.
References
- Griffith, D.R.; Barnes, R.T.; Raymond, P.A. Inputs of Fossil Carbon from Wastewater Treatment Plants to US Rivers and Oceans. Environ. Sci. Technol. 2009, 43, 5647–5651. [Google Scholar] [CrossRef]
- Khataee, A.R.; Kasiri, M.B. Photocatalytic degradation of organic dyes in the presence of nanostructured titanium dioxide: Influence of the chemical structure of dyes. J. Mol. Catal. A Chem. 2010, 328, 8–26. [Google Scholar] [CrossRef]
- Zhang, X.; Lin, Q.; Luo, S.; Ruan, K.; Peng, K. Preparation of novel oxidized mesoporous carbon with excellent adsorption performance for removal of malachite green and lead ion. Appl. Surf. Sci. 2018, 442, 322–331. [Google Scholar] [CrossRef]
- Baban, A.; Yediler, A.; Lienert, D.; Kemerdere, N.; Kettrup, A. Ozonation of high strength segregated effluents from a woollen textile dyeing and finishing plant. Dyes Pigments 2003, 58, 93–98. [Google Scholar] [CrossRef]
- Melo, R.P.F.; Barros Neto, E.L.; Moura, M.C.P.A.; Castro Dantas, T.N.; Dantas Neto, A.A.; Oliveira, H.N.M. Removal of Reactive Blue 19 using nonionic surfactant in cloud point extraction. Sep. Purif. Technol. 2014, 138, 71–76. [Google Scholar] [CrossRef]
- Wei, Y.; Ding, A.; Dong, L.; Tang, Y.; Yu, F.; Dong, X. Characterisation and coagulation performance of an inorganic coagulant-poly-magnesium-silicate-chloride in treatment of simulated dyeing wastewater. Colloid Surf. A Physicochem. Eng. Asp. 2015, 470, 137–141. [Google Scholar] [CrossRef]
- Liang, C.-Z.; Sun, S.-P.; Li, F.-Y.; Ong, Y.-K.; Chung, T.-S. Treatment of highly concentrated wastewater containing multiple synthetic dyes by a combined process of coagulation/flocculation and nanofiltration. J. Membr. Sci. 2014, 469, 306–315. [Google Scholar] [CrossRef]
- Mohan, N.; Balasubramanian, N.; Basha, C.A. Electrochemical oxidation of textile wastewater and its reuse. J. Hazard. Mater. 2007, 147, 644–651. [Google Scholar] [CrossRef]
- Yang, P.; Shi, W.; Wang, H.; Liu, H. Screening of freshwater fungi for decolorizing multiple synthetic dyes. Braz. J. Microbiol. 2016, 47, 828–834. [Google Scholar] [CrossRef] [Green Version]
- Wu, C.; Zhou, Y.; Sun, X.; Fu, L. The recent development of advanced wastewater treatment by ozone and biological aerated filter. Environ. Sci. Pollut. Res. 2018, 25, 8315–8329. [Google Scholar] [CrossRef]
- Martinez-Huitle, C.A.; Brillas, E. Decontamination of wastewaters containing synthetic organic dyes by electrochemical methods: A general review. Appl. Catal. B Environ. 2009, 87, 105–145. [Google Scholar] [CrossRef]
- Application of Reverse Micelles Solvent Extraction in Removal and Reuse of Soluble Reactive Dyes. J. Text. Res. 2016. Available online: http://www.en.cnki.com.cn/Article_en/CJFDTotal-FZXB201605017.htm (accessed on 26 December 2018).
- Mella, B.; de Carvalho Barcellos, B.S.; da Silva Costa, D.E.; Gutterres, M. Treatment of Leather Dyeing Wastewater with Associated Process of Coagulation-Flocculation/Adsorption/Ozonation. Ozone Sci. Eng. 2018, 40, 133–140. [Google Scholar] [CrossRef]
- Sen, S.K.; Raut, S.; Bandyopadhyay, P.; Raut, S. Fungal decolouration and degradation of azo dyes: A review. Fungal Biol. Rev. 2016, 30, 112–133. [Google Scholar] [CrossRef]
- Yao, Y.; Ren, B.; Yang, Y.; Huang, C.; Li, M. Preparation and electrochemical treatment application of Ce-PbO2/ZrO2 composite electrode in the degradation of acridine orange by electrochemical advanced oxidation process. J. Hazard. Mater. 2019, 361, 141–151. [Google Scholar] [CrossRef] [PubMed]
- Cifci, D.I.; Meric, S. Single and binary adsorption of iron and manganese in synthetic water using activated pumice composites: Effect of monovalent and divalent ions, desorption and reuse isotherms. Desalin. Water Treat. 2017, 71, 52–61. [Google Scholar] [CrossRef]
- Wang, G.; Chen, K.; Li, W.; Wan, D.; Hu, Q.; Lu, L. Synthesis of Magnetic Modified Organobentonite as Adsorbent for Degradation of Orange II. In Civil, Structural and Environmental Engineering, Pts 1-4; Zhang, X., Zhang, B., Jiang, L., Xie, M., Eds.; Trans Tech Publications Ltd.: Stafa-Zurich, Switzerland, 2014; Volume 838–841, pp. 2306–2309. ISBN 978-3-03785-926-1. [Google Scholar]
- Toor, M.; Jin, B. Adsorption characteristics, isotherm, kinetics, and diffusion of modified natural bentonite for removing diazo dye. Chem. Eng. J. 2012, 187, 79–88. [Google Scholar] [CrossRef]
- Yao, Y.; Lian, C.; Wu, G.; Hu, Y.; Wei, F.; Yu, M.; Wang, S. Synthesis of “sea urchin”-like carbon nanotubes/porous carbon superstructures derived from waste biomass for treatment of various contaminants. Appl. Catal. B Environ. 2017, 219, 563–571. [Google Scholar] [CrossRef]
- Lou, Z.; Zhang, W.; Hu, X.; Zhang, H. Synthesis of a novel functional group-bridged magnetized bentonite adsorbent: Characterization, kinetics, isotherm, thermodynamics and regeneration. Chin. J. Chem. Eng. 2017, 25, 587–594. [Google Scholar] [CrossRef]
- Wang, J.-R.; Wan, F.; Lu, Q.-F.; Chen, F.; Lin, Q. Self-nitrogen-doped porous biochar derived from kapok (Ceiba insignis) fibers: Effect of pyrolysis temperature and high electrochemical performance. J. Mater. Sci. Technol. 2018, 34, 1959–1968. [Google Scholar] [CrossRef]
- Boi, F.S.; Guo, J.; Xiang, G.; Lan, M.; Wang, S.; Wen, J.; Zhang, S.; He, Y. Cm-size free-standing self-organized buckypaper of bucky-onions filled with ferromagnetic Fe3C. RSC Adv. 2017, 7, 845–850. [Google Scholar] [CrossRef]
- Fan, Z.-J.; Kai, W.; Yan, J.; Wei, T.; Zhi, L.-J.; Feng, J.; Ren, Y.; Song, L.-P.; Wei, F. Facile Synthesis of Graphene Nanosheets via Fe Reduction of Exfoliated Graphite Oxide. ACS Nano 2011, 5, 191–198. [Google Scholar] [CrossRef] [PubMed]
- Lou, Z.; Yuan, C.; Zhang, Y.; Li, Y.; Cai, J.; Yang, L.; Wang, W.; Han, H.; Zou, J. Synthesis of porous carbon matrix with inlaid Fe3C/Fe3O4 micro-particles as an effective electromagnetic wave absorber from natural wood shavings. J. Alloys Compd. 2019, 775, 800–809. [Google Scholar] [CrossRef]
- Soleimani, M.; Siahpoosh, Z.H. Ghezeljeh nanoclay as a new natural adsorbent for the removal of copper and mercury ions: Equilibrium, kinetics and thermodynamics studies. Chin. J. Chem. Eng. 2015, 23, 1819–1833. [Google Scholar] [CrossRef]
- Han, J.; Lu, K.; Yue, Y.; Mei, C.; Huang, C.; Wu, Q.; Xu, X. Nanocellulose-templated assembly of polyaniline in natural rubber-based hybrid elastomers toward flexible electronic conductors. Ind. Crops Prod. 2019, 128, 94–107. [Google Scholar] [CrossRef]
- Qiu, Y.; Yu, S.; Song, Y.; Wang, Q.; Zhong, S.; Tian, W. Investigation of solution chemistry effects on sorption behavior of Sr(II) on sepiolite fibers. J. Mol. Liq. 2013, 180, 244–251. [Google Scholar] [CrossRef]
- Hou, X.; Feng, J.; Liv, X.; Ren, Y.; Fan, Z.; Wei, T.; Meng, J.; Zhang, M. Synthesis of 3D porous ferromagnetic NiFe2O4 and using as novel adsorbent to treat wastewater. J. Colloid Interface Sci. 2011, 362, 477–485. [Google Scholar] [CrossRef] [PubMed]
- Yildiz, B.; Erten, H.N.; Kis, M. The sorption behavior of Cs (+) ion on clay minerals and zeolite in radioactive waste management: Sorption kinetics and thermodynamics. J. Radioanal. Nucl. Chem. 2011, 288, 475–483. [Google Scholar] [CrossRef]
- Yoon, S.; Moon, J.; Bae, S.; Duan, X.; Giannelis, E.P.; Monteiro, P.M. Chloride adsorption by calcined layered double hydroxides in hardened Portland cement paste. Mater. Chem. Phys. 2014, 145, 376–386. [Google Scholar] [CrossRef] [Green Version]
- Putro, J.N.; Santoso, S.P.; Ismadji, S.; Ju, Y.-H. Investigation of heavy metal adsorption in binary system by nanocrystalline cellulose—Bentonite nanocomposite: Improvement on extended Langmuir isotherm model. Microporous Mesoporous Mater. 2017, 246, 166–177. [Google Scholar] [CrossRef]
Figure 1.
SEM images of the longitudinal sections of untreated wood (A) and pyrolysized wood (magnetic biochar) in different magnifications (B,C). (D–G) The SEM images of pyrolytic wood with the radial sections, cross sections and the corresponding EDS mapping results of C, O, Fe.
Figure 1.
SEM images of the longitudinal sections of untreated wood (A) and pyrolysized wood (magnetic biochar) in different magnifications (B,C). (D–G) The SEM images of pyrolytic wood with the radial sections, cross sections and the corresponding EDS mapping results of C, O, Fe.

Figure 2.
XRD (A), XPS (B) and VSM (C) images of magnetic porous carbon. (D) FT-IR spectra for magnetic porous carbon before (a) and after (b) adsorption. (E) FT-IR spectra for Rhodamine B. (F) The structure of Rhodamine B. Insert: Photos of (1) RhB solution, (2) RhB/magnetic bio-char mixture, and (3) resolution after magnetic separation.

Figure 3.
(A) Successive UV–vis spectra of the remaining Rhodamine B in the solution after magnetic separation of each composite dose treatment. (B) The removal proportion (%) of Rhodamine B and the adsorption capacity of magnetic porous carbon of each adsorbent dosage.
Figure 3.
(A) Successive UV–vis spectra of the remaining Rhodamine B in the solution after magnetic separation of each composite dose treatment. (B) The removal proportion (%) of Rhodamine B and the adsorption capacity of magnetic porous carbon of each adsorbent dosage.

Figure 4.
The kinetic data for Rhodamine B by magnetic porous carbon.

Figure 5.
Fitting of Lagergren pseudo-first order-equation (A), Pseudo-second-order (B), Elovich (C) and intra-particle diffusion equation (D), respectively.
Figure 5.
Fitting of Lagergren pseudo-first order-equation (A), Pseudo-second-order (B), Elovich (C) and intra-particle diffusion equation (D), respectively.

Figure 6.
(A) Effect of temperature on the adsorption of RhB at different initial concentrations. (B) Freundlich and Langmuir isotherm plots of the adsorption.
Figure 6.
(A) Effect of temperature on the adsorption of RhB at different initial concentrations. (B) Freundlich and Langmuir isotherm plots of the adsorption.


Table 1.
Mathematical equations in Rhodamine B adsorption kinetics and kinetic parameters of various models fitted to experimental data.
Table 1.
Mathematical equations in Rhodamine B adsorption kinetics and kinetic parameters of various models fitted to experimental data.
| Rhodamine B C0 (mg/L): 100, qe(exp.) (mg/L): 78.35108 | |||
|---|---|---|---|
| Kinetic models and parameters | Lagergren pseudo-first order equation: ln(qe − qt) = lnqe − k1t (a) | ||
| k1 (min−1): 0.07373 | r2: 0.4886 | ||
| Pseudo-second-order: t/qt = 1/k2qe2 + t/qe, h = k2qe2 (b) | |||
| k2 (g·mg−1·min−1): 0.07916 | h (mg·g−1·min−1): 485.4369 | r2: 0.9999 | |
| Elovich: qt = 1/β·ln(αβ) + 1/β ln(t) (c) | |||
| α (mg·g−1·min−2): 2.71828 | β (g·mg−1·min−1): 2.54500 | r2: 0.6066 | |
| Intra-particle diffusion equation: qt = k3·t1/2 + C (d) | |||
| k3 (mg·g−1·min−1/2): 5.54231 | C: 52.21713 | r2: 0.2899 | |
Table 2.
Freundlich and Langmuir isotherm parameters for adsorption of RhB.
| Isotherm | Equation | Parameters | Values | ||||
|---|---|---|---|---|---|---|---|
| 288 K | 298 K | 308 K | 318 K | 328 K | |||
| Freundlich | lnqe = lnKF + 1/nlnCe (e) | KF (m·g−1·mg−1/n) | 0.15793 | 0.16315 | 0.15642 | 0.15308 | 0.14898 |
| 1/n | 4.21661 | 4.19489 | 4.22529 | 4.24069 | 4.25987 | ||
| R2 | 0.99921 | 0.99941 | 0.99955 | 0.99948 | 0.99937 | ||
| Langmuir | Ce/qe = 1/qmaxCe + 1/(KLqmax) (f) | Qmax (mg·g−1) | 91.74312 | 97.27626 | 99.50249 | 102.77492 | 107.29614 |
| KL (L·mg−1) | 0.45436 | 0.70994 | 3.13084 | 4.81683 | 5.61446 | ||
| R2 | 0.93464 | 0.98909 | 0.99938 | 0.99923 | 0.99961 | ||
© 2019 by the authors. Licensee MDPI, Basel, Switzerland. This article is an open access article distributed under the terms and conditions of the Creative Commons Attribution (CC BY) license (http://creativecommons.org/licenses/by/4.0/).
Share and Cite
MDPI and ACS Style
Zhang, Y.; Lou, Z.; Wang, C.; Wang, W.; Cai, J. Synthesis of Porous Fe/C Bio-Char Adsorbent for Rhodamine B from Waste Wood: Characterization, Kinetics and Thermodynamics. Processes 2019, 7, 150. https://doi.org/10.3390/pr7030150
AMA Style
Zhang Y, Lou Z, Wang C, Wang W, Cai J. Synthesis of Porous Fe/C Bio-Char Adsorbent for Rhodamine B from Waste Wood: Characterization, Kinetics and Thermodynamics. Processes. 2019; 7(3):150. https://doi.org/10.3390/pr7030150
Chicago/Turabian StyleZhang, Yao, Zhichao Lou, Chaochao Wang, Weikai Wang, and Jiabin Cai. 2019. "Synthesis of Porous Fe/C Bio-Char Adsorbent for Rhodamine B from Waste Wood: Characterization, Kinetics and Thermodynamics" Processes 7, no. 3: 150. https://doi.org/10.3390/pr7030150
Note that from the first issue of 2016, this journal uses article numbers instead of page numbers. See further details here.