Experimental Investigation of Pore Structure and Movable Fluid Traits in Tight Sandstone


1
Department of Geology, State Key Laboratory of Continental Dynamics, Northwest University, Xi’an 710069, China
2
College of Petroleum Engineering, Xi’an Shiyou University, Xi’an 710065, China
*
Author to whom correspondence should be addressed.
Processes 2019, 7(3), 149; https://doi.org/10.3390/pr7030149
Submission received: 6 February 2019
/
Revised: 2 March 2019
/
Accepted: 2 March 2019
/
Published: 8 March 2019
(This article belongs to the Special Issue Fluid Flow in Fractured Porous Media)
Abstract
:Whether the variation of pore structures and movable fluid characteristics enhance, deteriorate, or have no influence on reservoir quality has long been disputed, despite their considerable implications for hydrocarbon development in tight sandstone reservoirs. To elucidate these relationships, this study systematically analyzes pore structures qualitatively and quantitatively by various kinds of direct observations, indirect methods, and imaging simulations. We found that the uncertainty of porosity measurements, caused by the complex pore-throat structure, needs to be eliminated to accurately characterize reservoir quality. Bulk water was more easily removed, while surface water tended to be retained in the pores, and the heterogeneity of pore structures was caused by the abundance of tiny pores. The rates of water saturation reduction in macropores are faster than those for tiny pores, and sandstones with poor reservoir quality show no marked descending of lower limits of movable pore radius, indicating that the movable fluid would advance exempted from the larger pores. This study suggests that the deterioration of reservoir quality is strongly affected by the reduction of larger pores and the aqueous phases tended to remain in the tiny pores in the forms of surface water.
1. Introduction
With depletion of conventional hydrocarbon production and increasing demand for energy, unconventional reservoirs are expected to be a vital and realistic inventory in future energy supply [1,2]. As one of the major unconventional resources, tight sandstones reservoirs, to which many scholars have drawn attention, have been developed successfully in China [3,4,5,6]. The definition of tight sandstone in petroliferous basins is that its porosity is no more than 10% and in suit permeability generally less than 1 mD or air permeability less than 0.1 mD, whereupon it needs specific treatments (horizontal well fracturing, correct way of completion, advanced simulation jobs, etc.) to produce commercial hydrocarbon flow [7,8]. The complexity and irregularity of the pore structure are crucial microscopic factors for the deteriorated physical properties, poor reservoir quality, and complicated oil emplacement; therefore, comprehensive and accurate pore geometry evaluation has become a momentous issue in tight sandstones [9,10]. Meanwhile, due to the heterogeneity of pore structure in tight sandstones, the fluid that flows in the porous media is more complex than that of conventional reservoirs because of the intricate flow path [11]. Movable fluid parameters are significant in that they can provide a reliable evaluation of the characteristics of the fluid, and accurate movable fluid parameter estimation has been a point of interest because movable fluid parameters are valuable when considering the water retention and residual oil accumulation and development [12]. Therefore, the assessment of pore structure (porosity, pore size distribution (PSD), connectivity, tortuosity, heterogeneity, pore shape, etc.) and movable fluid features (movable fluid percentage, movable fluid porosity, etc.) are of paramount importance in evaluating the microscopic characterization of tight sandstones [13,14]. Accurate prediction of pore structure and movable fluid traits helps to assess storage capacity and evaluate percolation capacity and can provide insights into planning field exploration and development [15].
Currently, a series of optical techniques and experiments are being conducted to investigate the pore structure of tight sandstones, including radiation methods (e.g., thin section (TS), scanning electron microscope (SEM), small angle neutron scattering (SANS), computed tomography (CT), etc.), intrusive techniques (e.g., pressure-controlled mercury intrusion (PCMI), rate-controlled mercury intrusion (RCMI), etc.) and non-intrusive techniques (e.g., nuclear magnetism resonance (NMR), low-temperature N2 adsorption (LTNA), etc.) [2,8,10,11,12,13,15,16,17]. With continuous increase in the resolution of optical microscopy and radiation methods, the field of views could be small and the costs could rise. Due to this trade-off between resolution and viewshed information, indirect techniques have been supplemented, which systematically compensate the limits of direct techniques in characterizing pore structure in tight sandstones [8,14]. Although many methods can be used to characterize pore structures, no sole direct and indirect experiment can be used to determine pore structures traits due to its own limitations and strengths [18]: TS and SEM can reveal pore morphology and occurrence qualitatively, but these techniques were unable to obtain quantitative pore structure-related data [19,20]. CT is an effective technique to quantitatively characterize the three-dimensional images of pore networks, but it has drawbacks in the calculation of pores larger than 3 μm and is often restricted by expense [2,21,22]. PCMI is understood to be a widely-used method of estimation of pore structures because it can detect a broad spectrum of PSD on account of relatively high injection pressure according to the Washburn equation [23]; however, this technique fails to acquire an exact count of large pores because of the shielding effect of small pores [24]. Unlike PCMI, RCMI injects mercury into pores at very low speed that keeps the interfacial tension and contact angle changeless and can partition the PSD into areas of pores and throats based on the periodic rising and falling of pressures, overcoming the pitfall in PCMI [2,15,25,26,27]. While it is impossible to detect pores with radius less than 0.12 μm due to the maximum injection pressure limitation (~900 psi/6.2 MPa), as a result, RCMI can be envisaged as a limited technique that exaggerates the proportion of large pores [10,28]. NMR has been established as an effective method to determine pore structure characterization [29,30], nevertheless, the calculation of pore radius requires calibration with other techniques (e.g., RCMI) to confirm surface relaxivity, namely, it would cause discrepancy between NMR-derived PSD and other independent pore size measurement if the process of surface relaxivity calibration is skipped and referred to an arbitrary pore size classification that is derived from other research areas [15,31,32]. Therefore, in order to better evaluate pore structure characterization, a combination of each technique is necessary [33,34].
Recently, many studies have documented that NMR is a fast and nondestructive method to determine flow characteristic in tight sandstones [11,12,13,35,36,37]. As for the characteristic parameters of fluid in tight sandstones, movable fluid saturation is commonly used NMR-derived parameters, which is related to the pore structures and can be regulated by T2 cutoff values [12]. T2 cutoff values, defined here as the decay time after the external magnetic simulation disappeared, correspond to threshold partitioning of the T2 spectrum into two subcurves, namely, the free fluid areas (corresponding to T2 higher than the threshold) and bound fluid areas (corresponding to T2 lower than the threshold); hence, rigorous calculation of T2 cutoff values is vital to exactly determine the percentage of free water [12]. The determination of T2 cutoff values needs to compare the T2 spectrum before and after centrifuging in a certain rotation speed because it can dramatically change among different specimens, even in the same research area; rather, empirically determined T2 cutoff values ascertaining the proportion of movable fluid on the basis of predecessors is too arbitrary, and accurate determination of optimum centrifugal forces to obtain T2 cutoff values requires an understanding of the calibration model [12,13,36,38,39]. Movable fluid percentage is a significant property used to predict estimated ultimate recovery (EUR), because the irreducible fluids were not productive at all [11]; thus, it is of great importance to quantitatively determine the movable fluid parameters, in order to provide insight into evaluating the fluid storage and percolation traits and help develop proper hydrocarbon exploitation strategies.
Considering the significance of pore structure and movable fluid for hydrocarbon development in tight sandstones, a comprehensive analysis of pore structures and evaluation of movable fluid are necessary to evaluate the mechanism of hydrocarbon storage and percolation in the investigated basin [40,41]. In our study, a suit of tight sandstone samples from the Upper Triassic in the Ordos basin was investigated by TS, SEM, PCMI, RCMI, NMR, and CT in order to reveal the characteristics of pore structure and movable fluid traits. We first lay out the spatial features of the pores needed for the qualitative evaluation of our work by TS and SEM. Then we propose an integrated method by a combination of PCMI, RCMI, and CT to describe PSD, and an improved PSD is elucidated. Further, we determine the optimum rotation speed and movable fluid traits and explain how pore structure and rock physical properties influence the movable fluid parameters by NMR-derived T2 spectrum analysis before and after centrifuging at different centrifugal force, T1-T2 correlation spectra and magnetic resonance imaging (MRI). Finally, we investigate the effect of pore radius lower limits on reservoir quality. This multidisciplinary research unravels the impact of pore structure and movable fluid features on reservoir quality of tight sandstones, which is critical for the future production of the Upper Triassic tight sandstone reservoirs in Ordos Basin, China and offer technological merits in similar reservoirs elsewhere.
2. Materials and Methods
2.1. Tight Sandstones Specimens
All specimens were taken from the Upper Triassic Yanchang tight sandstones in the Yishan slope of the Ordos Basin in NW China (Figure 1a). It is a cratonic basin with an area of around 2.5 × 10⁵ km2, and Yishan slope is a hydrocarbon enrichment area, where dips at no more than 1° toward the west and internal faults are rarely seen [42,43]. The Yanchang formation, which is divided into ten members (Figure 1b), consists of sandstones intercalated with mudstones and shales, and Chang 2, Chang 4 + 5, Chang 6 and Chang 8 members are composed predominantly of sandstones [44,45]. The Yanchang formation is dominated by fine-to moderate-grained sands deposited in a fluvial, delta and lacustrine environment; compaction, cementation, and dissolution represent the most significant diagenetic process influencing pore structure and movable fluid traits [46,47]. In the present study, sandstones specimens from the Yanchang formation were collected from 14 wells, and the porosities of all specimens range from 5.53% to 14.24% with an average of 9.33%, while permeabilities vary from 0.02 mD to 2.70 mD with a mean value of 0.68 mD (Table 1), which indicates that the sandstones are typical tight sandstones [7]. The tight sandstones specimens of Yanchang formation were mainly arkose according to Folk’s (1980) classification [47], and quartz is predominant in specimens (av. 37.38%) with a subdominant component of feldspar (av. 31.86%) and low rock fragments (average contents of metamorphic, volcanic and sedimentary rock fragments equal to 7.84%, 3.82%, and 4.56%, respectively) (Table 1). The clay minerals are dominated by chlorite (av. 4.81%) and illite (av. 4.72%), whereas kaolinite is less dominant (av. 1.50%) (Table 1). The mica and quartz overgrowth contents vary from 1.00% to 11.50% (av. 4.32%) and 1.00% to 4.00% (1.90%), respectively (Table 1).
2.2. Experimental Methods
First, the rock cores selected from wells were drilled parallel to the bedding plane and cylindrical core plugs with approximately 5 cm long and 2.54 cm in diameter were obtained. The specimens were polished and cleaned with solutions of alcohol and trichloromethane before the experiments in order to remove the bitumen or drilling mud that remained in pores from the specimens, and then each specimen was put into the vacuum systems and dried at 120 °C for 24 h. Subsequently, the specimens were put in the core holder of the FYK-I testing apparatus, then the helium-based porosity was repeatedly tested five times and averaged. After the porosity tests, the pressure-transient nitrogen pulse decay permeability test was carried out using the FYK-I instrument and the specimen was tautologically measured five times for an average.
After the physical property measurement, the specimen plugs were split into several chips and plugs for direct observations and indirect tests. The TS analyses were conducted on rock slices that were impregnated by red or blue epoxy resin, using ZEISS polarized light petrographic microscope to detect the pore geometry. SEM, which was used to observe the microscopic features of the tight sandstones, was conducted by a FEI Quanta 400 FEG scanning electron microscope with working accelerating voltage set at 20 kV and the samples were covered with 10 nm thick carbon films. An OXFORD IE 350 energy dispersive spectrometer was used to collect XRD data, and each specimen was crushed and ground into powder with a grain size of 300 mesh, then dried and mixed with ethylene glycol and heated to 550 °C for 3 h before the tests.
The PCMI test was conducted using a Micromeritic Autopore IV 9420 Instrument. Injection pressure was reached at 200 MPa, which corresponded to 3.6 nm based on the Washburn equation [23], then the pressure progressively decreased to zero and the intrusion and extrusion capillary pressure curves were acquired. The ASPE 730 mercury porosimeter was adopted for the purpose of RCMI measurements. Unlike the PCMI experiment, during the injection process in RCMI, mercury was injected into the specimen at a speed of 5 × 10⁻⁵ mL·min−1 in order to stabilize the interfacial tension and contact angle. The pressure increased as the mercury was injected into the throat, then an instantaneous drawdown was seen when the mercury entered the pores. The periodic rising and falling pressure was recorded by the software and real-time data were acquired to partition the void spaces into distributions of pores and throats [26,38]. Both mercury intrusion experiments followed the SY/T 5346-2005 Chinese Oil and Gas Industry Standard, and the contact angle and interfacial tension was 140° and 480 mN·m−1, respectively.
Micro-CT scanning can provide a relatively high-resolution 3D reconstruction of the features of the pore network, when compared to other methods [2,50,51,52]. The 3D images of the pore characterization of tight sandstone were measured by a Phoenix Nanotom M scanner with a working voltage of 90 kV, and tomogram image spatial resolution of around 3 μm. In this method, an X-ray with conical beam penetrates the specimen and then attenuates depending on the sample density, mineral compositions and contents, and the thickness along the beam direction, and this attenuation is mainly associated with the decreasing sample density [22,53]. Finally, based on the threshold value segmentation method, rock matrix with high density and void space with low density can be determined [22].
The NMR is a nondestructive technique that provides information of pore features, and insights into the fluid and porous media can be acquired by this test [11,54]. The process that helped the magnetization vector recover from a non-equilibrium to equilibrium state is called relaxation, and the recovery time is called relaxation time [11]. The T1 and T2 relaxation time, which correspond to the time that the magnetization vector is parallel to and perpendicular to the external magnetic field returned to the equilibrium state, is referred to as longitudinal and transverse relaxation time, respectively [55]. This technique was performed in Niumag NMR spectrometer at a proton resonance frequency of 2 MHz and detected by a CPMG pulse sequence [55]. We set the echo number for 30 and 6000 for T1 and T2, respectively, and the echo spacing was varied from 10 μs to a few seconds for T1 and the values of which were equal to 100 μs for T2. Each specimen was scanned 64 times to get a good signal-to-noise ratio, and the wait time between successive scans was chosen as 5 s. The specimens were saturated in brine, which was a mixture of deionized water and Calcium Chloride (CaCl2) with salinity of 2.5 × 10⁴ mg·L−1 to prevent the clay minerals from swelling. It was used for NMR measurement to record initial relaxation time spectra and images. After the T1 and T2 spectrum and MRI for the saturated water specimens were determined, the centrifugal processing with a rotation speed of 2500 r·min−1, 2900 r·min−1, 3500 r·min−1, 5000 r·min−1, 7900 r·min−1 and 9100 r·min−1 for 1 h for each speed were conducted on each specimen, and the T2 spectra distributions were tested after different rotation speed centrifugal processing was completed. Specifically, the T1-T2 correlation spectra distributions and MRI were generated after 9100 r·min−1 (corresponding to the maximum rotation speed) for centrifugal processing was implemented to determine the T2 cutoff values, free and irreducible water distributions.
3. Results
3.1. Pore Structures Observed by TS and SEM
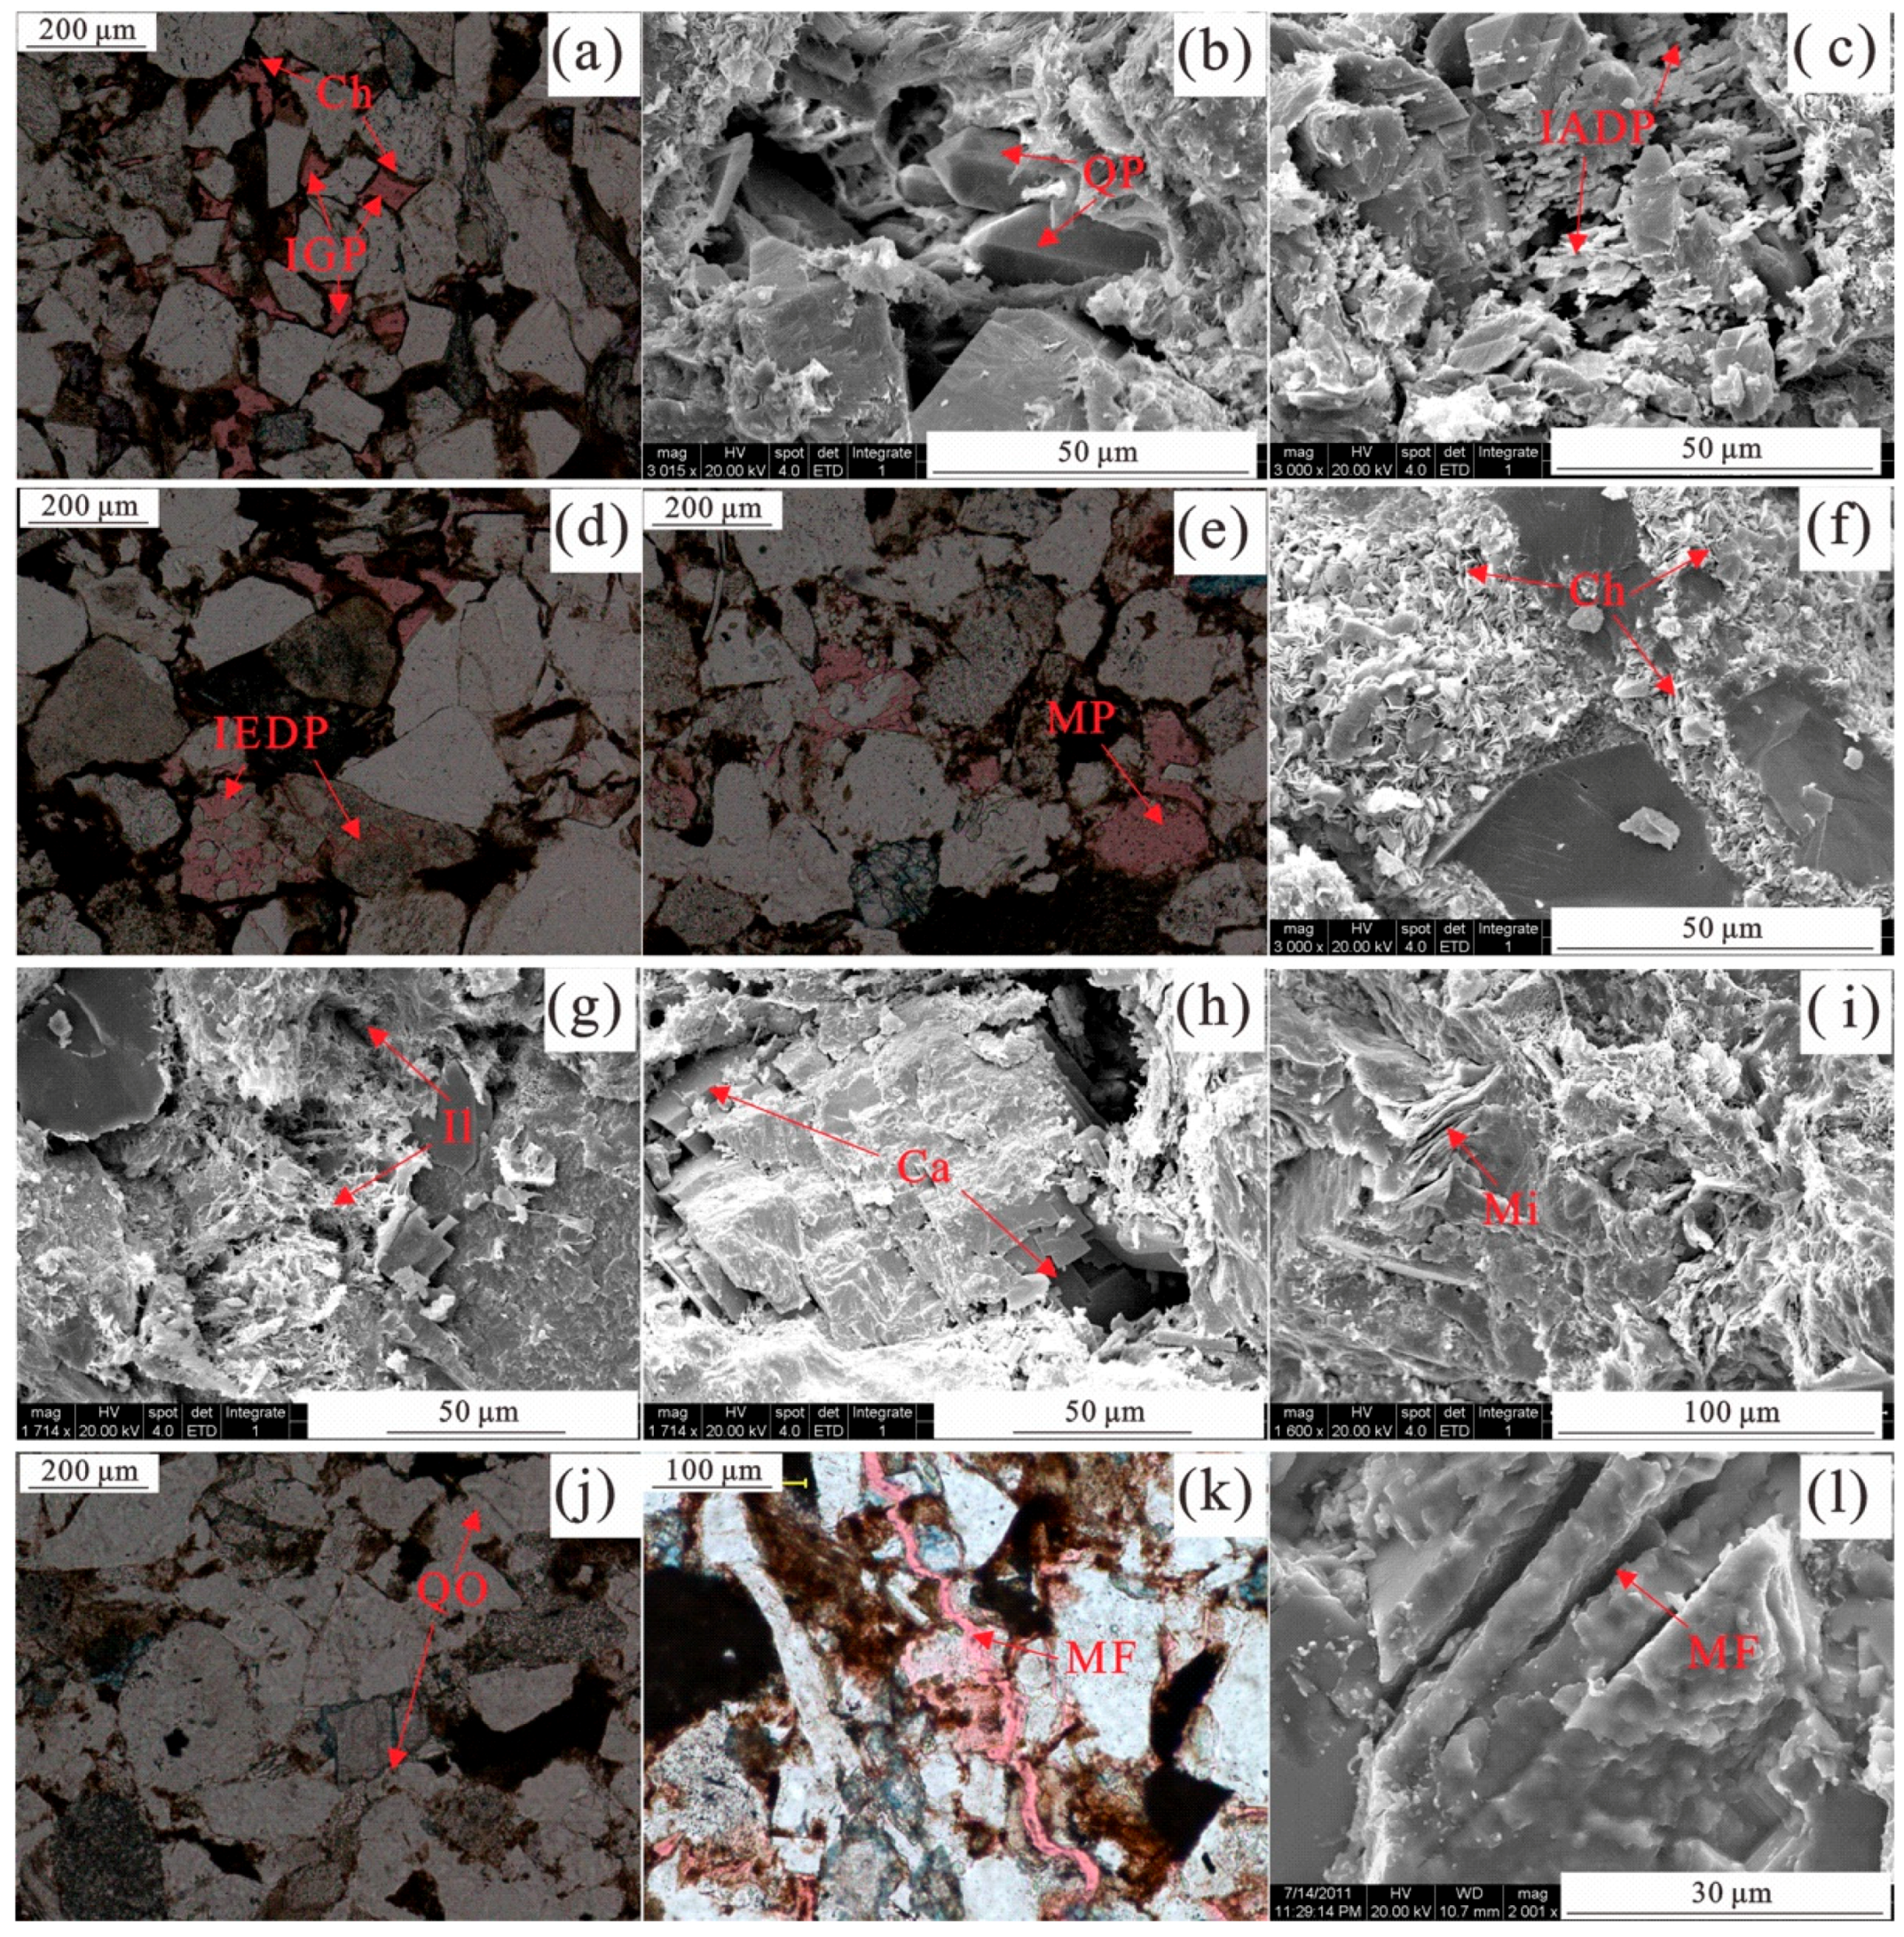
TS and SEM can be used to determine pore types and analyses pore geometry since they provide direct characterization of the pores [17,56]. Four main kinds of pore types are developed in the Upper Triassic Yanchang formation of tight sandstones, including intergranular pores, dissolution pores, intercrystalline pores, and microfractures. The intergranular pores are triangular or polygonal and remain after strong mechanical compaction and clay minerals recrystallization [20], have characteristics of relatively larger pore radius, pore-lining chlorite, and sometimes elongate euhedral quartz prisms (Figure 2a,b). The size of the intergranular pores was typically >40 μm, and the relative abundances of these pores by point counting based on TS observations were in the range from trace levels to 5.9% and averaged as 1.73%. The dissolution pores are generally a result of feldspar and unstable ferromagnesian rock fragments dissolution and show irregular geometry [2,57]; these pore systems are of three categories: intragranular dissolution pores (feldspar leaching generally developed along cleavage planes) (Figure 2c), intergranular dissolution pores (Figure 2d) and moldic pores (the pores derived from complete dissolution of grains and the shapes of the original framework were retained) (Figure 2e) [58]. Point counting results of the dissolution pores reveal a wide range—from trace amounts (due to feldspars leaching) to 1.0% (resulting from the connection of moldic pores and residual intergranular pores) with an average of 0.56%. The intercrystalline pores, which refers to pores within biotite planes, clay aggregates, quartz overgrowths, and carbonate minerals, are commonly small enough (often lower than 10 μm) to be hardly observed in TS; however, the examination under SEM suggested that lamellar chlorite and fibrous illite have widespread intercrystalline pores because of its abundance (Figure 2f,g). The extensive cementation of carbonate minerals can contribute little intercrystalline pores owing to the compacted voids in the lattice (Figure 2h), and pores within sheet like biotite and elongated authigenic quartz only in minor amounts (Figure 2i,j). The microfractures, which are dominated by diagenesis and scarcely observed in cores [59], offer features of microscale in length and nanoscale in width, and can only be detected under microscopic identifications. Microscopic observations of the specimens reveal that the microfractures along the edge of grains and through the grains are the predominate microfracture type in tight sandstones (Figure 2k,l), from which acid solution dissolution and mechanical compaction was derived, respectively [60]. Point counting results show that the contents of microfractures are minimal (<0.2%).
3.2. Pore Structures Characteristics Determined by PCMI
The PCMI-derived curves of mercury drainage and imbibition for the 14 specimens are presented in Figure 3 after Gane calibration [61] in order to make the curves smooth and continuous; the typical parameters for pore structures are listed in Table 2. The specimens could be categorized into four types based on intrusion and extrusion capillary curves. The first type (type α) shows low threshold pressure (Pd) (av. 0.07 MPa), low median pressure (P50) (av. 0.81 MPa), high maximum mercury intrusion saturation (SHgmax) (av. 89.19%) and medium hysteresis between intrusion and extrusion curves, revealing that well-connected pores play a dominant role in this type of sandstone. Besides, partial percolations (plateau stage in mercury intrusion curves), corresponding to the distinct change in saturation over a small range of capillary pressure (gray boxes)), occurred in some specimens, indicating this type is better sorted (average sorting coefficient equal to 2.49) than other types (Figure 3a). For type β specimens, the average Pd and P50 rapidly increase, equal to 0.95% and 8.09%, respectively, and the average SHgmax decreases (av. 86.33%), while a relatively strong hysteresis is observed (Figure 3b). These phenomena suggest that some poorly-connected pores were developed in this type of sandstone. For the type γ specimens, the mercury intrusion curves display that the Pd for all the specimens exceed 1.16 MPa, P50 over 7.06 MPa, and SHgmax is no more than 87.57%, that is, mercury can hardly enter the pores and the proportion of non-connected pores is relatively high, when compared to type α and β. The intrusion-extrusion cycles show more moderate mercury saturation rise and fall, corresponding to weak hysteresis, and no percolation phenomenon. However, the specimen that has strong hysteresis may result from an abundance of mica, which is deformed in the process of mercury injection and leads to the change of pore structures (Figure 3c). In terms of type δ, the average Pd and P50 are the highest, equal to 3.67 MPa and 51.47 MPa, respectively, while the average SHgmax is no more than 83.85%. Strong hysteresis of these specimens is the evidence of poor-connected pores and minor amounts of clay minerals due to intense mechanical compaction (Figure 3d). According to the multitype pore space model proposed by Sakhaee-Pour and Bryant [40], medium hysteresis for type α suggests that intergranular pores mainly constitute the pore space, whereas the void spaces in type γ is predominantly intercrystalline pores, which corresponds to a relatively poor hysteresis; in addition, the dissolution pores may make the greatest contribution to the void spaces in type β because their diameters are midway between intergranular pores and intercrystalline pores, according to the description in Section 3.1. Figure 4 backs this and explains why more mercury was stranded in the spaces in intergranular and dissolution pore-dominated reservoirs, whereas the void spaces of intercrystalline pores can be thoroughly saturated with the wetting phase.
The PCMI-derived PSD can be calculated on the basis of the Washburn equation [23]. The PSD of type α sandstones has a wide size range and possesses high peakedness over 1.0 μm with a long tail in the rests of pore radius, suggesting that specimens with high physical properties contain relatively larger pores and well-sorted PSD (Figure 5a). The PSD results of type β give two locations of the maxima, of which specimens 1# and 4# correspond to the wide range pore radius with bimodal, whereas other specimens show unimodal; the pores with radius larger than 1.0 μm are rare in this type (Figure 5b). The PSD of the type γ sandstones mainly varies from 0.01 μm to 0.4 μm, but the corresponding pore sizes of the peak pore volume values are different, from 0.008 μm to approximately 0.2 μm, indicating a heterogeneity of PSD with similar porosity and permeability as those of type γ (Figure 5c). Quantitative statistics performed on type δ sandstones indicate that the PSD mainly range from 0.003 μm to 0.15 μm, the main crests of these specimens being mainly centered at around 0.015 μm, whereas specimen 5# is accompanied by a peak larger than 0.1 μm, which might show evidence of microfractures (Figure 5d). The rapid increase of frequency in 0.003 μm represent the abundance of tiny pores (mainly the pores among clay minerals or the pores within the aluminosilicate layers); hence, porosity and permeability may be limited because of the rich clay minerals. The results of all the specimens show that the pore radius is distributed over a wide range and exhibits a multimodal PSD, and with the deterioration of physical properties, the PSD becomes more fluctuant, revealing that the pore structures are more complicated and heterogeneous. However, pores with radius over 20 μm are rare, which show a discrepancy between the PCMI and petrographic observations because many large pores are shielded by connected smaller pores. Hence, PCMI provides imperfect information of larger pores and can only uncover PSD of smaller ones, accordingly, the full range of PSD determination is required for PCMI in combination with other methods.
3.3. Pore Structures Characteristics Determined by RCMI
RCMI provides a reliable way to reflect detailed pores and throat structures. Since the void space can be divided into pore region and throat region, based on injection pressure fluctuation, the distribution of pores and throats radius are determined [15]. In order to investigate RCMI-derived PSD, six typical specimens with different physical properties were selected (Table 3). The capillary pressure curves of the specimens show that in the primary stage, the curves of total mercury intrusion saturation followed a trend of pore mercury intrusion saturation, while with the increasing pressure, the total mercury intrusion saturation was contributed to by the throat intrusion saturation and the intrusion pressure of the pore rapidly increased (Figure 6). Based on the trend of pore intrusion mercury saturation curves, the RCMI-derived PSD can be divided into a pore-dominated region corresponding to the stage that the pore mercury intrusion saturation increased exponentially, a throat-dominated region corresponding to the areas that the mercury saturation of pore remained unchanged, whereas the total mercury intrusion followed the trend of throat mercury intrusion, and a hybrid region by which both pores and throats are controlled (Figure 6). Furthermore, all specimens could be assigned to two groups based on the proportion of different regions. Group I exhibited a relatively lower threshold pressure (Pd) and medium pressure (P50), while relatively higher maximum total mercury intrusion saturation (SHgmax); the percentage of pore-dominated and hybrid region exceeded that of throat-dominated, and shows a notable flat segment corresponding to the relatively good sorting of pores and throats (Table 3; Figure 6a,c,d). For Group II, the Pd increased while the SHgmax decreased and P50 disappeared. Moreover, the proportion of throat-dominated region surpasses that of the pore-dominated region in this group and no hybrid region existed, showcasing characteristics of low porosity and explaining why the storage of this group was relatively poor (Table 3; Figure 6e,f). Specimen 5# has relatively low Pd and SHgmax, indicating that it may contain microfractures that lead to the reduction of entry pressure (Table 3; Figure 6b).
The RCMI can test pores and throats separately; hence, the distribution of the pore radius, throat radius, and pore-throat radius ratio is recorded simultaneously [2]. The pores’ radius mainly ranges from 88.23 μm to 230.15 μm with main crests of approximately 105 μm, showing no obvious discrepancy between different specimens (Table 3, Figure 7a). However, the throat radius demonstrates variations among specimens with distinctive features in spectral peaks and radius spectra, mainly ranging from 0.15 μm to 2.54 μm with an average of 1.06 μm (Table 3, Figure 7b). The distribution of pore-throat radius ratio is principally in the range of 55.21–430.78 with the average value of 206.70 (Table 3, Figure 7c). Unlike PCMI, RCMI can provide more reliable results due to the quasi-statics mercury injection process; however, this method generally leads to similar pore radius distributions among various specimens. In addition, the pore radius derived from RCMI shows that tons of pores larger than 100 μm existed, while pores with radius between 10 μm and 100 μm are seldom developed; nevertheless, it does not match with the TS and SEM observations (Figure 2). This comparison reveals that the RCMI may exaggerate the radius of the pores; therefore, necessary corrections for pore radius curves need to be made with the help of other methods.
3.4. Pore-Throat Microstructures Derived from Micro-CT
The pore-throat microstructures depicted by micro-CT allow accurate and detailed investigation of PSD; the pore-throat networks are illustrated in Figure 8. The matrix of the specimens is characterized by dark gray while the pore-throats are in color. The mutually inter-connected pores correspond to the same color, while the disconnected pores are presented by different colors or an isolated part. Due to the expense and time restriction, only two typical specimens with different permeability were selected for this measurement. Specimen 11# had relatively high porosity and permeability (φ: 14.24%, K: 2.70 mD); a mass of pores is mainly displayed in yellow and green, and the percentage of gray is relatively low, suggesting that this specimen had good pore-throat connectivity (Figure 8A,B). Many pores were found to be tubular or in larger spherical shapes, a few were isolated narrowed belt-like or small spherical pores, showcasing that intergranular and dissolution pores play a leading role in high permeability specimens (Figure 8A,B). For specimen 12#, which had relatively low porosity and permeability (φ: 12.54%, K: 0.48 mD), the pores were sparsely distributed, when compared to specimen 11#, and the same color was sporadically distributed, suggesting poor connectivity of these specimens. The pore radius distribution of these specimens show that a few narrow pores are found in 11#, whereas abundant pores with radius around 30 μm play important roles in forming major void spaces, which implies that micro-pores determined the storage and transport properties in tight sandstone (Figure 8C,F).
3.5. NMR Results
3.5.1. T1 Relaxation Time before and after Centrifugal Processing
T1 measurements in a fully saturated state and centrifuged state were taken for the specimens; these spectra are shown in Figure 9. The T1 spectra of specimens show multimodal characteristics with the maximum crests being mainly distributed in the range of 51.79–719.69 ms and 4.64–64.49 ms in a fully saturated state and a centrifuged state, respectively. However, the major peaks show a broad massif-like peak in the fully saturated state and a narrow ridge-like peak in the centrifuged state; the corresponding T1 relaxation time and amplitude moves from large to small (Figure 9). The spurious crests at high (>8000 ms) T1 value in Figure 9a are the result of optimum values of the smoothening factors arising from the low error and unstable nature of the problem [62,63].
3.5.2. T2 Relaxation Time before and after Centrifugal Processing
Unlike T1 relaxation time, tests of T2 relaxation time are preferred, as they are not time-consuming and can provide more accurate information about the void space by liquid-state NMR [32,64]. The T2 distributions in the fully saturated and centrifugated state show bimodal or multimodal features with two crests; the short T2 values represents micropores, mainly distributed in the range of 0.11–1.54 ms, while the long T2 relaxation time corresponding to larger pores and cracks is mainly distributed in the range of 5.63–382.79 ms (Figure 10a). The T2 spectra show similar shape before and after the centrifugal processing, while amplitude is narrowed in the irreducible water state (Figure 10). The left peak shows a relatively narrow peak distribution and larger amplitude than that of the right peaks in the fully saturated state, indicating that micropores have a higher percentage, while meso- and macropores have a wider pore radius range [65]. Besides, amplitude reduction with a slight drop in the left peak and distinct descending right peaks in the centrifugated state reveal that the irreducible water is mainly stranded in the micropores after centrifugal processing (Figure 10).
4. Discussion
4.1. Full PSD Calculated by Integration of PCMI, RCMI, and NMR
As mentioned above, PCMI, RCMI, micro-CT, and NMR tests were conducted on the same specimens; however, these tests do not lead to coincident results because of the limitations and drawbacks of these experiments. Thus, no single test can be used to investigate total PSD in tight sandstones; hence, the experimental data of these experiments may be modified for the sake of precise determination. PCMI can determine the characteristics of tiny pores but acquire defective larger pore radius spectra due to the shielding effect and mercury snap-off during extrusion [24,66]. RCMI could quantify the throat, but had a lower throat radius limit of 0.12 μm, while the pores’ spectra detected by this method seems unreliable, because the overall pore radius of different specimens determined by RCMI are mainly in the range of 100–200 μm; observation of TS reveals few pores larger than 100 μm in the research area (Figure 2; Figure 7a). Besides, the pore radius distributions of the studied area are almost in accordance with that of other basins, such as the Songliao basin [15], suggesting that calibration needs to be done in order to acquire accurate pore radius spectra. Moreover, the RCMI-derived PSD shows that there is a “missing zone”, namely, the pores radius range from 20 μm to 80 μm is rarely presented. These pores are commonly found in the TS and SEM micrographs (Figure 2 and Figure 7), suggesting that this experiment may exaggerate the radius of mesopores. Micro-CT scanning may be a reasonable method to characterize PSD; however, it requires a trade-off between expense and representativeness. Moreover, the resolution of this method makes it unable to estimate the number of relatively tiny pores. The isolated pores, which have fewer contributions to storage capacity and no contributions to percolation ability, can be detected; thereupon, this test is inapplicable for the determination of PSD because commercial flow is often restricted by isolated pores [2,21,22,51]. The T2 relaxation time, derived from the NMR test, can be used to describe PSD as a nondestructive method that does not destroy in-suit pore structures; however, this method requires calibration with an independent test to calculate surface relaxivity and specific surface area and then convert the relaxation time to pore radius [15,21,22,31,32].
In order to overcome these shortcomings, an integrated method is necessary. First, fitting procedures of T2 relaxation time and mercury intrusion need to be done. As discussed above, the PCMI-derived PSD is unreliable due to its shielding effect and induced cracks that resulted from high mercury injection pressure. There is a discrepancy between RCMI-derived pore radius distributions and optical observation results; hence, we use RCMI-derived throat radius curves to calibrate the T2 spectra to PSD. According to previous research [16,65], the relationship between T2 relaxation time of fluid in the porous materials and pore radius can be expressed as follows:
where rt is the pore-throat radius, μm; C and n can be regarded as a constant parameter. In this way, T2 relaxation time can be transformed to pore radius if C and n are determined. The procedures are listed below:
(1) The maximum throat intrusion saturation is multiplied by specimen-measured helium porosity φ to obtain throat porosity, φt. And then, the product of the incremental throat mercury intrusion saturation and φt can be calculated as incremental throat mercury intrusion porosity. (2) The incremental amplitude of T2 relaxation time is multiplied by helium porosity φ to obtain incremental porosity, φt2. (3) The cumulative porosity according to φt and φt2 should be calculated, and the comparison of both curves obtained. The results show that there is a good match between RCMI- and NMR-derived cumulative porosity, suggesting that these procedures and methods are reasonable and reliable for calibration (Figure 11a). Then the linear least square method is used to determine the most appropriate C and n (Figure 11b). At last, the T2 relaxation time can be transformed to the pore radius, and the NMR-derived PSD is obtained.
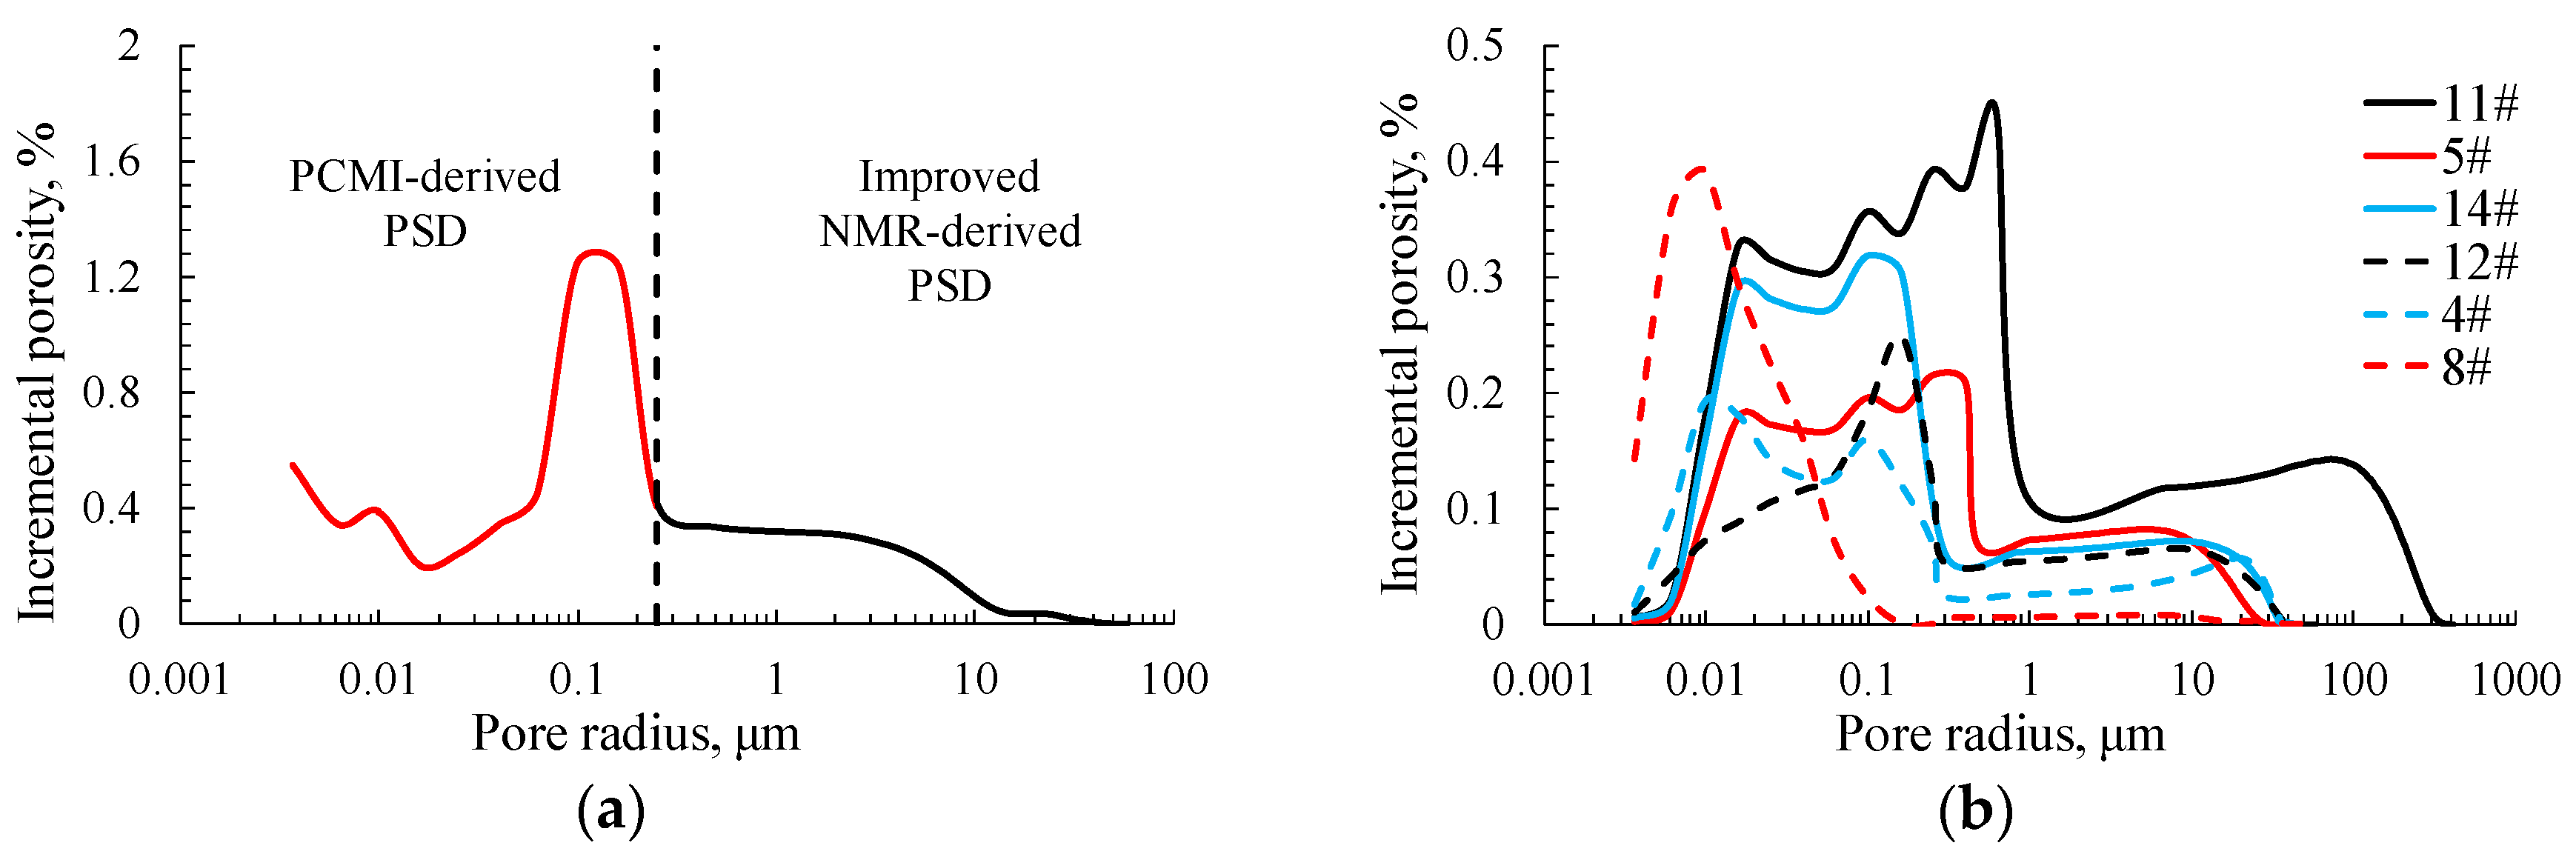
The specimens were saturated with simulated formation water before it was put into the NMR apparatus; thus, some dead pores and ink-bottle pores saturated with fluid are inevitable. However, this non- or weak- connected pores contributed less to the percolation [65]. Besides, as mentioned above, the RCMI-derived throat distributions are reliable, although it cannot detect pores that are lower than 0.12 μm; hence, the integration of PCMI and NMR-derived PSD is regarded as a valid way to acquire the full range of PSD. The procedures are listed as follows: (1) the incremental porosity of improved NMR-derived PSD, which is more than 0.12 μm, is cumulated to obtain NMR cumulative porosity, φN. (2) Subtract the φN from helium measured porosity φ to get micropores porosity, φM. (3) The incremental mercury intrusion saturation of PCMI, which has radius less than 0.12 μm, is multiplied by φ to acquire the incremental PCMI-derived porosity. (4) The ratio of φM and φ is multiplied by the incremental PCMI-derived porosity to obtain calibrated PCMI-derived porosity. After the improved NMR-derived porosity and PCMI-derived porosity are determined, the full range PSD can be transformed to that of Figure 12a. The improved PSD matches well with the microscopic observations (Figure 2), demonstrating that this distribution is reasonable. In the same way, the calibration equations for all specimens can be acquired and displayed in Figure 12b.
4.2. T2 Cutoff Values
T2 cutoff is a significant value in the NMR experiment because the movable fluid saturation can be determined by this parameter [13]. This value is not a fixed constant, due to the variation of surface relaxivity and specific surface area of different specimens; centrifugal processing is an effective way to calculate this value. Figure 13 demonstrates how to calculate the T2 cutoff: first, the cumulative porosity of T2 spectrum in the fully saturated and irreducible water state is obtained, then a horizontal projection from the post centrifugation curve is drawn, and corresponding T2 value of the intersection of this horizontal line and cumulative curve of the fully saturated state is the T2 cutoff.
We repeat this centrifugal process with various rotation speeds. In order to acquire the most accurate movable fluid saturation and determine optimum rotation speed, Coates model [65,67] was used:
where KC represents calculated permeability (mD), φ represents measured porosity (%), Cc is a constant, FFI represents movable fluid saturation, and BVI represents irreducible fluid saturation. Hence, the linear regressions between φ4()2 under various rotation speeds and measured permeability (Ka) are performed to determine the optimum rotation speed. Figure 14 illustrate that 9600 r·min−1 can best fit Equation (2) with an R2 value of 0.9428. The values of optimum T2 cutoff are listed in Table 4.
4.3. Controls of Movable Fluid Traits on Reservoir Quality
4.3.1. Movable Fluid Parameters and Their Effects on Reservoir Quality
After determining the optimum rotation speed (9100 r·min−1), the movable fluid parameters can be calculated. In NMR-derived relaxation time studies, the movable fluid saturation (MFS) and movable fluid porosity (MFP) reflect the volumetric fraction of movable fluid occurring in the voids and the practical fluid flow ability through the sandstones, respectively; thus, there is a significant parameter that needs to be considered in evaluating reservoir quality [12]. Reservoir quality is defined here as physical properties, including porosity and permeability. The results show that the relationship between the reservoir quality and movable fluid saturation is inferior to that of the movable fluid porosity; the correlation between movable fluid parameters and porosity are lower than that of permeability (Table 1 and Table 4, Figure 15). These results demonstrate that the uncertainty of the porosity measurements, caused by the complex pore-throat structure, needs to be eliminated to characterize reservoir quality accurately; in addition, the movable fluid parameters are more closely aligned with permeability. Meanwhile, with decreasing reservoir quality and movable fluid saturation, chlorite decreases from 7% to 0%, while illite increases from 0% to 7%, indicating that illite exerts a significant impact on retaining water, whereas chlorite can retard compaction (Figure 16a–c). Besides, reduction rate of reservoir quality with movable fluid saturation tends to decrease in tight sandstones with intergranular pores-dominated reservoirs to those with clay minerals, which indicates that movable fluid parameters are sensitive to a higher content of clay minerals or the proportion of tiny throats, whereas the reduction of intergranular pores play a clearly important role in the descending permeability (Figure 16a,b,d).
4.3.2. T1-T2 Correlation Spectra and Their Effects on Reservoir Quality
The multidimensional correlation functions of T1 and T2, which were used to determine the characteristics of PSD, are of great interest. Appendix A presents the T1-T2 spectrum for specimens of tight sandstones; the bright red represents high amplitude, while the light red represents low amplitude. Appendix A illustrates that in either good or poor reservoir qualities specimens, the range of T1 and T2 is approximately 3 to 4 orders of magnitude because of the wide range of PSD, and the figures showed a wide distribution before centrifugation and a relatively narrow ridge-like peak in the center of the spectra after centrifugation. The bumps along the axis are likely artifacts due to noise. According to Song et al. (2002) [55], the peaks with small T1 and T2 are dominated by surface water whereas the long T1 and T2 peaks are contributed by surface and bulk water, and these are consistent with the notion that the free water (bulk water) that is in the center of the pores is easily removed after centrifugal processing [55]. Besides, the zenith of the spectra before centrifugation moved from relatively high to low relaxation time in irreducible water conditions, suggesting that the aqueous phases have low mobility in tiny pores. Moreover, the ridges are more closely parallel to the line T1 = T2, meaning that they have similar T1 and T2 ratio corresponding to similar properties (Appendix A).
The effect of reservoir quality is further investigated. For the specimen with greatest reservoir quality (11#) (Appendix A (A,B)), the proportion of bulk water that corresponds to larger pores is relatively high, compared to poor reservoir qualities specimens. This manifests that mill metric voids play a predominant role in optimization of reservoir quality in tight sandstone reservoirs. With permeability decreasing, the reduction rate of the water covering spectra areas of all the specimens, except specimen 5#, are decline, suggesting that the pores that allowed water to immigrate freely (bulk water) were few in the low permeability specimen, even in trace amounts in extremely tight sandstones (Appendix A (K,L)). Specimen 5# is characterized as low porosity and high permeability due the presence of microcracks (Figure 2l), which may lead to the wide range of T2 and narrow range of T1 before centrifugal processing (Figure 9a, Figure 10b, Appendix A (C,D)). However, the mechanism of this phenomenon needs further investigation. Besides, for good reservoir quality specimens, peaks and shoulders are continuously distributed, whereas poor ones show separate distributions before centrifugation, revealing that the pores are relatively homogeneous, distributed in tight sandstones with high physical properties (Table 1, Appendix A (A–D)). After centrifugation, the spectra tend to show discrete distributions because the heterogeneity of the PSD caused some bulk water, which is hard to remove, especially for medium permeability specimens (Table 1, Appendix A (E–H)). For the extremely tight sandstone, however, the PSD shows a homogeneous distribution that results in the continuous distributions of T1-T2 correlation spectra, because the very tiny pores generally show continuous arrangement (Table 1, Appendix A (I–L)).
4.3.3. NMR Imaging for Saturated and Irreducible Water Distributions
The images show distinct difference in simulated water saturation under fully saturated and irreducible water conditions; the red color represents oil and dark blue denotes deionized water, and the surrounding blue color may be caused by signal noise (Appendix B). The water saturation of the good reservoir quality specimens is always higher than that of poor reservoir quality, implying that brine can enter the majority of pore spectrum of high permeability specimens, whereas the low permeability specimens are dominated by tight section. Due to the hydrophilia of illite and I/S minerals [68] (low permeability specimens, which contain relatively abundant illite and I/S minerals), the change of water saturation before and after centrifugal processing is minor (Table 1, Appendix B). Besides, the percentage of high-saturated sections in high permeability specimens before and after centrifugal processing decline faster than that of the low permeability samples (slightly decrease) (Table 1, Appendix B). This implies that movable fluid mainly comes from a contribution of intergranular pores, while irreducible water is mainly stranded in intercrystalline pores.
4.4. Effects of Movable Pore Radius Lower Limit on Reservoir Quality
During NMR centrifugal processing, the specimens underwent different movable fluid loss, predominantly by centrifugal forces with minor gravity [65]. In terms of the PSD being converted from the T2 spectra and RCMI data, a series of T2 cutoff values, which is defined by the ratio of T2 spectra before and after centrifugal processing with various centrifugal forces, were often used to determine the lower limit of movable pore radius [11,32]. In the case of high permeability specimens, a sharp decrease of macropores was observed corresponding to high T2 relaxation time first, followed by a moderate and uniform reduction (Appendix A (A,B)). The correlation between lower limits of movable pore radius and movable fluid porosity show a distinct descending at the initial stage, followed by a moderate decrease (Figure 17). We can thus infer that the intergranular pores, which correspond to a larger pore radius, are the main result of the reduction of the lower limits of pore radius in higher permeability sandstones, and dissolution pores and intercrystalline pores are less important. For specimens with medium permeability, the amplitude of T2 relaxation time drop uniformly (Appendix A (C,D)); however, the lower limits of movable pore radius show different changes: a distinct change in MFS and MFP over a small range of pore radius lower limits occurred in 14#, whereas the variance of 12 # is opposite (Figure 17), meaning that although these two specimens have similar reservoir quality, the percolation capacity of 14# is mainly dominated by heterogeneous pore structures with relatively low porosity, whereas the heterogeneity of the pore-throats in specimen 12# limits the improvement of permeability, even with relatively high porosity. Specimens with lower permeability resulted in no marked descending of T2 and lower limits of movable pore radius (Appendix A (E,F)); the length of the curves for the tight specimen are generally short (except the first stage of 4# due to minor amounts of intergranular pores), indicating that pores in aqueous phases were hard to enter and were removed in poor reservoir quality sandstones (Figure 17). These results manifest that because the tight sandstones are highly heterogeneous, during the centrifugation process, rates of water saturation reduction in macropores are faster than those for tiny pores. For specimens with intergranular pores, the movable fluid advances, exempted from the larger pores.
5. Conclusions
A combination of TS, SEM, X-ray diffraction, PCMI, RCMI, CT, and NMR tests were conducted on typical tight sandstone specimens from Ordos Basin to investigate pore structures and movable fluid traits. The following observations were derived:
(1) Intergranular pores, dissolution pores, intercrystalline pores, and microfractures are four main kinds of pores in the research area. The PCMI-derived capillary pressure curves can be grouped into four types, and the RCMI-derived capillary pressure curves are divided into pore-dominated, throat-dominated and hybrid regions. Good pore-throat connectivity plays a vital role in enhancing physical properties based on CT images. The amplitude and incremental porosity distribution become small and narrow after centrifugal processing using NMR apparatus.
(2) The PSDs derived by RCMI show discrepancy with the direct observations, and the improved PSDs can be obtained by combining PCMI, RCMI and NMR and then reconstructing cumulative PSDs, which is consistent with the observation results of TS and SEM images.
(3) On the basis of Coates model, the linear regression results show that 9100 r·min−1 is the optimum rotation speed in the research area to determine appropriate T2 cutoff values. MFP can characterize reservoir quality accurately, and a high proportion of chlorite with relatively abundant intergranular pores could improve MFS and reservoir quality.
(4) Bulk water makes great contributions to the movable fluid, whereas surface water is hard to be removed. Movable fluid mainly comes from the contribution of intergranular pores, while irreducible water is mainly stranded in intercrystalline pores, and the movable fluid could advance, exempted from the larger pores.
(5) Pore structures controls the lower limits of movable pore radius and hence affects reservoir quality. In sandstones with relatively high permeability, abundant intergranular pores can reduce the lower limits of pore radius; however, sandstones with complex pore structures have relatively poor reservoir qualities.
Author Contributions
Conceptualization, D.L. and D.R.; Data curation, D.L.; Formal analysis, D.L. and D.R.; Funding acquisition, W.S. and D.R.; Investigation, W.S.; Methodology, D.L.; Project administration, W.S.; Supervision, W.S.; Writing—original draft, D.L.; Writing—review & editing, D.R.
Funding
This research was co-funded by National Science and Technology Major Project, grant number 2016ZX05047-003-005; National Natural Science Foundation of China: grant number 41702146, 51874242, and 41802166; Doctoral Fund of Ministry of Education of China, grant number 2018M643554.
Acknowledgments
The authors appreciate the help and support from State Key Laboratory of Continental Dynamics, and State Engineering Laboratory for Exploration and Development of Low Permeability Oil and Gas Fields.
Conflicts of Interest
The authors declare no conflict of interest.
Appendix A
T1-T2 correlation spectra in this study:
![Processes 07 00149 i001]()
![Processes 07 00149 i002]()


Appendix B
NMR imaging in this study:
![Processes 07 00149 i003]()

References
- Hughes, J.D. Energy: A reality check on the shale revolution. Nature 2013, 494, 307–308. [Google Scholar] [CrossRef] [PubMed]
- Wu, H.; Ji, Y.; Liu, R.; Zhang, C.; Chen, S. Insight into the Pore Structure of Tight Gas Sandstones: A Case Study in the Ordos Basin, NW China. Energy Fuels 2017, 31, 13159–13178. [Google Scholar] [CrossRef]
- Hill, R.J.; Zhang, E.; Katz, B.J.; Tang, Y. Modeling of gas generation from the Barnett shale, Fort Worth Basin, Texas. AAPG Bull. 2007, 91, 501–521. [Google Scholar] [CrossRef]
- Pollastro, R.M.; Cook, T.A.; Roberts, L.N.; Schenk, C.J.; Lewan, M.D.; Anna, L.O.; Gaswirth, S.B.; Lillis, P.G.; Klett, T.R.; Charpentier, R.R. Assessment of Undiscovered Oil Resources in the Devonian-Mississippian Bakken Formation, Williston Basin Province, Montana and North Dakota; No. 2008-3021; Geological Survey (US): Reston, VA, USA, 2008.
- Zou, C.; Zhang, G.; Tao, S. Geological features and exploration discoveries of unconventional resources and the petroleum geological theory. Pet. Explor. Dev. 2010, 37, 129–145. [Google Scholar]
- Kang, Y.L.; Luo, P.Y. Current status and prospect of key techniques for exploration and production of tight sandstone gas reservoirs in China. Pet. Explor. Dev. 2007, 34, 239–247. [Google Scholar]
- Zou, C.; Zhu, R.; Liu, K.; Su, L.; Bai, B.; Zhang, X.; Yuan, X.; Wang, J. Tight gas sandstone reservoirs in China: characteristics and recognition criteria. J. Pet. Sci. Eng. 2012, 88, 82–91. [Google Scholar] [CrossRef]
- Rezaee, R.; Saeedi, A.; Clennell, B. Tight gas sands permeability estimation from mercury injection capillary pressure and nuclear magnetic resonance data. J. Pet. Sci. Eng. 2012, 88, 92–99. [Google Scholar] [CrossRef]
- Lai, J.; Wang, G. Fractal analysis of tight gas sandstones using high-pressure mercury intrusion techniques. J. Nat. Gas Sci. Eng. 2015, 24, 185–196. [Google Scholar] [CrossRef]
- Xi, K.; Cao, Y.; Haile, B.G.; Zhu, R.; Jahren, J.; Bjørlykke, K.; Zhang, X.; Hellevang, H. How does the pore-throat size control the reservoir quality and oiliness of tight sandstones? The case of the Lower Cretaceous Quantou Formation in the southern Songliao Basin, China. Mar. Pet. Geol. 2016, 76, 1–15. [Google Scholar] [CrossRef]
- Huang, H.; Sun, W.; Ji, W.; Zhang, R.; Du, K.; Zhang, S.; Ren, D.; Wang, Y.; Chen, L.; Zhang, X. Effects of pore-throat structure on gas permeability in the tight sandstone reservoirs of the Upper Triassic Yanchang formation in the Western Ordos Basin, China. J. Pet. Sci. Eng. 2018, 162, 602–616. [Google Scholar] [CrossRef]
- Gao, H.; Li, H.A. Pore structure characterization, permeability evaluation and enhanced gas recovery techniques of tight gas sandstones. J. Nat. Gas Sci. Eng. 2016, 28, 536–547. [Google Scholar] [CrossRef]
- Gao, H.; Li, H. Determination of movable fluid percentage and movable fluid porosity in ultra-low permeability sandstone using nuclear magnetic resonance (NMR) technique. J. Pet. Sci. Eng. 2015, 133, 258–267. [Google Scholar] [CrossRef]
- Nelson, P.H. Pore-throat sizes in sandstones, tight sandstones, and shales. AAPG Bull. 2009, 93, 329–340. [Google Scholar] [CrossRef]
- Xiao, D.; Jiang, S.; Thul, D.; Huang, W.; Lu, Z.; Lu, S. Combining rate-controlled porosimetry and NMR to probe full-range pore throat structures and their evolution features in tight sands: A case study in the Songliao Basin, China. Mar. Pet. Geol. 2017, 83, 111–123. [Google Scholar] [CrossRef]
- Wang, L.; Zhao, N.; Sima, L.; Meng, F.; Guo, Y. Pore structure characterization of the tight reservoir: Systematic integration of mercury injection and nuclear magnetic resonance. Energy Fuels 2018, 32, 7471–7484. [Google Scholar] [CrossRef]
- Anovitz, L.M.; Cole, D.R.; Rother, G.; Allard, L.F.; Jackson, A.J.; Littrell, K.C. Diagenetic changes in macro-to nano-scale porosity in the St. Peter Sandstone: An (ultra) small angle neutron scattering and backscattered electron imaging analysis. Geochim. Cosmochim. Acta 2013, 102, 280–305. [Google Scholar] [CrossRef]
- Favvas, E.P.; Sapalidis, A.A.; Stefanopoulos, K.L.; Romanos, G.E.; Kanellopoulos, N.K.; Kargiotis, E.K.; Mitropoulos, A.C. Characterization of carbonate rocks by combination of scattering, porosimetry and permeability techniques. Microporous Mesoporous Mater. 2009, 120, 109–114. [Google Scholar] [CrossRef]
- Loucks, R.G.; Ruppel, S.C. Mississippian Barnett Shale: Lithofacies and depositional setting of a deep-water shale-gas succession in the Fort Worth Basin, Texas. AAPG Bull. 2007, 91, 579–601. [Google Scholar] [CrossRef]
- Loucks, R.G.; Reed, R.M.; Ruppel, S.C.; Jarvie, D.M. Morphology, genesis, and distribution of nanometer-scale pores in siliceous mudstones of the Mississippian Barnett Shale. J. Sediment. Res. 2009, 79, 848–861. [Google Scholar] [CrossRef]
- Mayo, S.; Josh, M.; Nesterets, Y.; Esteban, L.; Pervukhina, M.; Clennell, M.B.; Maksimenko, A.; Hall, C. Quantitative micro-porosity characterization using synchrotron micro-CT and xenon K-edge subtraction in sandstones, carbonates, shales and coal. Fuel 2015, 154, 167–173. [Google Scholar] [CrossRef]
- Liu, X.; Wang, J.; Ge, L.; Hu, F.; Li, C.; Li, X.; Yu, J.; Xu, H.; Lu, S.; Xue, Q. Pore-scale characterization of tight sandstone in Yanchang Formation Ordos Basin China using micro-CT and SEM imaging from nm-to cm-scale. Fuel 2017, 209, 254–264. [Google Scholar] [CrossRef]
- Washburn, E.W. The dynamics of capillary flow. Phys. Rev. 1921, 17, 273–283. [Google Scholar] [CrossRef]
- Kaufmann, J.; Loser, R.; Leemann, A. Analysis of cement-bonded materials by multi-cycle mercury intrusion and nitrogen sorption. J. Colloid Interface Sci. 2009, 336, 730–737. [Google Scholar] [CrossRef] [PubMed]
- Huang, H.; Chen, L.; Sun, W.; Xiong, F.; Ji, W.; Jia, J.; Tang, X.; Zhang, S.; Gao, J.; Luo, B. Pore-throat structure and fractal characteristics of Shihezi Formation tight gas sandstone in the Ordos Basin, China. Fractals 2018, 26, 1840005. [Google Scholar] [CrossRef]
- Yuan, H.H.; Swanson, B.F. Resolving pore-space characteristics by rate-controlled porosimetry. SPE Form. Eval. 1989, 4, 17–24. [Google Scholar] [CrossRef]
- Gao, H.; Li, T.; Yang, L. Quantitative determination of pore and throat parameters in tight oil reservoir using constant rate mercury intrusion technique. J. Pet. Explor. Prod. Technol. 2016, 6, 309–318. [Google Scholar] [CrossRef]
- Wang, R.; Chi, Y.; Zhang, L.; He, R.; Tang, Z.; Liu, Z. Comparative studies of microscopic pore throat characteristics of unconventional super-low permeability sandstone reservoirs: Examples of Chang 6 and Chang 8 reservoirs of Yanchang Formation in Ordos Basin, China. J. Pet. Sci. Eng. 2018, 160, 72–90. [Google Scholar] [CrossRef]
- Liu, H.; d’Eurydice, M.N.; Obruchkov, S.; Galvosas, P. Determining pore length scales and pore surface relaxivity of rock cores by internal magnetic fields modulation at 2 MHz NMR. J. Magn. Reson. 2014, 246, 110–118. [Google Scholar] [CrossRef] [PubMed]
- Yao, Y.; Liu, D. Comparison of low-field NMR and mercury intrusion porosimetry in characterizing pore size distributions of coals. Fuel 2012, 95, 152–158. [Google Scholar] [CrossRef]
- Daigle, H.; Johnson, A. Combining mercury intrusion and nuclear magnetic resonance measurements using percolation theory. Transp. Porous Media 2016, 111, 669–679. [Google Scholar] [CrossRef]
- Yao, Y.; Liu, D.; Che, Y.; Tang, D.; Tang, S.; Huang, W. Petrophysical characterization of coals by low-field nuclear magnetic resonance (NMR). Fuel 2010, 89, 1371–1380. [Google Scholar] [CrossRef]
- Desbois, G.; Urai, J.L.; Kukla, P.A.; Konstanty, J.; Baerle, C. High-resolution 3D fabric and porosity model in a tight gas sandstone reservoir: A new approach to investigate microstructures from mm-to nm-scale combining argon beam cross-sectioning and SEM imaging. J. Pet. Sci. Eng. 2011, 78, 243–257. [Google Scholar] [CrossRef]
- Zhao, H.; Ning, Z.; Wang, Q.; Zhang, R.; Zhao, T.; Niu, T.; Zeng, Y. Petrophysical characterization of tight oil reservoirs using pressure-controlled porosimetry combined with rate-controlled porosimetry. Fuel 2015, 154, 233–242. [Google Scholar] [CrossRef]
- Guan, H.; Brougham, D.; Sorbie, K.S.; Packer, K.J. Wettability effects in a sandstone reservoir and outcrop cores from NMR relaxation time distributions. J. Pet. Sci. Eng. 2002, 34, 35–54. [Google Scholar] [CrossRef]
- Li, P.; Sun, W.; Wu, B.; Gao, Y.; Du, K. Occurrence characteristics and influential factors of movable fluids in pores with different structures of Chang 63 reservoir, Huaqing Oilfield, Ordos Basin, China. Mar. Pet. Geol. 2018, 97, 480–492. [Google Scholar] [CrossRef]
- Lai, J.; Wang, G.; Fan, Z.; Chen, J.; Wang, S.; Zhou, Z.; Fan, X. Insight into the pore structure of tight sandstones using NMR and HPMI measurements. Energy Fuels 2016, 30, 10200–10214. [Google Scholar] [CrossRef]
- Hassanizadeh, S.M.; Celia, M.A.; Dahle, H.K. Dynamic effect in the capillary pressure–saturation relationship and its impacts on unsaturated flow. Vadose Zone J. 2002, 1, 38–57. [Google Scholar] [CrossRef]
- Hossain, Z.; Grattoni, C.A.; Solymar, M.; Fabricius, I.L. Petrophysical properties of greensand as predicted from NMR measurements. Pet. Geosci. 2011, 17, 111–125. [Google Scholar] [CrossRef]
- Sakhaee-Pour, A.; Bryant, S.L. Effect of pore structure on the producibility of tight-gas sandstones. AAPG Bull. 2014, 98, 663–694. [Google Scholar] [CrossRef]
- Clarkson, C.R.; Freeman, M.; He, L.; Agamalian, M.; Melnichenko, Y.B.; Mastalerz, M.; Bustin, R.M.; Radliński, A.P.; Blach, T.P. Characterization of tight gas reservoir pore structure using USANS/SANS and gas adsorption analysis. Fuel 2012, 95, 371–385. [Google Scholar] [CrossRef]
- Dai, J.; Li, J.; Luo, X.; Zhang, W.; Hu, G.; Ma, C.; Guo, J.; Ge, S. Stable carbon isotope compositions and source rock geochemistry of the giant gas accumulations in the Ordos Basin, China. Organ. Geochem. 2005, 36, 1617–1635. [Google Scholar] [CrossRef]
- Guo, H.; Jia, W.; Peng, P.A.; Lei, Y.; Luo, X.; Cheng, M.; Wang, X.; Zhang, L.; Jiang, C. The composition and its impact on the methane sorption of lacustrine shales from the Upper Triassic Yanchang Formation, Ordos Basin, China. Mar. Pet. Geol. 2014, 57, 509–520. [Google Scholar] [CrossRef]
- Xiao, X.M.; Zhao, B.Q.; Thu, Z.L.; Song, Z.G.; Wilkins, R.W.T. Upper Paleozoic petroleum system, Ordos Basin, China. Mar. Pet. Geol. 2005, 22, 945–963. [Google Scholar] [CrossRef]
- Tang, X.; Zhang, J.; Wang, X.; Yu, B.; Ding, W.; Xiong, J.; Yang, Y.; Wang, L.; Yang, C. Shale characteristics in the southeastern Ordos Basin, China: Implications for hydrocarbon accumulation conditions and the potential of continental shales. Int. J. Coal Geol. 2014, 128, 32–46. [Google Scholar] [CrossRef]
- Liu, D.; Sun, W.; Li, D.; Shi, J.; Ren, D. Pore structures characteristics and porosity evolution of tight sandstone reservoir: taking the Chang 63 tight sandstones reservoir of Huaqing Area in Ordos Basin as an instance. FEB-Fresenius Environmental Bulletin 2018, 1043–1052. [Google Scholar]
- Folk, R.L. Petrology of Sedimentary Rocks; Hemphill Publishing Company: Austin, TX, USA, 1980; Volume 21, pp. 714–727. [Google Scholar]
- Cui, Y.; Wang, G.; Jones, S.J.; Zhou, Z.; Ran, Y.; Lai, J.; Li, R.; Deng, L. Prediction of diagenetic facies using well logs–A case study from the upper Triassic Yanchang Formation, Ordos Basin, China. Mar. Pet. Geol. 2017, 81, 50–65. [Google Scholar] [CrossRef]
- Lai, J.; Wang, G.; Ran, Y.; Zhou, Z.; Cui, Y. Impact of diagenesis on the reservoir quality of tight oil sandstones: The case of Upper Triassic Yanchang Formation Chang 7 oil layers in Ordos Basin, China. J. Pet. Sci. Eng. 2016, 145, 54–65. [Google Scholar] [CrossRef]
- Li, S.; Shi, Z.; Liu, X.; Yang, S.; Deng, X.; Liu, G.; Li, J. Quantitative analysis of the Mesozoic abnormal low pressure in Ordos Basin. Pet. Explor. Dev. 2013, 40, 566–571. [Google Scholar] [CrossRef]
- Bai, B.; Zhu, R.; Wu, S.; Yang, W.; Gelb, J.; Gu, A.; Zhang, X.; Su, L. Multi-scale method of Nano (Micro)-CT study on microscopic pore structure of tight sandstone of Yanchang Formation, Ordos Basin. Pet. Explor. Dev. 2013, 40, 354–358. [Google Scholar] [CrossRef]
- Shearing, P.R.; Bradley, R.S.; Gelb, J.; Lee, S.N.; Atkinson, A.; Withers, P.J.; Brandon, N.P. Using synchrotron X-ray nano-CT to characterize SOFC electrode microstructures in three-dimensions at operating temperature. Electrochem. Solid-State Lett. 2011, 14, 117–120. [Google Scholar] [CrossRef]
- Krakowska, P.; Dohnalik, M.; Jarzyna, J.; Wawrzyniak-Guz, K. Computed X-ray microtomography as the useful tool in petrophysics: A case study of tight carbonates Modryn formation from Poland. J. Nat. Gas Sci. Eng. 2016, 31, 67–75. [Google Scholar] [CrossRef]
- Wang, X.; Xiao, L.; Xie, R.; Zhang, Y. Study of NMR porosity for terrestrial formation in China. Sci. China Ser. G 2006, 49, 313–320. [Google Scholar] [CrossRef]
- Song, Y.Q.; Venkataramanan, L.; Hürlimann, M.D.; Flaum, M.; Frulla, P.; Straley, C. T1–T2 correlation spectra obtained using a fast two-dimensional Laplace inversion. J. Magn. Reson. 2002, 154, 261–268. [Google Scholar] [CrossRef] [PubMed]
- Ziarani, A.S.; Aguilera, R. Pore-throat radius and tortuosity estimation from formation resistivity data for tight-gas sandstone reservoirs. J. Appl. Geophys. 2012, 83, 65–73. [Google Scholar] [CrossRef]
- Loucks, R.G.; Reed, R.M.; Ruppel, S.C.; Hammes, U. Spectrum of pore types and networks in mudrocks and a descriptive classification for matrix-related mudrock pores. AAPG Bull. 2012, 96, 1071–1098. [Google Scholar] [CrossRef]
- Huang, W.; Lu, S.; Hersi, O.S.; Wang, M.; Deng, S.; Lu, R. Reservoir spaces in tight sandstones: Classification, fractal characters, and heterogeneity. J. Nat. Gas Sci. Eng. 2017, 46, 80–92. [Google Scholar] [CrossRef]
- Anders, M.H.; Laubach, S.E.; Scholz, C.H. Microfractures: A review. J. Struct. Geol. 2014, 69, 377–394. [Google Scholar] [CrossRef]
- Lai, J.; Wang, G.; Cai, C.; Fan, Z.; Wang, S.; Chen, J.; Luo, G. Diagenesis and reservoir quality in tight gas sandstones: the fourth member of the Upper Triassic Xujiahe Formation, Central Sichuan Basin, Southwest China. Geol. J. 2018, 53, 629–646. [Google Scholar] [CrossRef]
- Gane, P.A.; Kettle, J.P.; Matthews, G.P.; Ridgway, C.J. Void space structure of compressible polymer spheres and consolidated calcium carbonate paper-coating formulations. Ind. Eng. Chem. Res. 1996, 35, 1753–1764. [Google Scholar] [CrossRef]
- Butler, J.P.; Reeds, J.A.; Dawson, S.V. Estimating solutions of first kind integral equations with nonnegative constraints and optimal smoothing. SIAMJ Numer. Anal. 1981, 18, 381–397. [Google Scholar] [CrossRef]
- Gallegos, D.P.; Smith, D.M.A. NMR technique for the analysis of pore structure: Determination of continuous pore size distributions. J. Colloid Interface Sci. 1988, 122, 143–153. [Google Scholar] [CrossRef]
- Kleinberg, R.L.; Straley, C.; Kenyon, W.E.; Akkurt, R.; Farooqui, S.A. Nuclear magnetic resonance of rocks: T1 vs. T2. In Proceedings of the SPE Annual Technical Conference and Exhibition, Houston, TX, USA, 3–6 October 1993. [Google Scholar]
- Lyu, C.; Ning, Z.; Wang, Q.; Chen, M. Application of NMR T2 to Pore Size Distribution and Movable Fluid Distribution in Tight Sandstones. Energy Fuels 2018, 32, 1395–1405. [Google Scholar] [CrossRef]
- Gane, P.A.; Ridgway, C.J.; Lehtinen, E.; Valiullin, R.; Furo, I.; Schoelkopf, J.; Paulapuro, H.; Daicic, J. Comparison of NMR cryoporometry, mercury intrusion porosimetry, and DSC thermoporosimetry in characterizing pore size distributions of compressed finely ground calcium carbonate structures. Ind. Eng. Chem. Res. 2004, 43, 7920–7927. [Google Scholar] [CrossRef]
- Coates, G.R.; Xiao, L.; Prammer, M.G. NMR Logging: Principles and Applications; Haliburton Energy Services: Houston, TX, USA, 1999; Volume 344. [Google Scholar]
- Dékány, I.; Nagy, L.G. Immersional wetting and adsorption displacement on hydrophilic/hydrophobic surfaces. J. Colloid Interface Sci. 1991, 147, 119–128. [Google Scholar] [CrossRef]
Figure 1.
(a) Location map that shows the research area in the southwestern Ordos Basin, China (modified after Gao and Li, 2015 [13]; Cui et al., 2017 [48]) and (b) generalized stratigraphic column of the research area (modified after Lai et al., 2016 [49]).

Figure 2.
Typical pore types from Yanchang formation sandstones: (a) Plane-polarized light view of intergranular pore and presence of pore-lining chlorite; (b) SEM image of quartz prisms; (c) plane-polarized light view of intragranular dissolution pore; (d) plane-polarized light view of intergranular pore; (e) plane-polarized light view of moldic pore; (f) SEM image of pore-filling chlorite; (g) SEM image of illite; (h) SEM image of carbonate; (i) SEM image of mica; (j) plane-polarized light view of quartz overgrowth; (k) plane-polarized light view of microfracture; (l) SEM image of microfracture. IGP—intergranular pore; Ch—chlorite; QP—quartz prisms; IADP—intragranular dissolution pore; IEDP—intergranular dissolution pore; MP—moldic pore; Il—illite; Ca—carbonate; Mi—mica; QO—quartz overgrowth; MF—microfracture.

Figure 3.
Comparison of four types of PCMI results: (a) Type α; (b) type β; (c) type γ; (d) type δ. The gray boxes represent a partial percolation stage.
Figure 3.
Comparison of four types of PCMI results: (a) Type α; (b) type β; (c) type γ; (d) type δ. The gray boxes represent a partial percolation stage.

Figure 4.
TS observations (net region with red rim represent the area that mercury occupies at this stage) and multitype model (the full line represents mercury fulfilling the network, the dashed line represents a wetting phase fulfilling the network and the line thickness represent the diameters of pore throats): (a) TS observation shows intergranular pores filled with mercury at the outset; (b) start of intrusion shows intergranular pores filled with mercury on the basis of a stick model; (c) TS observation show mercury invading the dissolution pores; (d) intrusion in this step shows that dissolution pores are occupied based on the stick model; (e) TS observation reveals that all connected pore throats are filled by mercury; (f) The end of invasion based on a stick model, mercury has occupied all the pore throats; (g) TS observation show that the pores among clay aggregates are filled with mercury; (h) The end of invasion based on a tree-like model, corresponding to the intercrystalline pores that are filled with mercury; (i) TS observation depicts the beginning of mercury withdrawal, reflecting mercury leaving the smallest pores; (j) Outset of mercury extrusion based on the tree-like model, intercrystalline pores did not leave a residual phase; (k) TS observation showing that mercury remains in weakly connected pores; (l) End of withdrawal, where the mercury remains in the tiny pores that are less unconnected to the outside, on the basis of a stick model. IGP—intergranular pore; DP—dissolution pore; ICP—intercrystalline pore.

Figure 5.
PCMI-derived PSD of four types of tight sandstones. (a) type α; (b) type β; (c) type γ; (d) type δ.
Figure 5.
PCMI-derived PSD of four types of tight sandstones. (a) type α; (b) type β; (c) type γ; (d) type δ.

Figure 6.
Capillary pressure curves measured by RCMI of typical tight sandstones specimens. (a) 11#; (b) 5#; (c) 14#; (d) 12#; (e) 4#; (f) 8#. PD—pore-dominated region; HR—hybrid region; TD—throat-dominated region.
Figure 6.
Capillary pressure curves measured by RCMI of typical tight sandstones specimens. (a) 11#; (b) 5#; (c) 14#; (d) 12#; (e) 4#; (f) 8#. PD—pore-dominated region; HR—hybrid region; TD—throat-dominated region.


Figure 7.
Pore-throat size distribution by RCMI of typical tight sandstones specimens: (a) pore size distribution; (b) throat size distribution; (c) pore throat radius ratio distribution.
Figure 7.
Pore-throat size distribution by RCMI of typical tight sandstones specimens: (a) pore size distribution; (b) throat size distribution; (c) pore throat radius ratio distribution.

Figure 8.
(A,D) Reconstructed 3D CT images and volume of (B,E) resolved pore-throat space and (C,F) micro-CT derived pore radius distribution of tight sandstone specimen of 11# and 12#, respectively. The pore-throat clusters are shown in different colors.
Figure 8.
(A,D) Reconstructed 3D CT images and volume of (B,E) resolved pore-throat space and (C,F) micro-CT derived pore radius distribution of tight sandstone specimen of 11# and 12#, respectively. The pore-throat clusters are shown in different colors.

Figure 9.
NMR T1 distributions of specimens (a) before and (b) after centrifugations.

Figure 10.
NMR T2 distributions of specimens (a) before and (b) after centrifugations.

Figure 11.
Methods for determining the improved-NMR PSD by the integration of NMR and RCMI, taking B116 specimen in the research area as an example: (a) data selection; (b) relationship between T2 relaxation time and pore-throat radius.
Figure 11.
Methods for determining the improved-NMR PSD by the integration of NMR and RCMI, taking B116 specimen in the research area as an example: (a) data selection; (b) relationship between T2 relaxation time and pore-throat radius.

Figure 12.
Full-range PSD by the integration of improved-NMR PSD and PCMI: (a) sample B116; (b) the PSDs of all specimens measured in this research.
Figure 12.
Full-range PSD by the integration of improved-NMR PSD and PCMI: (a) sample B116; (b) the PSDs of all specimens measured in this research.

Figure 13.
Specimen 11# shows a method to determine T2 cutoff in 9100 r·min−1 rotation speed. IPBC—incremental porosity before centrifugation; IPAC—incremental porosity after centrifugation; CPBC—cumulative porosity before centrifugation; CPAC—cumulative porosity after centrifugation.
Figure 13.
Specimen 11# shows a method to determine T2 cutoff in 9100 r·min−1 rotation speed. IPBC—incremental porosity before centrifugation; IPAC—incremental porosity after centrifugation; CPBC—cumulative porosity before centrifugation; CPAC—cumulative porosity after centrifugation.

Figure 14.
Linear regression analysis between φ4()2 and measured permeability (a represents φ4()2). (a) 2500 r·min−1; (b) 2900 r·min−1; (c) 3500 r·min−1; (d) 5000 r·min−1; (e) 7900 r·min−1; (f) 9100 r·min−1.
Figure 14.
Linear regression analysis between φ4()2 and measured permeability (a represents φ4()2). (a) 2500 r·min−1; (b) 2900 r·min−1; (c) 3500 r·min−1; (d) 5000 r·min−1; (e) 7900 r·min−1; (f) 9100 r·min−1.

Figure 15.
The plot of movable fluid parameters versus (a) porosity and (b) permeability. MFS-movable fluid saturation; MFP-movable fluid porosity.
Figure 15.
The plot of movable fluid parameters versus (a) porosity and (b) permeability. MFS-movable fluid saturation; MFP-movable fluid porosity.

Figure 16.
Graphs illustrating the impacts of pore types, movable fluid saturation and clay mineral contents on reservoir quality. (a) reservoir quality; (b) clay minerals; (c) movable fluid saturations (MFS); (d) thin section images record the pore types.
Figure 16.
Graphs illustrating the impacts of pore types, movable fluid saturation and clay mineral contents on reservoir quality. (a) reservoir quality; (b) clay minerals; (c) movable fluid saturations (MFS); (d) thin section images record the pore types.

Figure 17.
The plot of pore radius lower limits versus (a) movable fluid saturation and (b) movable fluid porosity.
Figure 17.
The plot of pore radius lower limits versus (a) movable fluid saturation and (b) movable fluid porosity.


Table 1.
Physical properties and petrological composition of Yanchang formation tight sandstones 1.
| SN | φ, % | K, mD | Q, % | F, % | V, % | M, % | S, % | Mi, % | Ka, % | Il, % | Ch, % | Ca, % | QO, % |
|---|---|---|---|---|---|---|---|---|---|---|---|---|---|
| 1# | 9.60 | 0.59 | 44.00 | 26.00 | 3.00 | 9.00 | 6.00 | 4.00 | - | 5.00 | - | 3.00 | - |
| 2# | 10.01 | 0.76 | 48.00 | 23.00 | 3.00 | 6.00 | 1.00 | 9.00 | - | 3.00 | - | 4.00 | 3.00 |
| 3# | 10.47 | 1.56 | 21.00 | 52.00 | 3.00 | 10.00 | 3.00 | 3.00 | - | - | 7.00 | 1.00 | - |
| 4# | 7.79 | 0.21 | 44.00 | 18.00 | 3.00 | 11.00 | 6.00 | 2.00 | 2.00 | 3.00 | 1.00 | 6.00 | 4.00 |
| 5# | 7.68 | 1.41 | 32.50 | 32.00 | 2.00 | 4.50 | 3.00 | 8.00 | - | 2.00 | 2.00 | 6.00 | 2.00 |
| 6# | 8.23 | 0.18 | 22.80 | 40.00 | 2.50 | 5.20 | 5.70 | 11.50 | - | 4.50 | 5.30 | 0.50 | 2.00 |
| 7# | 7.03 | 0.11 | 48.00 | 19.00 | 4.00 | 7.00 | 9.00 | 2.00 | 1.00 | 3.00 | 1.00 | 3.00 | 3.00 |
| 8# | 5.53 | 0.02 | 48.00 | 23.00 | 3.00 | 9.00 | 4.00 | 3.00 | - | 7.00 | - | 2.00 | 1.00 |
| 9# | 8.95 | 0.12 | 21.00 | 50.00 | 3.00 | 8.00 | 6.00 | 2.00 | - | - | 8.00 | 2.00 | - |
| 10# | 12.16 | 0.32 | 47.00 | 23.00 | 3.00 | 8.00 | 4.00 | 4.00 | - | 4.00 | - | 6.00 | 1.00 |
| 11# | 14.24 | 2.70 | 40.00 | 33.00 | 8.00 | 9.00 | - | 1.00 | - | - | 7.00 | 1.00 | 1.00 |
| 12# | 12.54 | 0.48 | 25.00 | 53.00 | 2.00 | 6.00 | 3.00 | 4.00 | - | - | 6.00 | 1.50 | - |
| 13# | 5.68 | 0.05 | 46.00 | 22.00 | 3.00 | 7.00 | 4.00 | 4.00 | - | 11.00 | - | 2.00 | 1.00 |
| 14# | 10.70 | 0.96 | 36.00 | 32.00 | 11.00 | 10.00 | - | 3.00 | - | - | 6.00 | 1.00 | 1.00 |
1 SN—specimen number; φ—porosity; K—permeability; Q—quartz; F—feldspar; V—volcanic rock fragments; M—metamorphic rock fragments; S—sedimentary rock fragments; Mi—mica; Ka—kaolinite; Il—illite; Ch—chlorite; Ca—carbonate minerals; QO—quartz overgrowth.
Table 2.
The parameters for pore structure characterization from PCMI 2.
| Specimen | Pd, MPa | rmax, μm | P50, MPa | r50, μm | SHgmax, % | We, % | Sort | Type |
|---|---|---|---|---|---|---|---|---|
| 11 | 0.07 | 9.94 | 0.94 | 0.78 | 87.61 | 27.48 | 2.75 | α |
| 14 | 0.07 | 9.94 | 0.68 | 1.09 | 90.78 | 27.39 | 2.24 | α |
| 1 | 1.80 | 0.41 | 14.45 | 0.05 | 88.40 | 34.27 | 1.99 | β |
| 2 | 0.45 | 1.62 | 4.29 | 0.17 | 82.47 | 18.09 | 2.64 | β |
| 3 | 0.45 | 1.62 | 3.75 | 0.20 | 83.63 | 20.34 | 2.55 | β |
| 4 | 0.45 | 1.62 | 5.72 | 0.13 | 85.56 | 23.33 | 2.67 | β |
| 10 | 1.80 | 0.41 | 16.12 | 0.41 | 89.46 | 31.04 | 1.92 | β |
| 12 | 0.73 | 1.01 | 4.21 | 0.17 | 88.49 | 30.93 | 2.20 | β |
| 6 | 4.49 | 0.16 | 72.99 | 0.01 | 77.39 | 25.12 | 3.24 | γ |
| 7 | 1.81 | 0.41 | 7.06 | 0.10 | 87.57 | 30.08 | 1.88 | γ |
| 9 | 1.16 | 0.63 | 10.88 | 0.07 | 79.65 | 23.41 | 2.94 | γ |
| 5 | 7.39 | 0.10 | 97.00 | 0.01 | 66.49 | 20.08 | 4.31 | δ |
| 8 | 1.81 | 0.41 | 7.22 | 0.10 | 83.85 | 19.44 | 2.39 | δ |
| 13 | 1.81 | 0.41 | 50.18 | 0.01 | 57.03 | 27.55 | 4.45 | δ |
2 Pd—threshold pressure; rmax—maximum pore radius; P50—median pressure; r50—median pore radius; SHgmax—maximum mercury intrusion saturation; We—efficiency of mercury withdrawal; Sort—sorting coefficient.
Table 3.
The parameters for pore structure characterization from RCMI. 3
| SN | Pd, MPa | rmax, μm | P50, MPa | r50, μm | rt, μm | rp, μm | η | rm, μm | δ | SHgmax, % | Sp, % | St, % | Group |
|---|---|---|---|---|---|---|---|---|---|---|---|---|---|
| 11 | 0.02 | 33.43 | 2.17 | 0.36 | 1.28 | 177.25 | 264.05 | 1.96 | 0.58 | 63.66 | 42.31 | 21.35 | I |
| 5 | 0.30 | 2.50 | 0.32 | 2.29 | 1.16 | 110.89 | 209.80 | 1.72 | 0.57 | 39.78 | 8.01 | 31.77 | - |
| 14 | 0.22 | 3.28 | 1.86 | 0.41 | 1.53 | 163.42 | 140.71 | 2.05 | 0.46 | 67.41 | 32.63 | 34.85 | I |
| 12 | 0.07 | 9.87 | 1.97 | 0.39 | 0.99 | 131.51 | 185.06 | 1.30 | 0.49 | 66.01 | 41.55 | 24.49 | I |
| 4 | 0.65 | 1.13 | - | - | 0.78 | 135.20 | 236.89 | 0.93 | 0.37 | 33.75 | 4.38 | 29.36 | II |
| 8 | 1.01 | 0.72 | - | - | 0.60 | 116.05 | 203.70 | 0.64 | 0.19 | 21.01 | 2.50 | 18.51 | II |
3 Pd—threshold pressure; rmax—maximum pore radius; P50—median pressure; r50—median pore radius; rt—average throat radius; rp—average pore radius; η—pore throat radius ratio; rm—mainstream throat radius; δ—sorting coefficient; St—throat maximum mercury intrusion saturation; Sp—pore maximum mercury intrusion saturation; SHgmax—total maximum mercury intrusion saturation.
Table 4.
The parameters for movable fluid parameters from NMR. 4
| SN | T2, ms | Sm, % | Sp, % | Pore Radius Lower Limits in Different Rotation Speed, μm | |||||
|---|---|---|---|---|---|---|---|---|---|
| 2500 r·min−1 | 2900 r·min−1 | 3500 r·min−1 | 5000 r·min−1 | 7900 r·min−1 | 9100 r·min−1 | ||||
| 11 | 6.83 | 52.12 | 7.42 | 1.17 | 0.83 | 0.55 | 0.39 | 0.24 | 0.14 |
| 5 | 0.74 | 69.75 | 3.96 | 1.35 | 0.67 | 0.34 | 0.15 | 0.04 | 0.01 |
| 14 | 0.42 | 64.24 | 6.87 | 0.19 | 0.10 | 0.03 | 0.02 | 0.01 | 0.01 |
| 12 | 7.32 | 40.93 | 5.13 | 1.91 | 1.17 | 0.83 | 0.44 | 0.26 | 0.15 |
| 4 | 13.67 | 18.61 | 1.45 | 1.10 | 0.59 | 0.39 | 0.36 | 0.27 | 0.15 |
| 8 | 1.96 | 10.53 | 0.58 | 0.44 | 0.26 | 0.22 | 0.19 | 0.16 | 0.04 |
4 T2-T2 relaxation time; Sm—movable fluid saturation; Sp—movable fluid percentage.
© 2019 by the authors. Licensee MDPI, Basel, Switzerland. This article is an open access article distributed under the terms and conditions of the Creative Commons Attribution (CC BY) license (http://creativecommons.org/licenses/by/4.0/).
Share and Cite
MDPI and ACS Style
Liu, D.; Sun, W.; Ren, D. Experimental Investigation of Pore Structure and Movable Fluid Traits in Tight Sandstone. Processes 2019, 7, 149. https://doi.org/10.3390/pr7030149
AMA Style
Liu D, Sun W, Ren D. Experimental Investigation of Pore Structure and Movable Fluid Traits in Tight Sandstone. Processes. 2019; 7(3):149. https://doi.org/10.3390/pr7030149
Chicago/Turabian StyleLiu, Dengke, Wei Sun, and Dazhong Ren. 2019. "Experimental Investigation of Pore Structure and Movable Fluid Traits in Tight Sandstone" Processes 7, no. 3: 149. https://doi.org/10.3390/pr7030149
Note that from the first issue of 2016, this journal uses article numbers instead of page numbers. See further details here.