Extended Utilization of Constraint-Based Metabolic Model in a Long-Growing Crop


1
Biotechnology Program, School of Bioresources and Technology, King Mongkut’s University of Technology Thonburi (Bang Khun Thian), Bangkok 10150, Thailand
2
Systems Biology and Bioinformatics Research Group, Pilot Plant Development and Training Institute, King Mongkut’s University of Technology Thonburi (Bang Khun Thian), Bangkok 10150, Thailand
3
Bioinformatics and Systems Biology Program, School of Bioresources and Technology, King Mongkut’s University of Technology Thonburi (Bang Khun Thian), Bangkok 10150, Thailand
*
Authors to whom correspondence should be addressed.
Processes 2019, 7(5), 259; https://doi.org/10.3390/pr7050259
Submission received: 8 March 2019
/
Revised: 22 April 2019
/
Accepted: 2 May 2019
/
Published: 4 May 2019
(This article belongs to the Special Issue In silico metabolic modeling and engineering)
Abstract
:The constraint-based rMeCBM-KU50 model of cassava storage root growth was analyzed to evaluate its sensitivity, with respect to reaction flux distribution and storage root growth rate, to changes in model inputted data and constraints, including sucrose uptake rate-related data—photosynthetic rate, total leaf area, total photosynthetic rate, storage root dry weight, and biomass function-related data. These mainly varied within ±90% of the model default values, although exceptions were made for the carbohydrate (−90% to 8%) and starch (−90% to 9%) contents. The results indicated that the predicted storage root growth rate was highly affected by specific sucrose uptake rates through the total photosynthetic rate and storage root dry weight variations; whereas the carbon flux distribution, direction and partitioning inclusive, was more sensitive to the variation in biomass content, particularly the carbohydrate content. This study showed that the specific sucrose uptake rate based on the total photosynthetic rate, storage root dry weight, and carbohydrate content were critical to the constraint-based metabolic modeling and deepened our understanding of the input–output relationship—specifically regarding the rMeCBM-KU50 model—providing a valuable platform for the modeling of plant metabolic systems, especially long-growing crops.
1. Introduction
The complexity of plant metabolism hinders experimental studies to unravel the fate of metabolic substrates derivation for biomass production, and it is even harder to unwind the underlying regulations. As multicellular organisms, plants are composed of cells with several subcellular compartments, defined as organelles; as a result, metabolic processes are fragmented into parts that are exposed to heterogeneous surrounding environments [1]. A constraint-based modeling (CBM) approach with flux balance analysis (FBA) was employed to deepen the understanding of plant metabolism through simulation. The CBM approach enables the study of biological systems and characterization of metabolic network behavior by flux analysis under steady-state assumptions, integrating biochemical, genetic, and genomic information [2]. Constraints and the biomass objective function, which are the heart of the CBM approach for identifying biologically relevant flux solutions, were established based on organism-specific and/or condition-specific experimental measurements [3,4,5,6,7]. In case of lacking particular information, the constraints and biomass compositions were usually deduced from data closely related to the supposed values in the studied organism [8,9]. The CBM approach has been hugely successful in the study of microorganisms including bacteria, yeast, and mold [10,11,12,13,14,15,16,17]. The genome-scale CBM of Arabidopsis [18], the first for plants, was introduced to simulate the simplified central metabolism of Arabidopsis to produce cellular biomass. Later, the compartmentalized Arabidopsis model, AraGEM, was proposed to provide a more realistic simulation of the metabolism, and it was able to predict the classical photorespiratory cycle and to differentiate metabolic fluxes between redox metabolism in photosynthetic and non-photosynthetic plant cells [19]. Ever since, CBM has been used to study biomass yield under varying environmental pressure (i.e., photosynthesis, photorespiration, and respiration conditions), in Zea mays [20], to elucidate the metabolism underlying seed growth toward oil accumulation in rapeseed (Brassica napus) [21], and to simulate the response of central metabolism of rice seedlings under flooding and drought stresses [3].
Notwithstanding the advantages of the CBM approach, collection of experimental measurements—such as [14C] sucrose-labeling for the determination of sucrose uptake rate [22], cell suspension or plant cultivation for measuring carbon uptake, biomass compositions, and plant growth rates [3,4,5,6,7,18]—required for the construction of a robust model that well-represents cellular complexity can be time-consuming and tedious. In addition, there are up to 94 steps between model conceptualization and drafting and its completion, some of which include iterative manual curation, mathematical conversion, and programming [23,24]. There are also the challenges of poor annotation of plant genome, incomplete biochemical reactions to describe the entire metabolism, the lack of background knowledge to address the precise constraints [25], difficulties with quantifying the cell maintenance costs [26], and limited information to develop fully-represented biomass reactions [9,25,27], along with the issue of metabolite transportation between cellular compartments [24]. To minimize the time and efforts for model development, the influences of the experimental measurements and constraints on CBM prediction were studied, as recent findings have indicated that only some of them—which were mainly related to substrate uptake rate, biomass function, and growth rate—impacted the prediction considerably [26,28,29,30,31,32]. For example, the lipid content of the biomass had an immense effect on the predicted carbon flux distribution in rapeseed (Brassica napus) [28], whereas, cellular maintenance costs showed a greater influence on the flux prediction than biomass compositions during the growth of Escherichia coli under aerobic glucose-limited conditions [29]. The study in the Arabidopsis model showed that the predicted flux distribution in central metabolism was sensitive to ATP and reductant costs of cell maintenance [26], but not related to biomass compositions [30].
Cassava is very rich in carbohydrate [33] and research has sought to increase its storage root yield. Carbon metabolism in cassava in poorly understood in comparison with other major staple crops such as rice. The long growing cycle of 9–24 months possesses a major challenge [34], hampering both experimental work and modeling studies. The first CBM of cassava storage roots, rMeCBM-KU50 [4], published this year, took at least 3–4 years to completion for all data on plant growth, sucrose uptake rate, and cellular biomass compositions to be generated. The rMeCBM-KU50 model was used to study carbon assimilation during starch filling in the storage roots. Accordingly, we herein present an approach to enhance the utilization of the available CBM model of cassava storage roots, rMeCBM-KU50, for more extensive applications based on the model assessment. First, the sensitivity of metabolic flux prediction to model inputted data (experimental measurements and constraints) in the rMeCBM-KU50 model was studied. The observed values were (i) substrate–uptake related (sucrose uptake)—i.e., photosynthetic rate, total leaf area, storage root dry weight, and total photosynthetic rate—and (ii) biomass function-related. The results indicated that changes in the specific sucrose uptake rate due to variation in the measured physiological characteristics of plants significantly impacted the simulated growth rate of cassava storage roots, but had relatively little effect on carbon flux prediction. In contrast, biomass compositions, especially carbohydrate content, greatly affected simulated metabolic flux distribution. The rationale is not only limited to the demonstrated model, but is also applicable to a broad range of models available in the literature. This study provides a platform for the development of plant metabolic models and deepens our understanding of flux partitioning and its sensitivity to model data, demonstrating that the latter could be exploited to shorten the model construction process.
2. Materials and Methods
2.1. The rMeCBM-KU50 Model
The rMeCBM-KU50 model is a constraint-based metabolic model of carbon assimilation in cassava storage roots. It was originally developed to simulate metabolism during starch accumulation in the storage roots of Kasetsart 50 (KU50), a high starch-yielding cultivar that is widely grown in Southeast Asia [4]. The rMeCBM-KU50 model is composed of 468 reactions related to 393 metabolites, which are partitioned into 3 subcellular compartments, i.e., the cytosol, mitochondria, and plastid. The details of the rMeCBM-KU50 model (i.e., reactions, metabolites, and biomass function) can be found in the supplementary information of the study by Chiewchankaset et al. [4]. The rMeCBM-KU50 model successfully mimicked the measured storage root growth rate of KU50 cultivar, using the pre-determined specific sucrose uptake rate of 0.0548 mmolsucrose gDW−1SRs day−1, calculated based on the photosynthetic capacity (Equation (1)), and biomass components (92.07% carbohydrates, 5.78% proteins, 1.69% fibers, and 0.45% lipid, on dry weight basis). The optimal growth-associated ATP maintenance (SGAM) of the rMeCBM-KU50 model was 9.8 mmolATP gDW−1SRs [4].
PN is photosynthetic rate (µmolCO2 m−2 s−1), LA is total leaf area per plant (m2), SRDW is the dry weight of cassava storage roots (g), F (= 0.37) is a faction of photosynthetic sucrose translocated to the root of the cassava—estimated based upon the proportion of sucrose to the total soluble carbohydrates in shoot and root parts on the dry weight basis [4]—and 7.2 is the constant value for unit conversion.
2.2. Model Sensitivity Analysis
The sensitivity of the inputted data for the rMeCBM-KU50 model was investigated through a simple perturbation and response method, similarly to other various model analysis studies, including constraint-based metabolic models [26,28,29,30,31,32]. The individual inputted data were systematically varied throughout their range of feasible values, while observing the alteration of the simulation from the default prediction. The impacts of the experimental measurements and constraints on the model simulation were assessed based upon the simulated storage root growth rates and the predicted carbon fluxes, as demonstrated in Figure 1. Two groups of model data were investigated, consisting of (i) substrate–uptake related data (the specific sucrose uptake rate, photosynthetic rate, total leaf area, storage root dry weight, and total photosynthetic rate), and (ii) biomass function-related data (the composition of biomass components), as shown in Figure 1a,b, respectively. The values of these model data were thoroughly varied within ±90% the range of the original values [4], to cover a full range excluding carbohydrate and starch contents. The carbohydrate and starch contents, respectively, were varied in the ranges of −90% to 8% and −90% to 9% to ensure positive values (see details in Supplementary Materials File S1).
For each group of data, the sensitivity on model prediction was assessed based upon the simulated storage root growth rate (Figure 1, left panel) and the predicted metabolic fluxes (Figure 1, right panel). The sensitivity of the simulated growth rate (Figure 1, left panel) was determined by the percentage of changes, as shown in Equation (2).
where ε is the percentage of changes of the simulated specific storage root growth rate (vv) from the default prediction (vo).
The sensitivity of the predicted metabolic fluxes (Figure 1, right panel) was evaluated both upon the changes in direction of individual flux, and upon flux partitioning at each metabolic branch point where a metabolite was converted into a product by multiple reactions (production and consumption reaction fluxes) [35]. The percentage of production and consumption reaction flux partitioning was calculated and, respectively, denoted as positive and negative signs in this study. The details of the metabolic branch points of the rMeCBM-KU50 model are provided in the Supplementary Materials (File S2). The percentage of data variation, where the direction and/or partitioning of each predicted reaction flux began to deviate from the original prediction, was denoted here as a breakpoint. All simulations were performed using the COBRA Toolbox 2.0.5 [36] in MATLAB (The MathWorks, Inc., version R2015a, Natick, MA, USA).
3. Results
The sensitivity of a prediction to variances in model input data determines the capability of the model to simulate real systems. Hence, the quality of the experimental measurements and constraints used for the prediction is critical to the reliability of the predictions. Accordingly, the rMeCBM-KU50 model was evaluated according to the sensitivity of predicted results, based upon (i) substrate–uptake related data (i.e., the specific sucrose uptake rate, photosynthetic rate, total leaf area, storage root dry weight, and total photosynthetic rate), and (ii) biomass function-related data (i.e., the compositional ratios of biomass components). The values for the observed input data were systematically varied within a ±90% range of default experimentally determined optimal values for cassava storage root growth [4] to ascertain the model sensitivity, considering values that have been reported for cassava [37,38,39,40,41,42,43,44].
3.1. The Impacts of Substrate–Uptake Related Data on Model Prediction
The rMeCBM-KU50 model primarily utilizes sucrose as the main carbon substrate to simulate the growth of cassava storage roots. The specific sucrose uptake rate employed in the model was calculated from experimentally determined data on the photosynthetic rate, total leaf area, and storage root dry weight of cassava. Details of the range of values used for the sensitivity analysis, with respect to sucrose uptake related data, are shown in Table 1.
Results for specific sucrose uptake rates are shown in Figure 2. The photosynthetic rate, total leaf area, and total photosynthetic rate were positively related to the specific sucrose uptake rates, in contrast to storage root dry weight (Figure 2a). The specific sucrose uptake rate was mostly affected by the storage root dry weight—changing by approximately +850% and −50% of the original value at SRDW of −90% and +90%, respectively—followed by the total photosynthetic rate (Figure 2b). The photosynthetic rate and total leaf area both showed little effects.
The sensitivity of the model—regarding the specific storage root growth rate prediction, to specific sucrose uptake rate—was analyzed based on changes to the photosynthetic rate, total leaf area, total photosynthetic rate, and storage root dry weight (Figure 3). The experimentally derived values used as the baseline for evaluating the sensitivity of the model are marked as red crosses, and the gray areas on the left panel represent the range of possible values, based on the literature. The results showed a linear, positive response between the predicted specific storage root growth rate and the specific sucrose uptake rate—in relation to variations in photosynthetic rate, total leaf area, and total photosynthetic rate—but that for storage root dry weight was nonlinear (Figure 3a–d). Moreover, it was found that the sensitivity of the predicted growth rate to specific sucrose uptake rate in relation to variations in total photosynthetic rate was multiplicative to the effect of the individual dependent factors (i.e., the variations in photosynthetic rate and total leaf area). The percent error of predicting the specific storage root growth rate from the specific sucrose uptake rate by varying the photosynthetic rate and total leaf area to within ±90% of the original values ranged from +90% to −88.89%, while that for total photosynthetic rate ranged from +260% to −97.78%, and storage root dry weight ranged from −46.67% to +880% (Figure A1a in Appendix A). Thus, the storage root dry weight and total photosynthetic rate were considered important data for determining the specific storage root growth rate.
The sensitivity study covered the entire range of expected values in cassava. The photosynthetic rate was varied from 13 to 35 µmolCO2 m−2 s−1 to represent values that have been reported under different growth and environmental conditions. Cassava photosynthetic rates of 13–24 µmolCO2 m−2 s−1 and 20–35 µmolCO2 m−2 s−1 are typical under greenhouse or growth chamber conditions [39,40] and field conditions [41], respectively. The total leaf area of cassava is around 1.24–3.38 m2 depending on variety, shade level, water availability, temperature, and plant age [38,42]. The average storage root dry weight of cassava, based on over 100 cultivars, under rain-fed field conditions, ranges from 0.01 to 1.40 kg plant−1 [43]. This range supported the representativeness of the rMeCBM-KU50 model for mimicking the metabolism of cassava storage roots, as derived by proper model data (marked as red crosses in Figure 3).
To analyze the sensitivity of carbon flux distribution to changes in the specific sucrose uptake rate, the direction and partitioning of the carbon flux were examined. Details of the flux direction and partitioning are provided in Figure A2, Figure A3, Figure A4 and Figure A5 and Figure A6, Figure A7 and Figure A8 in Appendix A, respectively (see the details in Supplementary Materials File S3–S4). The flux direction was identical for all the model variables analyzed, as indicated by the blue-colored active fluxes with unchanged direction. Also, analysis of the flux partitioning revealed the variable data considered were largely comparable, except for the total photosynthetic rate from −60% variation downward, when the flux partitioning became different from the original value (corresponding to a decrease in the specific sucrose uptake rate of 84%), herein referred to as the breakpoint (Figure 2b and Figure A6 in Appendix A). These results indicated that the carbon flux prediction was relatively robust to changes in the specific sucrose uptake rate.
3.2. The Impacts of Biomass Function-Related Data on Model Prediction
The biomass function is typically integrated into the model as an objective function, which is used to draw resources from the metabolic network and define cellular components along with their functions [27]. The default biomass function in the rMeCBM-KU50 model was retrieved from literature and consisted of carbohydrates, proteins, fibers, and lipids. Cassava comprises mainly of starch, which could account for up to 90% of the storage root dry weight, depending on variety, growth condition, and age [45]. Therefore, we sought to determine if the starch content could solely be used to define the biomass characteristics of the cassava storage root model. The sensitivity of the model prediction was analyzed by varying the total carbohydrate, starch, protein, fiber, and lipid compositions (Table 2).
The prediction of the specific storage root growth rate was examined against the variation of biomass components represented in Figure 4. The default storage root growth rate in the rMeCBM-KU50 model, marked as red crosses, were used as the baseline for sensitivity analysis. The results showed that the predicted storage root growth rate was more robust to changes in biomass components (Figure 4a–e) with a percent error of 18.89% (Figure A1b in Appendix A), in comparison to that of specific sucrose uptake rate (800%; Figure A1a in Appendix A). The predicted storage root growth rate increased as the carbohydrate and starch contents were increased, relative to the default values (Figure 4a,d), but decreased as the protein content was increased (Figure 4c). Variations in the lipid and fiber contents resulted in a minimal response (Figure 4b,e).
In contrast to the growth rate, the simulated carbon flux distribution was sensitive to the composition of biomass components. The biomass components-related variation in flux distribution could be inferred from the positions of their breakpoints (red circles in Figure 4) relative to the default values. The flux distribution was greatly influenced by the carbohydrate content with a decrease of 1% and an increase of 4%, relative to the default value, resulting in changes in flux distribution. The protein, fiber, lipid, and starch contents had less effect on the predicted fluxes, retaining similar predictions as the original values until a breakpoint of around −50%.
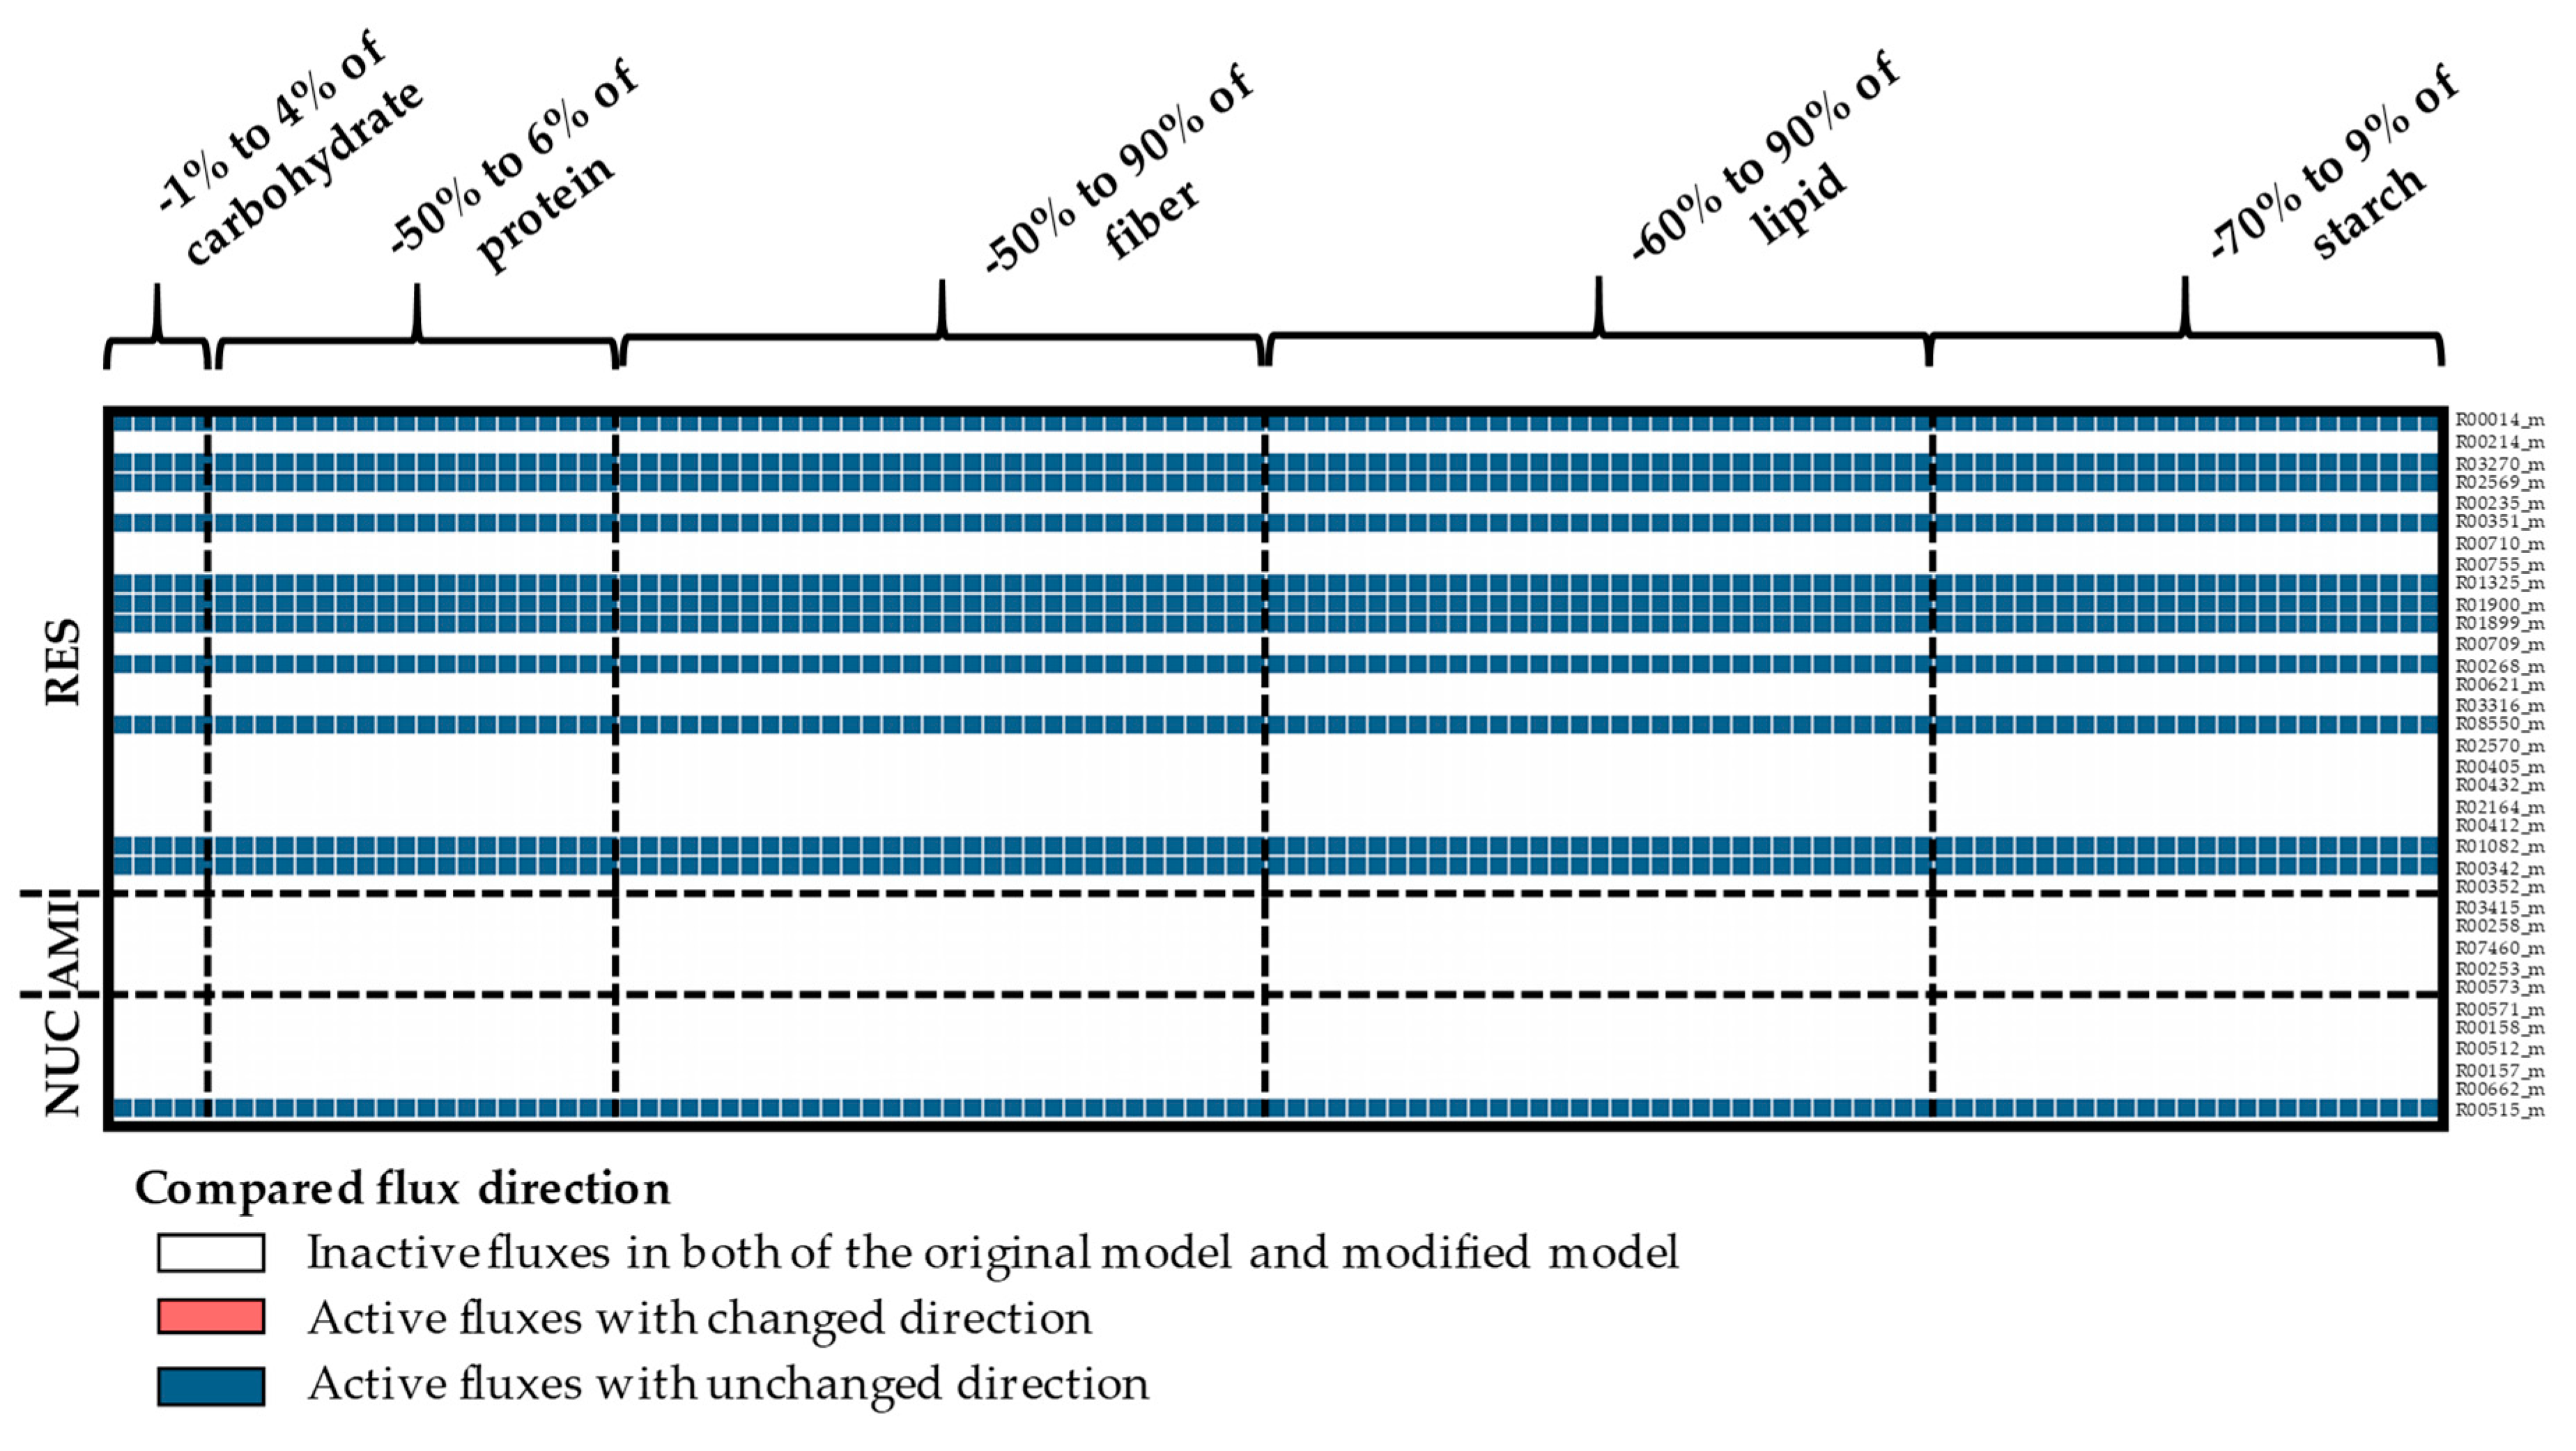
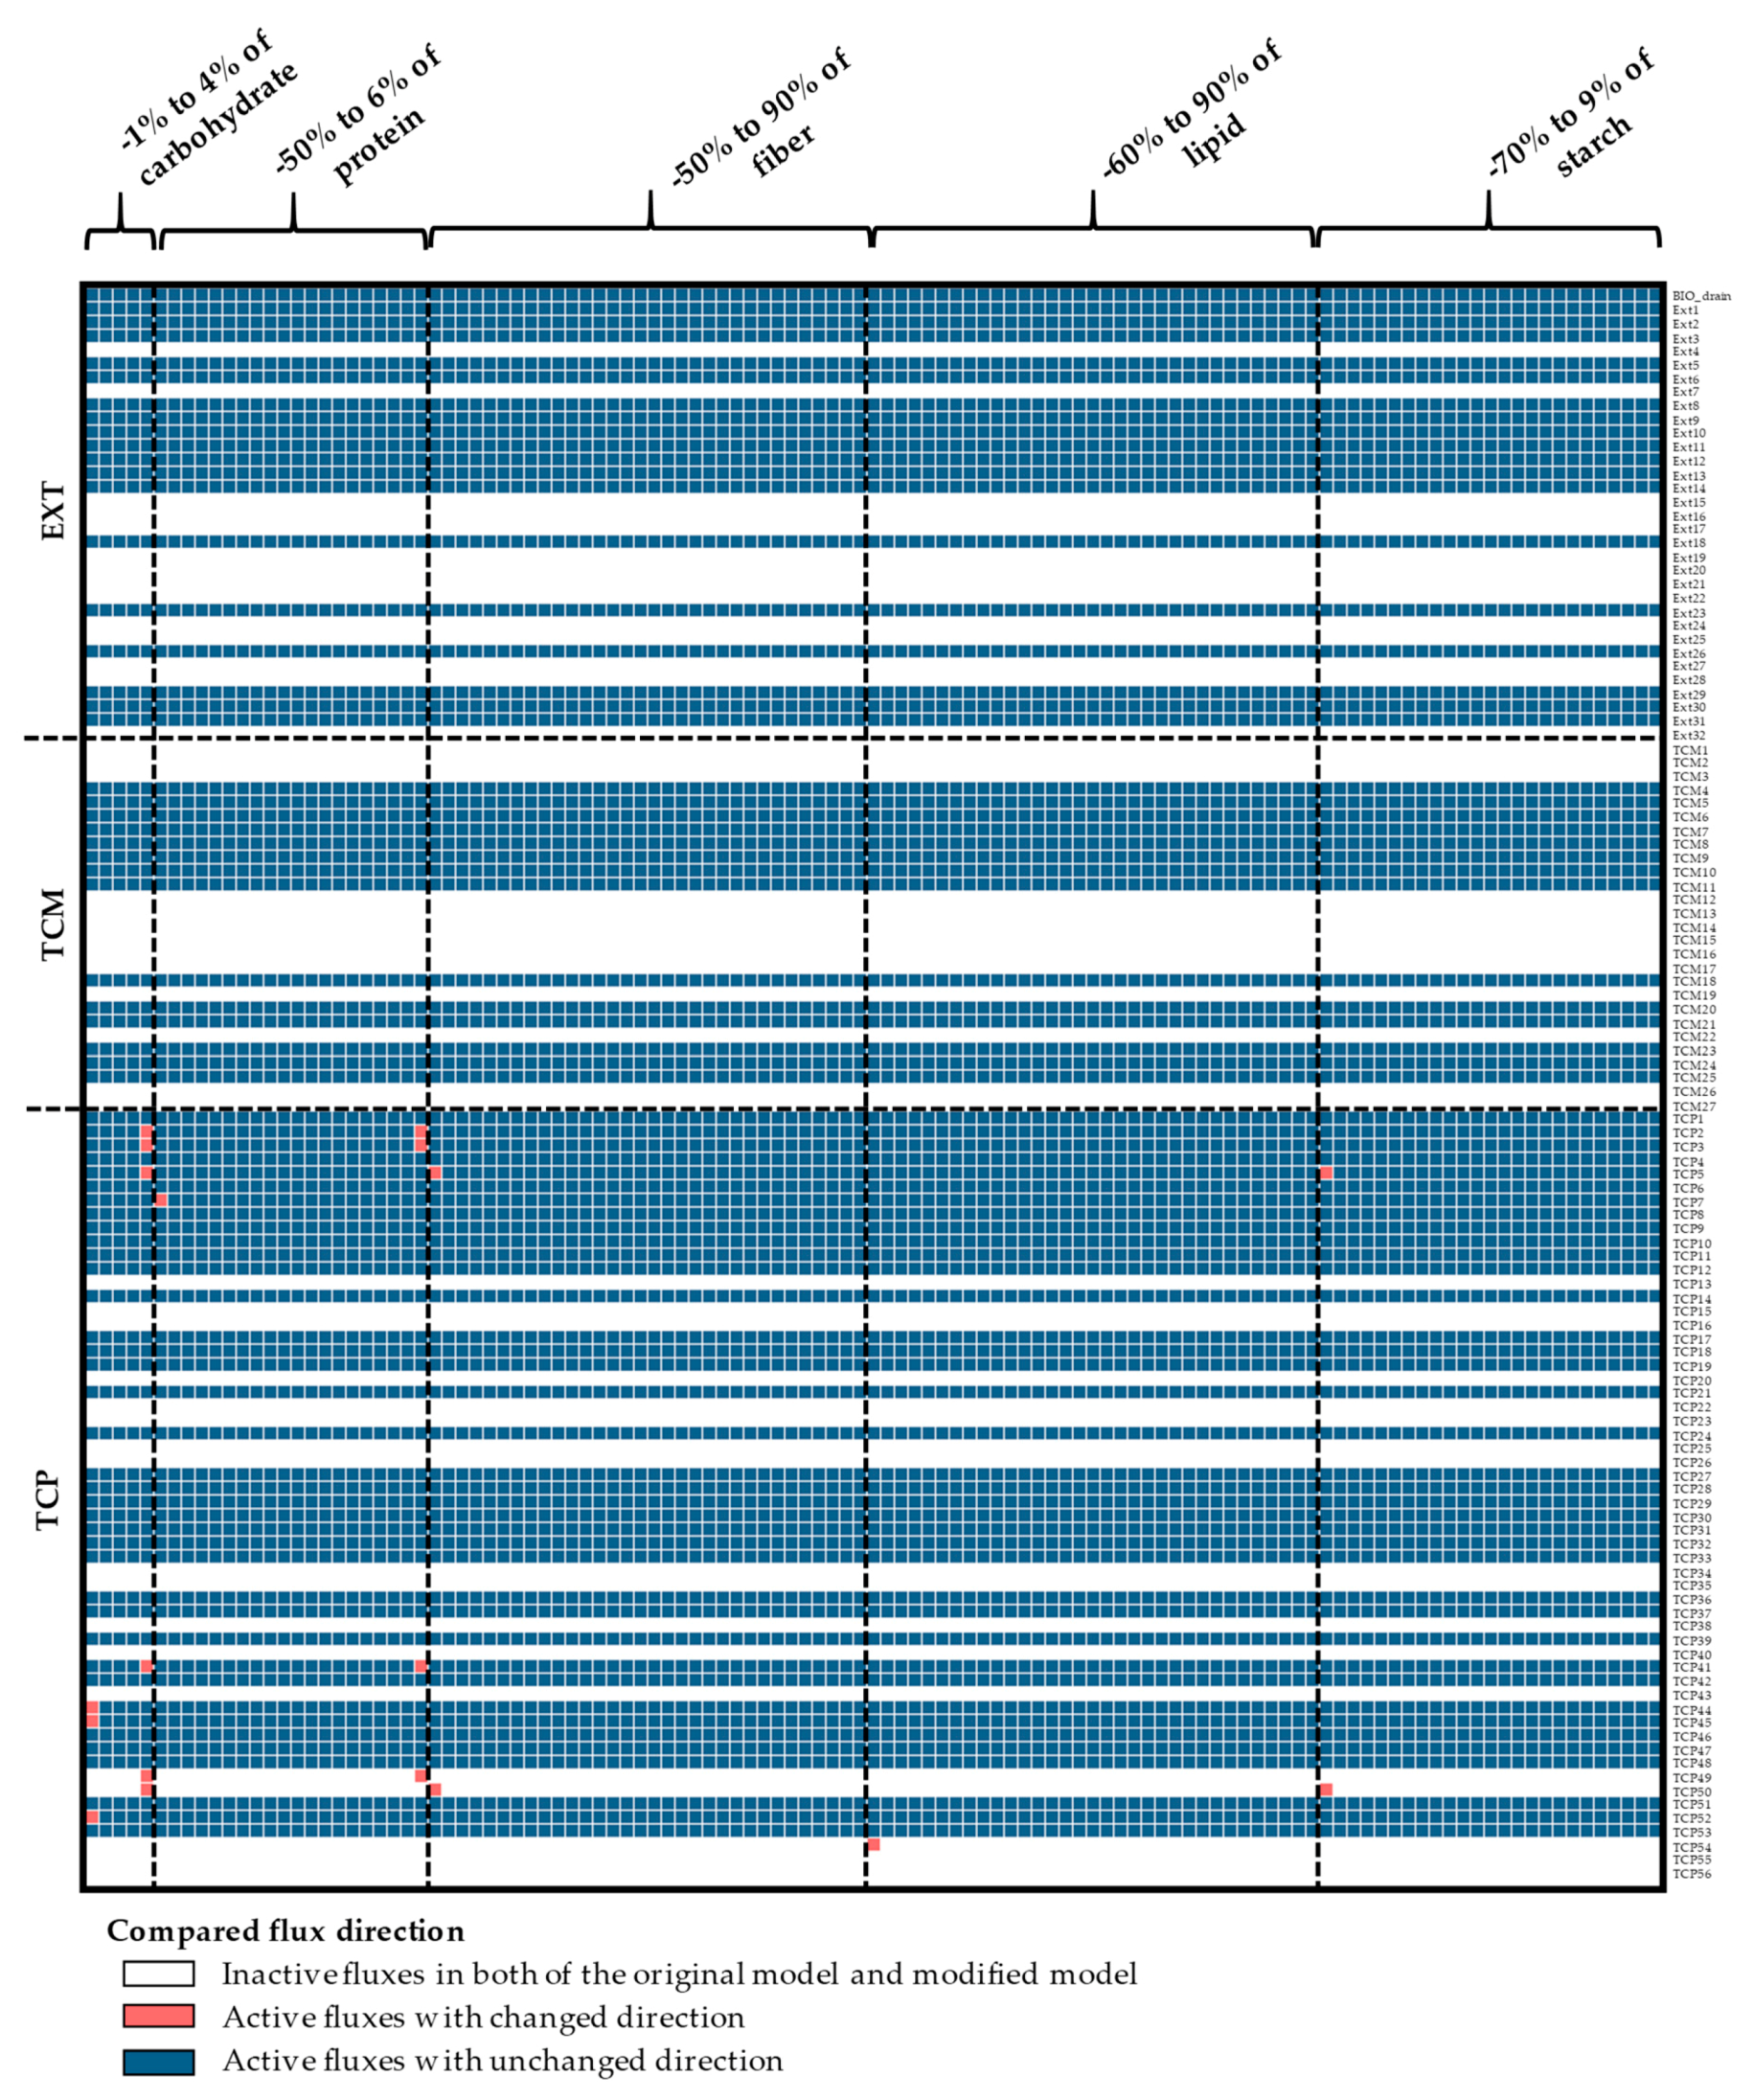
In addition, the impact of the biomass was studied, based on the direction of the individual reaction fluxes and the partitioning of each metabolic branch point. The results suggested that the direction of predicted fluxes was highly associated with the composition of biomass (Figure A9, Figure A10, Figure A11 and Figure A12 in Appendix A and Supplementary Materials File S5). The variations in the direction of metabolic fluxes and breakpoints, due to changes in the biomass content, are shown in Figure 5. Each breakpoint contained at least one reaction flux exhibiting a directional change relative to the default value, highlighted in red. The differences in flux direction were found in similar reactions (red-colored areas in the black-dashed rectangle; Figure 5) within the starch and sucrose biosynthesis pathway, pentose phosphate pathway, and respiration pathway in cytosol and plastid, and amino acid biosynthesis pathway in the cytosol.
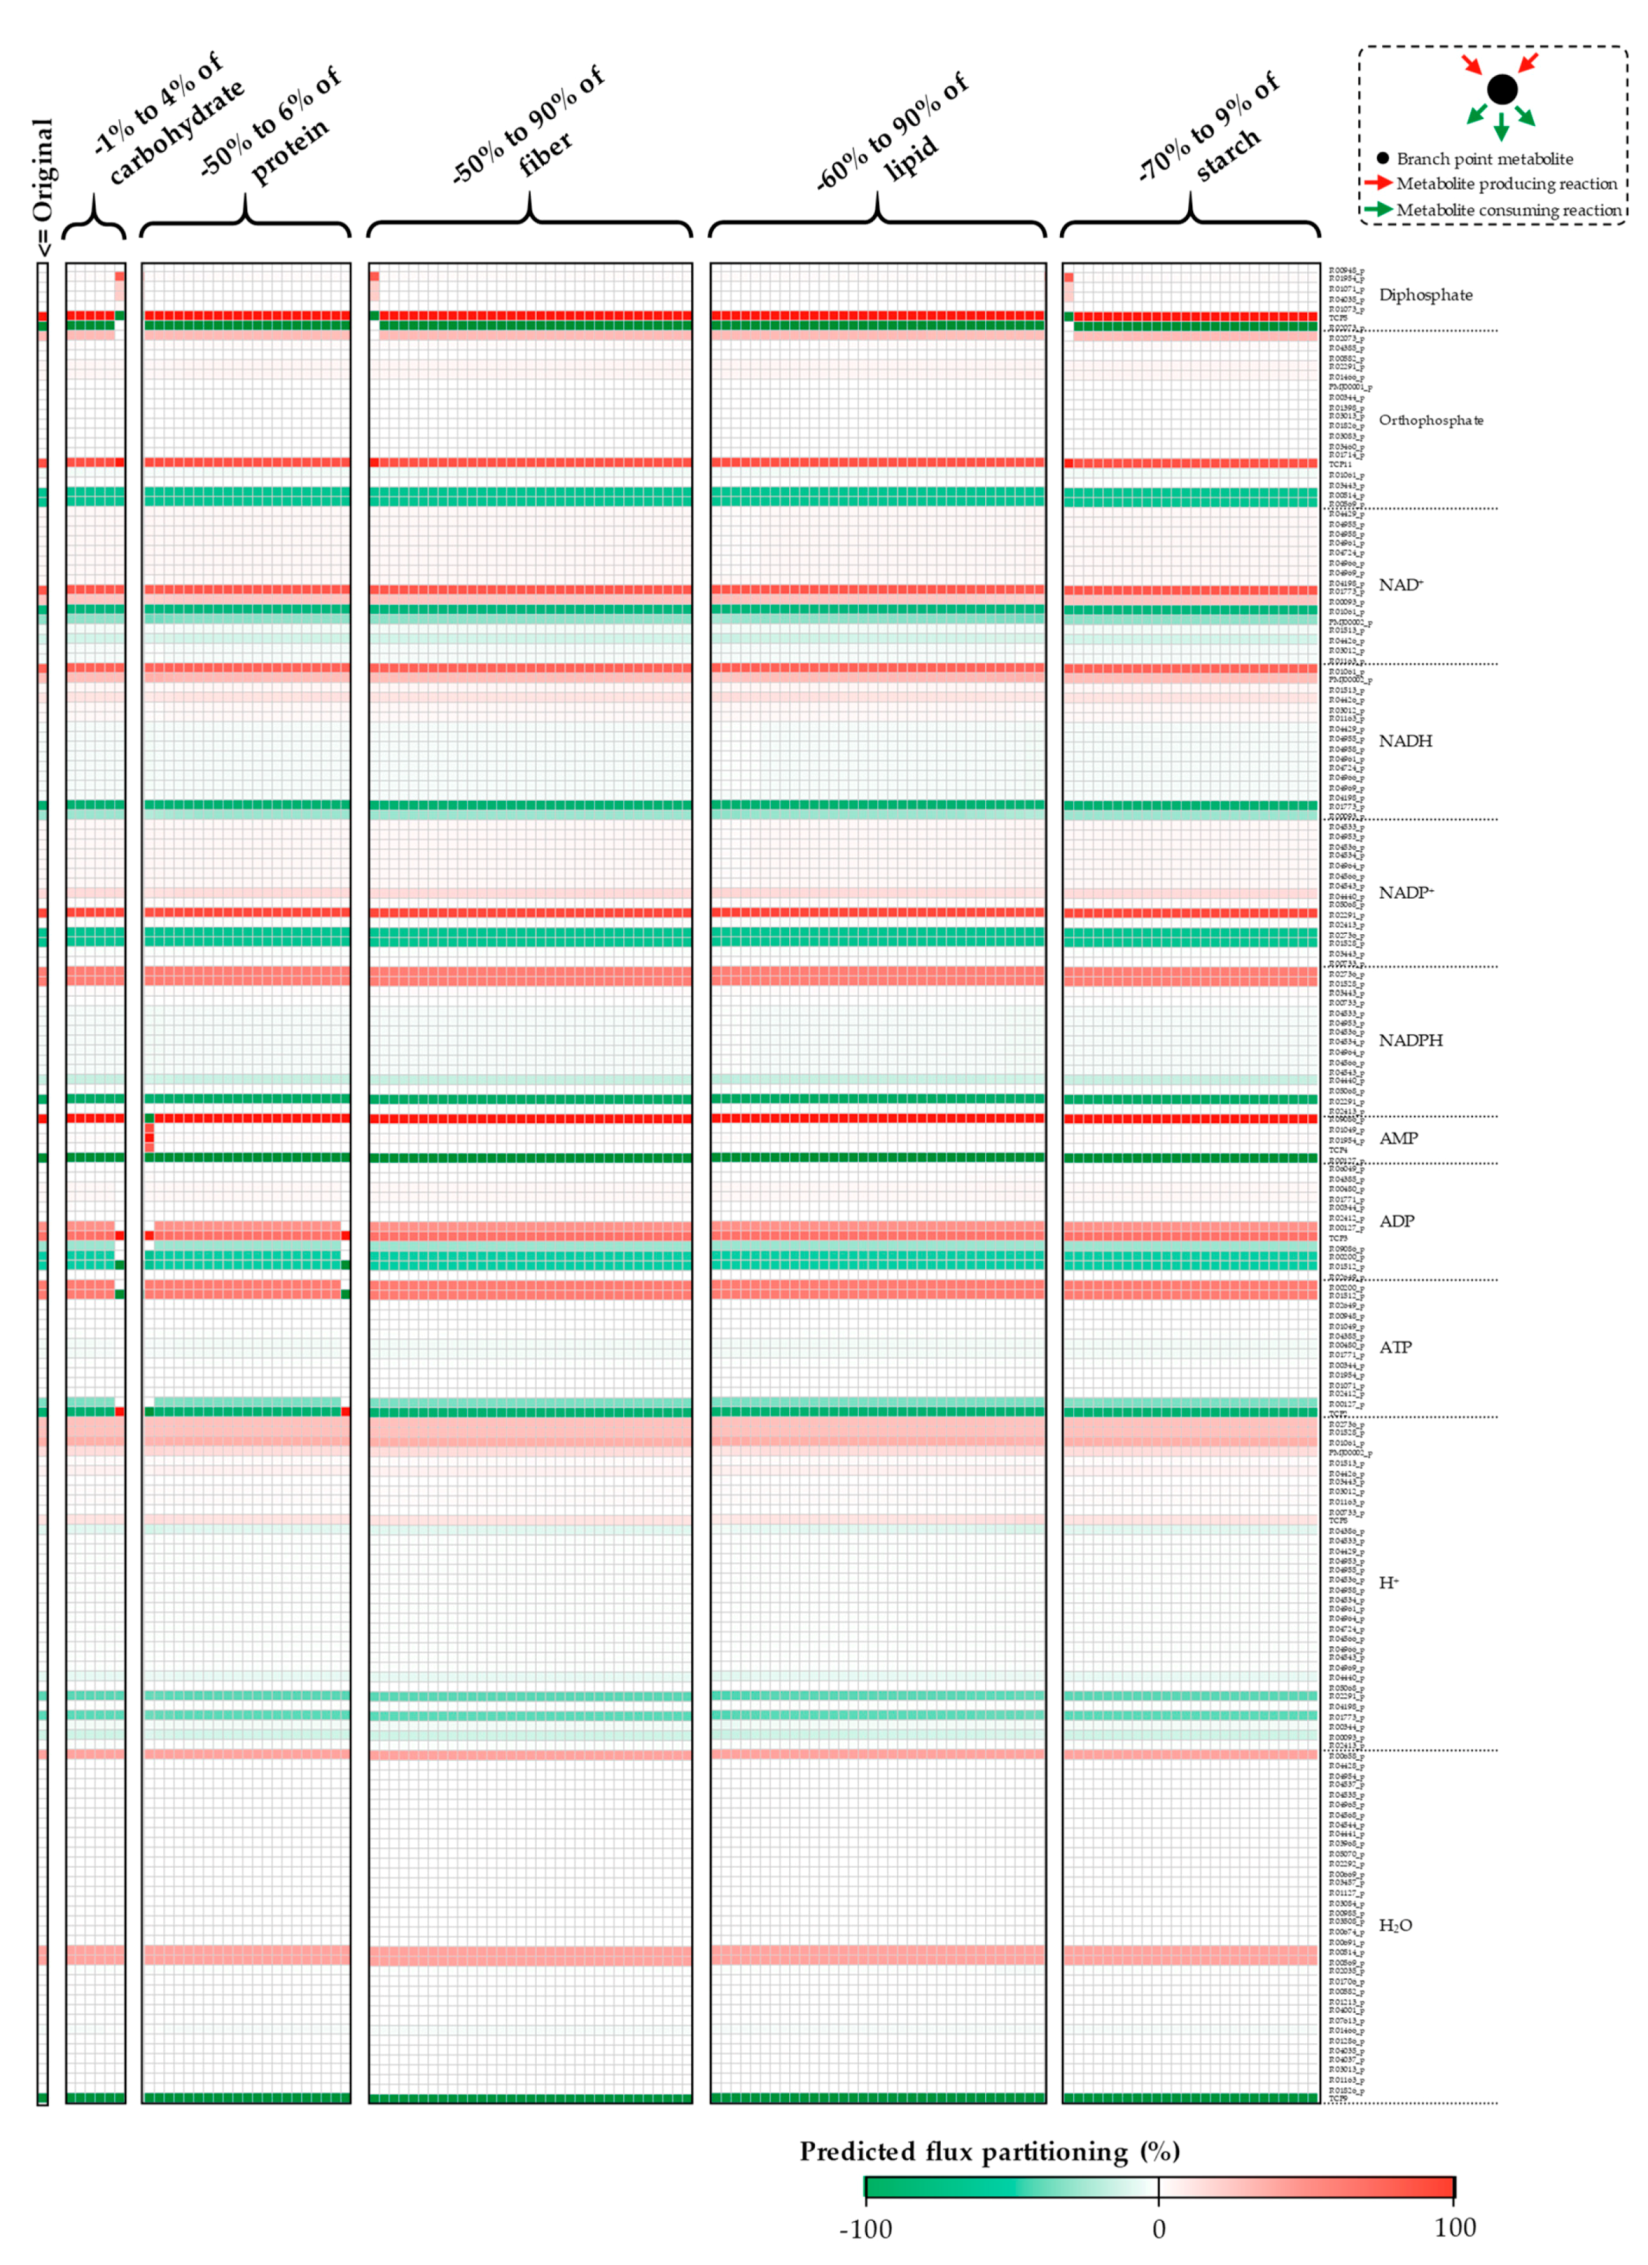
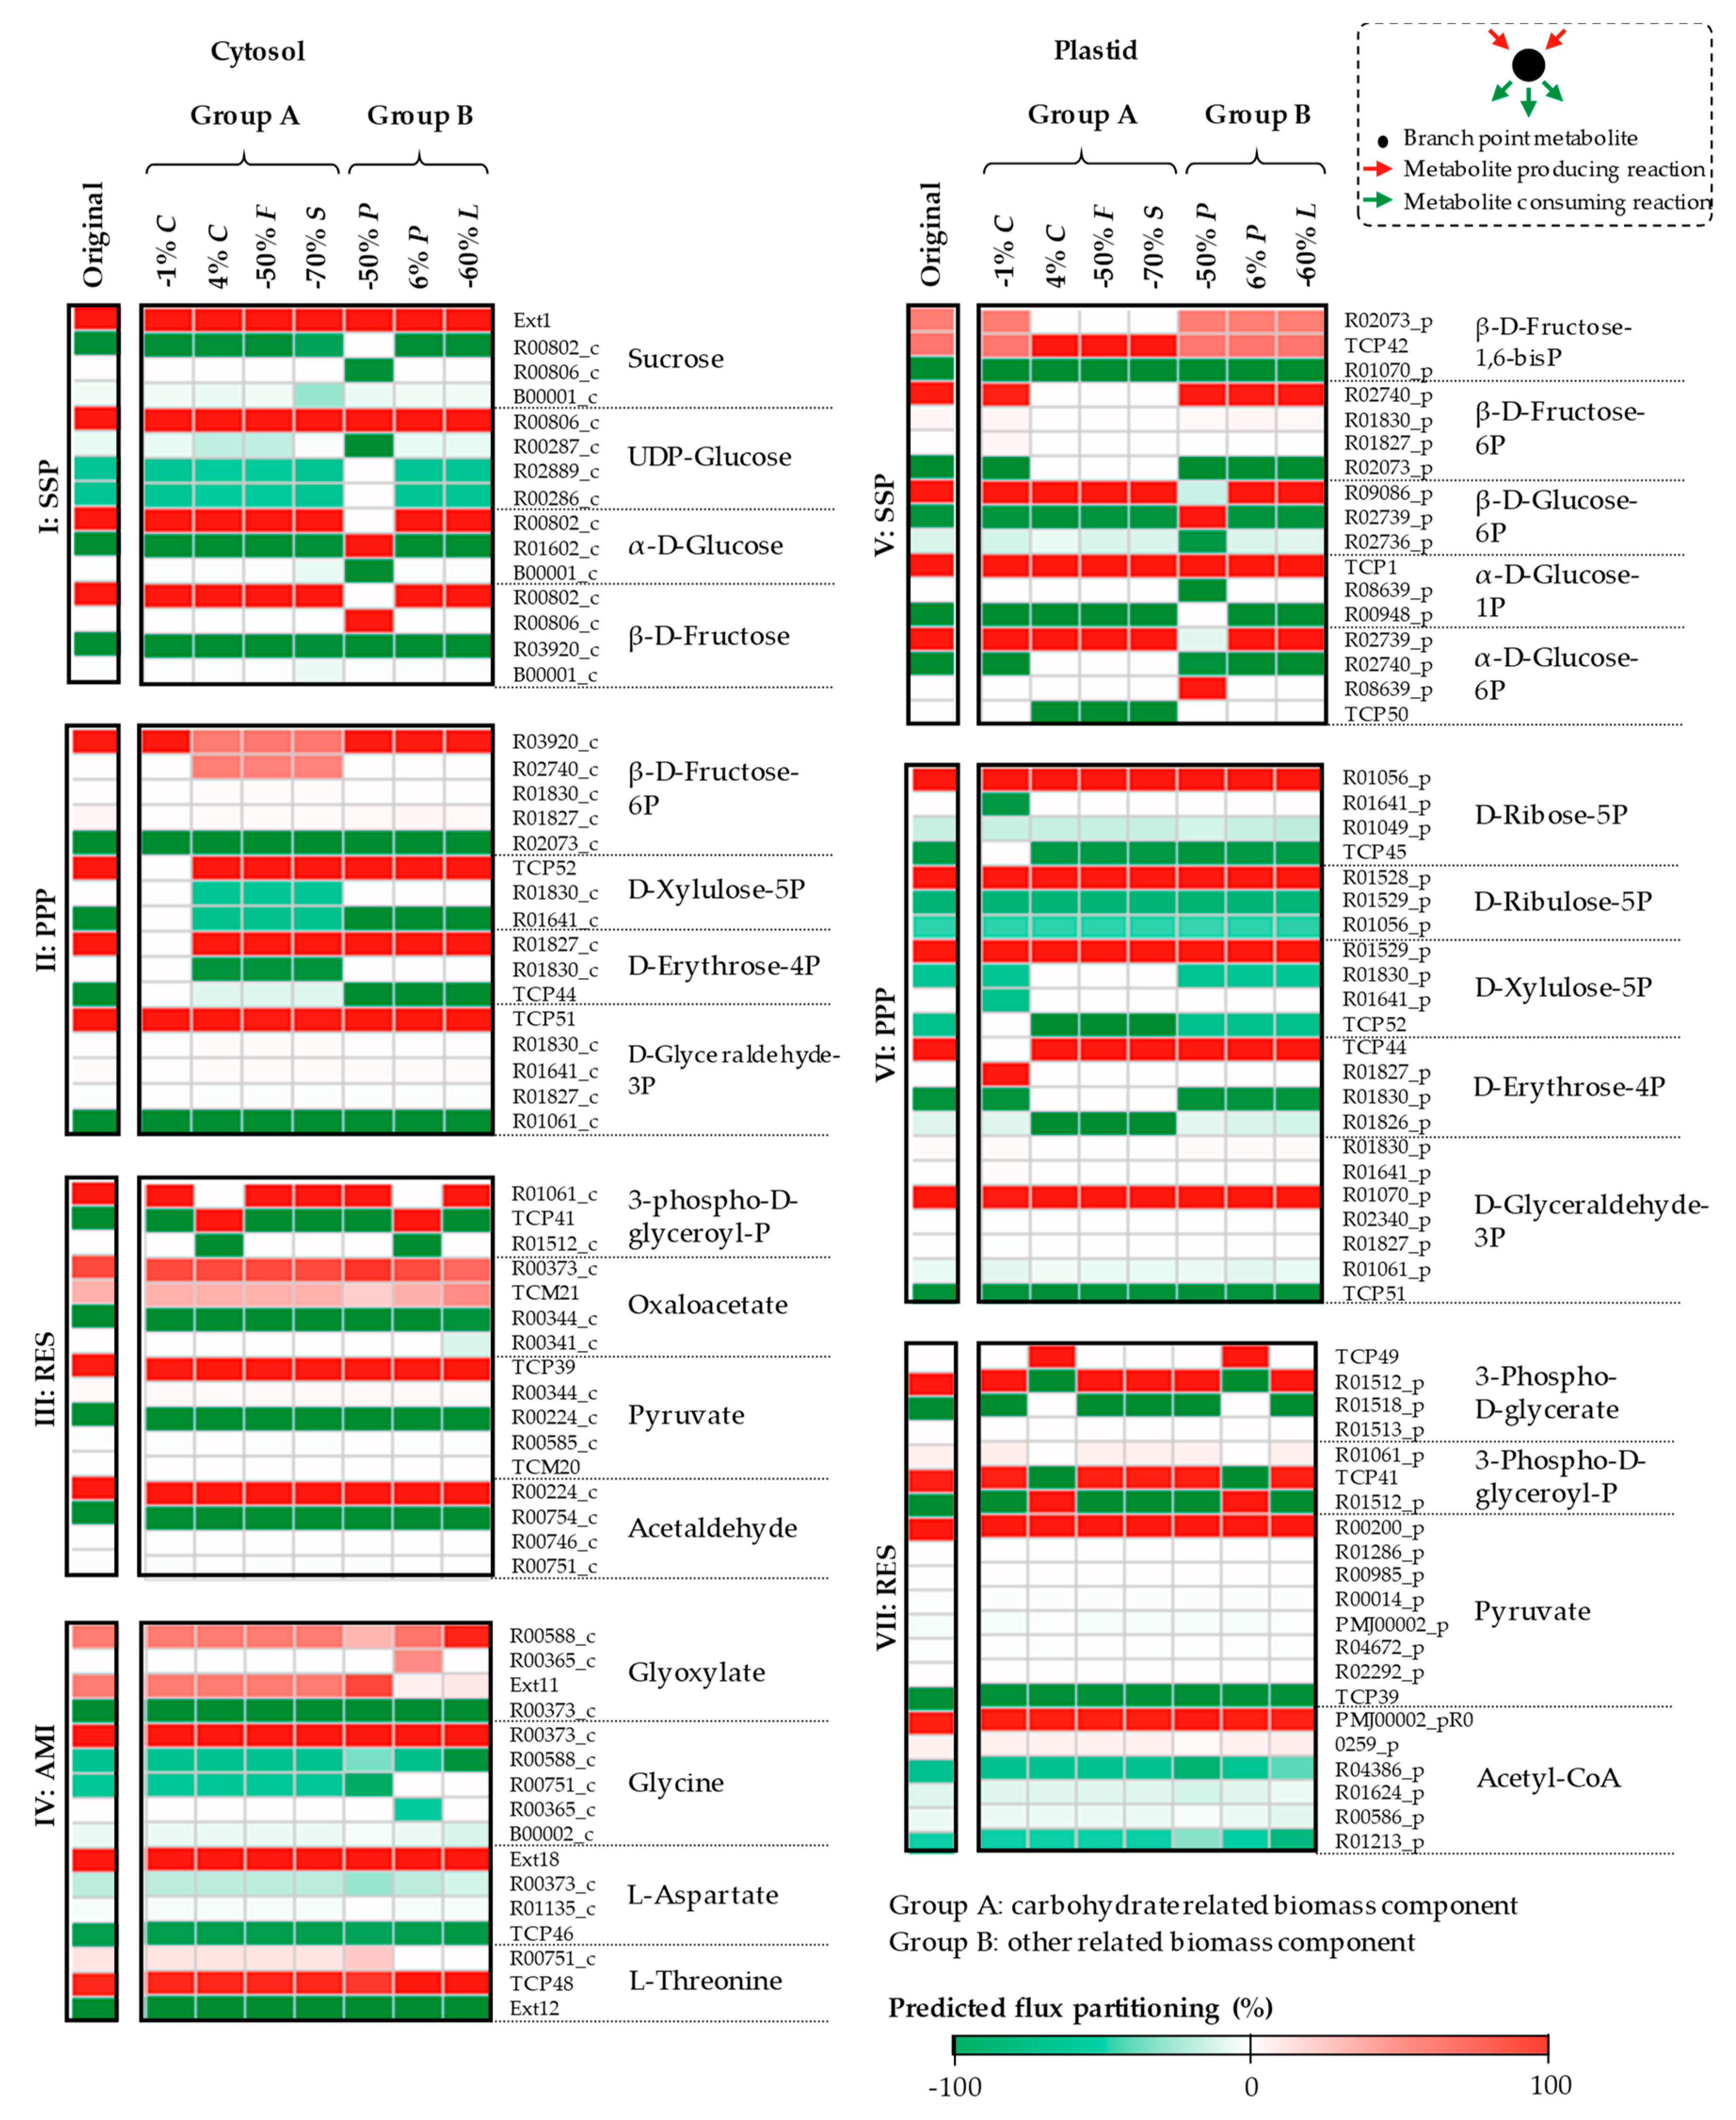
Further analysis of the predicted flux partitioning showed that it was also highly influenced by the changes in biomass contents (Figure 6, Figure A13, Figure A14 and Figure A15 in Appendix A, and Supplementary Materials File S6). Reactions with a similar flux partitioning as the original model were color-coded similarly, whereas, those indicating a breakpoint were color-coded differently (Figure 6). The results indicated that the predicted flux direction and flux partitioning had similar sensitivity, as indicated by the shared breakpoints (−1% and +4% for carbohydrates, −50% and +6% for proteins, −50% for fibers, −60% for lipids, and −70% for starch). The metabolic fluxes in the plastid were more sensitive to variations in biomass content than those in the cytosol. The sensitive reaction fluxes were primarily found in the pentose phosphate pathway, followed by the starch and sucrose biosynthesis pathway. D-xylulose-5-phosphate and D-erythrose-4-phosphate branch points in the pentose phosphate pathway showed relatively high sensitivity, both in the cytosol and plastid compartments (Figure 6II,VI), reflecting their primary role as metabolic precursors for energy balance [46]. Metabolic fluxes in the starch and sucrose biosynthesis pathway in the cytosol were highly influenced by the protein content (Figure 6I), whereas, carbohydrate-related biomass components were more important in the plastid (Figure 6V). The starch and sucrose biosynthesis pathway and pentose phosphate pathway play important roles in carbon utilization for storage root growth, as demonstrated by the rMeCBM-KU50 model [4].
4. Discussion
The constraint-based modeling approach has been adopted to help unravel the complexity of plant metabolism. The reliability of this approach is very much dependent on the quality of data used and its representativeness of real systems, among others. This study investigated the sensitivity of the rMeCBM-KU50 model to inputted data and constraints used for the prediction, which included (i) specific sucrose uptake-related data (photosynthetic rate, total photosynthetic rate, total leaf area, and storage root dry weight) and (ii) biomass function-related data. The results showed the specific storage root growth rate was highly dependent on the specific sucrose uptake rate (Figure 3), whereas, the carbon flux distribution was more sensitive to the proportion of biomass components (Figure 4, Figure 5 and Figure 6).
Our analysis showed that the storage root dry weight and total photosynthetic rate had a remarkable effect on the specific sucrose uptake rate and also, the specific storage root growth rate prediction (Figure 3). The effects of the photosynthetic rate and total leaf area were comparatively minimal, despite being important indicators of plant growth [47]. These results suggest storage root dry weight and total photosynthetic rate can reliably be used to model the storage root growth rate in cassava under different conditions, an approach, which if implemented could enable researchers to channel limited resources and focus on the most relevant plant physiological traits in their quest to understand plant systems.
The cellular biomass composition, which is the proportion of constituent macromolecular compounds such as carbohydrates and proteins, is indicative of the metabolic products and perhaps, more importantly, reflects the physiological conditions, among others, to which the cells are exposed. An accurate representation of the biomass is, therefore, important for analyzing the metabolic flux [32]. Sensitivity analysis showed that the rMeCBM-KU50 model was more sensitive to variations in the biomass function than it was to changes in the sucrose uptake-related data. The biomass content had a greater effect on the metabolic flux prediction than the sucrose uptake-related data (Figure 3 and Figure 4). Also, the carbon flux prediction by the rMeCBM-KU50 model was most sensitive to the carbohydrate content, which accounts for up to 90% of cassava storage roots biomass on a dry weight basis. Similar observations were reported in the yeast model [31] and oilseed rape model [28]. The biomass of yeast predominantly contains protein, 35–65% by weight [31], whereas, the main biomass component of oilseed rape is oil mostly in the form of triacylglycerol, accounting for over 40% by weight [28]. However, the flux distribution in Arabidopsis remained unchanged when the biomass function was varied, probably because the biomass components are more comparable [30].
Taken together, our study demonstrated that the rMeCBM-KU50 model is a well representative model of carbon assimilation metabolism in cassava storage roots. The model was able to predict the storage root growth rate under typical growing conditions (Figure 3 and Figure 4), and showed sensitivity to the specific sucrose uptake rate, total photosynthetic rate, storage root dry weight, and carbohydrate content. Based on the findings, the specific sucrose uptake rate, carbohydrate content, and starch content could reliably be used as the important data for model prediction and used as the guideline of experimental design for model development.
5. Conclusions
A sensitivity analysis was performed to determine how sensitive the rMeCBM-KU50 model is to changes in input data and constraints, enabling us to understand and quantify the impact of the range of variables on the model outcome. By mostly varying the substrate uptake-related data and biomass function within ±90% of the model default values, we aimed to better understand the input–output relationship and identify variables that are most critical to the modeling process under specific conditions, allowing for a focused, wider application of the model. The results showed the total photosynthetic rate, storage root dry weight, and carbohydrate content had predominant impacts on the rMeCBM-KU50 model. The predicted storage root growth rate was highly dependent on the specific sucrose uptake rate through total photosynthetic rate, and storage root dry weight. The carbon flux distribution, flux direction and flux partitioning, was most sensitive to changes in biomass content, particularly carbohydrate, the major biochemical compound in cassava storage root.
Supplementary Materials
The following are available online at https://www.mdpi.com/2227-9717/7/5/259/s1, File S1: The model inputted data values of biomass function used for the sensitivity analysis in the rMeCBM-KU50 model, File S2: List of metabolic branch points and the involved reactions in the rMeCBM-KU50 model, File S3: The sensitivity of reaction flux direction to variations in sucrose uptake rate-related data, File S4: The sensitivity of reaction flux partitioning (%) to variations in sucrose uptake rate-related data, File S5: The sensitivity of reaction flux direction to variations in biomass function-related data, File S6: The sensitivity of reaction flux partitioning (%) to variations in biomass function-related data.
Author Contributions
T.S. and S.K. supervised the project; P.C. performed all computational modeling and prepared the figures; T.S. and P.C. conducted the part of analyzed the results and drafted the manuscript; T.S., S.K., and P.C. discussed, interpreted the results, wrote the article, and approved the final manuscript.
Acknowledgments
The authors would like to thank The National Center for Genetic Engineering and Biotechnology (BIOTEC, NSTDA) for P.C. post-graduate scholarship. This project was supported by National Science and Technology Development Agency (NSTDA) and National Research Council of Thailand (NRCT) (P-13-50395 and P-15-50974). Furthermore, we acknowledge the financial support provided by KMUTT through the KMUTT 55th Anniversary Commemorative Fund and the International Strategic Output and Outcome Fund (the outbound student and researcher). We also thank the Biological Modeling Laboratory (BML) members and KMUTT for useful suggestions.
Conflicts of Interest
The authors declare no conflict of interest.
Appendix A. Supplemental Figures
Figure A1.
Sensitivity analysis of (a) variations in sucrose uptake rate-related data and (b) variations of biomass function-related data to the predicted storage root growth rate of the rMeCBM-KU50 model. (c) The percentage changes of predicted growth rate with respect to the original data. Each radar graph, the radial axes is the error percentage of model simulation to measured storage root growth rate. LA; total leaf area per plant; PN, photosynthetic rate; PN, total, total photosynthetic rate per plant; SRDW, storage root dry weight per plant; C, carbohydrate content; F, fiber content; L, lipid content; P, protein content; S, starch content.
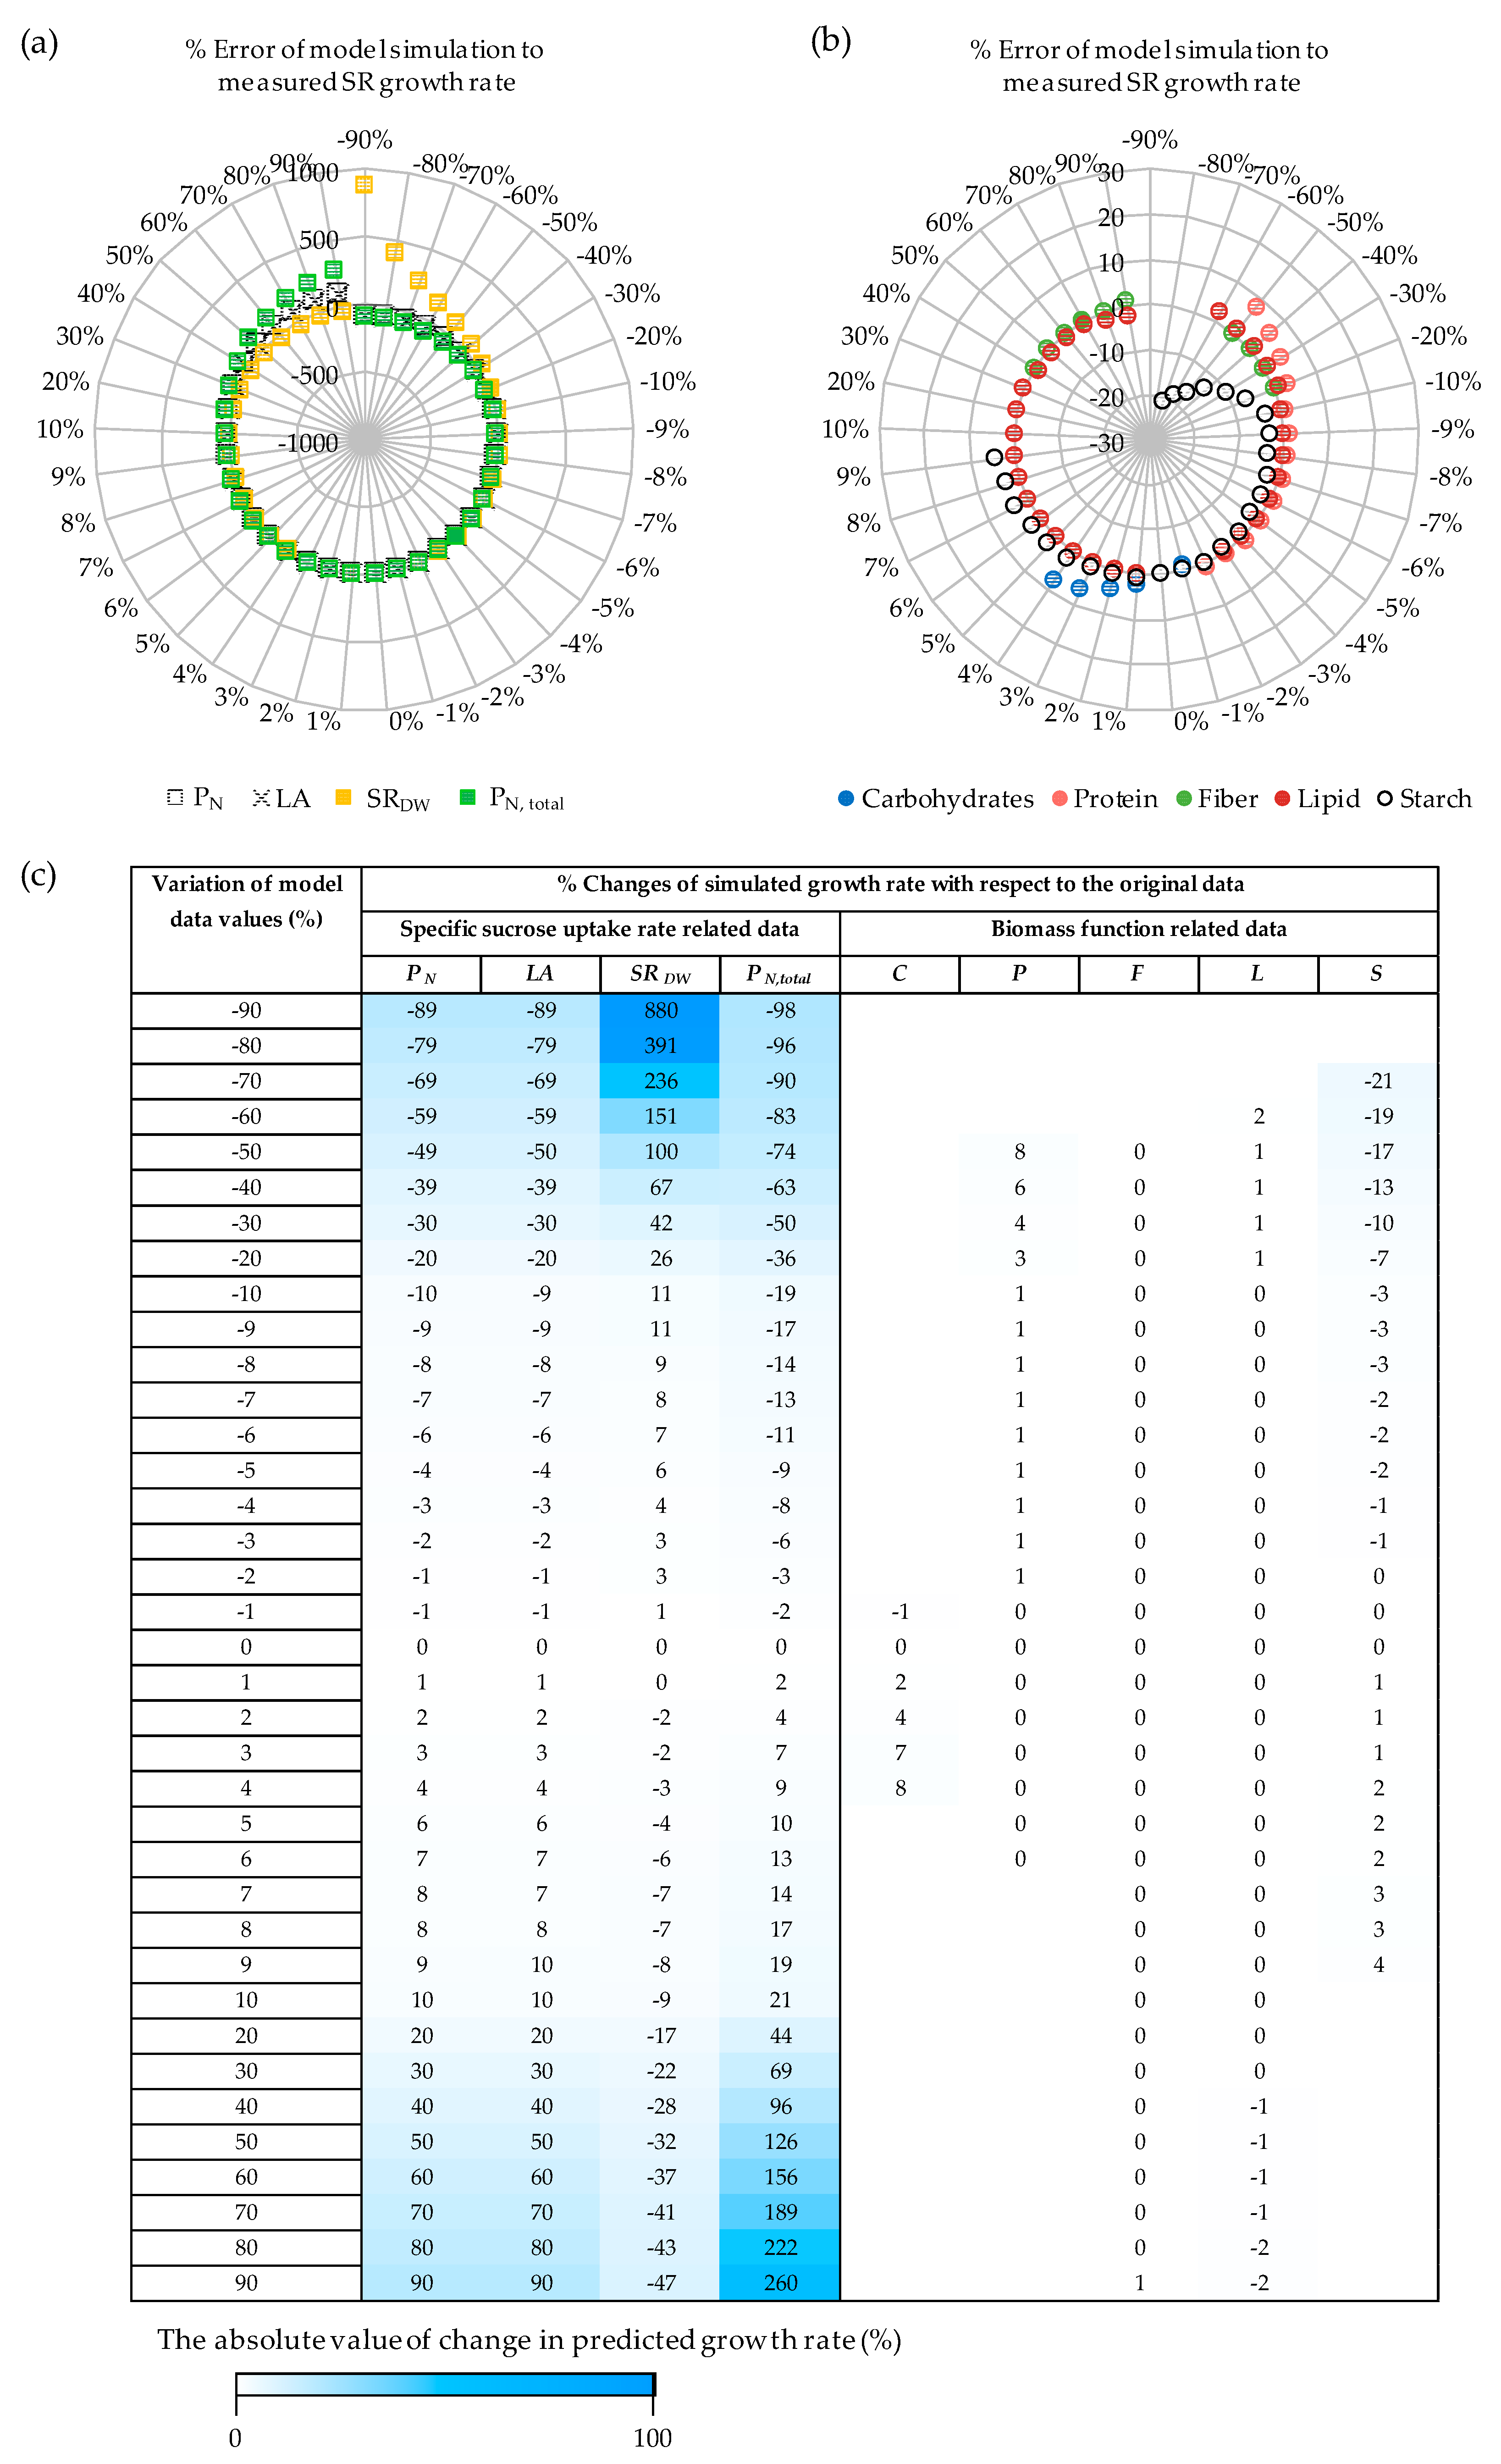
Figure A2.
The sensitivity of the cytosolic reaction flux direction to variations in sucrose uptake rate-related data. Inactive reactions containing zero fluxes are denoted by white-colored grids. Active reactions, non-zero fluxes, with similar flux direction as the original model are denoted by blue grids; while those with dissimilar flux direction (breakpoint) are denoted by red grids. LA; total leaf area per plant; PN, photosynthetic rate; PN, total, total photosynthetic rate per plant; SRDW, storage root dry weight per plant; AMI, amino acid biosynthesis pathway; BIO, biomass reactions; CEL, cell wall biosynthesis pathway; NUC, nucleotide biosynthesis pathway; PPP, pentose phosphate pathway; RES, respiration pathway; SSP, starch and sucrose biosynthesis pathway.
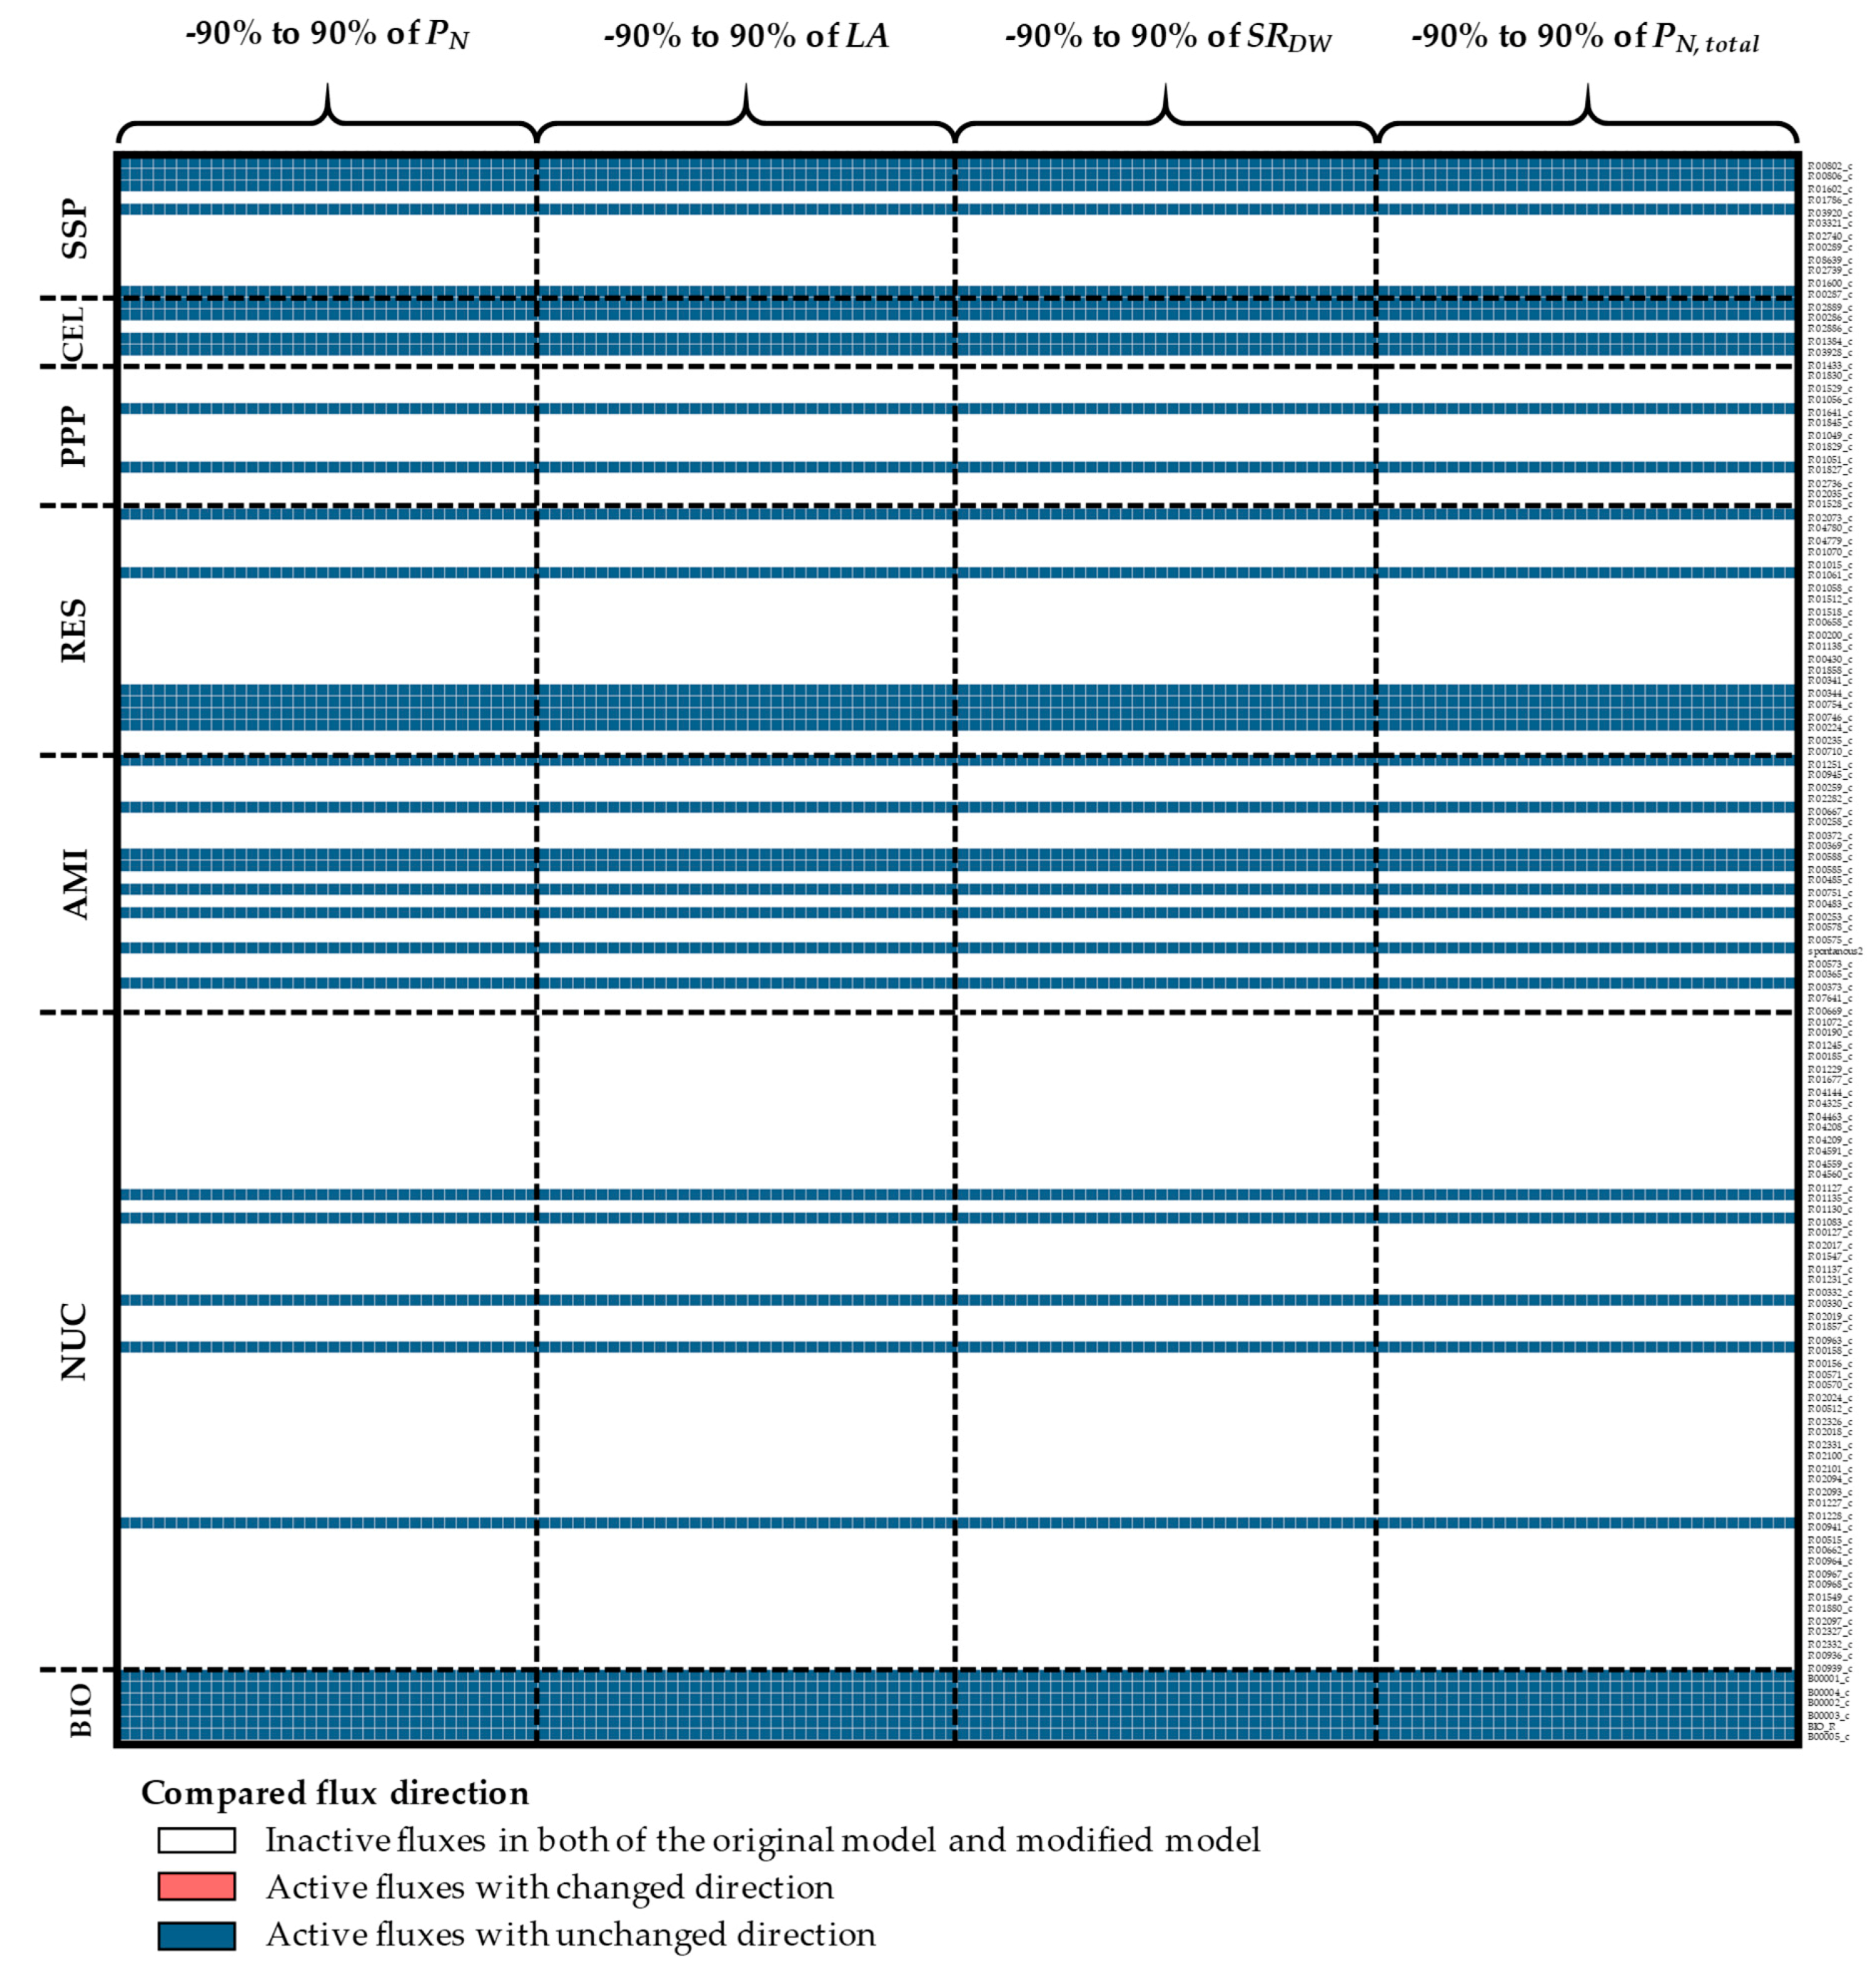
Figure A3.
The sensitivity of mitochondrial reaction flux direction to variations in the sucrose uptake rate-related data. Inactive reactions containing zero fluxes are denoted by white-colored grids. Active reactions, non-zero fluxes, with similar flux direction as the original model are denoted by blue grids; while those with dissimilar flux direction (breakpoint) are denoted by red grids. LA; total leaf area per plant; PN, photosynthetic rate; PN, total, total photosynthetic rate per plant; SRDW, storage root dry weight per plant; AMI, amino acid biosynthesis pathway; NUC, nucleotide biosynthesis pathway; SSP, starch and sucrose biosynthesis pathway.
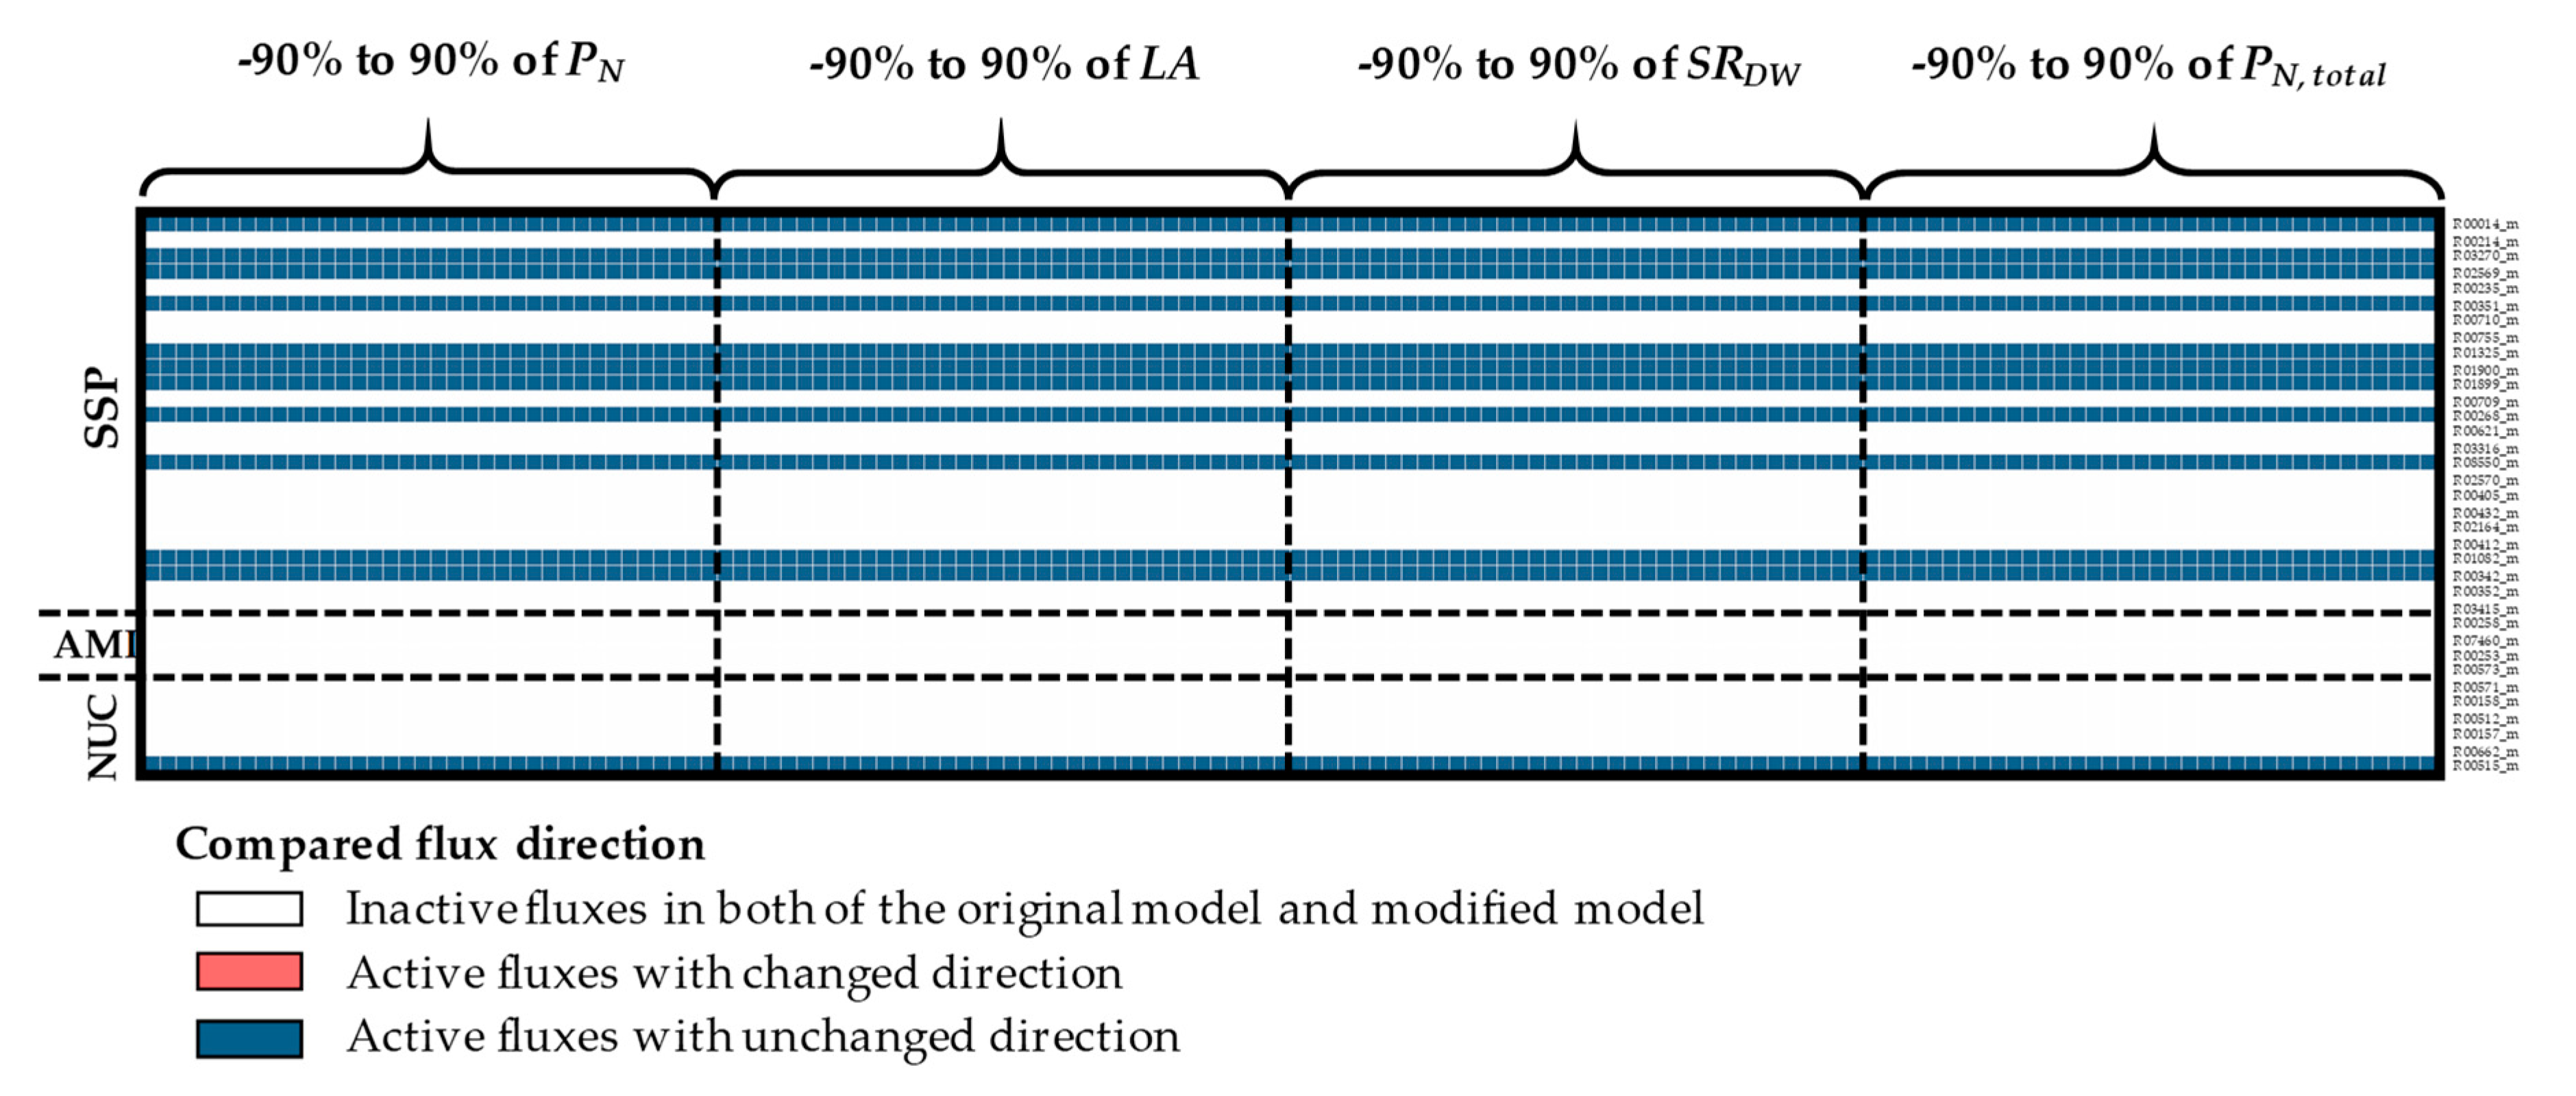
Figure A4.
The sensitivity of the plastidial reaction flux direction to variations in the sucrose uptake rate-related data. Inactive reactions containing zero fluxes are denoted by white-colored grids. Active reactions, non-zero fluxes, with similar flux direction as the original model are denoted by blue grids; while those with dissimilar flux direction (breakpoint) are denoted by red grids. LA; total leaf area per plant; PN, photosynthetic rate; PN, total, total photosynthetic rate per plant; SRDW, storage root dry weight per plant; AMI, amino acid biosynthesis pathway; FAT, fatty acid biosynthesis pathway; NUC, nucleotide biosynthesis pathway; PPP, pentose phosphate pathway; RES, respiration pathway; SSP, starch and sucrose biosynthesis pathway.

Figure A5.
The sensitivity of the transport and exchange reaction flux direction to variations in the sucrose uptake rate-related data. Inactive reactions containing zero fluxes are denoted by white-colored grids. Active reactions, non-zero fluxes, with similar flux direction as the original model are denoted by blue grids; while those with dissimilar flux direction (breakpoint) are denoted by red grids. LA; total leaf area per plant; PN, photosynthetic rate; PN, total, total photosynthetic rate per plant; SRDW, storage root dry weight per plant; EXC, exchange reaction; TCM, transport reaction between cytosol and mitochondria; TCP, transport reaction between cytosol and plastid.
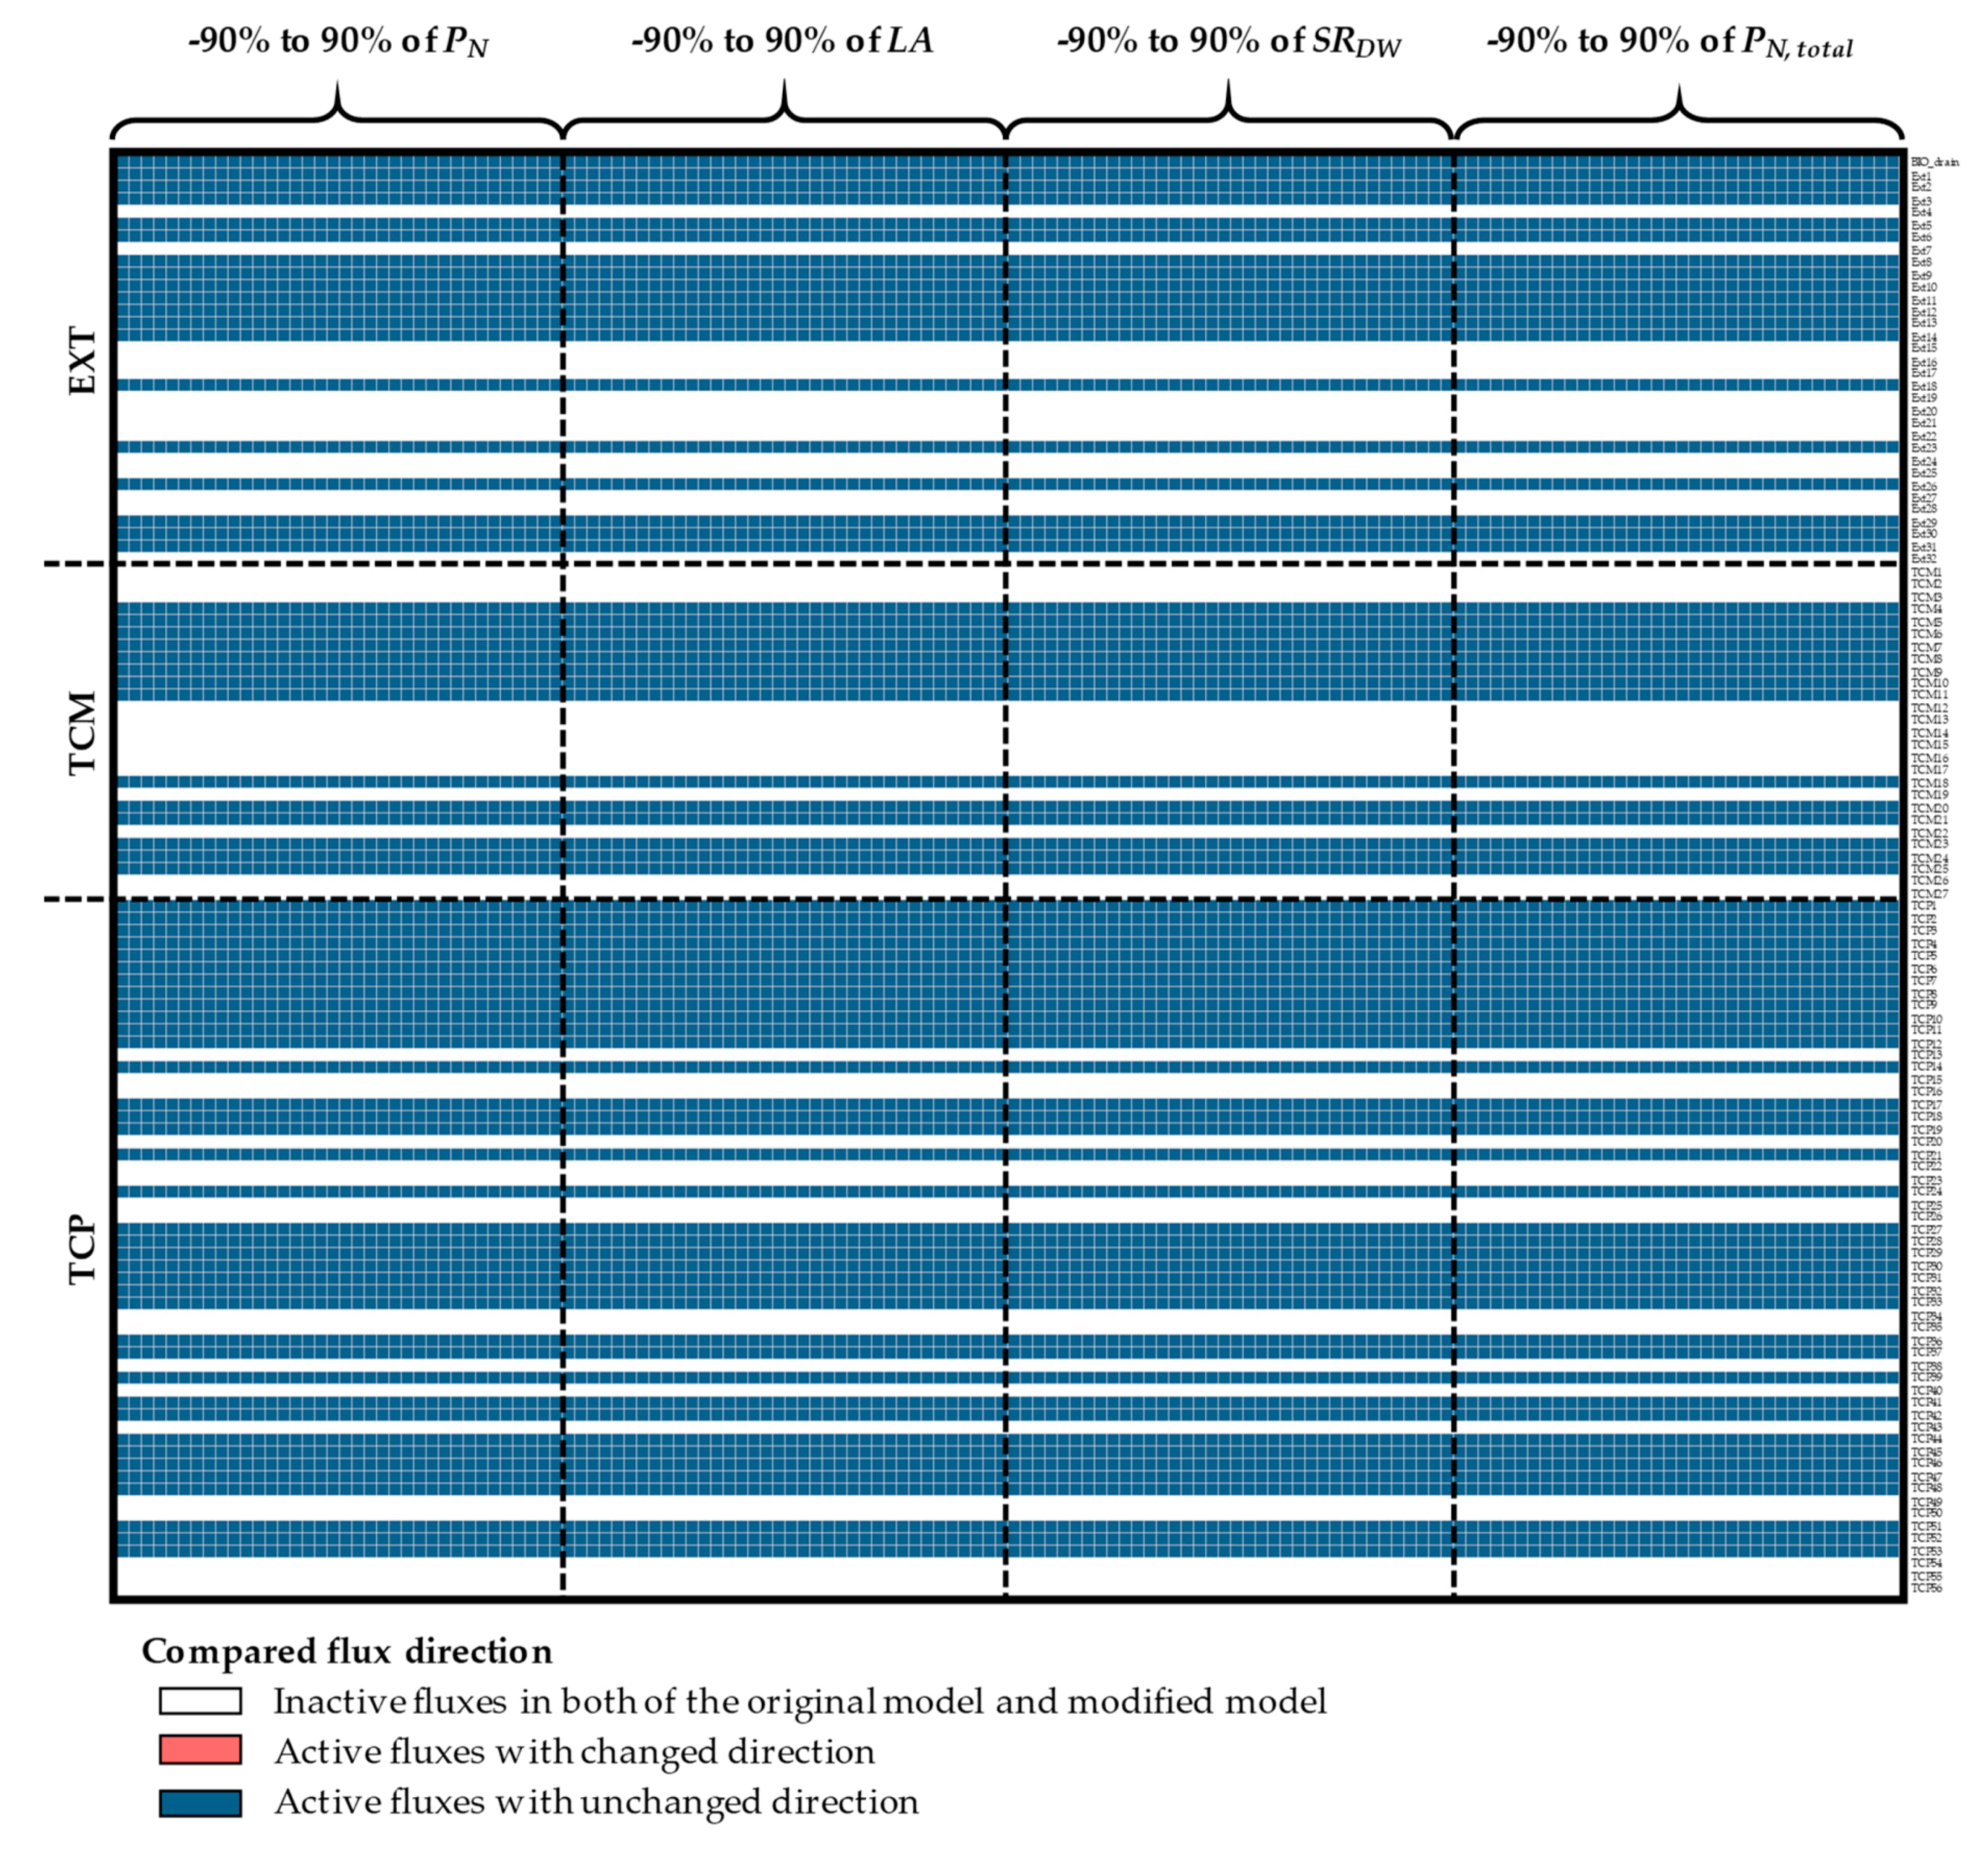
Figure A6.
(a) The sensitivity of the cytosolic reaction flux partitioning to variations in the sucrose uptake rate-related data. (b) The influence of −90% to −60% variations of total photosynthetic rate on flux partitioning by the rMeCBM-KU50 model. Details of the metabolic branch points along with the corresponding reactions are provided in the Supplementary Materials (File S2). A difference in grid color between the original (first column) and predicted fluxes is indicative of dissimilarity in partitioning (breakpoint). The production and consumption fluxes at each metabolic branch point were respectively denoted as positive and negative signs. LA; total leaf area per plant; PN, photosynthetic rate; PN, total, total photosynthetic rate per plant; SRDW, storage root dry weight per plant.
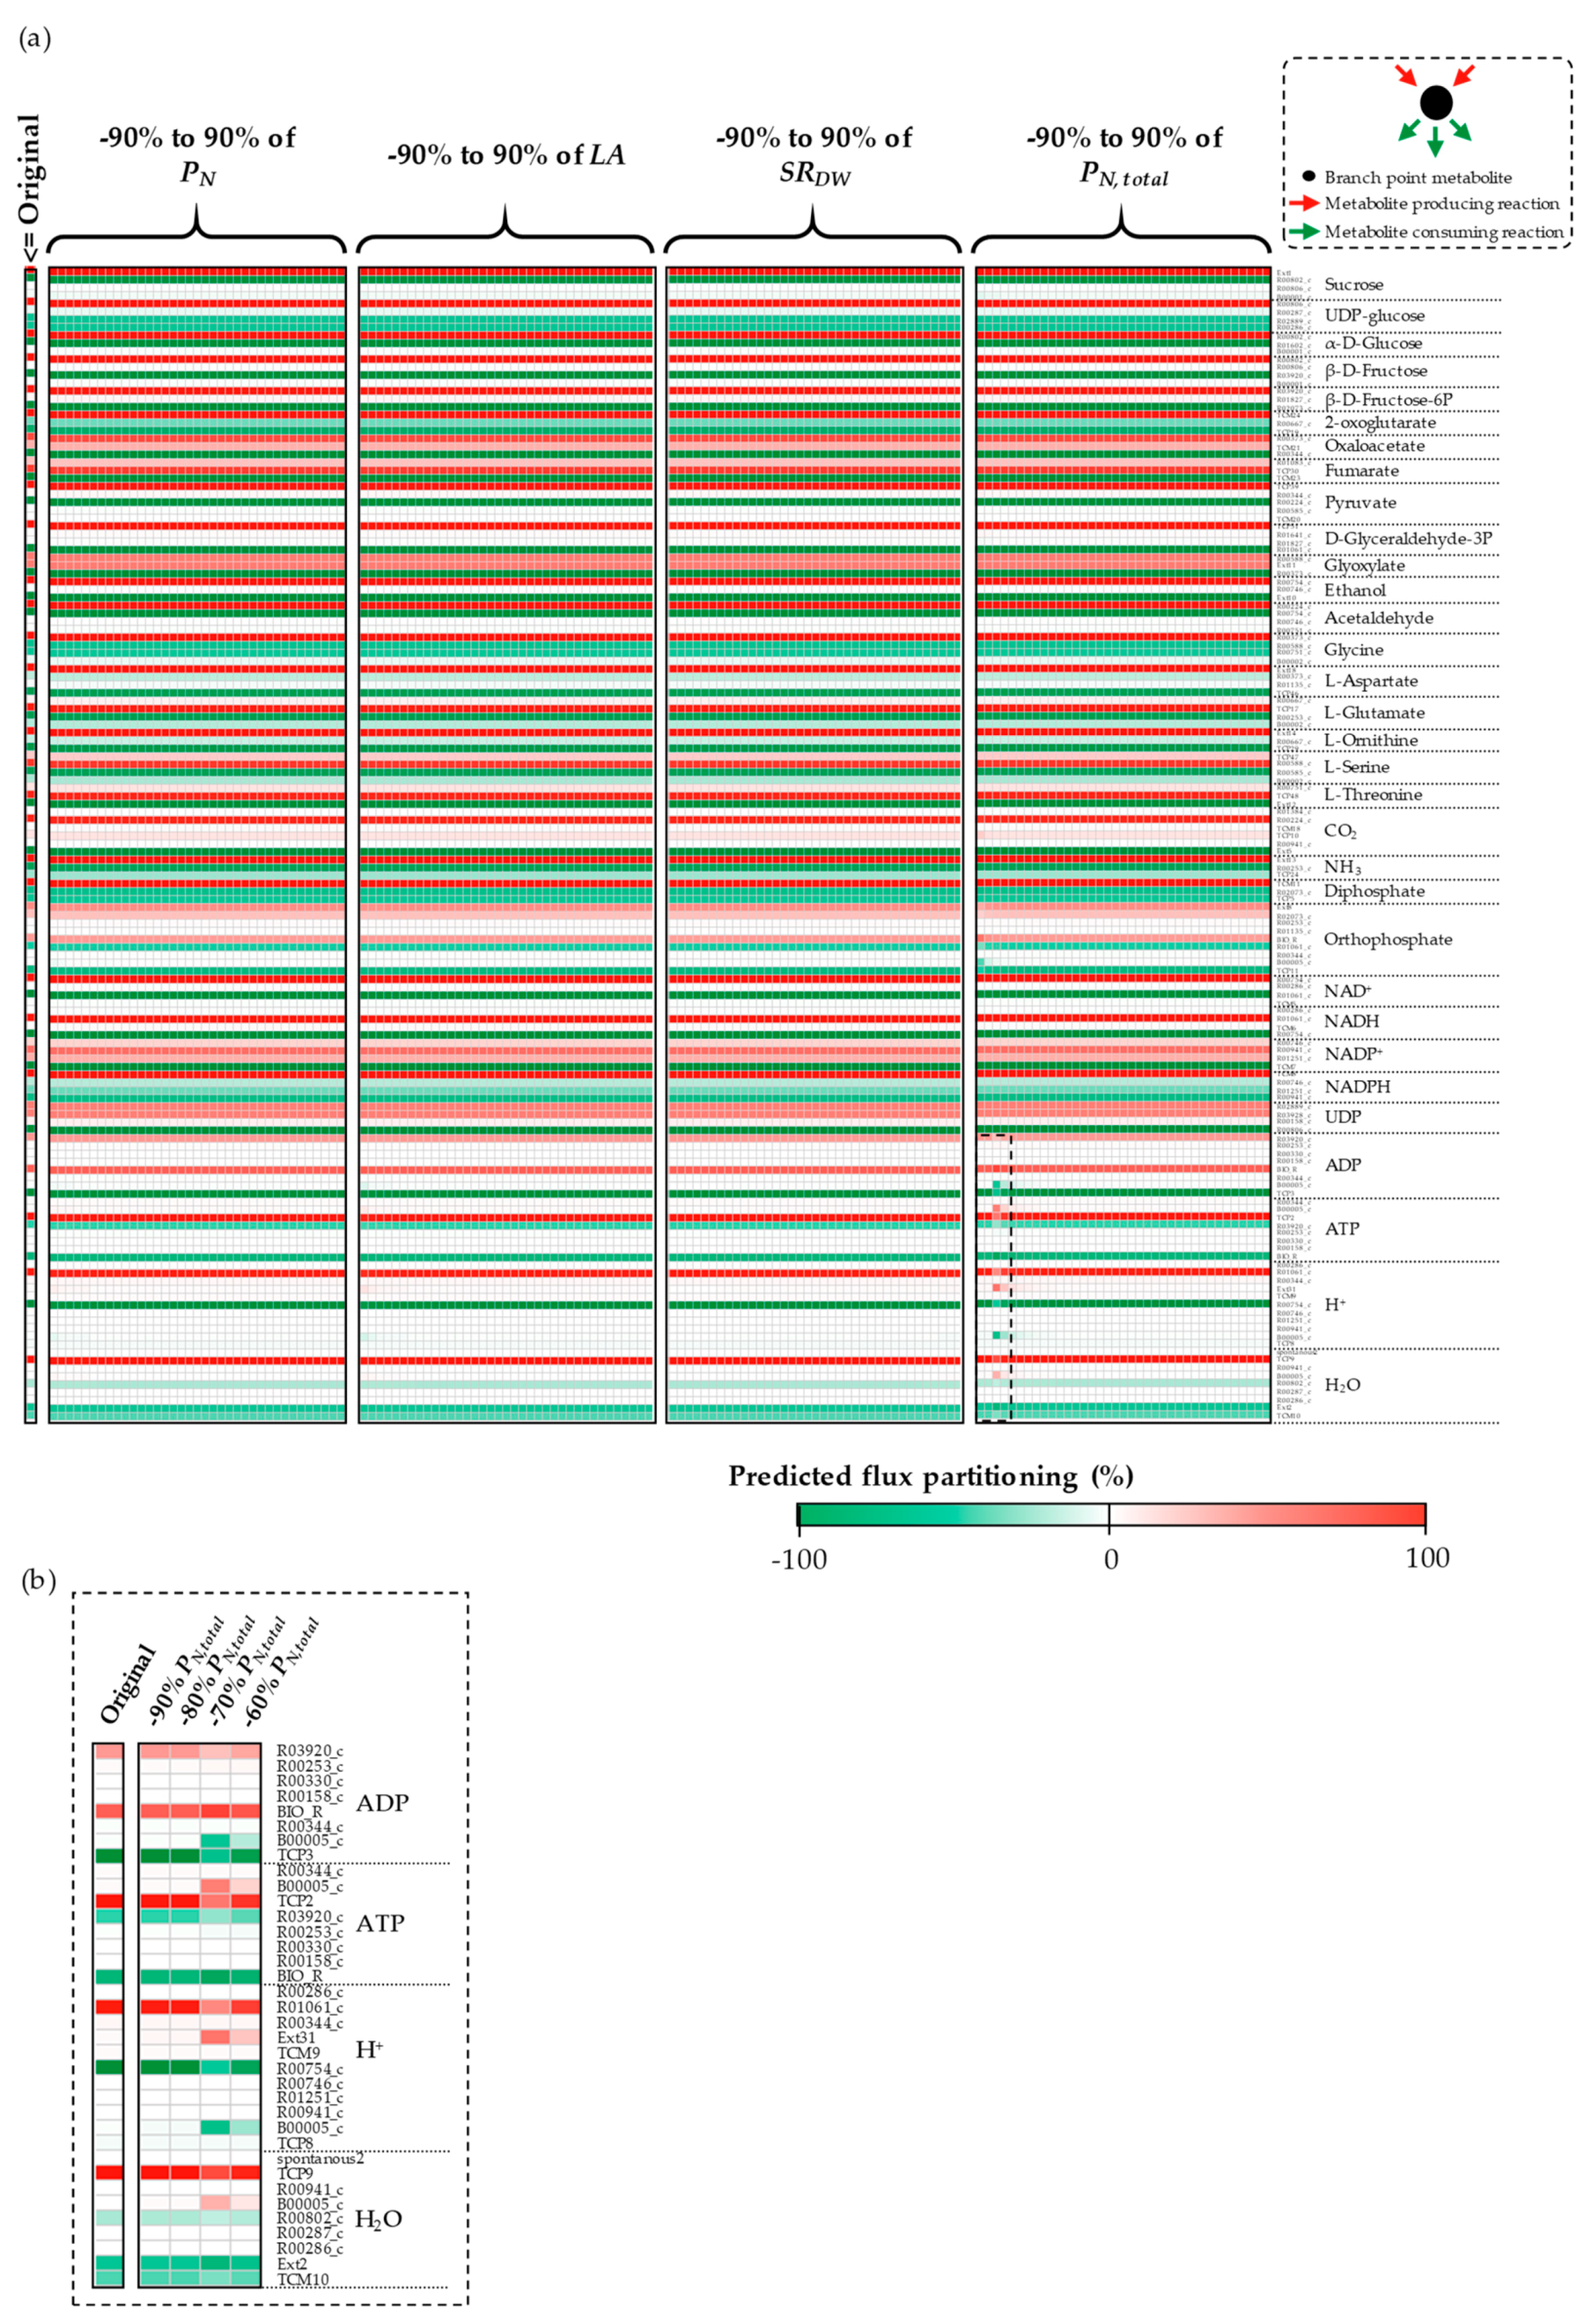
Figure A7.
The sensitivity of the mitochondrial reaction flux partitioning to variations in the sucrose uptake rate-related data. Details of the metabolic branch points along with the corresponding reactions are provided in the Supplementary Materials (File S2). A difference in grid color between the original (first column) and predicted fluxes is indicative of dissimilarity in partitioning (breakpoint). The production and consumption fluxes at each metabolic branch point were respectively, denoted as positive and negative signs. LA; total leaf area per plant; PN, photosynthetic rate; PN, total, total photosynthetic rate per plant; SRDW, storage root dry weight per plant.

Figure A8.
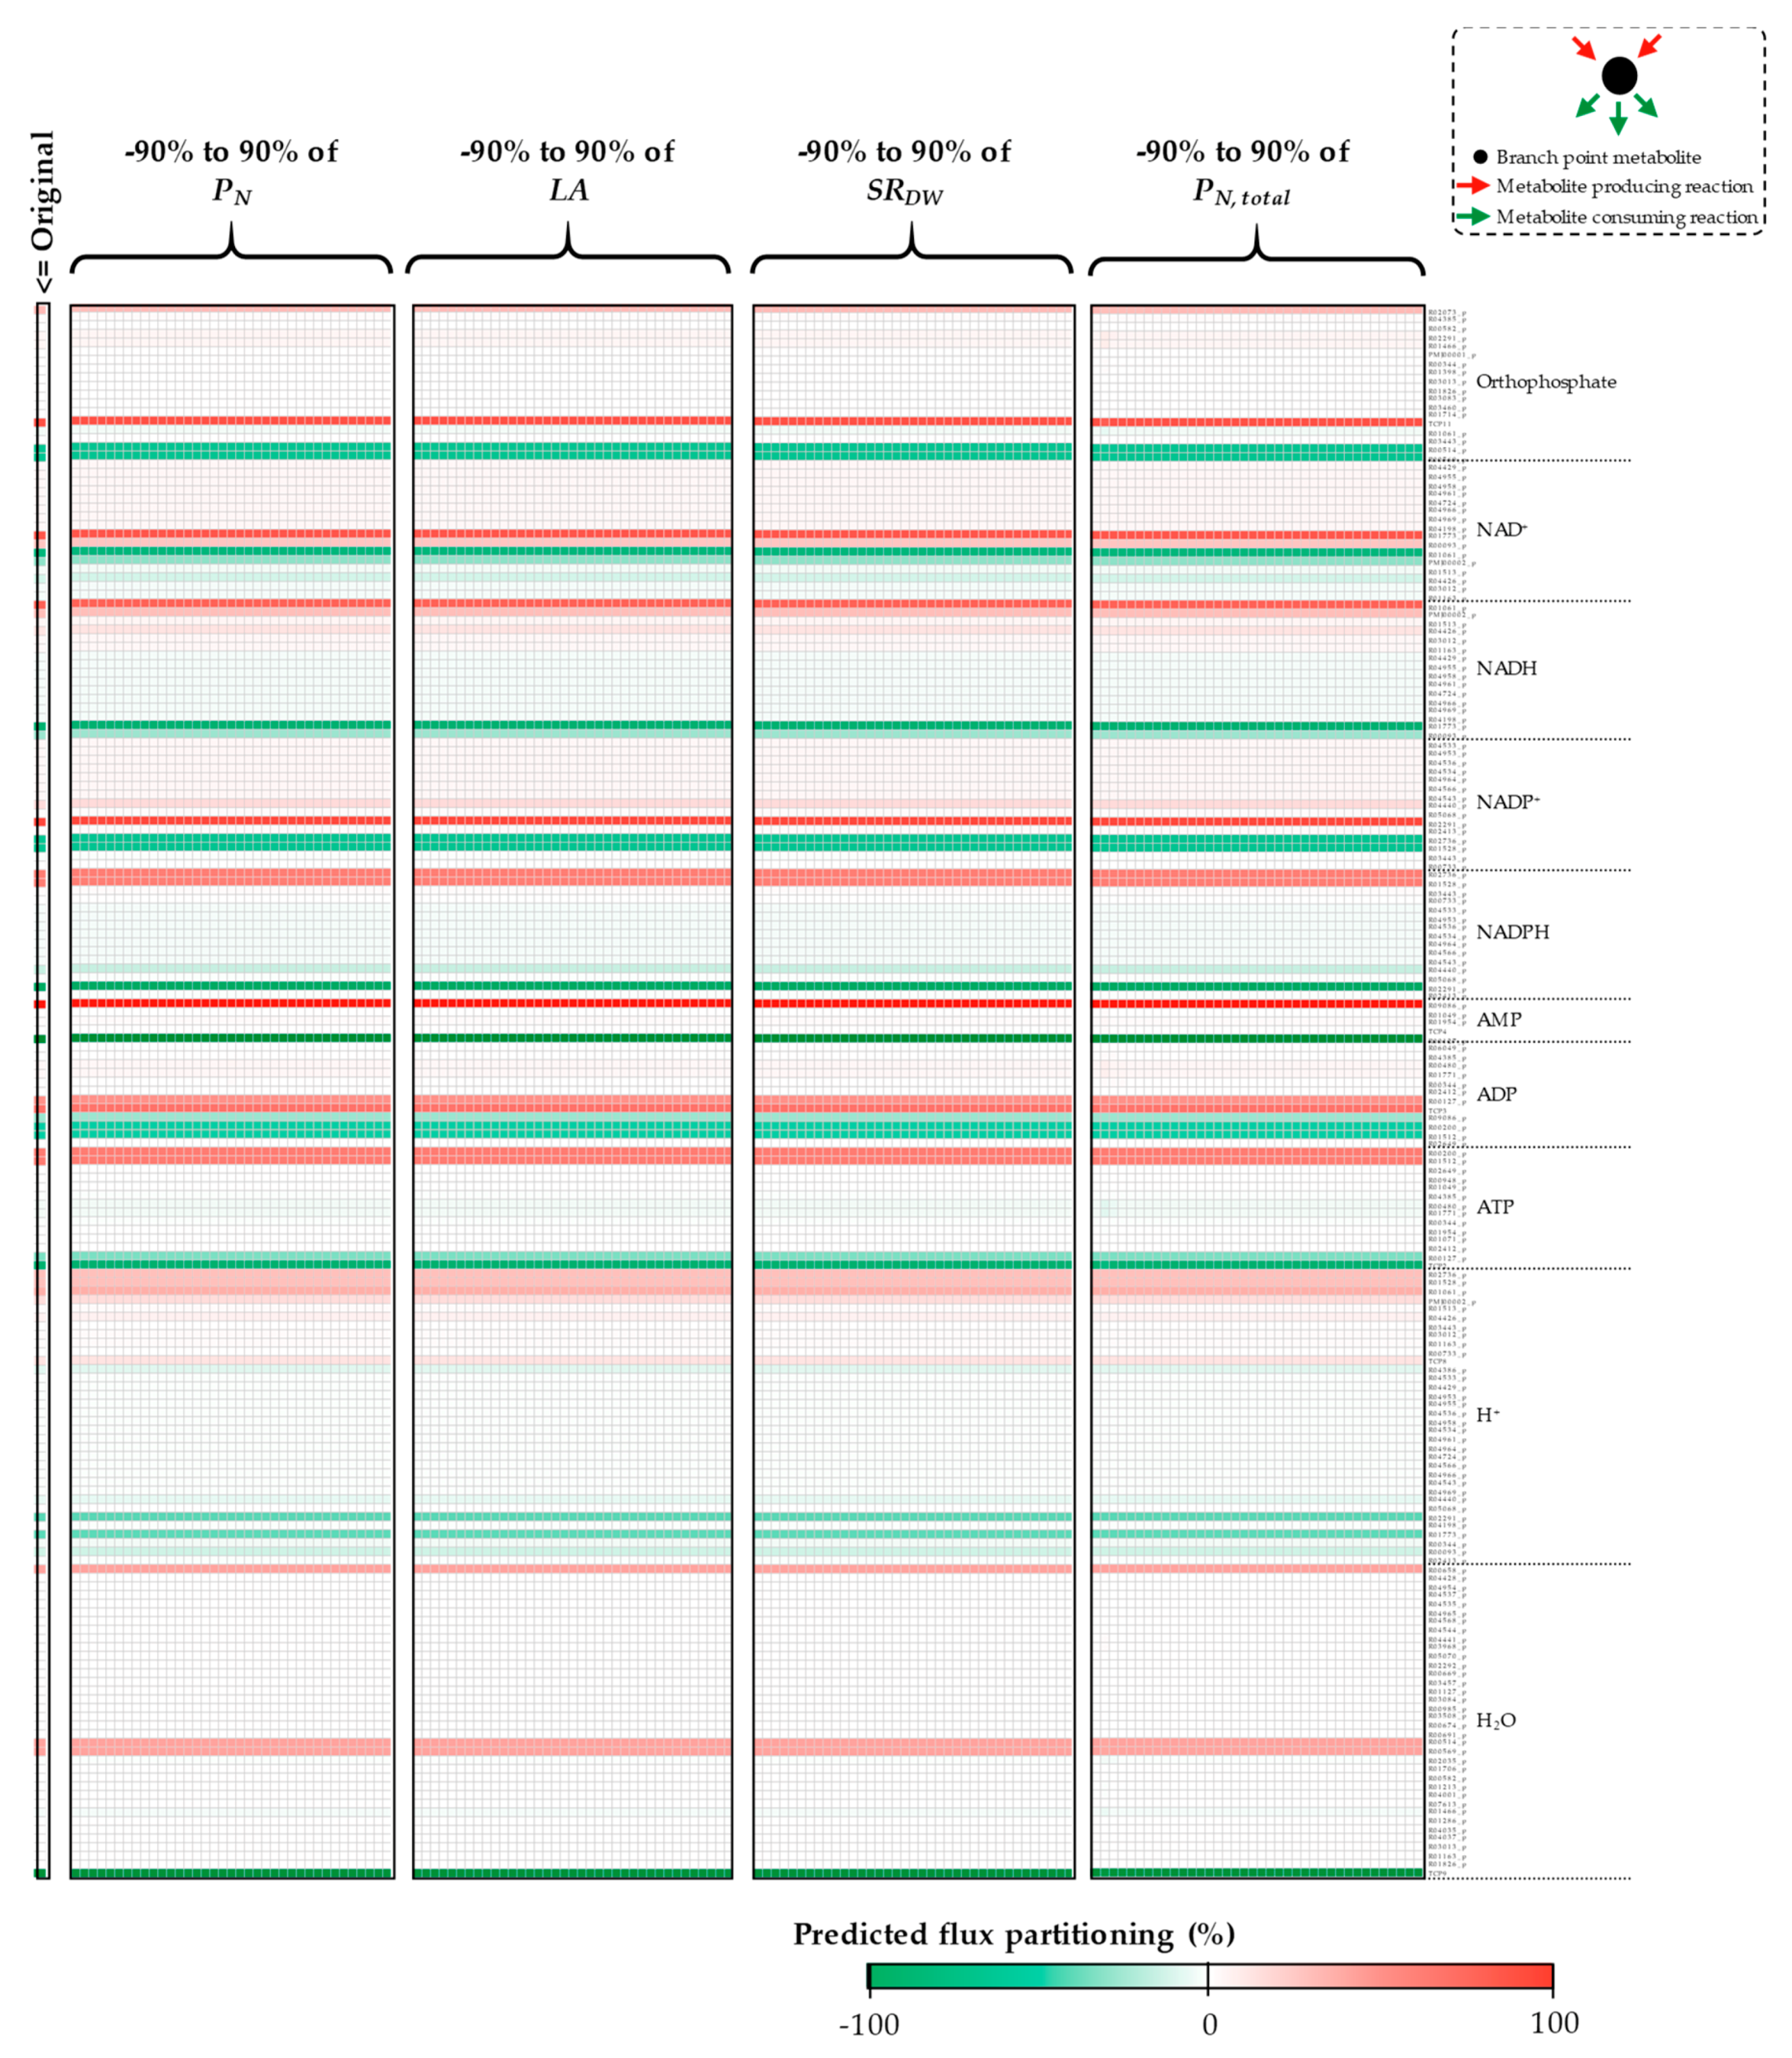
The sensitivity of the plastidial reaction flux partitioning to variations in the sucrose uptake rate-related data. Details of the metabolic branch points along with the corresponding reactions are provided in the Supplementary Materials (File S2). A difference in grid color between the original (first column) and predicted fluxes is indicative of dissimilarity in partitioning (breakpoint). The production and consumption fluxes at each metabolic branch point were respectively denoted as positive and negative signs. LA; total leaf area per plant; PN, photosynthetic rate; PN, total, total photosynthetic rate per plant; SRDW, storage root dry weight per plant. 2-(α-Hydroxyethyl)ThPP, 2-(alpha-hydroxyethyl)thiamine-diphosphate.
Figure A8.
The sensitivity of the plastidial reaction flux partitioning to variations in the sucrose uptake rate-related data. Details of the metabolic branch points along with the corresponding reactions are provided in the Supplementary Materials (File S2). A difference in grid color between the original (first column) and predicted fluxes is indicative of dissimilarity in partitioning (breakpoint). The production and consumption fluxes at each metabolic branch point were respectively denoted as positive and negative signs. LA; total leaf area per plant; PN, photosynthetic rate; PN, total, total photosynthetic rate per plant; SRDW, storage root dry weight per plant. 2-(α-Hydroxyethyl)ThPP, 2-(alpha-hydroxyethyl)thiamine-diphosphate.


Figure A9.
The sensitivity of the cytosolic reaction flux direction to variations in the biomass content. Inactive reactions containing zero fluxes are denoted by white-colored grids. Active reactions, non-zero fluxes, with similar flux direction as the original model are denoted by blue grids; while those with dissimilar flux direction (breakpoint) are denoted by red grids. AMI, amino acid biosynthesis pathway; BIO, biomass reactions; CEL, cell wall biosynthesis pathway; NUC, nucleotide biosynthesis pathway; PPP, pentose phosphate pathway; RES, respiration pathway; SSP, starch and sucrose biosynthesis pathway.
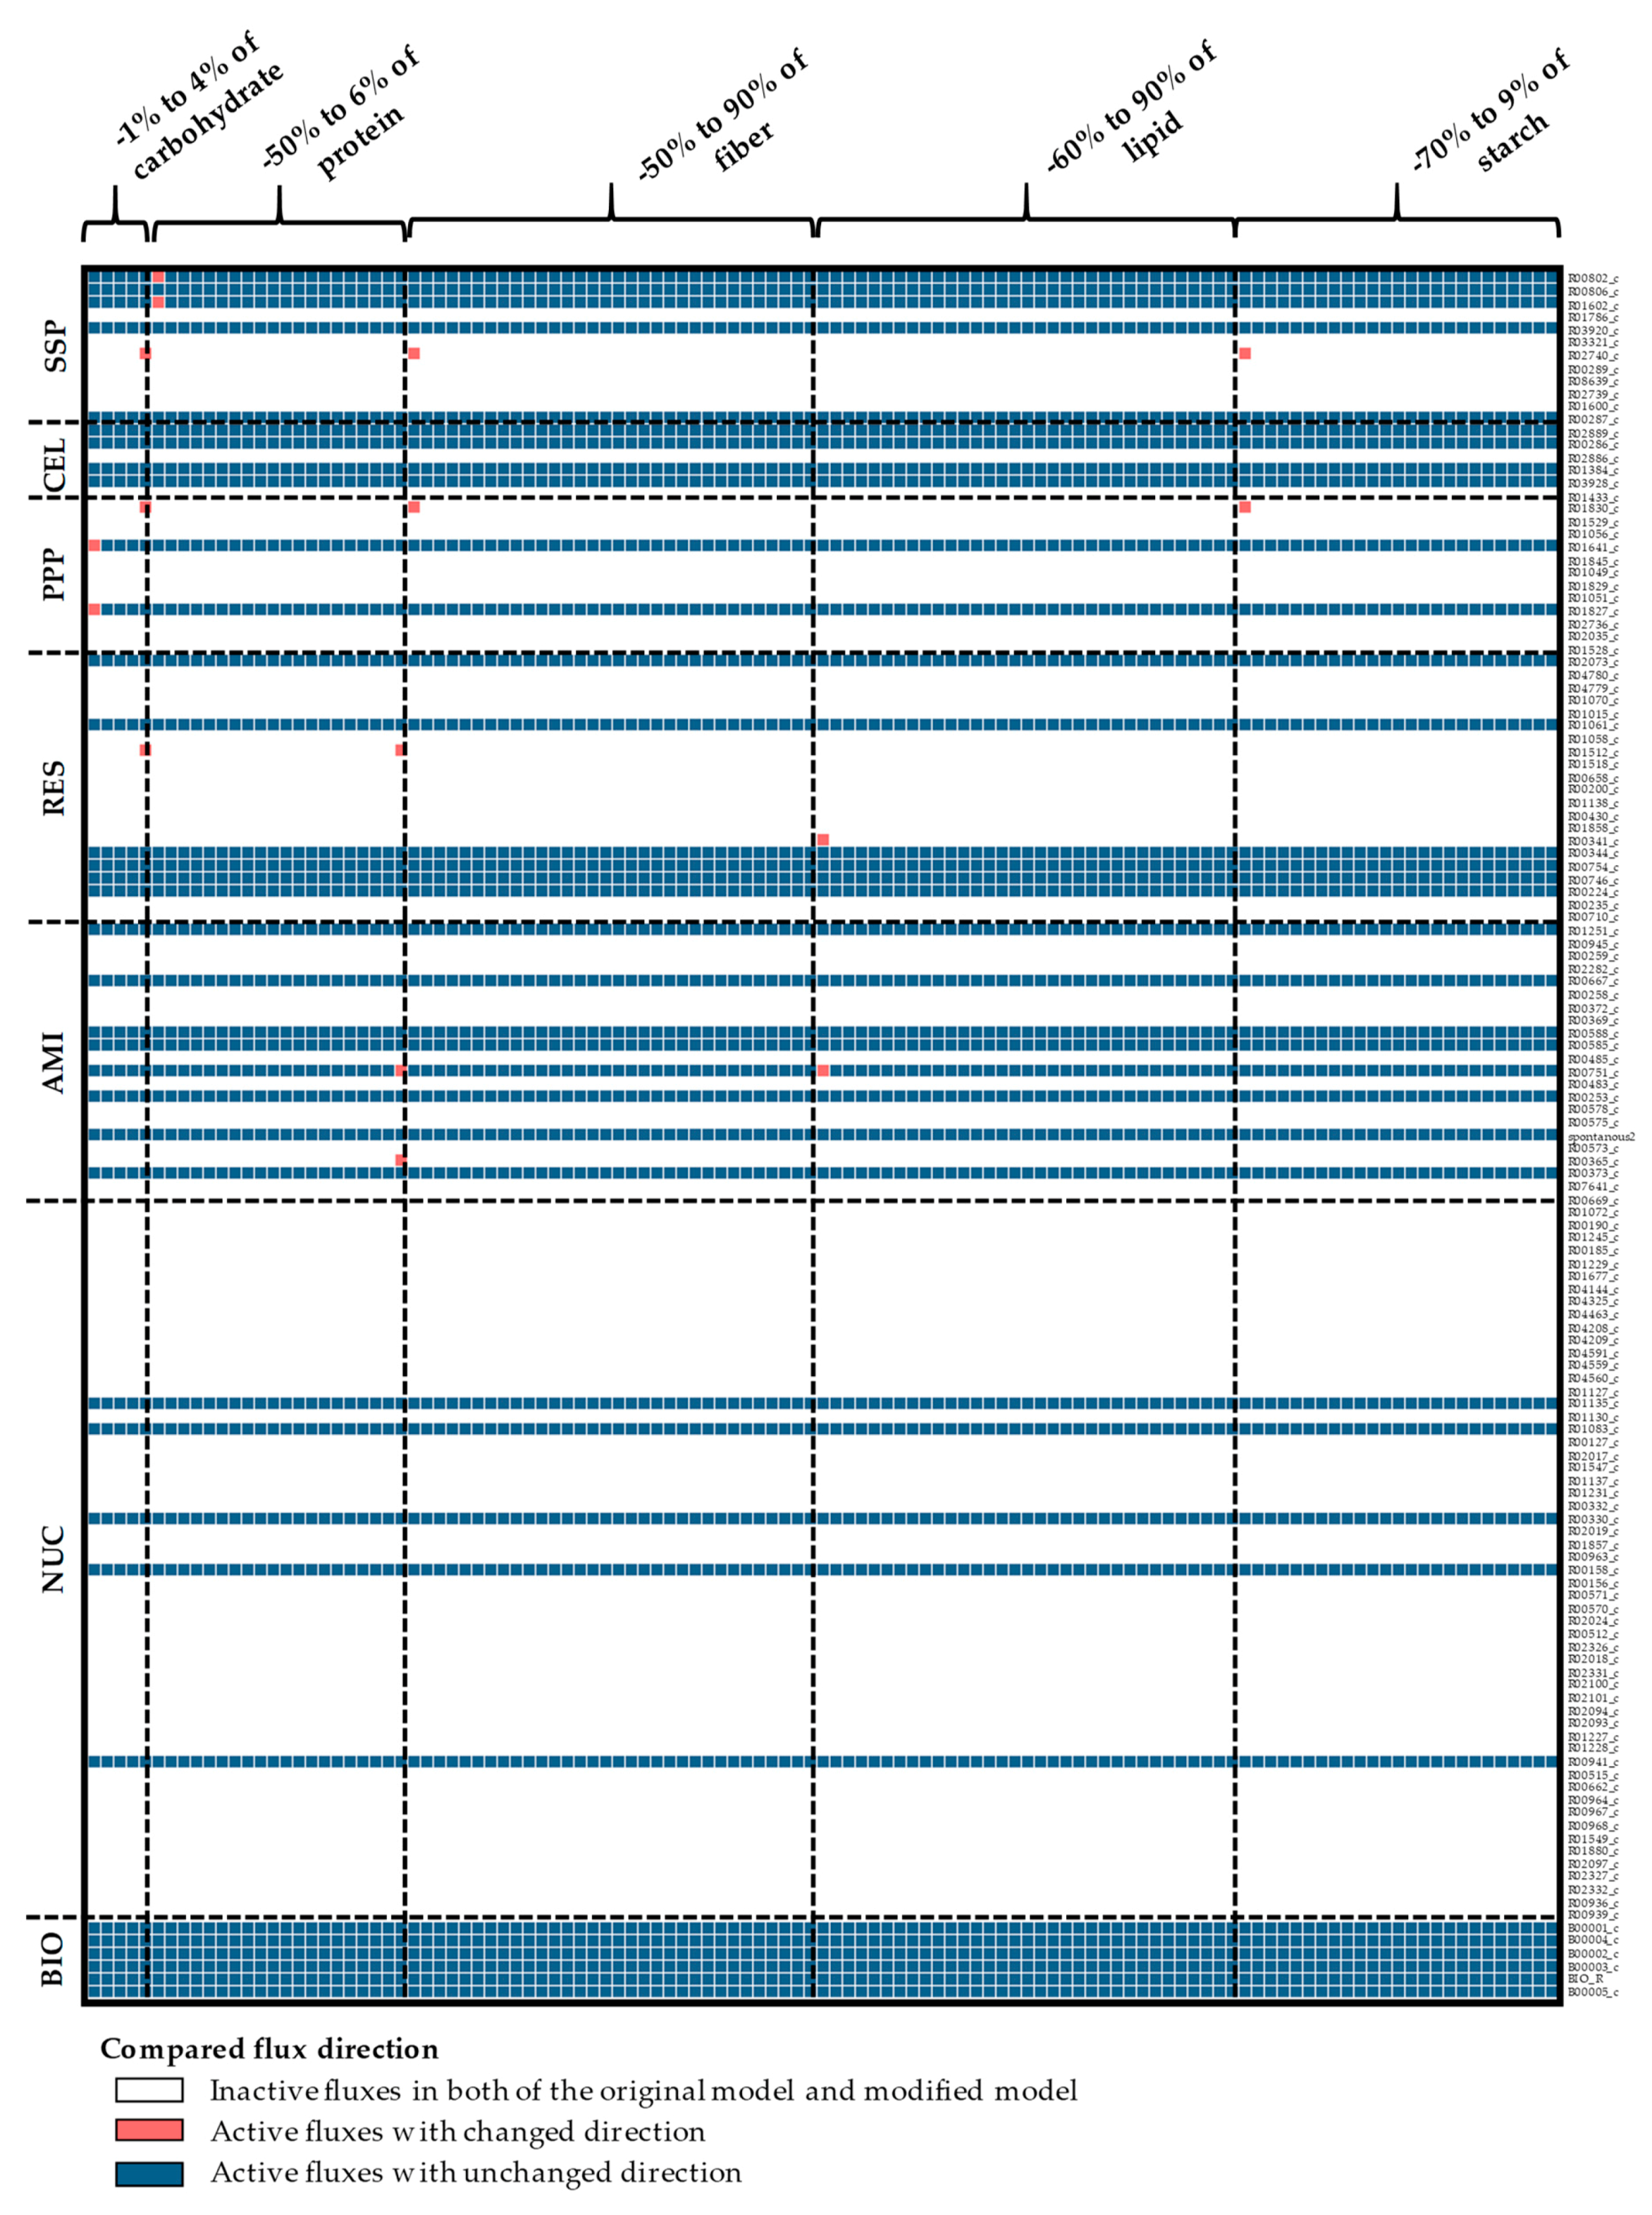
Figure A10.
The sensitivity of mitochondrial reaction flux direction to variations in biomass content. Inactive reactions containing zero fluxes are denoted by white-colored grids. Active reactions, non-zero fluxes, with similar flux direction as the original model are denoted by blue grids; while those with dissimilar flux direction (breakpoint) are denoted by red grids. AMI, amino acid biosynthesis pathway; NUC, nucleotide biosynthesis pathway; and RES, respiration pathway.

Figure A11.
The sensitivity of plastidial reaction flux direction to variations in biomass content. Inactive reactions containing zero fluxes are denoted by white-colored grids. Active reactions, non-zero fluxes, with similar flux direction as the original model are denoted by blue grids; while those with dissimilar flux direction (breakpoint) are denoted by red grids. AMI, amino acid biosynthesis pathway; FAT, fatty acid biosynthesis pathway; NUC, nucleotide biosynthesis pathway; PPP, pentose phosphate pathway; RES, respiration pathway; SSP, starch and sucrose biosynthesis pathway.
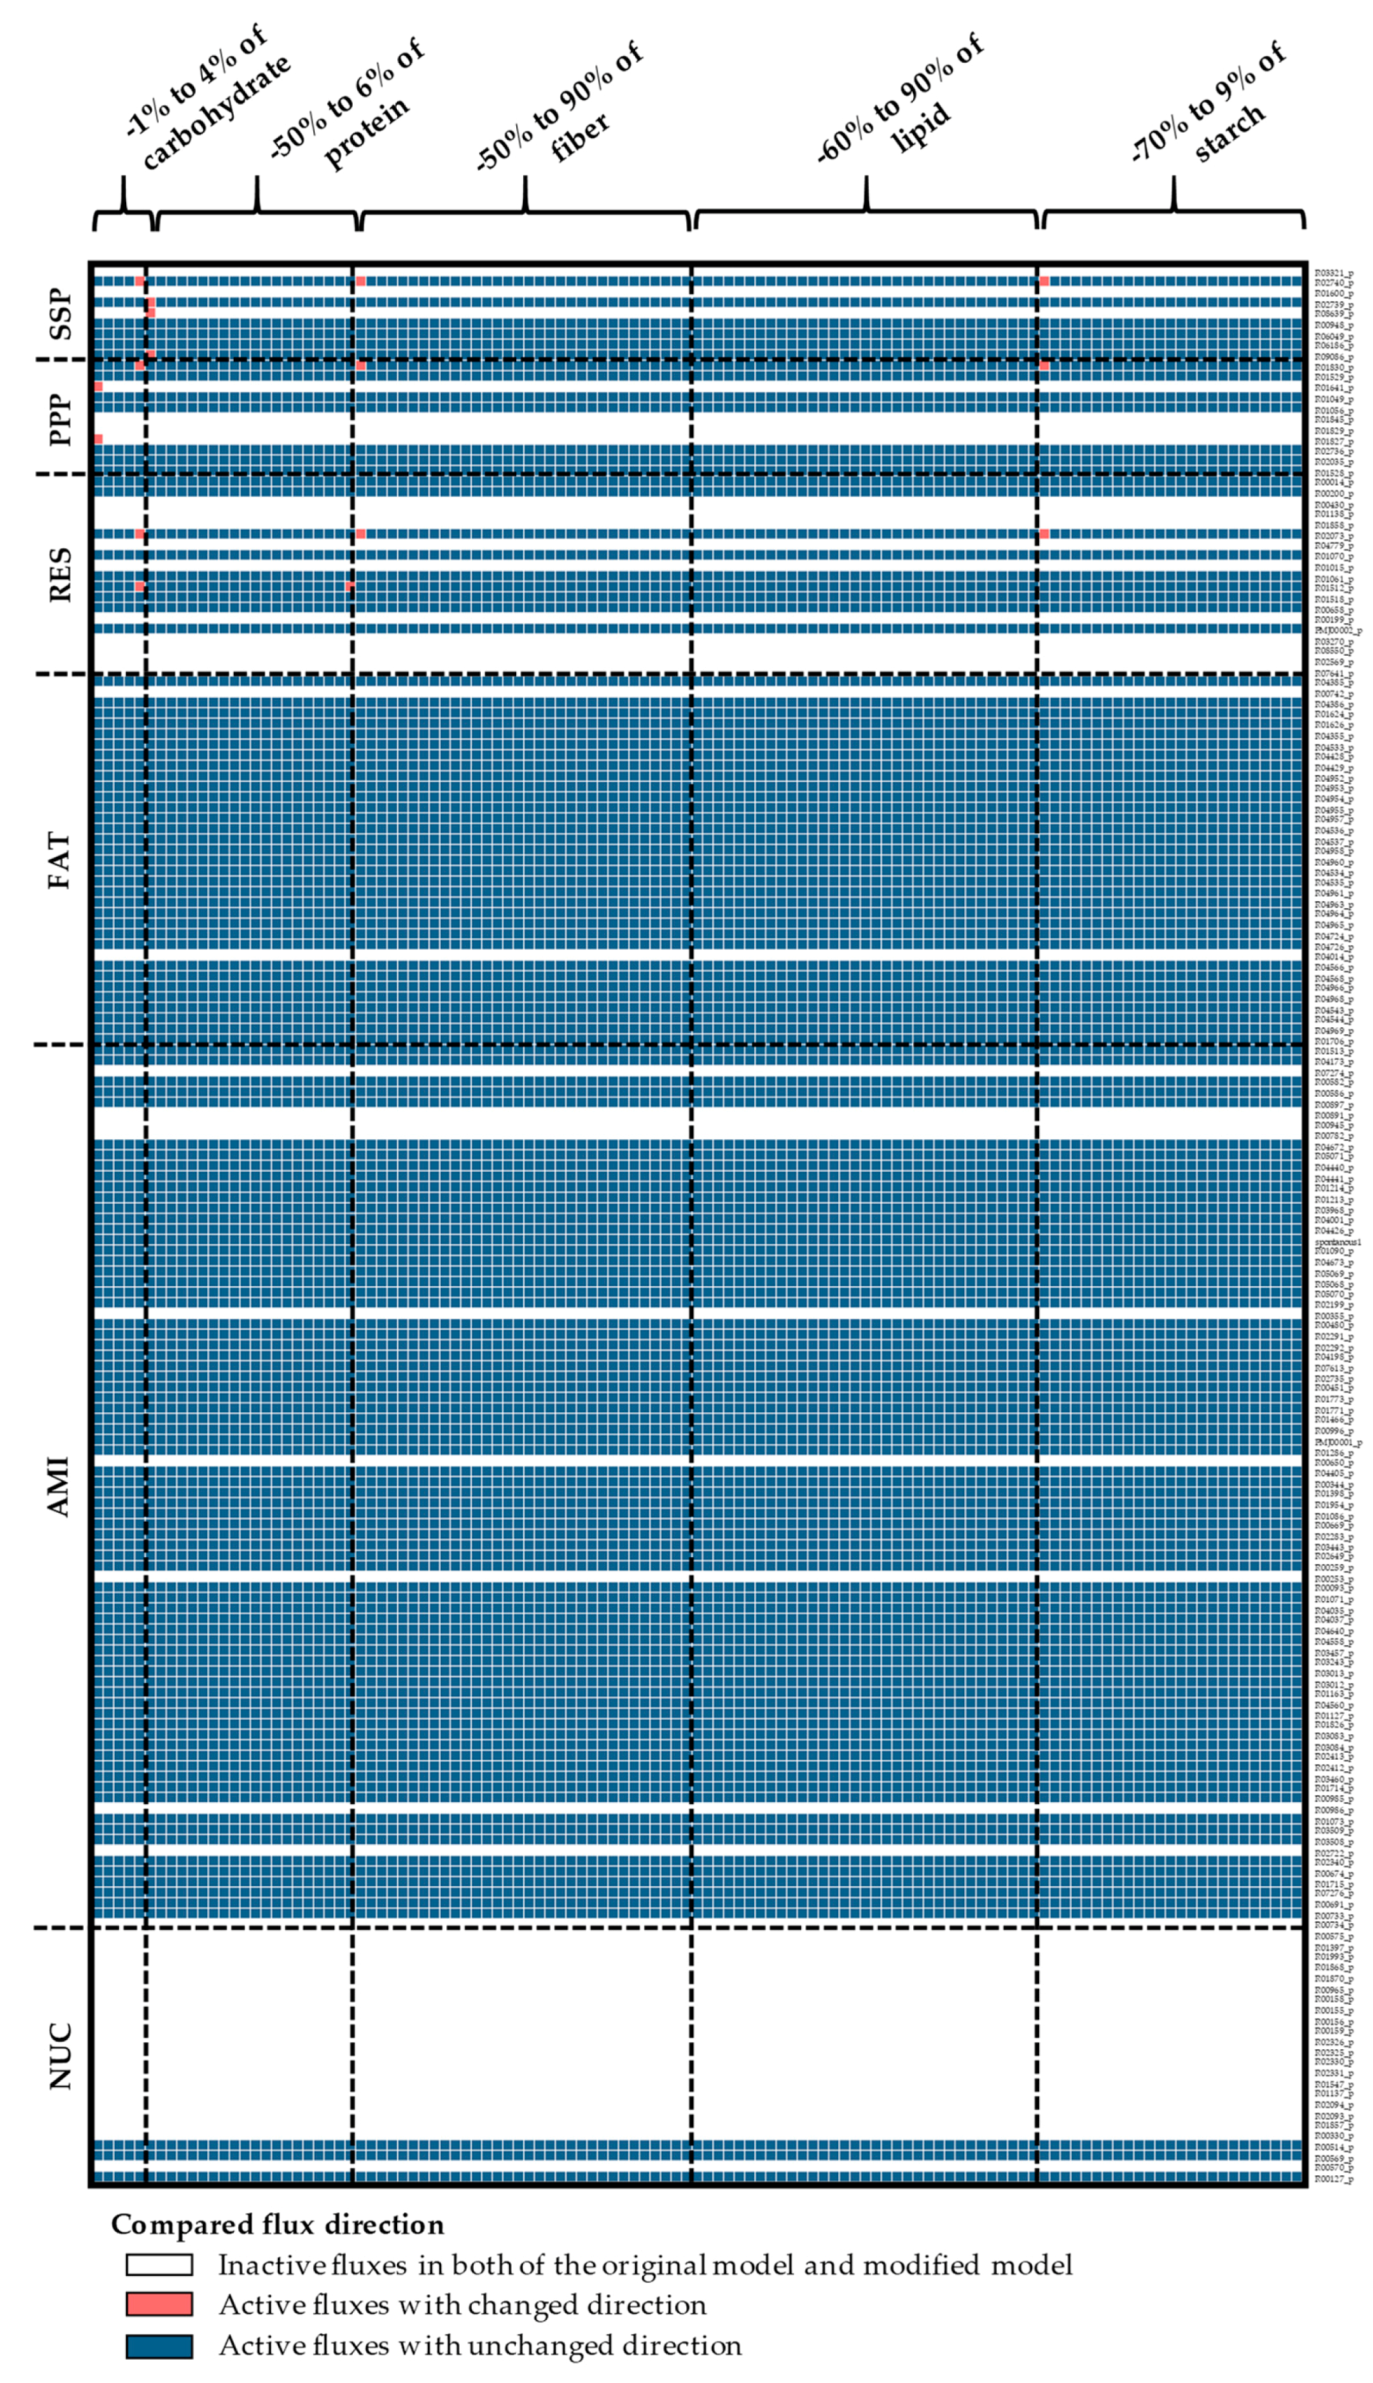
Figure A12.
The sensitivity of transport and exchange reaction flux direction to variations in biomass content. Inactive reactions containing zero fluxes are denoted by white-colored grids. Active reactions, non-zero fluxes, with similar flux direction as the original model are denoted by blue grids; while those with dissimilar flux direction (breakpoint) are denoted by red grids. EXC, exchange reaction; TCM, transport reaction between cytosol and mitochondria; TCP, transport reaction between cytosol and plastid.

Figure A13.
The sensitivity of cytosolic reaction flux partitioning to variations in biomass content. Details of the metabolic branch points along with the corresponding reactions are provided in the Supplementary Materials (File S2). A difference in grid color between the original (first column) and predicted fluxes is indicative of dissimilarity in partitioning (breakpoint). The production and consumption fluxes at each metabolic branch point were respectively denoted as positive and negative signs.
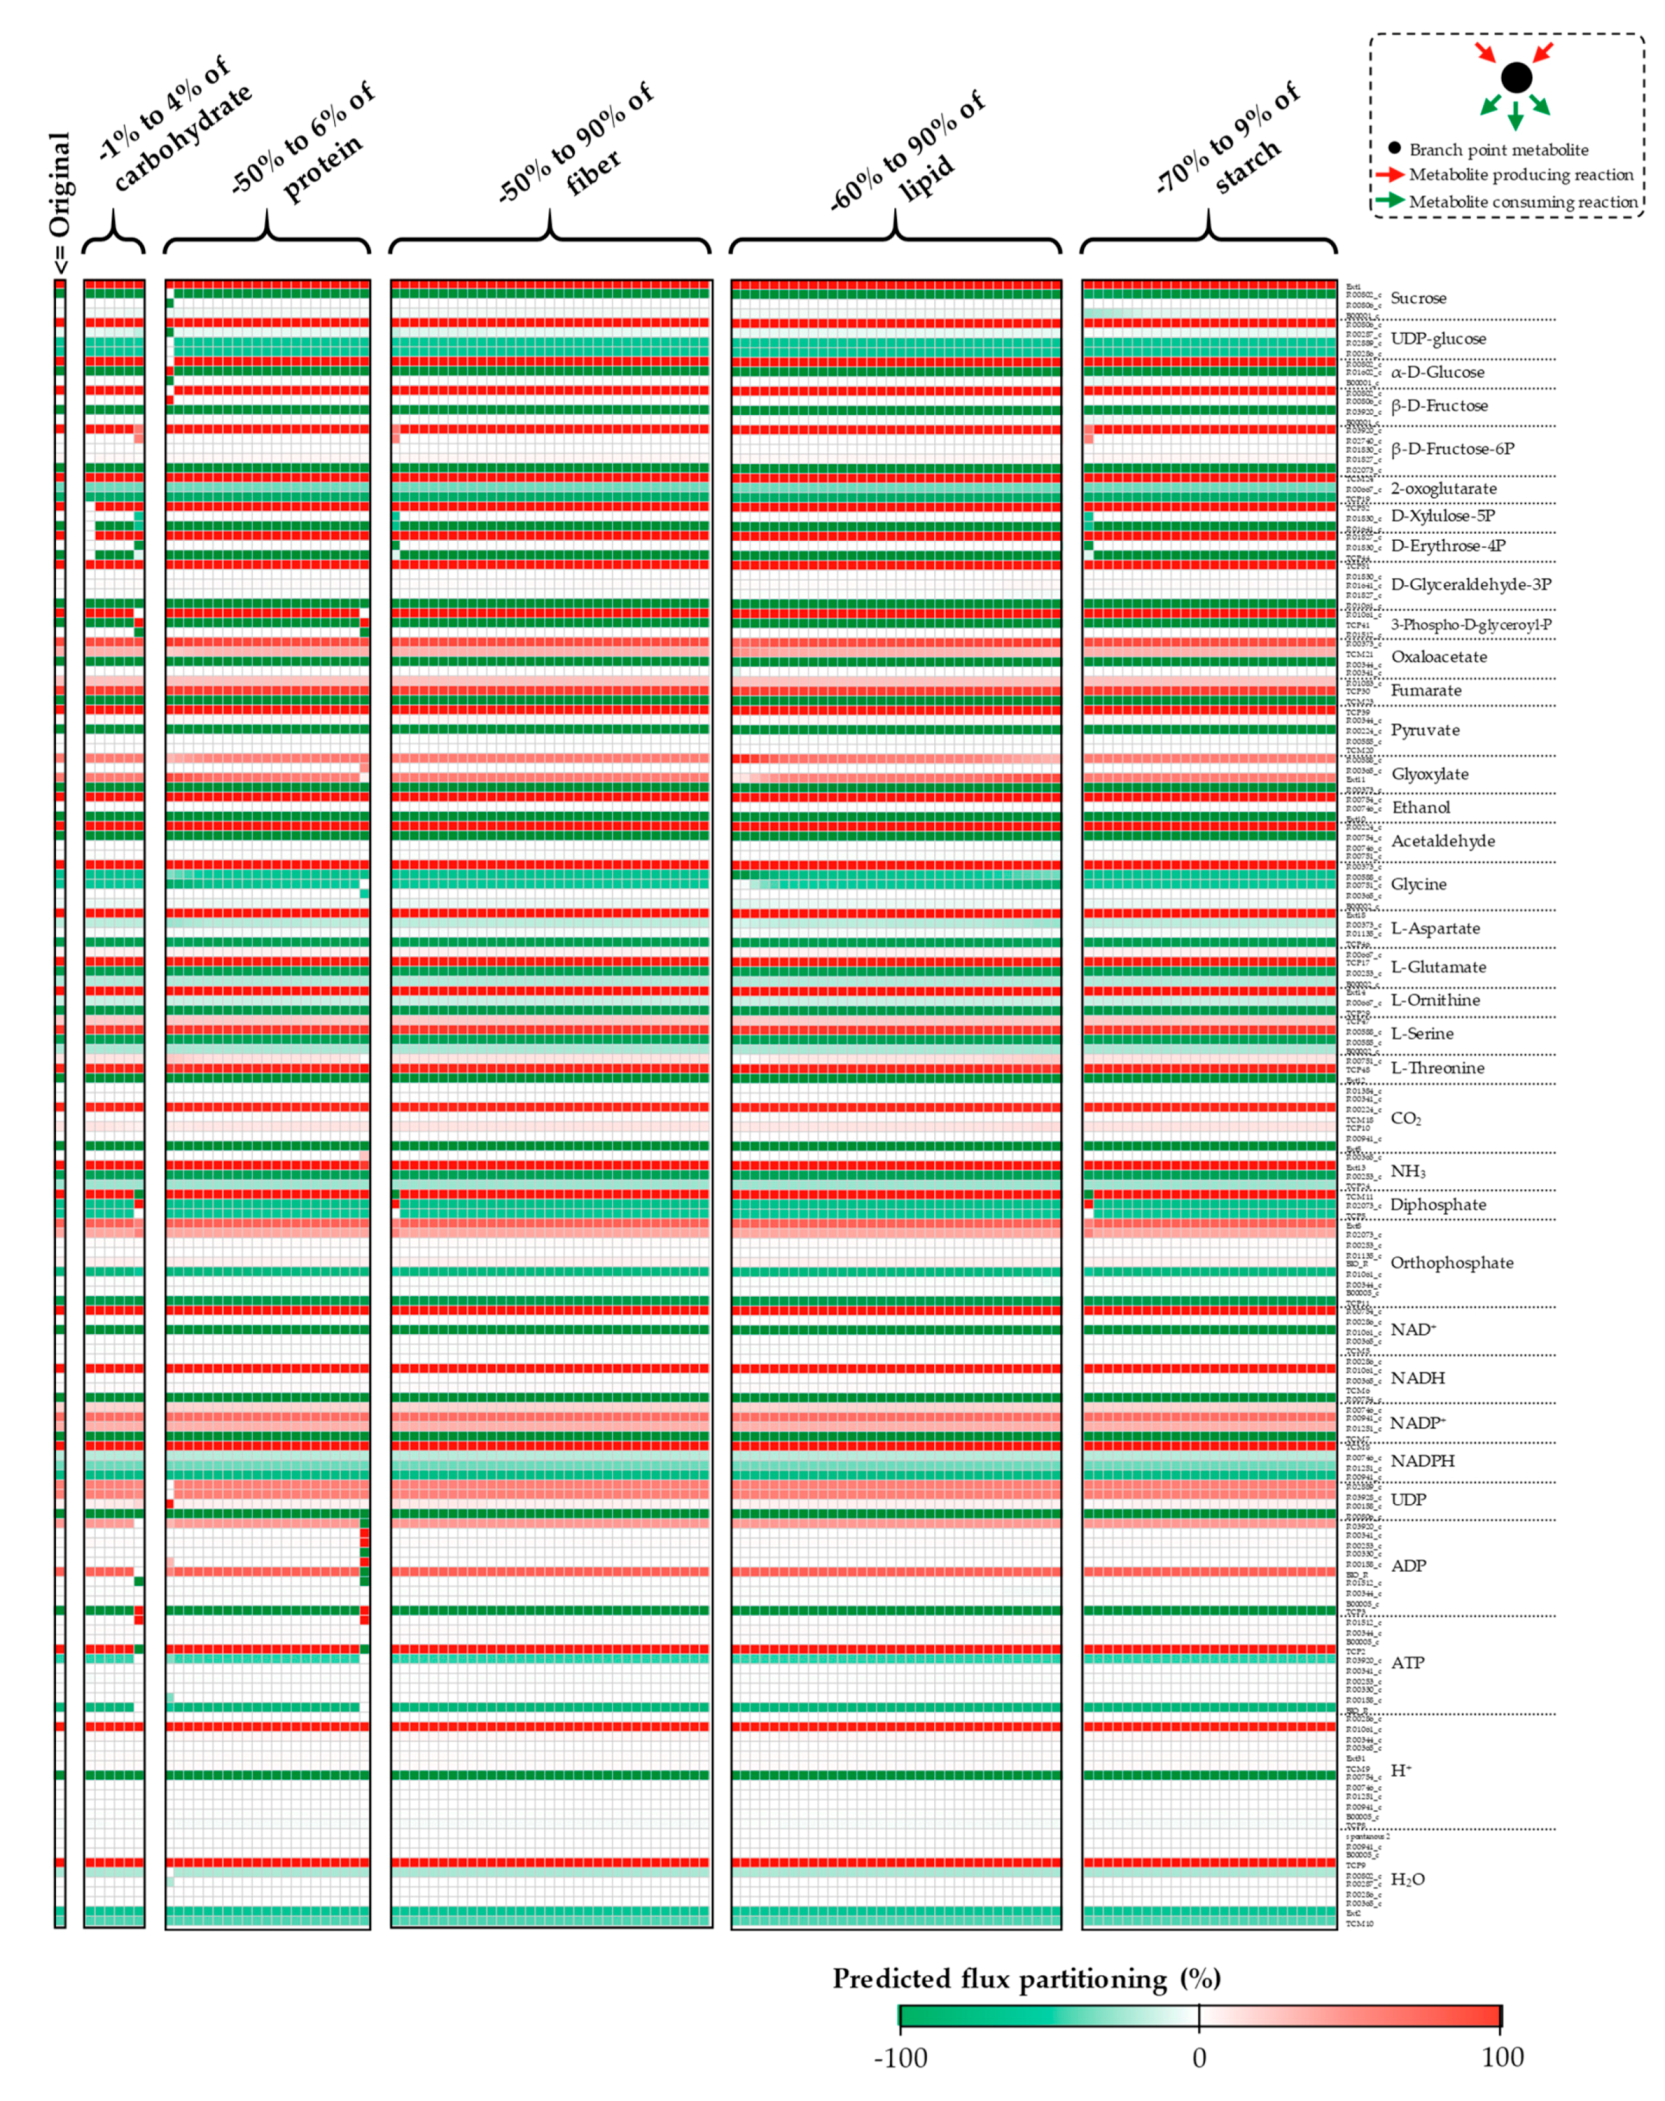
Figure A14.
The sensitivity of mitochondrial reaction flux partitioning to variations in biomass content. Details of the metabolic branch points along with the corresponding reactions are provided in the Supplementary Materials (File S2). A difference in grid color between the original (first column) and predicted fluxes is indicative of a dissimilarity in partitioning (breakpoint). The production and consumption fluxes at each metabolic branch point were respectively denoted as positive and negative signs.
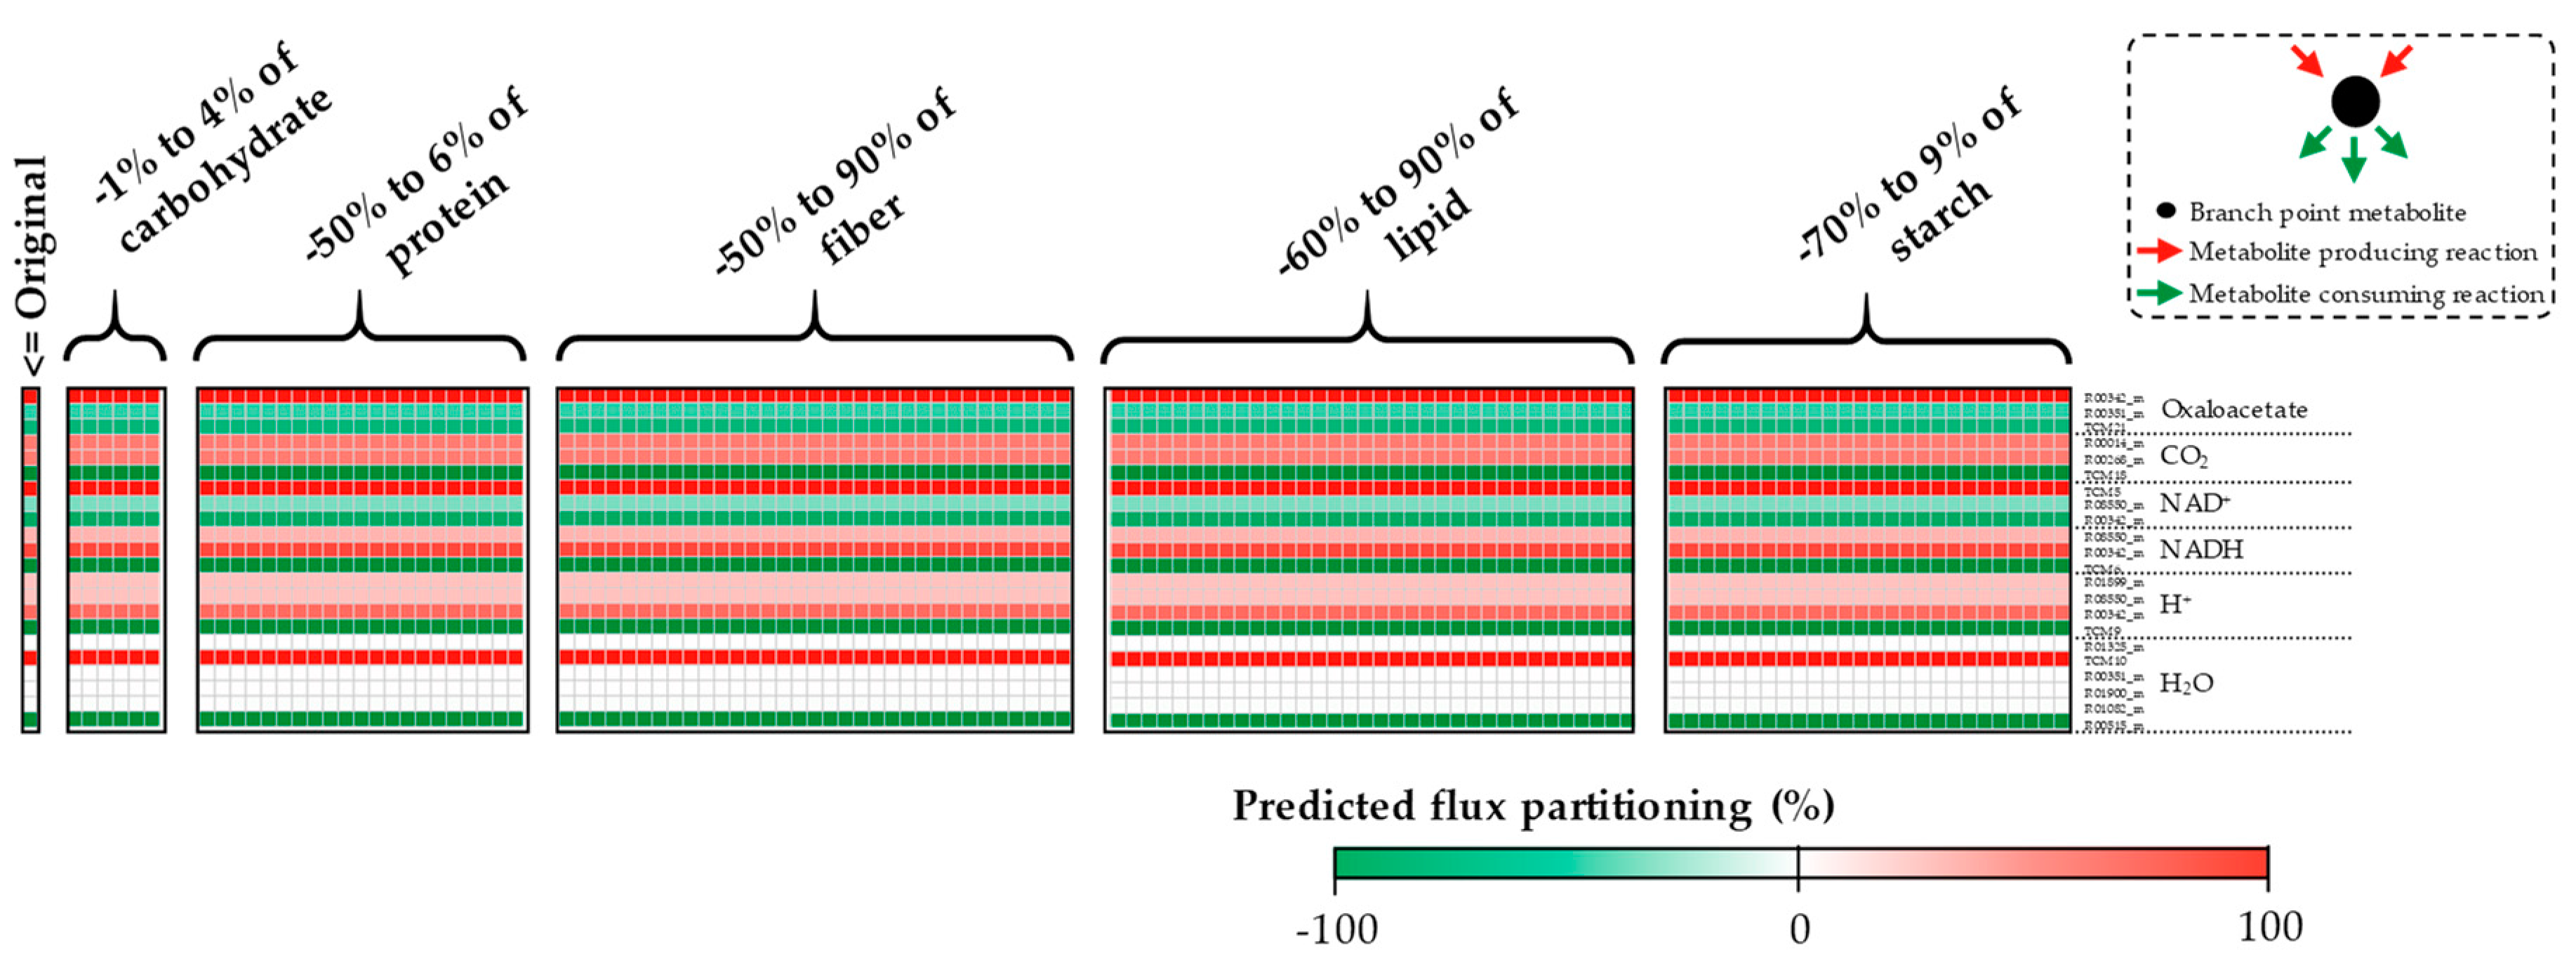
Figure A15.
The sensitivity of plastidial reaction flux partitioning to variations in biomass content. Details of the metabolic branch points along with the corresponding reactions are provided in the Supplementary Materials (File S2). A difference in grid color between the original (first column) and predicted fluxes is indicative of dissimilarity in partitioning (breakpoint). The production and consumption fluxes at each metabolic branch point were respectively denoted as positive and negative signs. 2-(α-Hydroxyethyl)ThPP, 2-(alpha-hydroxyethyl)thiamine-diphosphate.

References
- Allen, D.K.; Libourel, I.G.; Shachar-Hill, Y. Metabolic flux analysis in plants: Coping with complexity. Plant Cell Environ. 2009, 32, 1241–1257. [Google Scholar] [CrossRef]
- Orth, J.D.; Thiele, I.; Palsson, B.O. What is flux balance analysis? Nat. Biotechnol. 2010, 28, 245–248. [Google Scholar] [CrossRef]
- Lakshmanan, M.; Zhang, Z.; Mohanty, B.; Kwon, J.Y.; Choi, H.Y.; Nam, H.J.; Kim, D.I.; Lee, D.Y. Elucidating rice cell metabolism under flooding and drought stresses using flux-based modeling and analysis. Plant Physiol. 2013, 162, 2140–2150. [Google Scholar] [CrossRef] [PubMed]
- Chiewchankaset, P.; Siriwat, W.; Suksangpanomrung, M.; Boonseng, O.; Meechai, A.; Tanticharoen, M.; Kalapanulak, S.; Saithong, T. Understanding carbon utilization routes between high and low starch-producing cultivars of cassava through flux balance analysis. Sci. Rep. 2019, 9, 2964. [Google Scholar] [CrossRef]
- Colombié, S.; Nazaret, C.; Bénard, C.; Biais, B.; Mengin, V.; Solé, M.; Fouillen, L.; Dieuaide-Noubhani, M.; Mazat, J.P.; Beauvoit, B.; et al. Modelling central metabolic fluxes by constraint-based optimization reveals metabolic reprogramming of developing Solanum lycopersicum (tomato) fruit. Plant J. 2015, 81, 24–39. [Google Scholar] [CrossRef]
- Hay, J.O.; Schwender, J. Metabolic network reconstruction and flux variability analysis of storage synthesis in developing oilseed rape (Brassica napus L.) embryos. Plant J. 2011, 67, 526–541. [Google Scholar] [CrossRef] [PubMed]
- Rolletschek, H.; Grafahrend-Belau, E.; Munz, E.; Radchuk, V.; Kartausch, R.; Tschiersch, H.; Melkus, G.; Schreiber, F.; Jakob, P.M.; Borisjuk, L. Metabolic architecture of the cereal grain and its relevance to maximize carbon use efficiency. Plant Physiol. 2015, 169, 1698–1713. [Google Scholar] [CrossRef] [PubMed]
- Collakova, E.; Yen, J.Y.; Senger, R.S. Are we ready for genome-scale modeling in plants? Plant Sci. 2012, 191, 53–70. [Google Scholar] [CrossRef]
- Zuniga, C.; Levering, J.; Antoniewicz, M.R.; Guarnieri, M.T.; Betenbaugh, M.J.; Zengler, K. Predicting dynamic metabolic demands in the photosynthetic eukaryote Chlorella vulgaris. Plant Physiol. 2018, 176, 450–462. [Google Scholar] [CrossRef] [PubMed]
- Brandl, J.; Andersen, M.R. Current state of genome-scale modeling in filamentous fungi. Biotechnol. Lett. 2015, 37, 1131–1139. [Google Scholar] [CrossRef]
- Bro, C.; Regenberg, B.; Förster, J.; Nielsen, J. In silico aided metabolic engineering of Saccharomyces cerevisiae for improved bioethanol production. Metab. Eng. 2006, 8, 102–111. [Google Scholar] [CrossRef] [PubMed]
- Edwards, J.S.; Ibarra, R.U.; Palsson, B.O. In silico predictions of Escherichia coli metabolic capabilities are consistent with experimental data. Nat. Biotechnol. 2001, 19, 125–130. [Google Scholar]
- Edwards, J.S.; Palsson, B.O. Systems properties of the Haemophilus influenzaeRd metabolic genotype. J. Biol. Chem. 1999, 274, 17410–17416. [Google Scholar] [CrossRef] [PubMed]
- Edwards, J.S.; Palsson, B.O. The Escherichia coli MG1655 in silico metabolic genotype: Its definition, characteristics, and capabilities. Proc. Natl. Acad. Sci. USA 2000, 97, 5528–5533. [Google Scholar] [CrossRef]
- Förster, J.; Famili, I.; Fu, P.; Palsson, B.O.; Nielsen, J. Genome-scale reconstruction of the Saccharomyces cerevisiae metabolic network. Genome Res. 2003, 13, 244–253. [Google Scholar] [CrossRef] [PubMed]
- Rau, M.H.; Zeidan, A.A. Constraint-based modeling in microbial food biotechnology. Biochem. Soc. Trans. 2018, 46, 249–260. [Google Scholar] [CrossRef]
- Teusink, B.; Wiersma, A.; Molenaar, D.; Francke, C.; de Vos, W.M.; Siezen, R.J.; Smid, E.J. Analysis of growth of Lactobacillus plantarum WCFS1 on a complex medium using a genome-scale metabolic model. J. Biol. Chem. 2006, 281, 40041–40048. [Google Scholar] [CrossRef]
- Poolman, M.G.; Miguet, L.; Sweetlove, L.J.; Fell, D.A. A genome-scale metabolic model of Arabidopsis and some of its properties. Plant Physiol. 2009, 151, 1570–1581. [Google Scholar] [CrossRef]
- de Oliveira Dal’Molin, C.G.; Quek, L.E.; Palfreyman, R.W.; Brumbley, S.M.; Nielsen, L.K. AraGEM, a genome-scale reconstruction of the primary metabolic network in Arabidopsis. Plant Physiol. 2010, 152, 579–589. [Google Scholar] [CrossRef]
- Saha, R.; Suthers, P.F.; Maranas, C.D. Zea mays iRS1563: A comprehensive genome-scale metabolic reconstruction of maize metabolism. PLoS ONE 2011, 6, e21784. [Google Scholar]
- Pilalis, E.; Chatziioannou, A.; Thomasset, B.; Kolisis, F. An in silico compartmentalized metabolic model of Brassica napus enables the systemic study of regulatory aspects of plant central metabolism. Biotechnol. Bioeng. 2011, 108, 1673–1682. [Google Scholar] [CrossRef]
- Grafahrend-Belau, E.; Schreiber, F.; Koschützki, D.; Junker, B.H. Flux balance analysis of barley seeds: A computational approach to study systemic properties of central metabolism. Plant Physiol. 2009, 149, 585–598. [Google Scholar] [CrossRef]
- Hamilton, J.J.; Reed, J.L. Software platforms to facilitate reconstructing genome-scale metabolic networks. Environ. Microbiol. 2014, 16, 49–59. [Google Scholar] [CrossRef]
- Thiele, I.; Palsson, B.O. A protocol for generating a high-quality genome-scale metabolic reconstruction. Nat. Protoc. 2010, 5, 93–121. [Google Scholar] [CrossRef] [PubMed]
- Zomorrodi, A.R.; Suthers, P.F.; Ranganathan, S.; Maranas, C.D. Mathematical optimization applications in metabolic networks. Metab. Eng. 2012, 14, 672–686. [Google Scholar] [CrossRef] [PubMed]
- Cheung, C.M.; Williams, T.C.; Poolman, M.G.; Fell, D.A.; Ratcliffe, R.G.; Sweetlove, L.J. A method for accounting for maintenance costs in flux balance analysis improves the prediction of plant cell metabolic phenotypes under stress conditions. Plant J. 2013, 75, 1050–1061. [Google Scholar] [CrossRef]
- Feist, A.M.; Palsson, B.O. The biomass objective function. Curr. Opin. Microbiol. 2010, 13, 344–349. [Google Scholar] [CrossRef] [PubMed]
- Schwender, J.; Hay, J.O. Predictive modeling of biomass component tradeoffs in Brassica napus developing oilseeds based on in silico manipulation of storage metabolism. Plant Physiol. 2012, 160, 1218–1236. [Google Scholar] [CrossRef] [PubMed]
- Feist, A.M.; Henry, C.S.; Reed, J.L.; Krummenacker, M.; Joyce, A.R.; Karp, P.D.; Broadbelt, L.J.; Hatzimanikatis, V.; Palsson, B.O. A genome-scale metabolic reconstruction for Escherichia coli K-12 MG1655 that accounts for 1260 ORFs and thermodynamic information. Mol. Syst. Biol. 2007, 3, 121. [Google Scholar] [CrossRef] [PubMed]
- Yuan, H.; Cheung, C.Y.M.; Hilbers, P.A.J.; van Riel, N.A.W. Flux balance analysis of plant metabolism: The effect of biomass composition and model structure on model predictions. Front Plant Sci. 2016, 7, 537. [Google Scholar] [CrossRef] [PubMed]
- Nookaew, I.; Jewett, M.C.; Meechai, A.; Thammarongtham, C.; Laoteng, K.; Cheevadhanarak, S.; Nielsen, J.; Bhumiratana, S. The genome-scale metabolic model iIN800 of Saccharomyces cerevisiae and its validation: A scaffold to query lipid metabolism. BMC Syst. Biol. 2008, 2, 71. [Google Scholar] [CrossRef] [PubMed]
- Dikicioglu, D.; Kırdar, B.; Oliver, S.G. Biomass composition: The “elephant in the room” of metabolic modelling. Metabolomics 2015, 11, 1690–1701. [Google Scholar] [CrossRef] [PubMed]
- Howeler, R.H.; Lutaladio, N.; Thomas, G. Cassava, a 21st century crop. In Save and Grow Cassava: A Guide to Sustainable Production Intensification; Howeler, R.H., Lutaladio, N., Thomas, G., Eds.; FAO: Roma, Italy, 2013; pp. 1–18. [Google Scholar]
- Jorge, M.A. Regeneration guidelines: Cassava. In Crop Specific Regeneration Guidelines [CD-ROM]; Dulloo, M.E., Thormann, I., Jorge, M.A., Hanson, J., Eds.; CGIAR Systemwide Genetic Resource Programme (SGRS), Global Crop Diversity Trust: Rome, Italy, 2008; p. 9. [Google Scholar]
- Meléndez-Hevia, E.; de Paz-Lugo, P. Branch-point stoichiometry can generate weak links in metabolism: The case of glycine biosynthesis. J. Biosci. 2008, 33, 771–780. [Google Scholar] [CrossRef]
- Schellenberger, J.; Que, R.; Fleming, R.M.; Thiele, I.; Orth, J.D.; Feist, A.M.; Zielinski, D.C.; Bordbar, A.; Lewis, N.E.; Rahmanian, S.; et al. Quantitative prediction of cellular metabolism with constraint-based models: The COBRA Toolbox v2.0. Nat. Protoc. 2011, 6, 1290–1307. [Google Scholar] [CrossRef]
- El-Sharkawy, M.A.; De Tafur, S.M. Comparative photosynthesis, growth, productivity, and nutrient use efficiency among tall- and short-stemmed rain-fed cassava cultivars. Photosynthetica 2010, 48, 173–188. [Google Scholar] [CrossRef]
- Alves, A.A.C. Cassava botany and physiology. In Cassava: Biology, Production and Utilization; Hillocks, R.J., Thresh, J.M., Bellotti, A.C., Eds.; CAB International Publishing: Wallingford, UK, 2002; pp. 67–89. [Google Scholar]
- Mahon, J.D.; Lowe, S.B.; Hunt, L.A.; Thiagarajah, M. Environmental effects on photosynthesis and transpiration in attached leaves of cassava (Manihot esculenta Crantz). Photosynthetica 1977, 11, 121–130. [Google Scholar]
- Edwards, G.E.; Sheta, E.; Moore, B.D.; Dai, Z.; Franceschi, V.R.; Cheng, S.H.; Lin, C.H.; Ku, M.S. Photosynthetic characteristics of cassava (Manihot esculenta Crantz), a C3 species with chlorenchymatous bundle sheath cells. Plant Cell Physiol. 1990, 31, 1199–1206. [Google Scholar]
- El-Sharkawy, M.A.; Cock, J.H. Photosynthesis of cassava (Manihot esculenta). Exp Agr. 1990, 26, 325–340. [Google Scholar] [CrossRef]
- Ramanujam, T.; Indira, P. Canopy structure on growth and development of cassava (Manihot esculenta Crantz). Turrialba 1983, 33, 321–327. [Google Scholar]
- El-Sharkawy, M.A.; Cock, J.H.; Lynam, J.K.; del Pilar Hernàndez, A.; Cadavid, L.F.L. Relationships between biomass, root-yield and single-leaf photosynthesis in field-grown cassava. Field Crops Res. 1990, 25, 183–201. [Google Scholar] [CrossRef]
- Boonseng, O.; Tungsakol, S.; Chuthangkha, S.; Hansethasuk, J. Evaluation of cassava germplasm for database in breeding and utilization. In Cassava Research Report in 1999-2001 (4215500022-4415500060); Department of Agriculture, Planning and Technical Division, Department of Agriculture (DOA): Bangkok, Thailand, 1999; pp. 73–106. [Google Scholar]
- Nuwamanya, E.; Baguma, Y.; Kawuki, R.S.; Rubaihayo, P.R. Quantification of starch physicochemical characteristics in a cassava segregating population. Afr. Crop Sci. J. 2008, 16, 191–202. [Google Scholar] [CrossRef]
- Stincone, A.; Prigione, A.; Cramer, T.; Wamelink, M.M.; Campbell, K.; Cheung, E.; Olin-Sandoval, V.; Grüning, N.M.; Krüger, A.; Tauqeer Alam, M.; et al. The return of metabolism: Biochemistry and physiology of the pentose phosphate pathway. Biol. Rev. Camb. Philos. Soc. 2015, 90, 927–963. [Google Scholar] [PubMed]
- De Souza, A.P.; Massenburg, L.N.; Jaiswal, D.; Cheng, S.; Shekar, R.; Long, S.P. Rooting for cassava: Insights into photosynthesis and associated physiology as a route to improve yield potential. New Phytol. 2017, 213, 50–65. [Google Scholar] [CrossRef] [PubMed]
Figure 1.
Overall framework of rMeCBM-KU50 model assessment to changes of (a) substrate–uptake related data (i.e., the specific sucrose uptake rate, photosynthetic rate, total leaf area, storage root dry weight, and total photosynthetic rate) and (b) the biomass function-related data (i.e., composition of biomass components). Each data variation, the sensitivity analysis of model prediction examined the changes in the predicted growth rate, as well as the changes of metabolic flux direction and partitioning. Inactive fluxes refer to zero-flux reactions (gray arrows). Active fluxes refer to non-zero flux reactions (black arrows—with unchanged direction; and red arrows—with changed direction). The thickness of the arrows indicates the flux magnitude.

Figure 2.
Model sensitivity to changes in the photosynthetic rate, total leaf area, storage root dry weight, and total photosynthetic rate, regarding (a) specific sucrose uptake rate and (b) percent variation in the specific sucrose uptake rate compared to the original value. The black dashed line denotes the original value of the specific sucrose uptake rate. The red circle denotes the breakpoint, where the predicted carbon flux direction and partitioning differed from the original values in the rMeCBM-KU50 model.
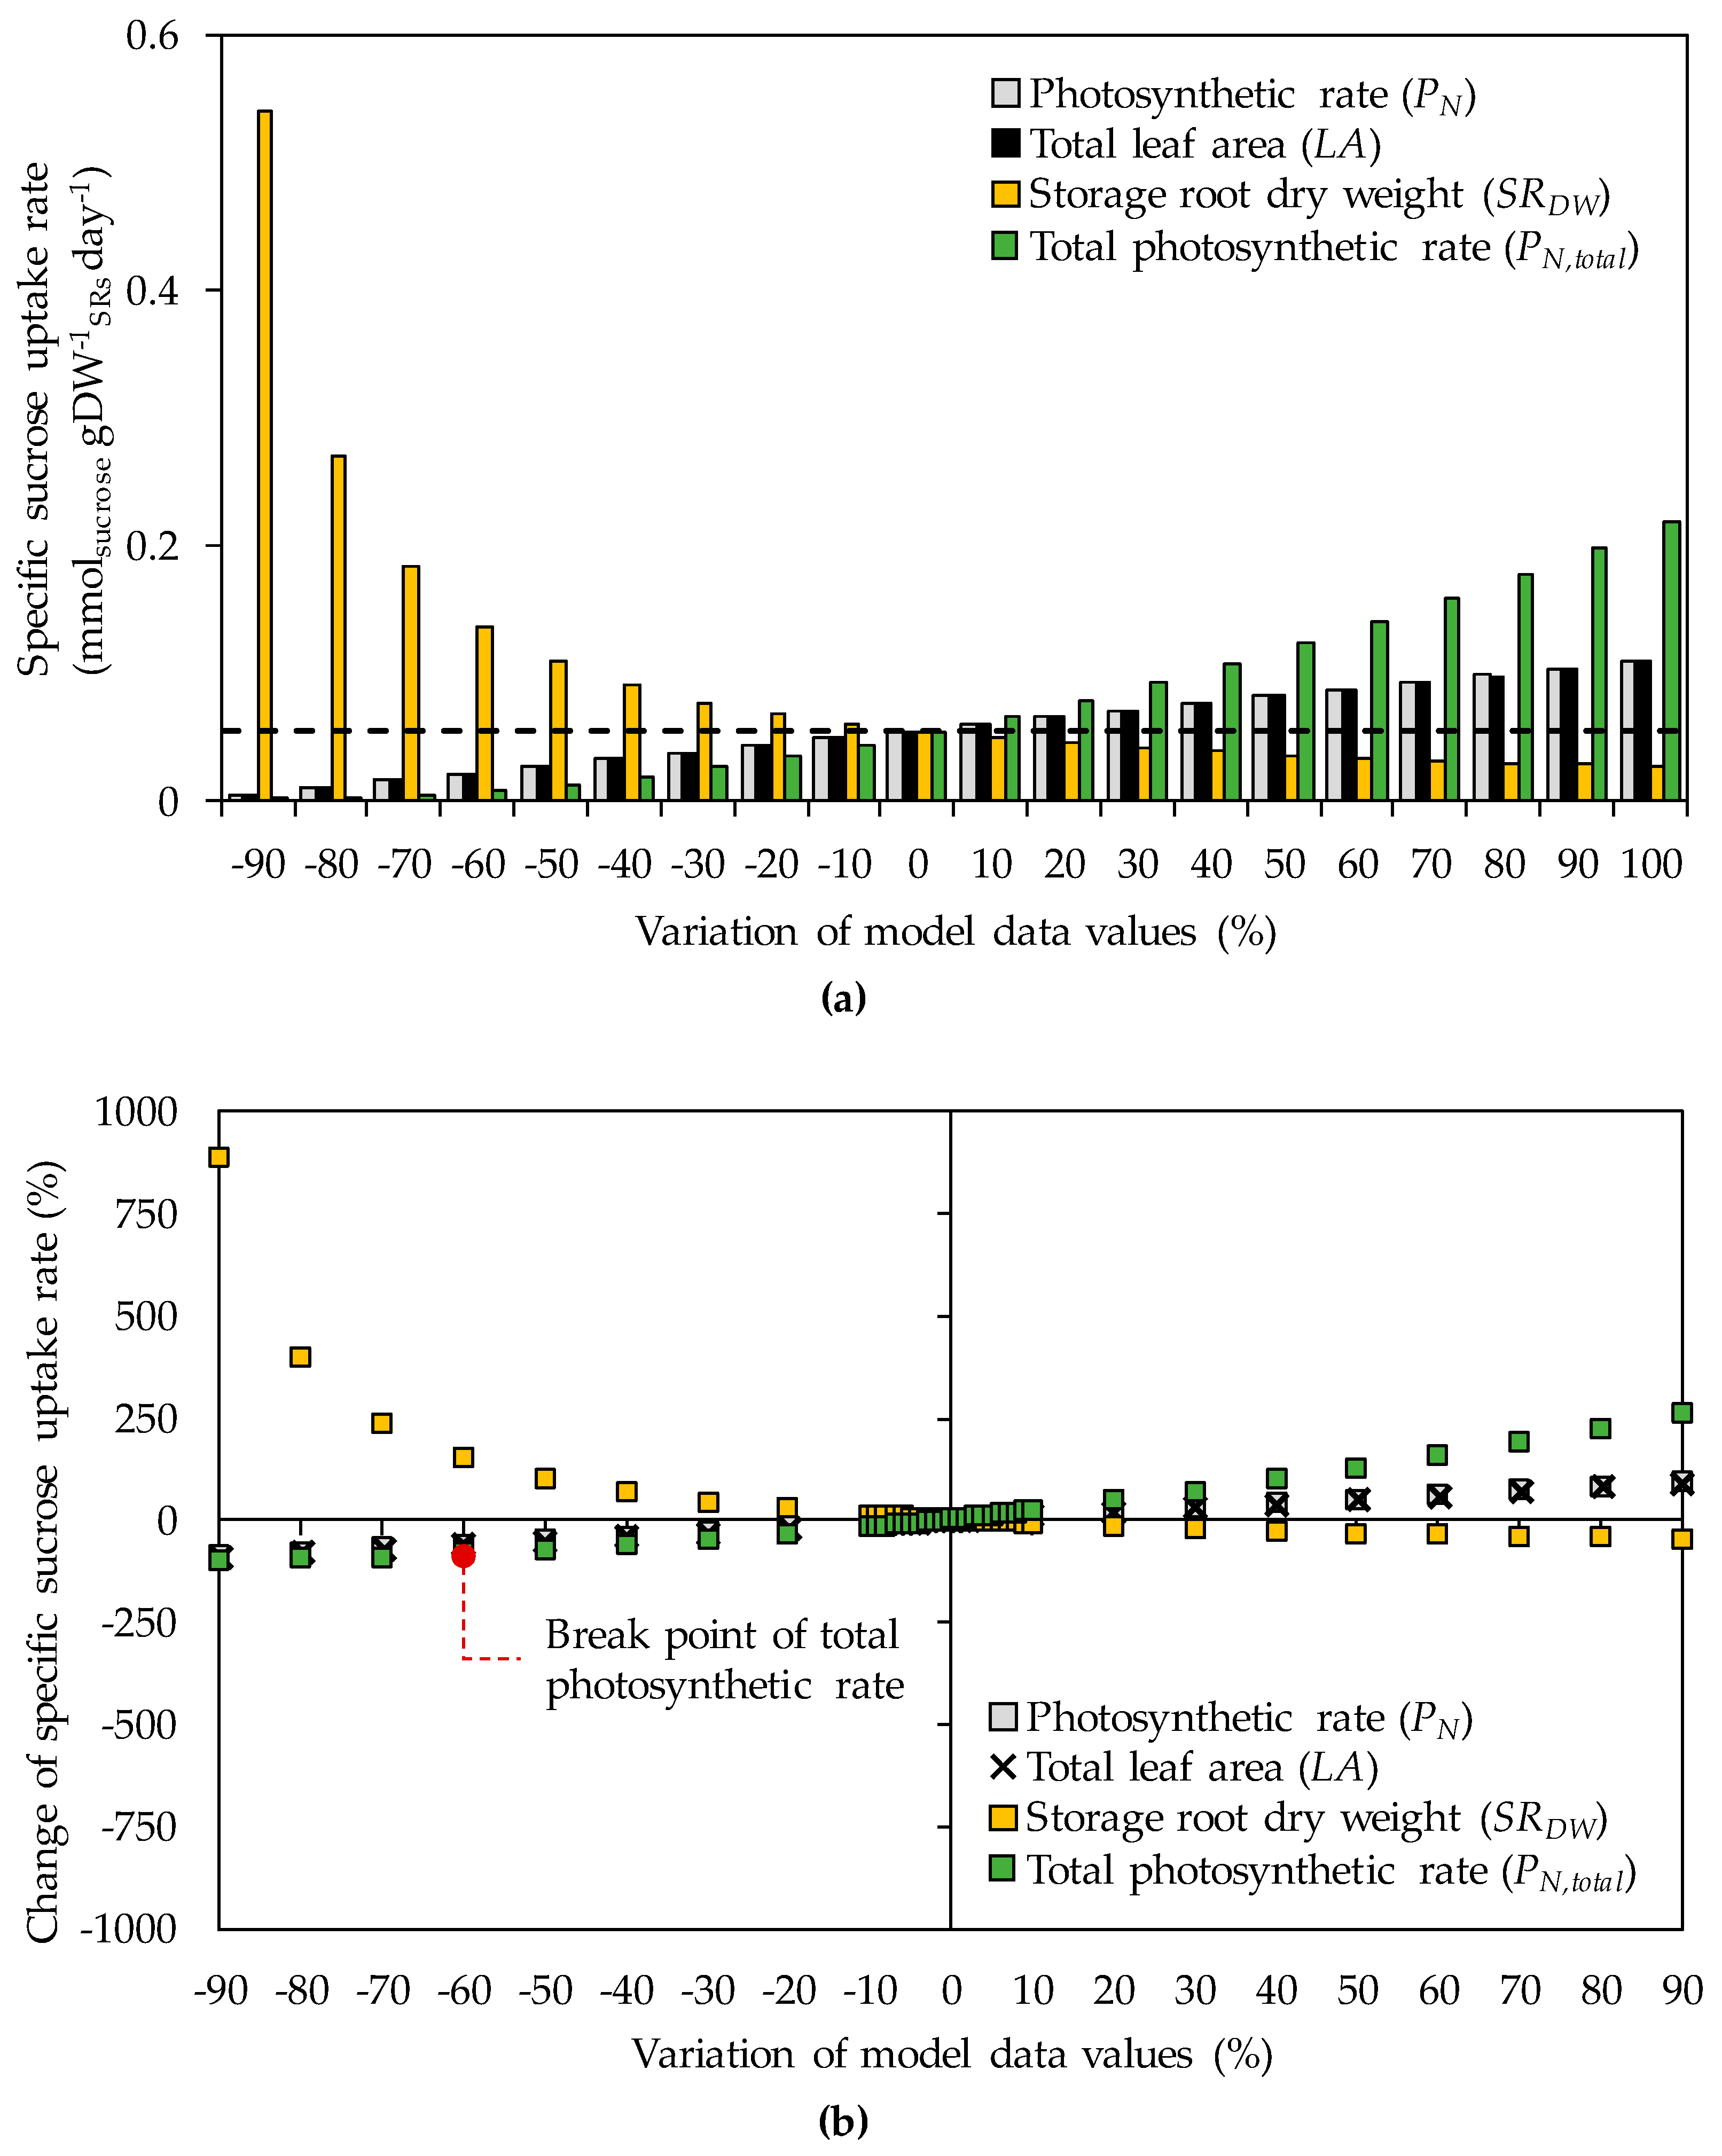
Figure 3.
The sensitivity of the predicted specific storage root growth rates to specific sucrose uptake rates (right panel), calculated by varying (a) the photosynthetic rate, (b) total leaf area, (c) total photosynthetic rate, and (d) storage root dry weight (left panel) within ±90% of the original values. Red crosses denote experimentally derived, original model default values, while the areas highlighted in gray indicate the range of possible values reported in the literature [37,38,39,40,41,42,43].
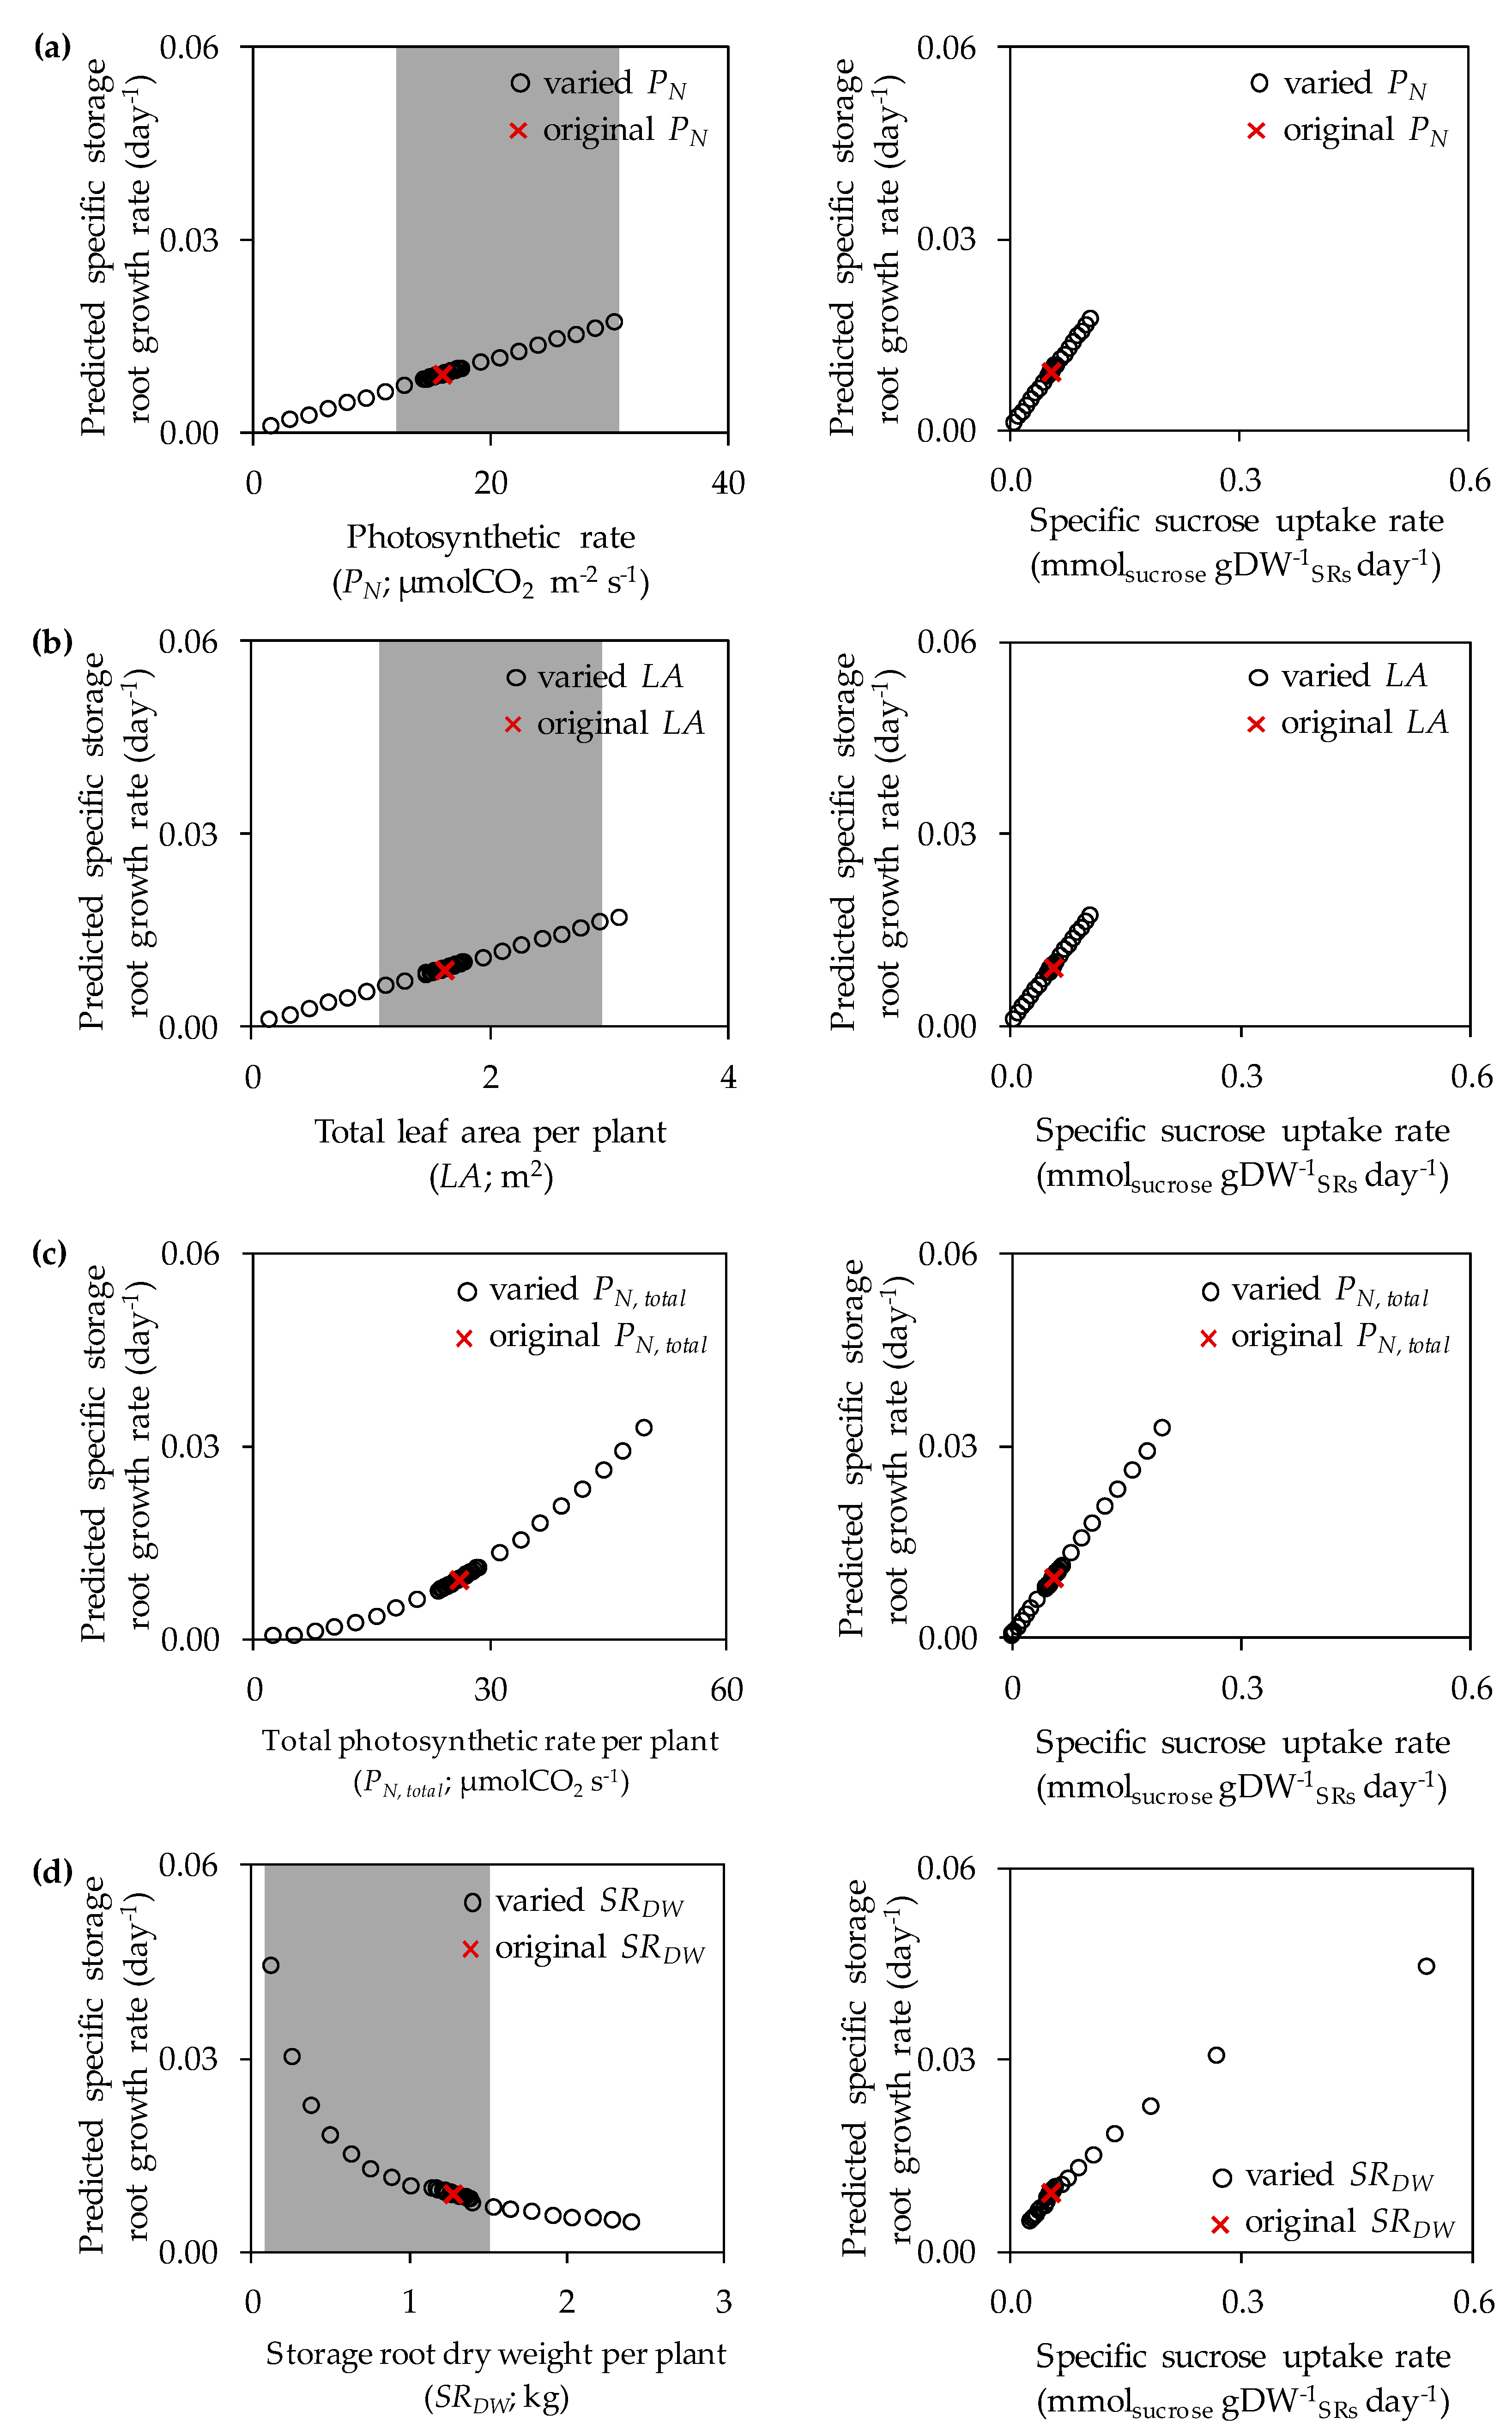
Figure 4.
The predicted storage root growth rate of the rMeCBM-KU50 model with the varied biomass function related data: (a) Carbohydrates, (b) lipids, (c) proteins, (d) starch, and (e) fibers. The biomass content range used, highlighted in gray, was based on values reported for storage roots of several cultivars [44]. A red circle denotes the breakpoint, where the flux direction or partitioning, obtained by varying the biomass contents, differed from the original model. A red cross denotes the original simulation of the rMeCBM-KU50 model.
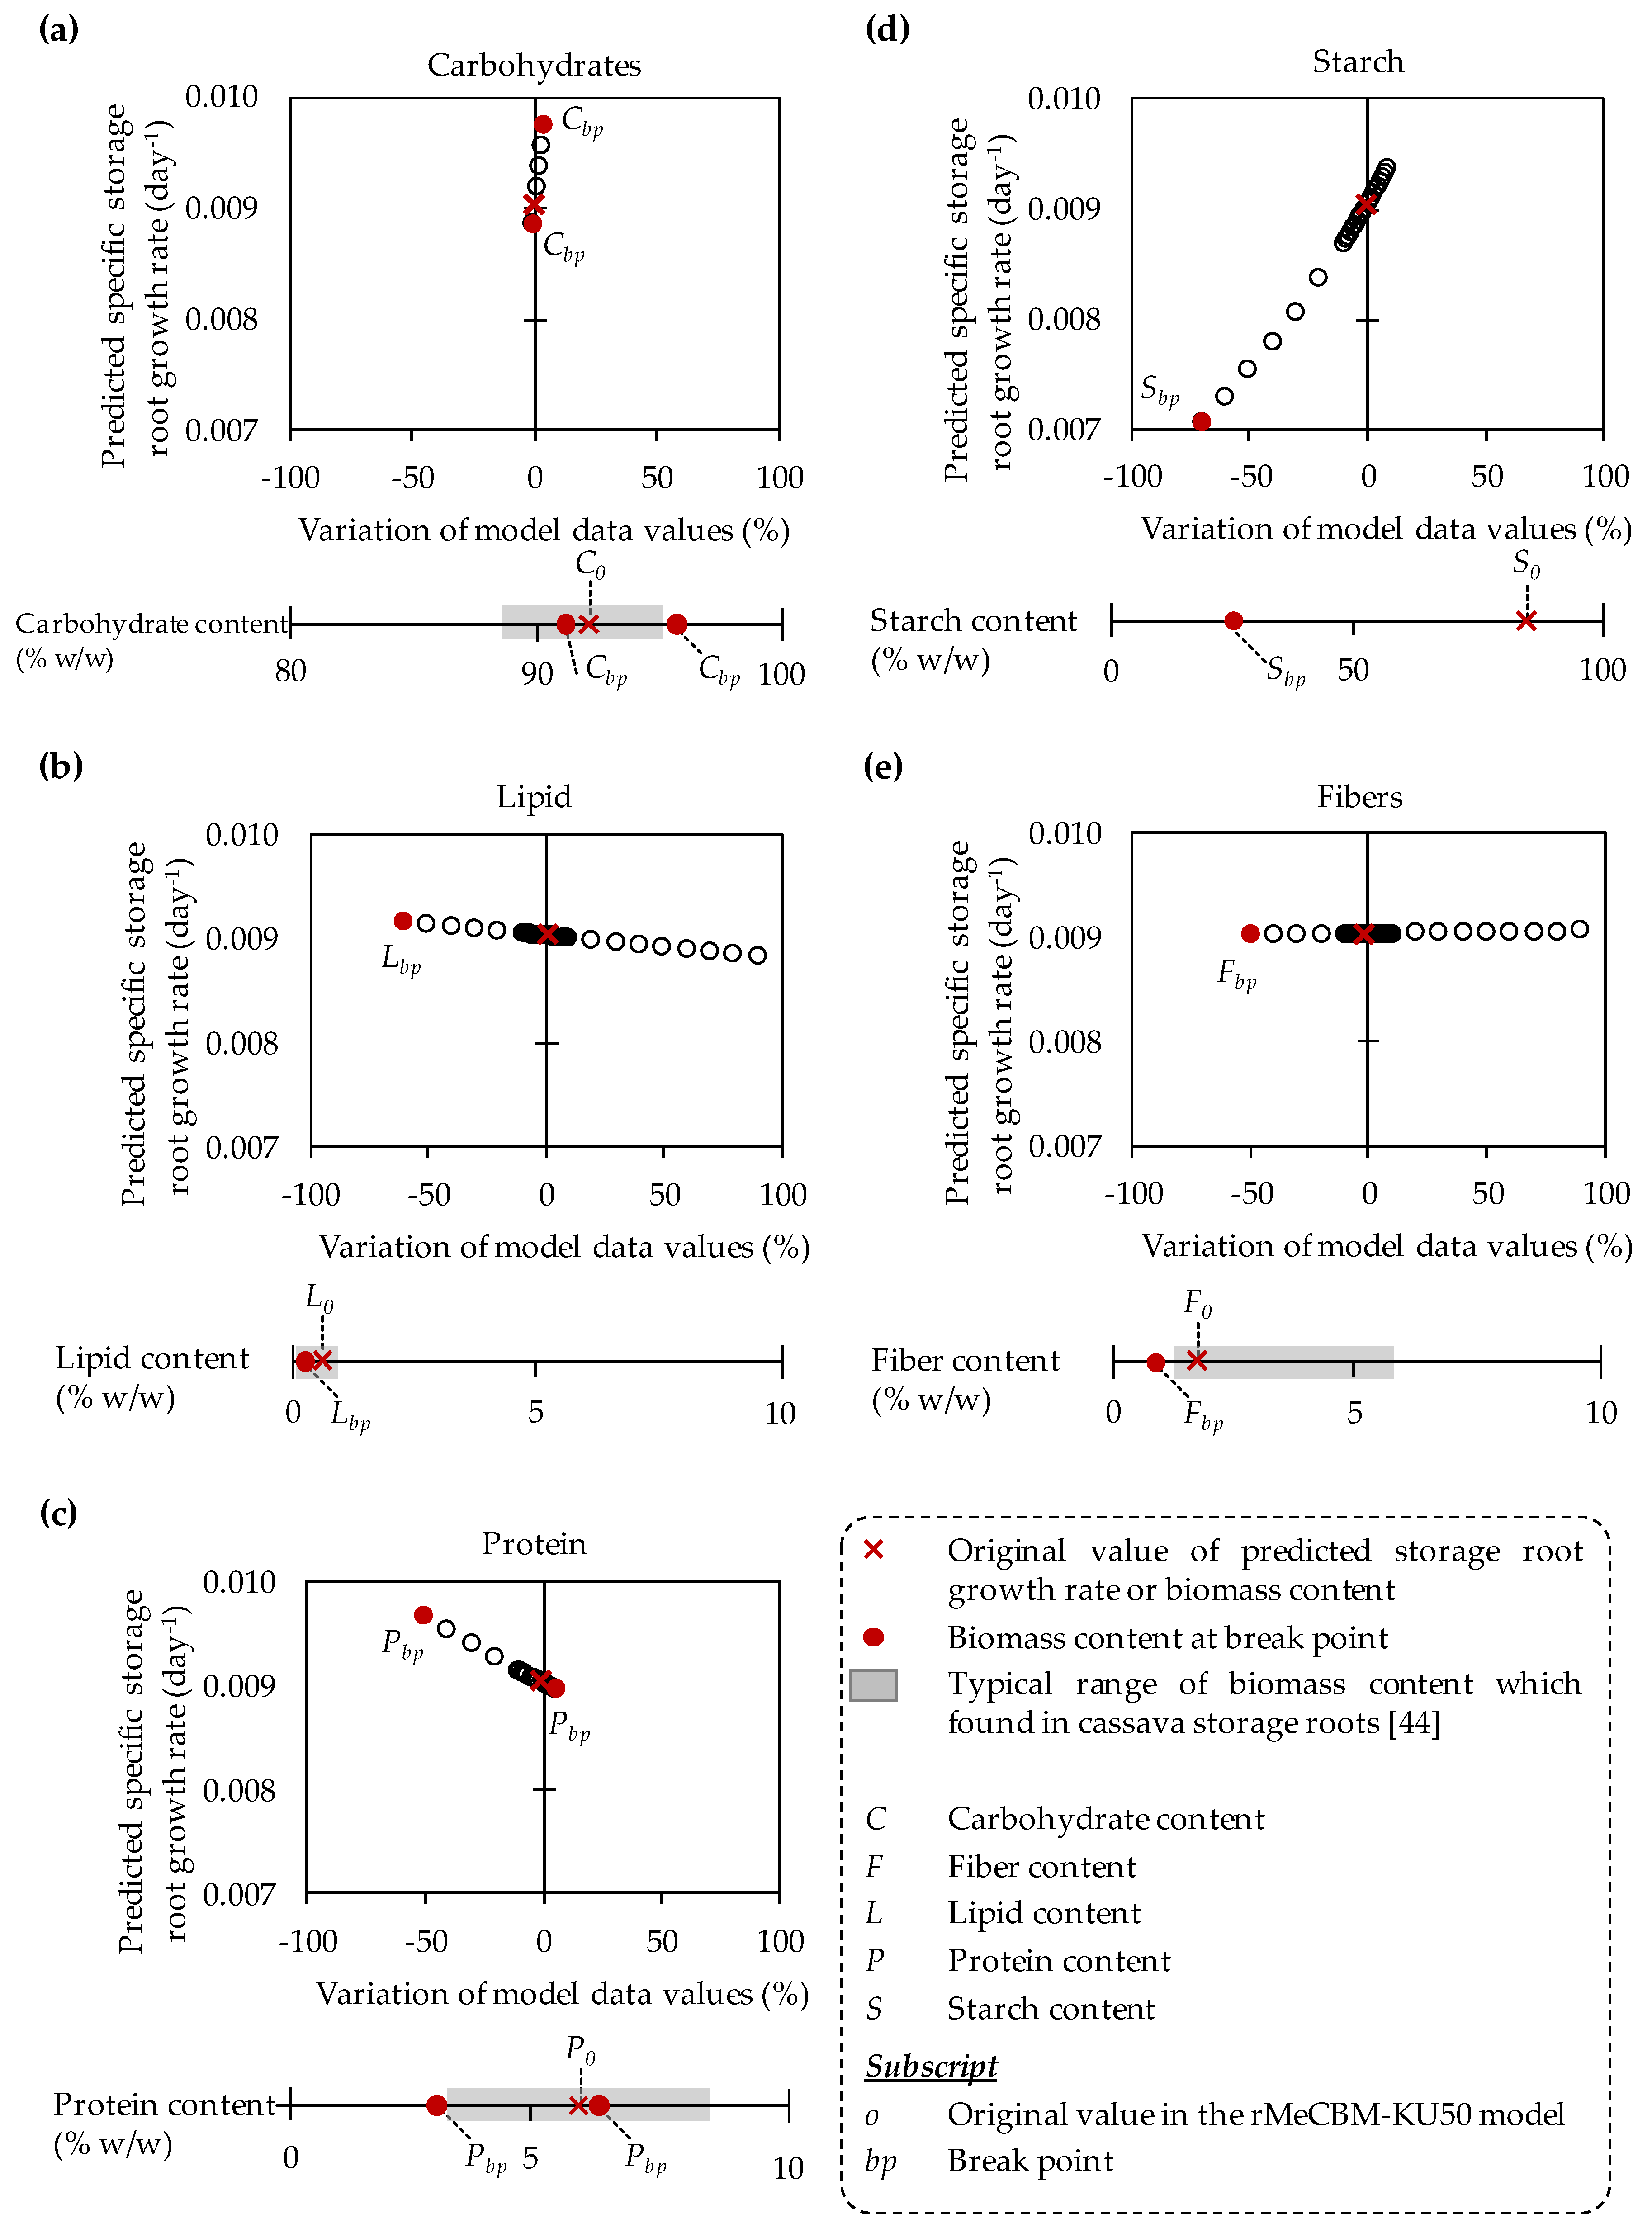
Figure 5.
The influence of biomass compositions on the predicted flux direction of the rMeCBM-KU50 model. The reactions with zero flux predictions, inactive reactions, are denoted by white-colored bars. The non-zero flux reactions, active reactions, consists of those with similar flux direction as the original model—denoted by blue bars, and those that are dissimilar—denoted by red bars. AMI, amino acid biosynthesis pathway; PPP, pentose phosphate pathway; RES, respiration pathway; SSP, starch and sucrose biosynthesis pathway.
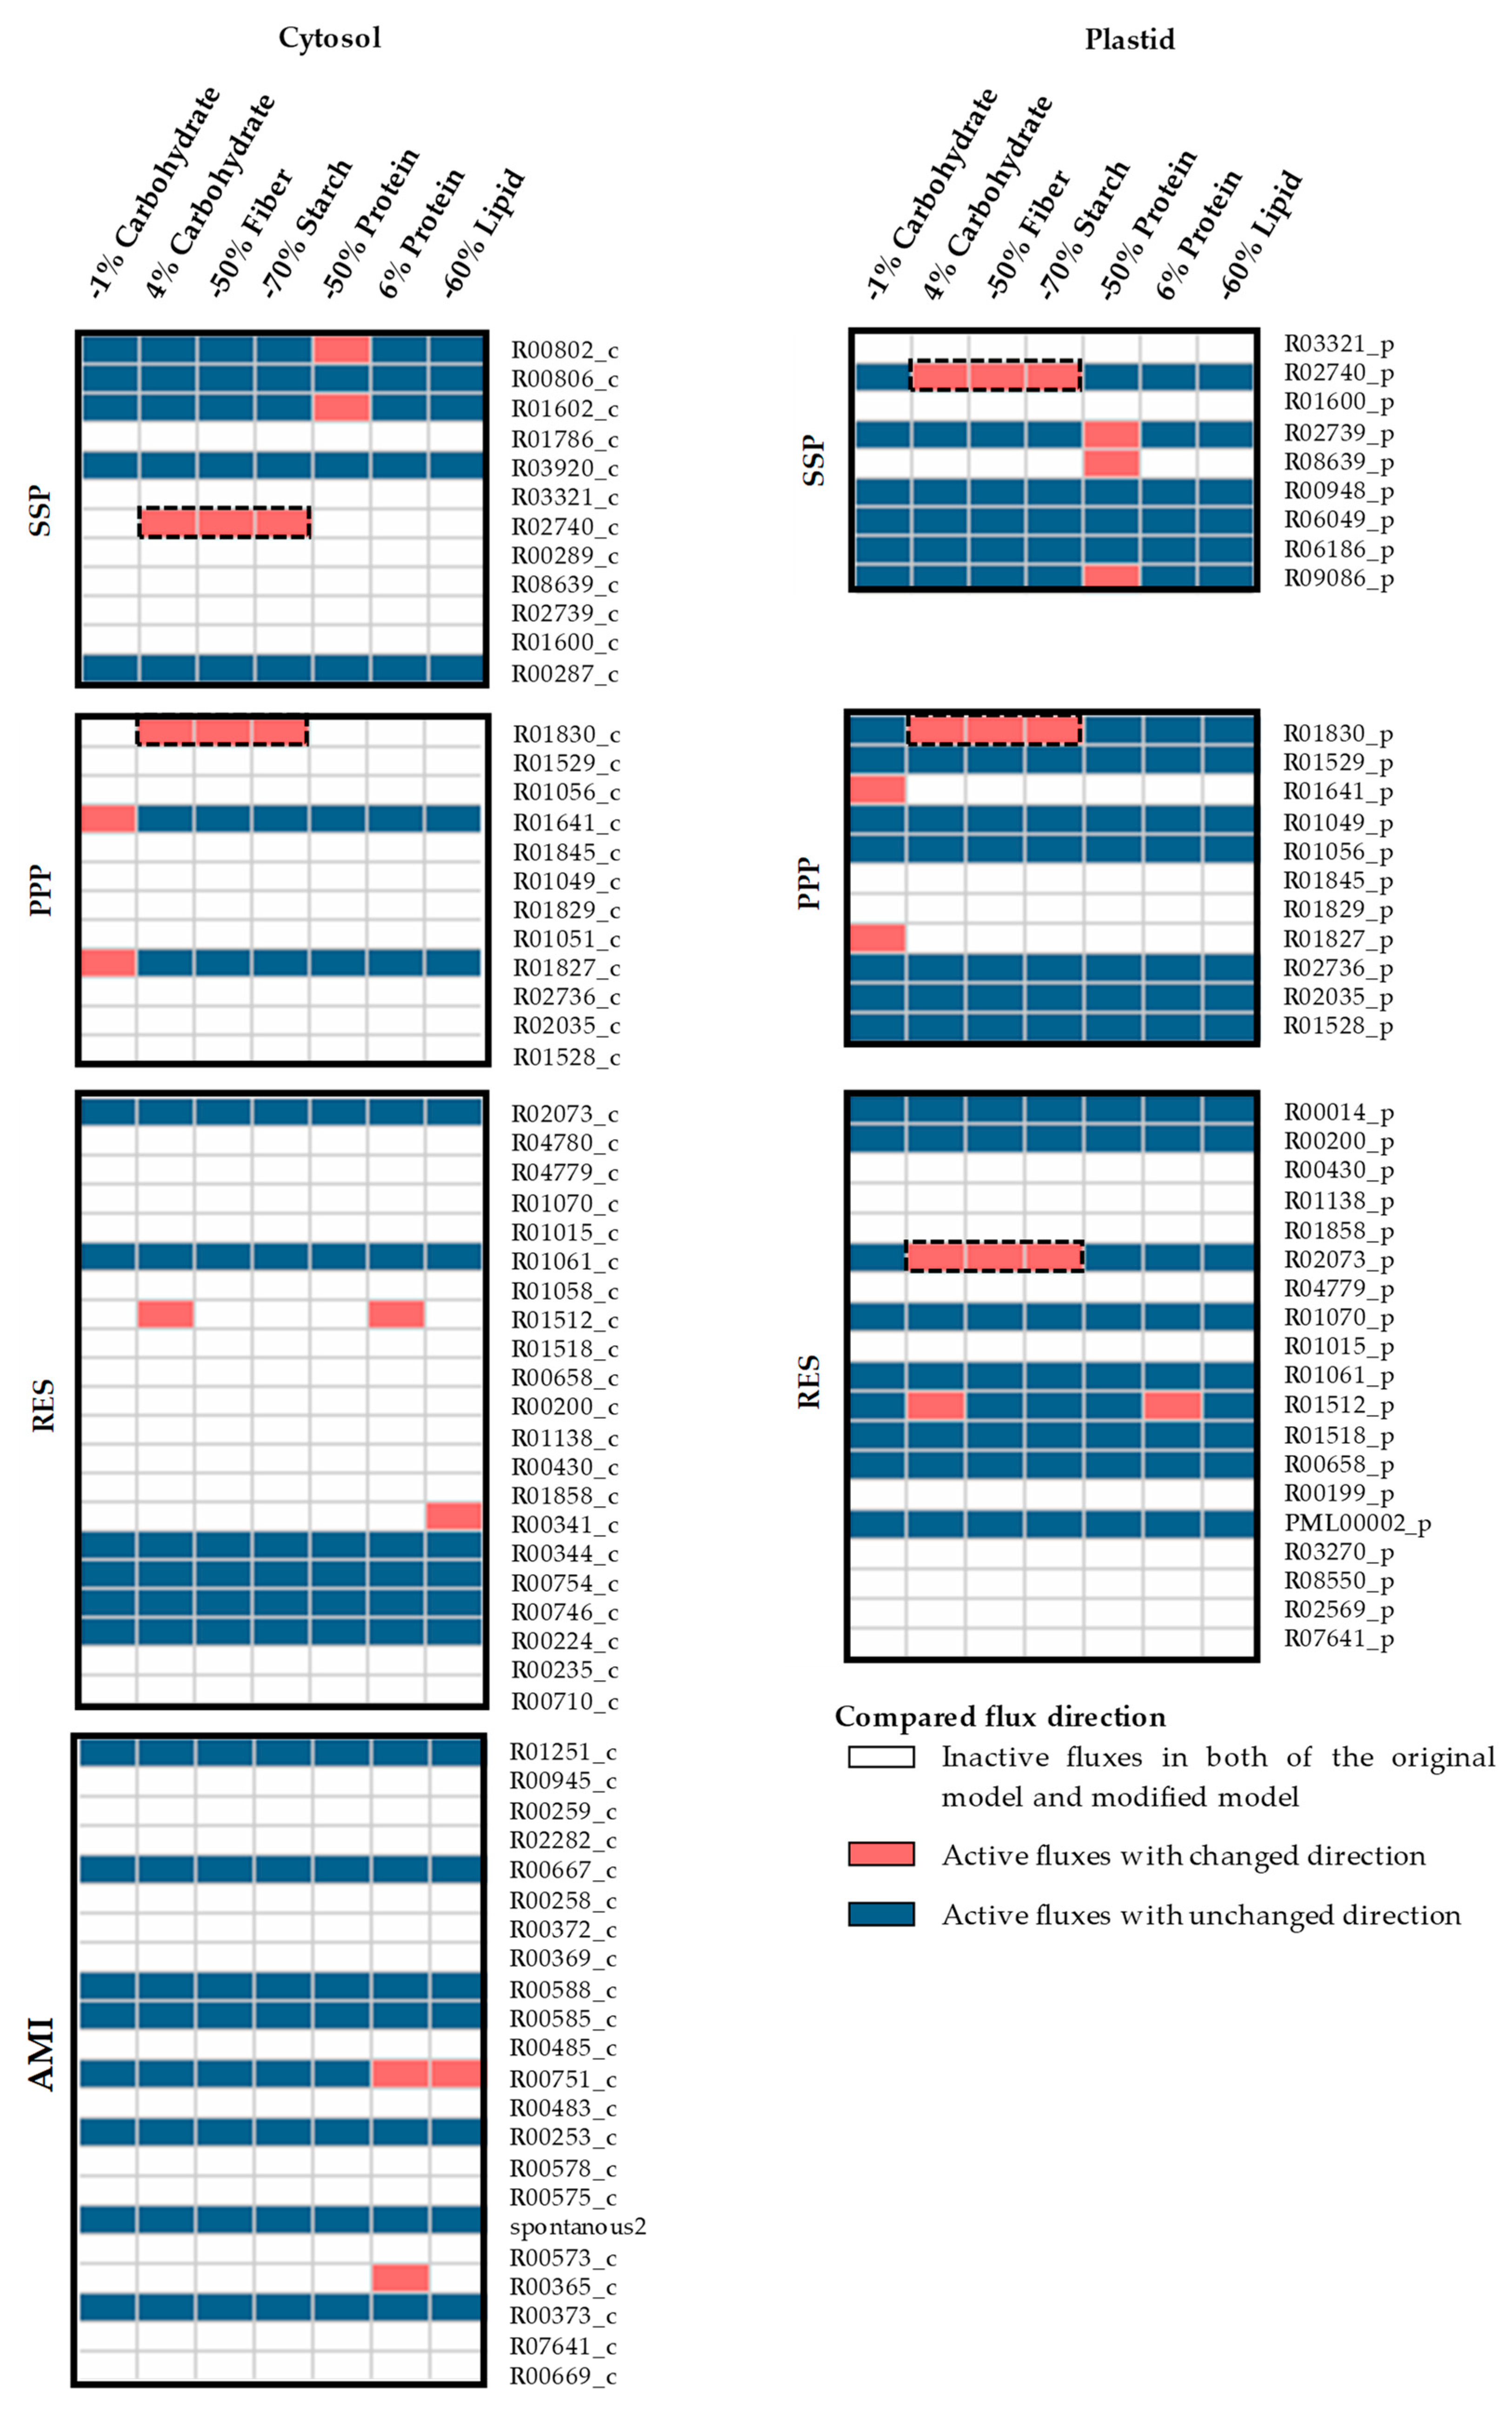
Figure 6.
The influence of biomass content on flux partitioning by the rMeCBM-KU50 model. The production and consumption fluxes at each metabolic branch point were respectively denoted as positive and negative signs in the simulation. C, carbohydrate content; F, fiber content; L, lipid content; P, protein content; S, starch content; AMI, amino acid biosynthesis pathway; PPP, pentose phosphate pathway; RES, respiration pathway; SSP, starch and sucrose biosynthesis pathway.


Table 1.
The range of the substrate–uptake rate-related data in the rMeCBM-KU50 model.
| Model Input Data | Original Values a | Range of Values in Sensitivity Analysis b |
|---|---|---|
| Specific sucrose uptake rate (mmolsucrose gDW−1SRs day−1) | 0.0548 | 0.0005–0.5400 d |
| Photosynthetic rate (µmolCO2 m−2 s−1) | 16.08 | 1.61–30.55 |
| Total leaf area (m2) | 1.63 | 0.16–3.10 |
| Storage root dry weight (kgDW) | 1.28 | 0.13–2.43 |
| Total photosynthetic rate (µmolCO2 s−1) | 26.21 | 0.26–94.91 c |
a The values published with rMeCBM-KU50 model [4]. b The range of data variation within ± 90% of the original value in the rMeCBM-KU50 model. c The total photosynthetic rate was the product of the total leaf area and photosynthetic rate. d The specific sucrose uptake rate was the product of the total leaf area and photosynthetic rate divided by storage root dry weight.
Table 2.
Details of biomass function used for the rMeCBM-KU50 model and sensitivity analysis.
| Model Input Data | Original Values a | Range of Values in Sensitivity Analysis b |
|---|---|---|
| Carbohydrates | 92.07 | 9.21–99.44 |
| Starch | 84.06 | 8.41–91.62 |
| Proteins | 5.78 | 0.58–10.99 |
| Fibers | 1.69 | 0.17–3.22 |
| Lipid | 0.45 | 0.05–0.86 |
a Default biomass compositions in the rMeCBM-KU50 model [4]. b The range of values within ±90% of the original values in rMeCBM-KU50 used for the sensitivity analysis. Noted that ranges of −90% to 8%, and −90% to 9% were used for carbohydrate and starch contents, respectively, to ensure positive values.
© 2019 by the authors. Licensee MDPI, Basel, Switzerland. This article is an open access article distributed under the terms and conditions of the Creative Commons Attribution (CC BY) license (http://creativecommons.org/licenses/by/4.0/).
Share and Cite
MDPI and ACS Style
Chiewchankaset, P.; Kalapanulak, S.; Saithong, T. Extended Utilization of Constraint-Based Metabolic Model in a Long-Growing Crop. Processes 2019, 7, 259. https://doi.org/10.3390/pr7050259
AMA Style
Chiewchankaset P, Kalapanulak S, Saithong T. Extended Utilization of Constraint-Based Metabolic Model in a Long-Growing Crop. Processes. 2019; 7(5):259. https://doi.org/10.3390/pr7050259
Chicago/Turabian StyleChiewchankaset, Porntip, Saowalak Kalapanulak, and Treenut Saithong. 2019. "Extended Utilization of Constraint-Based Metabolic Model in a Long-Growing Crop" Processes 7, no. 5: 259. https://doi.org/10.3390/pr7050259
Note that from the first issue of 2016, this journal uses article numbers instead of page numbers. See further details here.