Article

Uncovering Novel Pathways for Enhancing Hyaluronan Synthesis in Recombinant Lactococcus lactis: Genome-Scale Metabolic Modeling and Experimental Validation

1
Department of Biotechnology, Bhupat and Jyoti Mehta School of Biosciences, Indian Institute of Technology Madras, Chennai 600 036, India
2
Initiative for Biological Systems Engineering, IIT Madras, Chennai 600 036, India
3
Robert Bosch Centre for Data Science and Artificial Intelligence (RBC-DSAI), IIT Madras, Chennai 600 036, India
*
Authors to whom correspondence should be addressed.
Processes 2019, 7(6), 343; https://doi.org/10.3390/pr7060343
Submission received: 12 April 2019 / Revised: 25 May 2019 / Accepted: 30 May 2019 / Published: 5 June 2019
(This article belongs to the Special Issue In silico metabolic modeling and engineering)

Abstract

:
Hyaluronan (HA), a glycosaminoglycan with important medical applications, is commercially produced from pathogenic microbial sources. The metabolism of HA-producing recombinant generally regarded as safe (GRAS) systems needs to be more strategically engineered to achieve yields higher than native producers. Here, we use a genome-scale model (GEM) to account for the entire metabolic network of the cell while predicting strategies to improve HA production. We analyze the metabolic network of Lactococcus lactis adapted to produce HA and identify non-conventional strategies to enhance HA flux. We also show experimental verification of one of the predicted strategies. We thus identified an alternate route for enhancement of HA synthesis, originating from the nucleoside inosine, that can function in parallel with the traditionally known route from glucose. Adopting this strategy resulted in a 2.8-fold increase in HA yield. The strategies identified and the experimental results show that the cell is capable of involving a larger subset of metabolic pathways in HA production. Apart from being the first report to use a nucleoside to improve HA production, we demonstrate the role of experimental validation in model refinement and strategy improvisation. Overall, we point out that well-constructed GEMs could be used to derive efficient strategies to improve the biosynthesis of high-value products.

1. Introduction

Hyaluronan (also known as Hyaluronic Acid/HA) is a linear glycosaminoglycan with alternating glucuronic acid and N-acetyl glucosamine repeating units (Figure 1). Due to its very high water-binding capacity and high viscoelasticity, HA assumes multiple roles such as cushioning, lubrication, shock absorbance at important joints and moisture retention in the skin. These make it indispensable for the normal functioning of most organisms. The applications of HA vary depending on the molecular weight, making it an important factor for production consideration. HA is also used in cosmetics as a moisturizer, as a visco-supplement for rheumatoid arthritis patients [1], in ophthalmic surgeries to replace the lost vitreous fluid [2] and as a hydrogel for drug delivery systems. A comprehensive review of the uses of HA is discussed elsewhere [3].
Currently, HA is being produced industrially using microbial sources. The general pathway for microbial HA biosynthesis is illustrated in Figure 2. Native producers like Streptococci group A and C that synthesizes this polymer as part of their cell capsule have been largely explored for HA production [4,5,6,7]. More recently, many recombinant platforms like Bacillus subtilis [8], Lactococcus lactis [9,10], Corynebacterium glutamicum [11,12], Escherichia coli [13], Agrobacterium sp. [14] and Pischia pastoris [15] are being constructed for HA production, to overcome pathogenicity issues associated with the native producers [16]. However, it is noteworthy that only one of these recombinant systems (Bacillus subtilis) has been scaled up for commercial production [17]. Widespread application of recombinant cell factories for HA production has been primarily impeded by poor yields and low molecular weight of HA, that compares poorly with those from native Streptococci.
Lactococcus lactis is a GRAS (generally regarded as safe) lactic acid bacterium used widely in the production of fermented food products. It has a relatively simple metabolism with most of the carbon fluxed to lactic acid, which plays a crucial role in the protection of the final fermented product against spoilage. Extensive insights have been gained on its metabolism through numerous physiological studies. The genetics of this organism have also been well characterized. Most importantly, L. lactis has had a long history of safe use and has become an ideal avenue for metabolic engineering. This renders it a great chassis for production of medical-grade or food-grade chemicals. Accordingly, recombinant L. lactis strains producing HA were previously developed by our group [18,19]. These have been investigated to identify metabolic factors that affect HA yield [20,21,22,23]. However, until now, the entire canvas for metabolic modifications has only included the traditional carbon-backbone based pathway (Figure 2). On the contrary, the metabolic capabilities of the cell can be more effectively understood by a systematic analysis of its entire metabolic network. Recent studies have underlined the importance of such systems-level approaches to re-engineer cellular metabolism [24]. In this study, we illustrate the potential of genome-scale metabolic network modeling to identify strategies that will guide the metabolic engineering of this organism towards HA production.
Genome-scale metabolic models (GEMs) comprise all the metabolic genes and reactions known to be present in an organism and thus represent the stoichiometry of its metabolic capability. They have been used to rationally identify metabolic engineering strategies while taking the entire network into consideration. A plethora of methods to identify metabolic engineering strategies have also been developed [25,26,27,28,29,30].
For L. lactis, three GEMs have been previously curated, and the current study builds on those. Oliveira and co-workers manually reconstructed the first GEM from the annotated genome of L. lactis IL1403 [31]. Later, Westerhuis and co-workers reconstructed the L. lactis MG1363 model [32] using the semi-automated network reconstruction method, AUTOGRAPH [33]. An updated version of this model, developed by de Vos and co-workers (Flahaut model), is the most recent L. lactis GEM available [34]. Here we adapt the Flahaut model [34] and analyze it systematically using in silico approaches, for enhancing HA production and report over-expression targets. By studying the metabolic sub-network associated with HA and analysis of the strategy that has the maximum effect on HA flux, we identify the supplementation of inosine as a key strategy for increasing HA production in L. lactis. We experimentally validate this prediction by demonstrating a 2.8-fold increase in HA production upon addition of 4 g/L inosine to the L. lactis fermentation medium.

2. Materials and Methods

2.1. Computational Methods—Models, Environments and Toolboxes Used

The model used in this study was adapted from the L. lactis MG1363 GEM published in 2013 [34]. The GEM was analyzed using COBRA toolbox v2.0 [35] in the MATLAB R2012b environment (Mathworks Inc., Natick, MA, USA). Simulations involved performing a flux balance analysis (FBA) [36] or minimization of metabolic adjustment (MoMA) [37] on the entire network. The simulations were subject to steady-state mass balance constraints, experimentally determined bounds on reaction fluxes and additional conditions for knock-outs. The objective function was assigned as a biomass flux or HA flux, according to the purpose of the simulation. In cases where an HA flux was maximized, a minimum biomass flux was fixed in order to avoid the unrealistic metabolic state of HA production without any cell growth (explained in detail in the Supplementary Methods Section C.1). Basic operations like adding and removing reactions, changing objective functions, computing steady-state flux distribution using FBA/MoMA were performed using in-built functions in the COBRA toolbox.
Over-expression analysis was done using the concept of flux scanning based on the enforced objective flux (FSEOF) [26]. FSEOF identifies a subset of the metabolic network that represents reaction fluxes that increase with an increase in product flux. The FSEOF sub-network visualization (see Supplementary Section A, Figure A.1, higher resolution figure is available as Supplementary file A1.pdf.) The figure was created using Escher (http://escher.github.io/; [38]) and the JSON model required for it was generated using Python 2.7.2 and COBRAPy.
The COBRA toolbox’s built-in function to perform OptKnock [25] was used to identify knock-outs that increase the theoretical maximum product flux. Other knock-outs that move the product flux closer to its theoretical maximum were identified by comparing the flux distribution under biomass and product maximization conditions (Supplementary Results Sections C.2 and C.3).

2.2. Experimental Methods—Strains, Media, Chemicals and Estimation Protocols

2.2.1. Strains and Plasmids

The recombinant HA producing strain used in this study, SJR6, contains the nisin-inducible plasmid pNZ8048 (with chloramphenicol resistance gene) bearing three HA pathway genes viz. Hyaluronan Synthase, UDP glucose-6-dehydrogenase and N-acetyl glucosamine pyrophosphorylase [18].

2.2.2. Media Components and Culture Conditions

Inosine was purchased from Sisco Research Laboratories (Mumbai, India). All other media components were procured from HiMedia Laboratories (Mumbai, India). The bioreactor medium consisted of 20 g/L glucose (autoclaved separately), 5 g/L yeast extract, 5 g/L brain heart infusion, 0.5 g/L ascorbic acid, 0.25 g/L MgSO4, 1.5 g/L Na2HPO4, 0.5 g/L KH2PO4 and 10 μg/mL chloramphenicol. Inosine solutions of the required concentration were autoclaved separately and added to the media at the start of the fermentation. Batch fermentations (30 °C, pH 7, 200 rpm, 1 vvm for aerated runs) with a total volume of 1 L were conducted in triplicates in a 2.5 L INFORS HT Benchtop bioreactor (Infors AG, Bottmingen, Switzerland).

2.2.3. Fermentation Analysis

Biomass, glucose, inosine, hypoxanthine and HA were estimated at regular intervals. Biomass was estimated from the optical density of the culture (OD600), residual glucose measured by a GOD-POD assay and HA by the carbazole assay [39]. Inosine and hypoxanthine were estimated by a monolithic Luna C-18 Reversed-Phase HPLC column (Phenomenex Inc., Torrance, CA, USA), using linear gradient elution [40]. The standard plots for all the metabolites analyzed and the gradient program used for reverse phase HPLC are described in detail in the Supplementary Methods Section B.1.

3. Results

We first extended the existing GEM for L. lactis to account for the known properties of the strain employed in this study. Subsequently, we performed in silico predictions of metabolic engineering strategies to over-produce HA. Based on our in silico simulations, we predicted that the supplementation of inosine in the growth medium has the potential to amplify the production of HA. Finally, we validated our predictions through experiments, by demonstrating that there is a 2.8-fold improvement in the production of HA, due to supplementation of inosine in the growth medium. Overall, our results demonstrated the role of systematic model-guided metabolic engineering as a powerful tool for strain improvement.

3.1. In Silico HA Production Using an Adapted L. lactis GEM

We adapted the most recent GEM of L. lactis [34] to investigate the metabolic capabilities of the organism towards HA production (‘.xml’ version in Supplementary File ‘S.xml’). First, we added the reaction catalyzed by HA synthase to match the metabolism of the recombinant strain. Next, we replaced the flux bounds of uptake reactions specified in the original model with those that have been reported for the strain we used [20]. We eliminated gaps and blocked reactions from the model, which resulted in a version of the model specific for the nutrient sources supplied in this study. We also included a constraint that enabled homolactic fermentation [5]. A detailed description of the changes made to the model is available in the Supplementary Methods Section B.2.

3.2. New Metabolic Engineering Strategies for HA Production in L. lactis

We analyzed this adapted GEM to identify strategies commonly employed to engineer the metabolism of an organism towards a product of interest. The approaches we employed could be grouped into two categories: (1) Amplifying fluxes of reactions that aid in HA production and (2) knocking-out or reducing the flux of reactions that compete with HA. Model analysis in the first approach revealed very interesting results, one of which experimentally improved HA production by 2.8-fold. On the other hand, the latter approach led to intuitive, previously reported results that further establish the validity of this method. They have been discussed in detail in the Supplementary Results Sections C.2 and C.3. In this article, we mainly focus on results obtained from the model analysis in the amplification category.
Over-expression of genes in the product pathway has been employed in several cases of metabolite production [41,42]. We use the concept of FSEOF [26] to systematically obtain an exhaustive set of all candidate targets for over-expression from the metabolic network of L. lactis (Table A.1 in Supplementary Section A). FSEOF identifies those reactions, which tend to carry higher flux whenever product flux increases (as mandated by constraints in the simulations), as observed by simulating the metabolic network using FBA. These reactions are then evaluated as potential candidates for overexpression.
We thus identified 78 candidate reactions (40 reversible and 38 irreversible reactions), including the traditional HA pathway reactions. The involvement of glutamine in the HA pathway could be a possible reason for the presence of some amino acid biosynthesis reactions on the list. Apart from these, several nucleotide metabolism reactions came up on the list. They appeared to contribute to the carbon backbone of HA. Figure A.1 in Supplementary Section A (higher resolution figure: Supplementary File A1.pdf) shows a visualization of the reaction sub-network constructed out of this list of reactions, using Escher [38]. This schematic helps to illustrate how these reactions contribute to HA.
Though all the reactions in the sub-network are indeed contributing to increase HA in some way or another, it would be ideal to identify those reactions, which would be better targets to guide metabolic engineering. From the FSEOF analysis, this study brings out two types of over-expression targets (schematic in Figure 3). The first type of over-expression targets are the obvious pathway enzymes. This list consists of eight reactions of the HA pathway viz. Hyaluronan synthase, UDP-glucose dehydrogenase, UDP-N-acetylglucosamine diphosphorylase, UTP glucose-1-phosphate uridylyltransferase, Glucosamine-1-phosphate N-acetyltransferase, phosphoglucosamine mutase, phosphoglucomutase and Glutamine fructose-6-phosphate transaminase. Many of these have already been verified experimentally in previous studies in L. lactis [18,19,43].
The second type of over-expression targets predicted herein comprises non-intuitive targets. These targets would not have been perceivable upon consideration of just the traditional pathway in Figure 2. These have been further classified, based on whether they are part of a branch or a linear pathway. The first category (Type II(A)) includes those reactions whose substrates are branch nodes. When these are over-expressed, the fraction of the branch point metabolite going towards the pathway of interest will increase, making them good candidates for over-expression. Such reactions in the FSEOF list were identified by searching for important branch nodes (non-currency metabolites participating in more than two active reactions) in the FSEOF sub-network. This analysis pointed to five enzymes as targets for over-expression (Table 1).
The second category of type-II targets (Type II(B)) stems from reactions that are part of linear pathways in the sub-network. Over-expression of these enzymes might not increase product flux since reactions preceding and succeeding them would still have unchanged fluxes. The first reactions of a linear path, (for e.g., (S2 → F) or (I → B) in Figure 3) are the most informative here, with respect to identifying strategies. Amplification of the first reaction is vital, if not sufficient, for activation of the linear path. Since branch point reactions have already been identified as part of the Type II(A) targets, we set out to identify exchange fluxes in the sub-network as the Type II(B) targets. To identify exchange start points, the exchange reactions involved in the HA sub-network were examined. There were totally 13 exchange fluxes (sources and sinks) in the FSEOF list. The five uptakes (sources) out of these have been put forth as over-expression targets of this class (Table 1). One of these targets, inosine, has been experimentally validated in this study and is discussed in detail in the following section.

3.3. In Vivo Validation of Predicted Strategy in Lactococcus lactis SJR6

A total of 18 overexpression (Table 1 and paragraph 4 in Section 3.2) and 12 knock-out (see Supplement Sections C.2 and C.3) targets have been put forth by the model analyses conducted in this study. This list of strategies is not exhaustive, but it covers major types of strategies to engineer the metabolism towards HA production. Some of these strategies have been experimentally observed to be effective in previous studies. For example, the traditional has operon genes have been cloned in various combinations in L. lactis to increase HA production [9,19,21]. Apart from the operon, other pathway genes like phosphoglucomutase have been over-expressed [43]. Knocking out lactate dehydrogenase gene has already been shown to bring about an increase in HA yield and molecular weight [22]. Among the type-II targets for over-expression put forth in this study, though none have been actually tested in practice, there are some reports on an increase in HA yield upon amino acid addition in Streptococci [7].
However, this study suggests, for the first time, the use of nucleosides to increase HA flux. Inosine, a nucleoside containing hypoxanthine (nitrogen base) and ribose, was one among the five metabolites whose uptake rate was found to increase in the model with a forced increase in HA production rate (Table 1). This indicates that increasing the inosine uptake rate in the cell might lead to an increase in HA flux. Apart from this, out of the 10 new over-expression targets in Table 1, the one with the highest increase in theoretical HA flux was the 2-deoxyribose-5-phosphate aldolase reaction. This is one of the downstream reactions of inosine catabolism according to the sub-network in Figure A.1 (in Supplementary Section A), suggesting that increasing the uptake of inosine would be one of the most effective strategies put forth in this study. Hence, this strategy presented itself as an interesting one among the others and was therefore chosen to be tested for an increase in HA production.

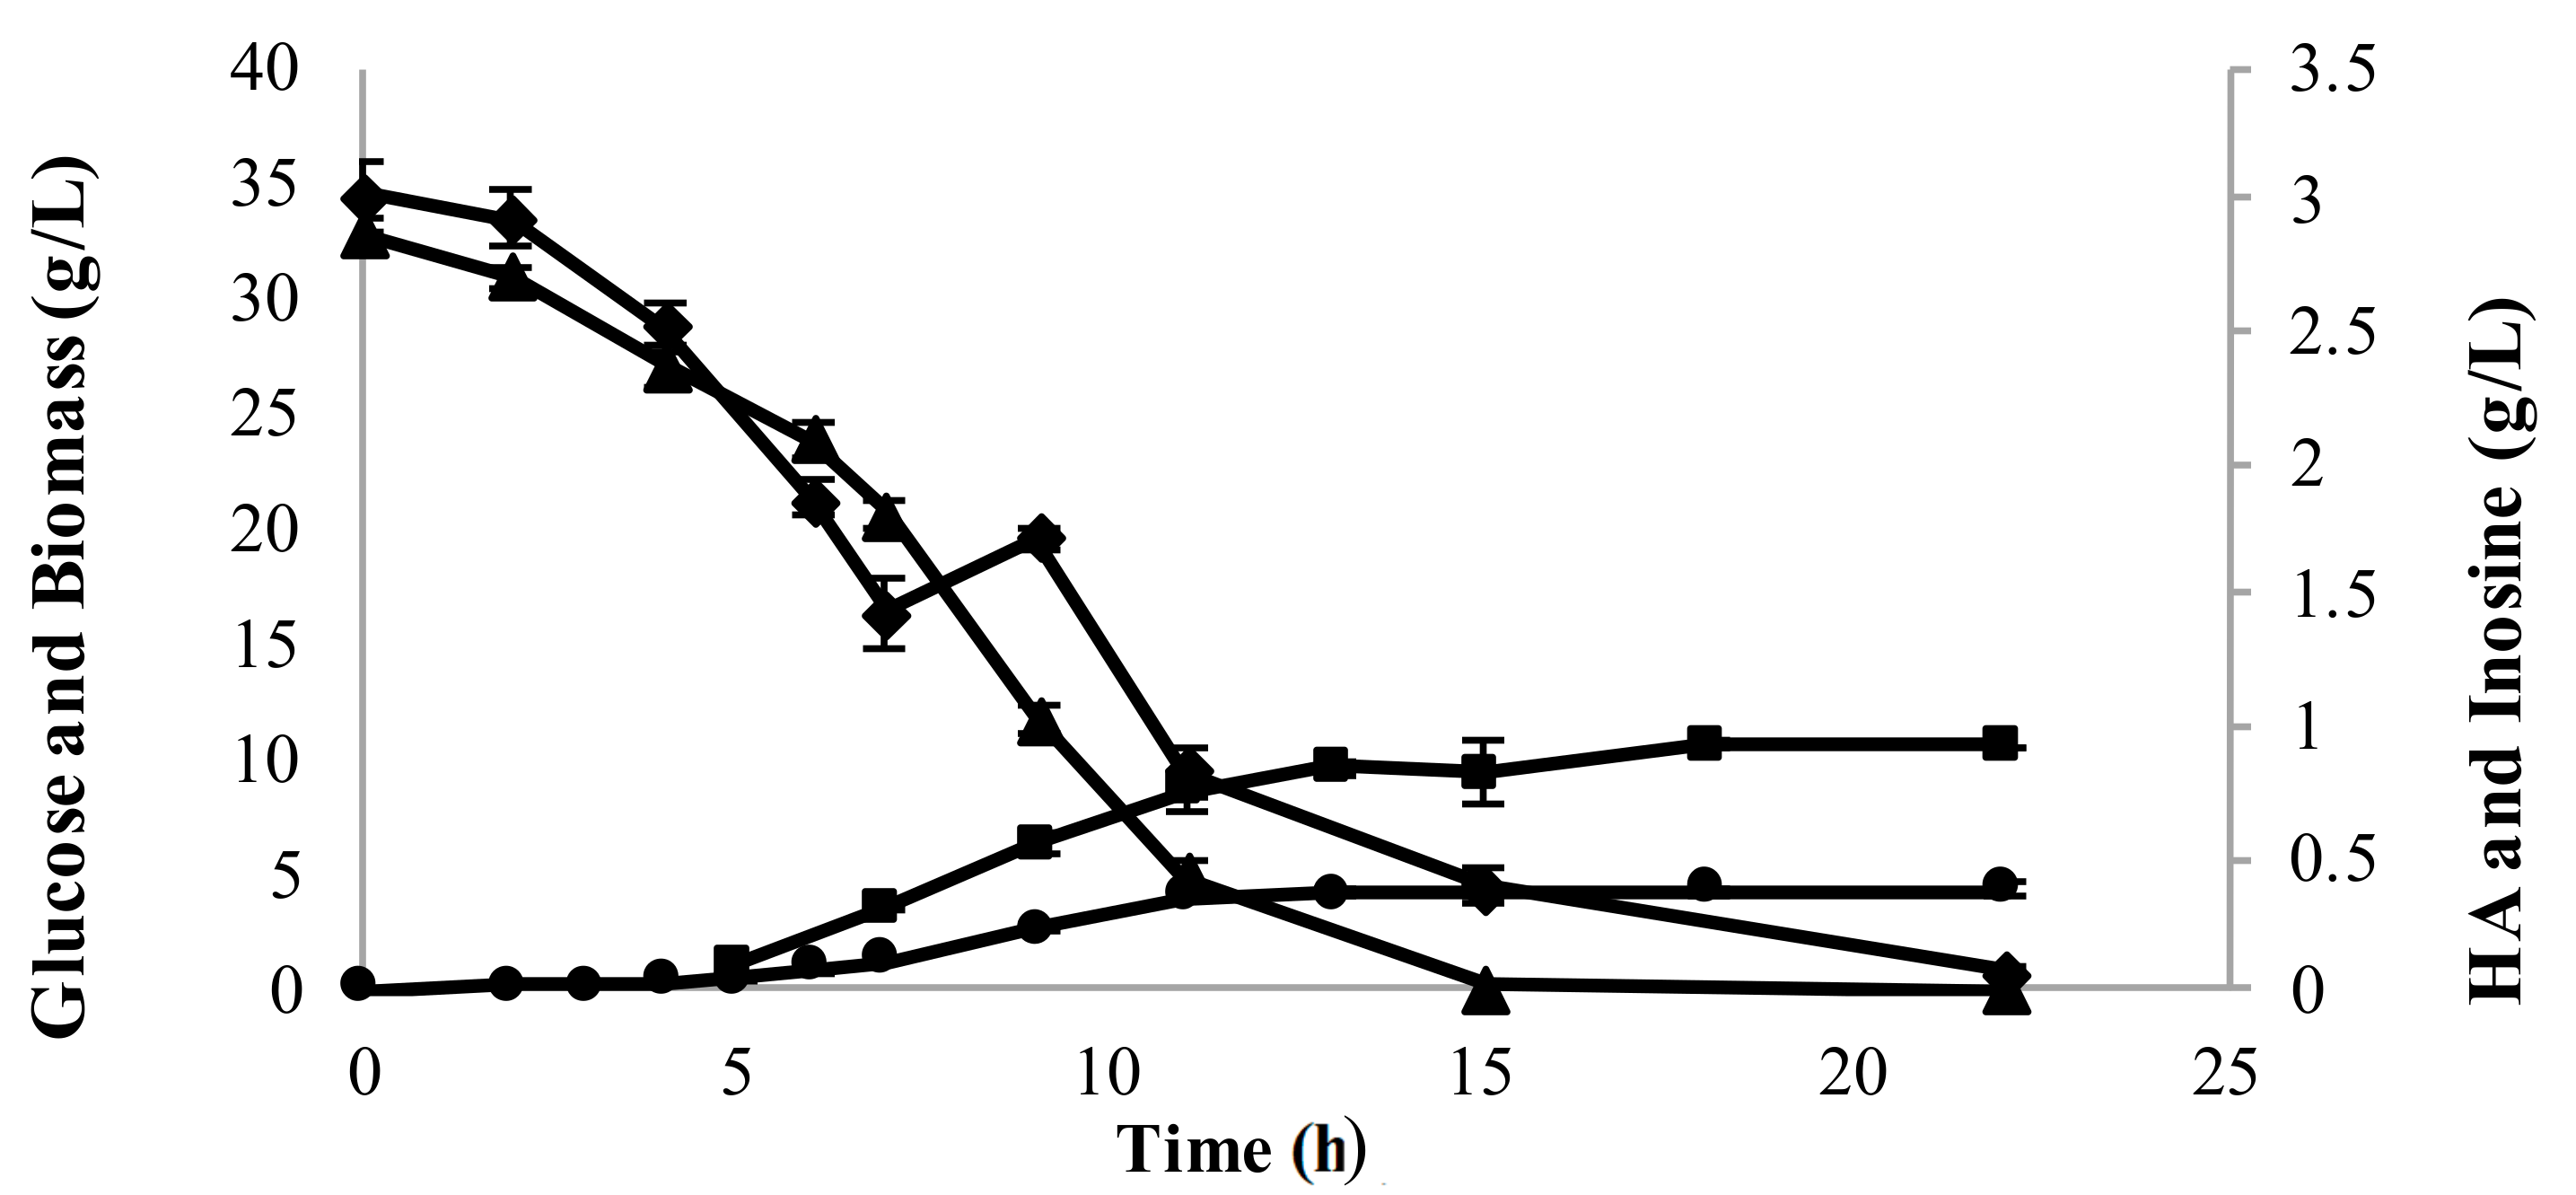
3.3.1. Addition of Inosine Resulted in Hypoxanthine Secretion in Recombinant L. lactis

Hypoxanthine was observed to accumulate in the culture media that were supplemented with inosine. This was identified in the chromatogram used to estimate the residual inosine concentration (Figure A.2, in Supplementary Section A). The concentration profiles of hypoxanthine and inosine (Figure 4) showed that amounts of hypoxanthine accumulated in the medium were equimolar to the consumption of inosine. The equimolar secretion of hypoxanthine indicates that the inosine taken up from the medium was cleaved and the nucleobase was secreted back into the medium. This has been reported in certain other organisms too [44,45]. Hence, what remains in the cell from the nucleoside is the ribose moiety.

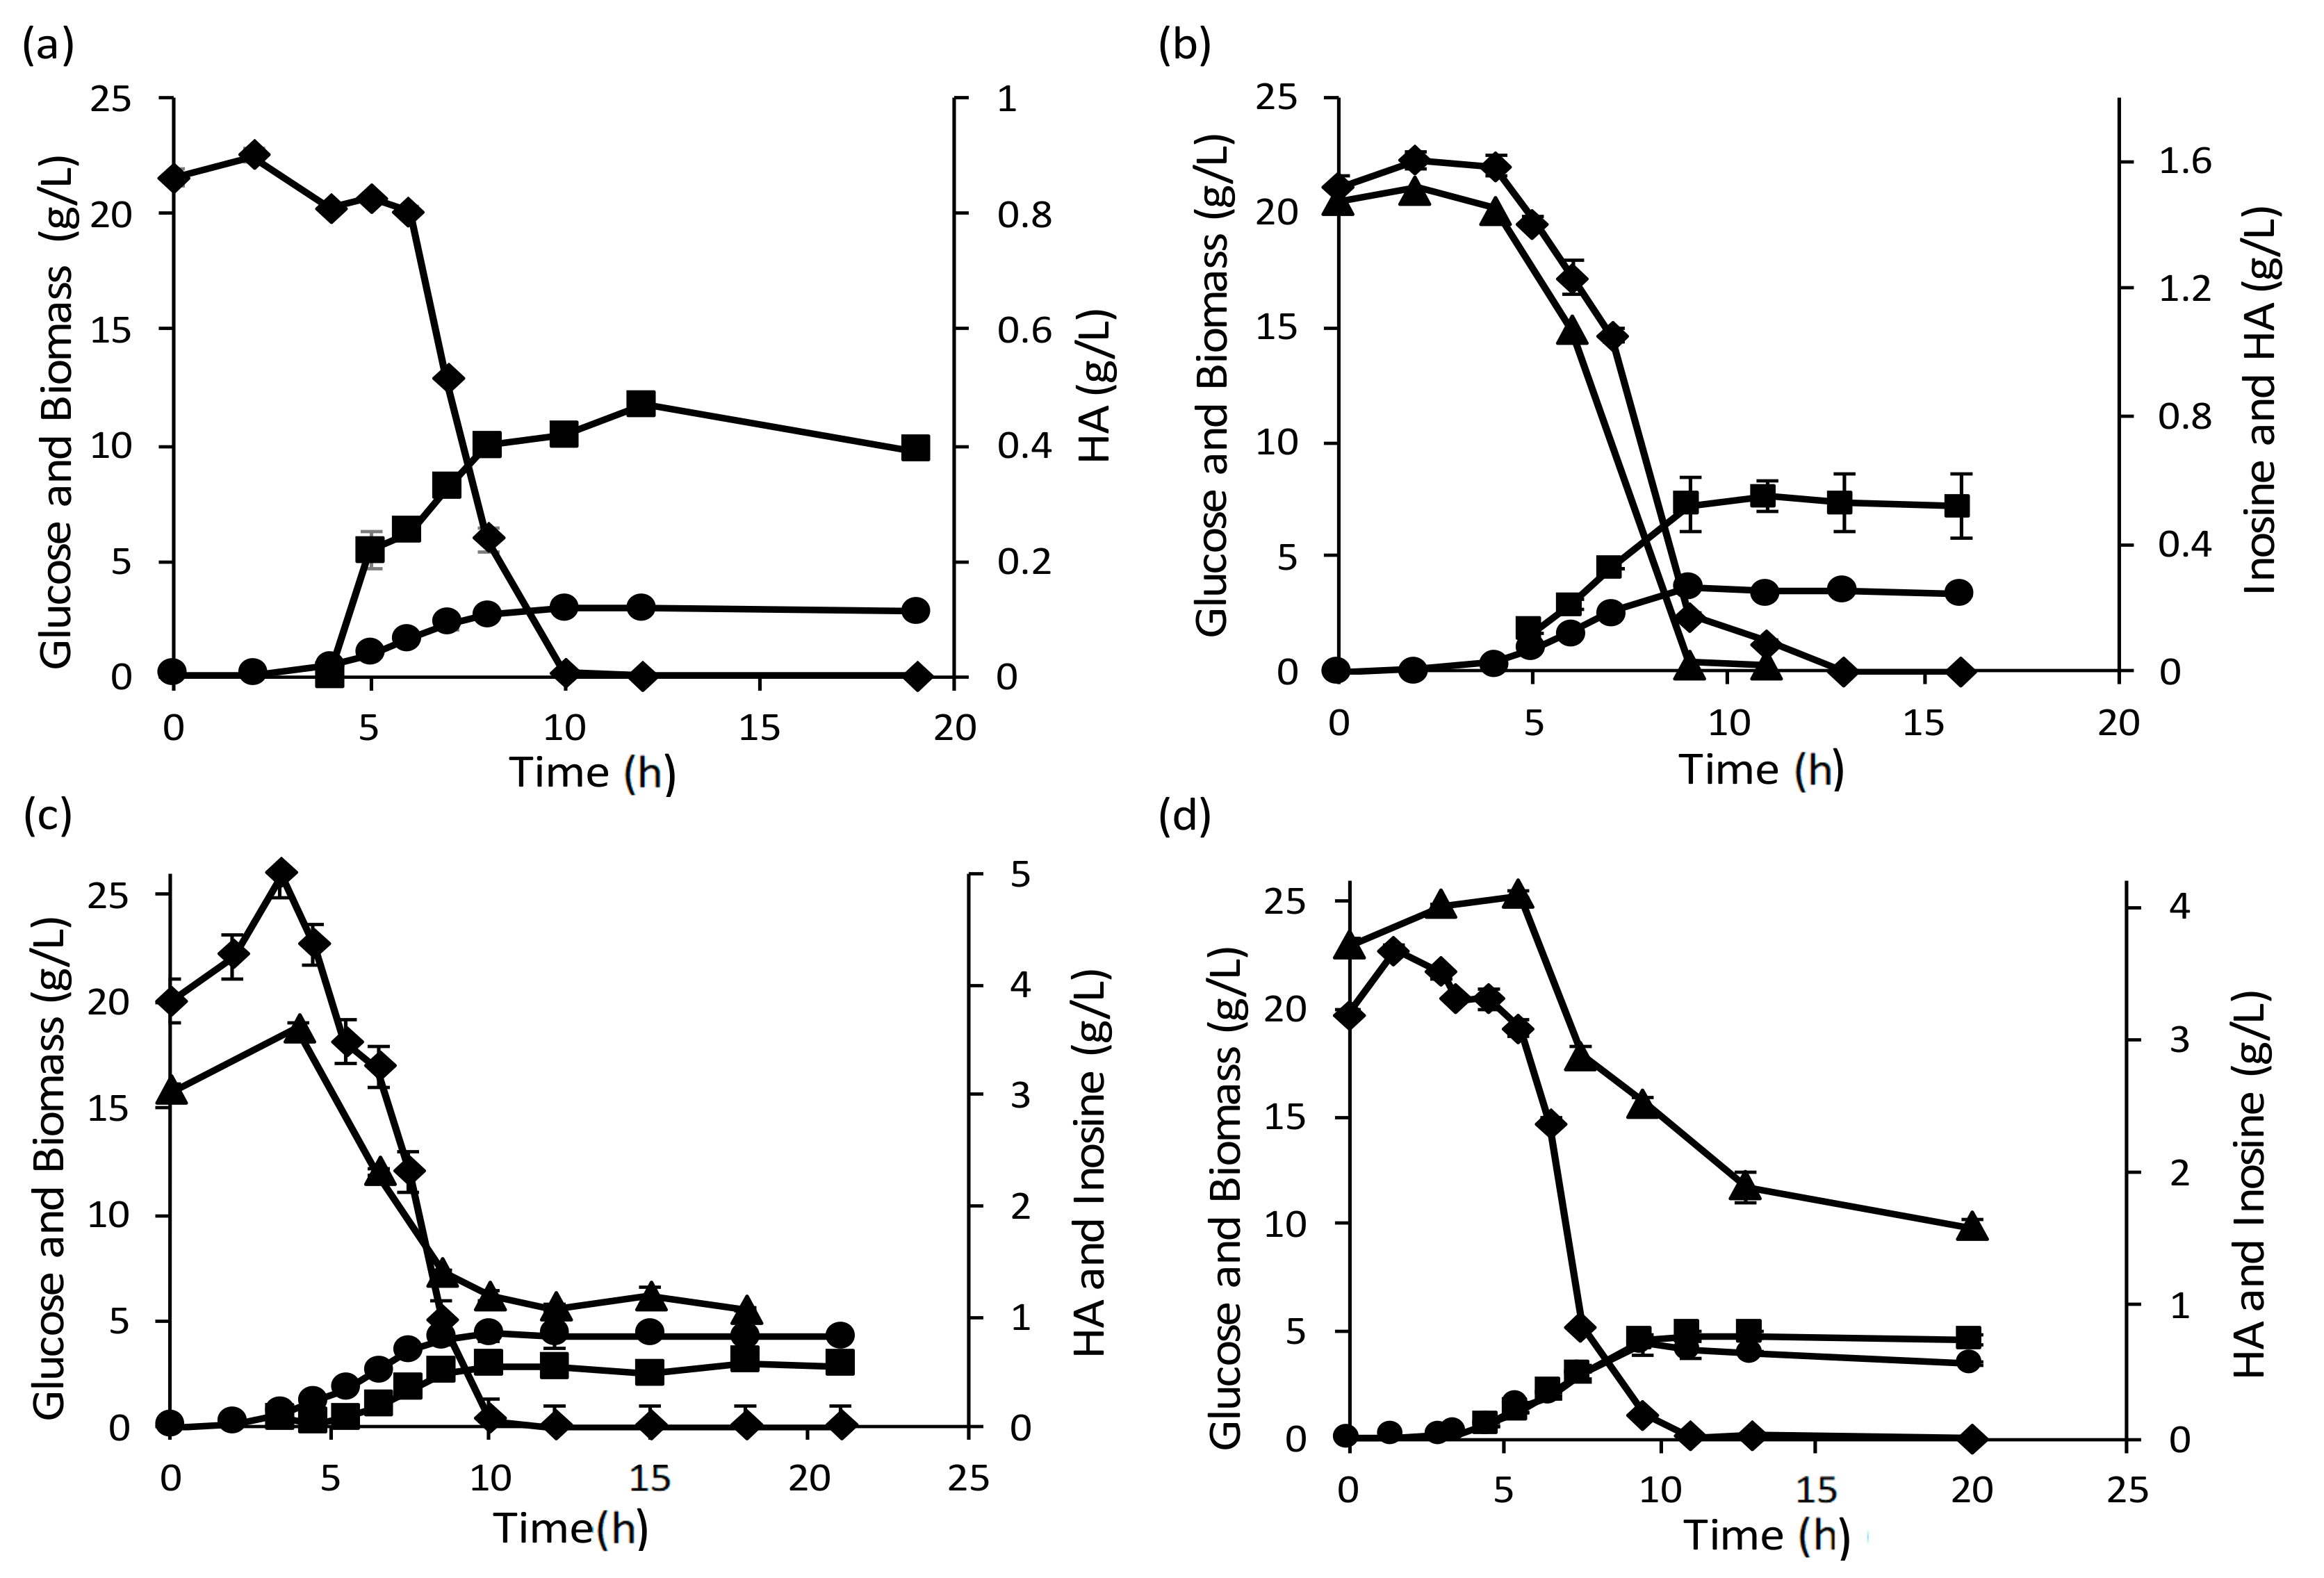
3.3.2. Inosine Uptake Led to a 2.8-Fold Increase in HA Yield from the Total Substrate Supplied

A positive correlation was observed between the initial concentration of inosine added to the medium and the final HA concentration obtained in the fermentation (Figure 5). Compared to the control run without inosine addition (0.37 g/L HA), the final HA concentration obtained increased 3-fold (to ~1.1 g/L) when 4 g/L inosine was added to the medium. The HA yield per carbon-mole (C-mole) of substrate (glucose + inosine) also increased 2.8-fold for the batches supplemented with inosine, as shown in Table 2.

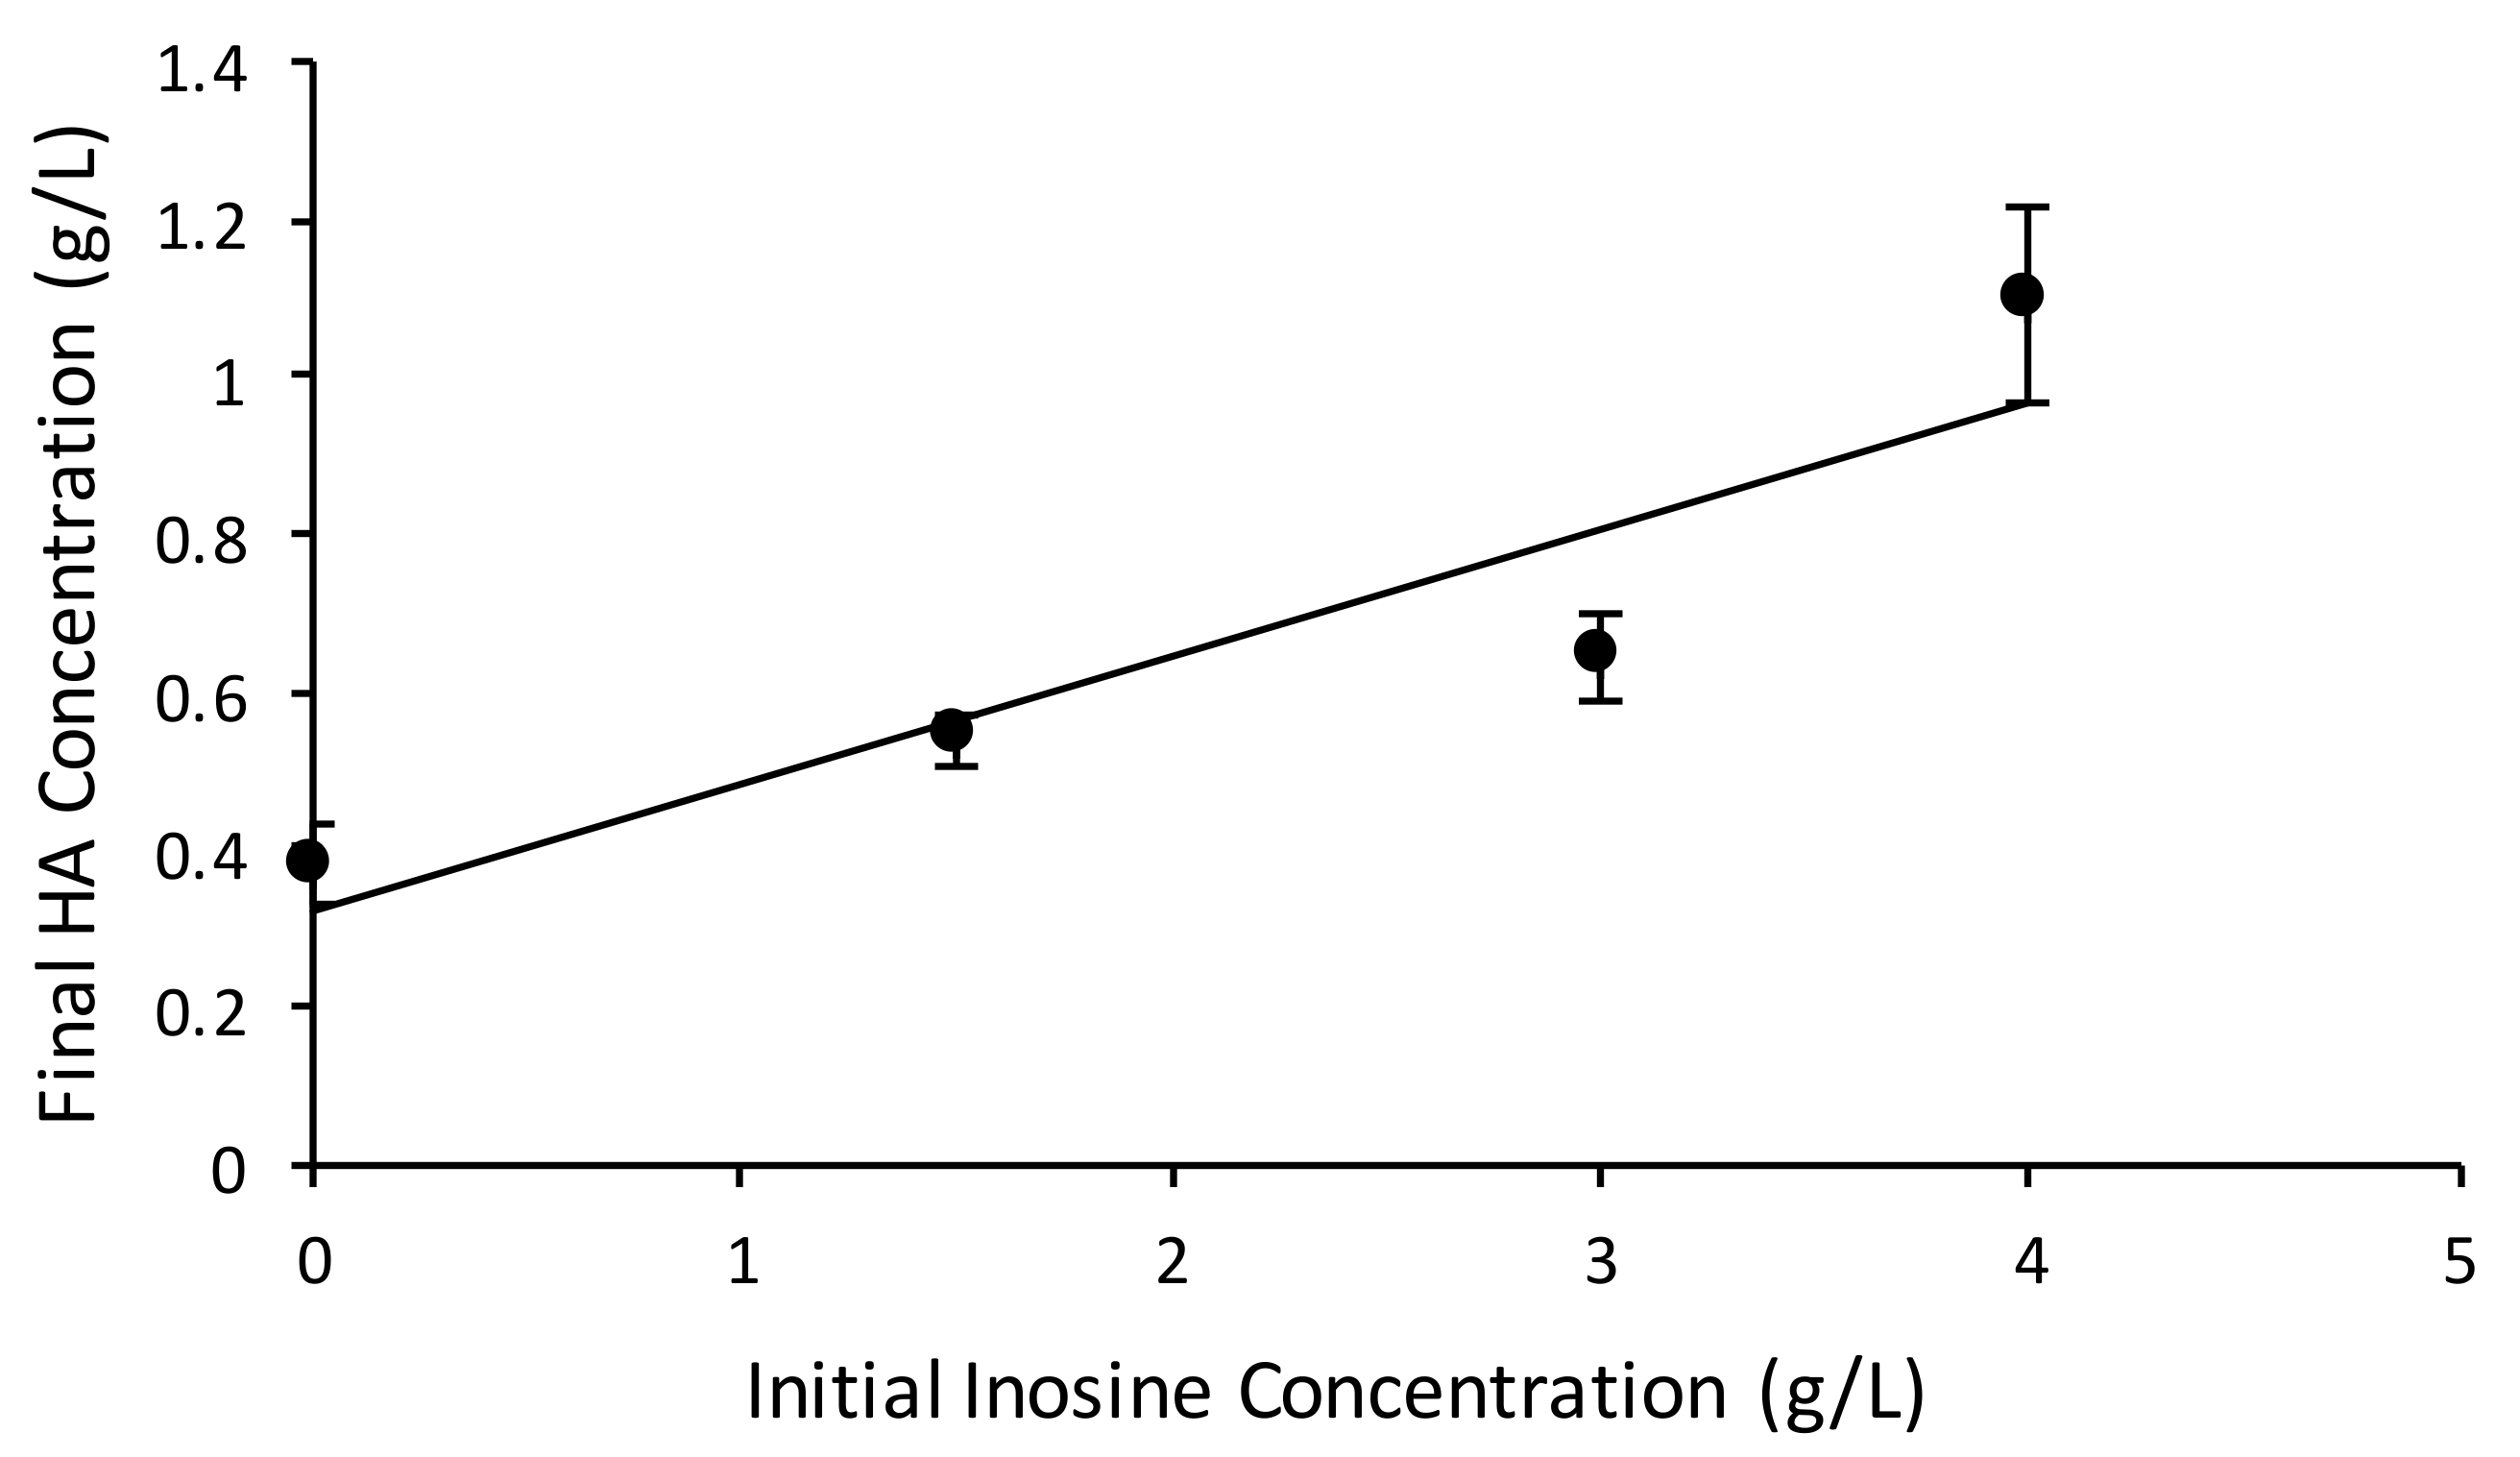
3.3.3. Higher Initial Glucose Concentration Helped Overcome the Incomplete Consumption of Inosine

The fermentation profiles for the batch bioreactor runs indicate that inosine utilization is incomplete in the runs with higher initial inosine concentration, unlike the runs with 1.5 g/L inosine (Figure 6). Inosine consumption appeared to stop after complete consumption of glucose (onset of the stationary phase). Considering that the inosine consumption aids HA production, it would be beneficial to have complete consumption of inosine in the batch fermentation.
To enhance inosine consumption, initial glucose levels were increased to delay glucose exhaustion (and hence delay the onset of stationary phase). Higher initial glucose level (30 g/L) for the same level of inosine enabled complete consumption of inosine (Figure 7). A correspondingly high concentration of HA (0.97 g/L) was obtained from this fermentation process.

3.4. Extrapolated In Silico Studies from the Predicted Strategy

Setting maximization of HA flux as the FBA objective ideally picks the best route to synthesize HA from the network. This (represented in Figure A.1 in Supplementary Section A) shows that inosine is transported into the cell and further phosphorylated to cleave the ribose sugar off the nucleoside by purine nucleoside phosphorylase. The hypoxanthine nucleobase generated is further metabolized by hypoxanthine phosphoribosyl transferase (HXPRT) and adenylosuccinate lyase. The ribose-1-phosphate generated in this process is transferred to uracil, forming uridine, which then goes through a cycle of kinases and phosphatases and is also reduced to give the corresponding deoxy-ribose sugar. The deoxy-ribose generated is finally cleaved by 2-deoxyribose phosphate aldolase that produces acetaldehyde and glyceraldehyde-3-phosphate. Both these compounds aid the HA pathway via acetyl-CoA generation and gluconeogenesis, respectively.

3.4.1. Identification of Hypoxanthine Exporter Gap Enabled Model Improvement

Hypoxanthine secretion into the medium indicates that L. lactis did not metabolize the hypoxanthine further, contrary to the model prediction. Though nucleobase secretion has been observed in several other reports available in the literature, the FSEOF analysis predicted re-routing of hypoxanthine to inosine monophosphate by HXPRT instead. This reaction requires PRPP. Furthermore, the inosine monophosphate is converted to cyclic-AMP by adenylosuccinate lyase. This reaction requires both l-alanine and GTP. The cyclic-AMP breaks into AMP and fumarate, which is ultimately converted to succinate and secreted out.
Thus, this path is more expensive compared to just secreting hypoxanthine as in the real system. Upon probing the model to find out why such a route was predicted, we identified that this was due to the absence of a hypoxanthine exporter in the model. When this transport reaction was added, hypoxanthine was fluxed out instead of going to HXPRT. The model chose a more complicated path here due to this gap. This knowledge gained from the real system about hypoxanthine secretion was employed in model refinement. Hypoxanthine secretion implies that the inosine strategy in effect works via ribose, as mentioned in Section 3.3.1.

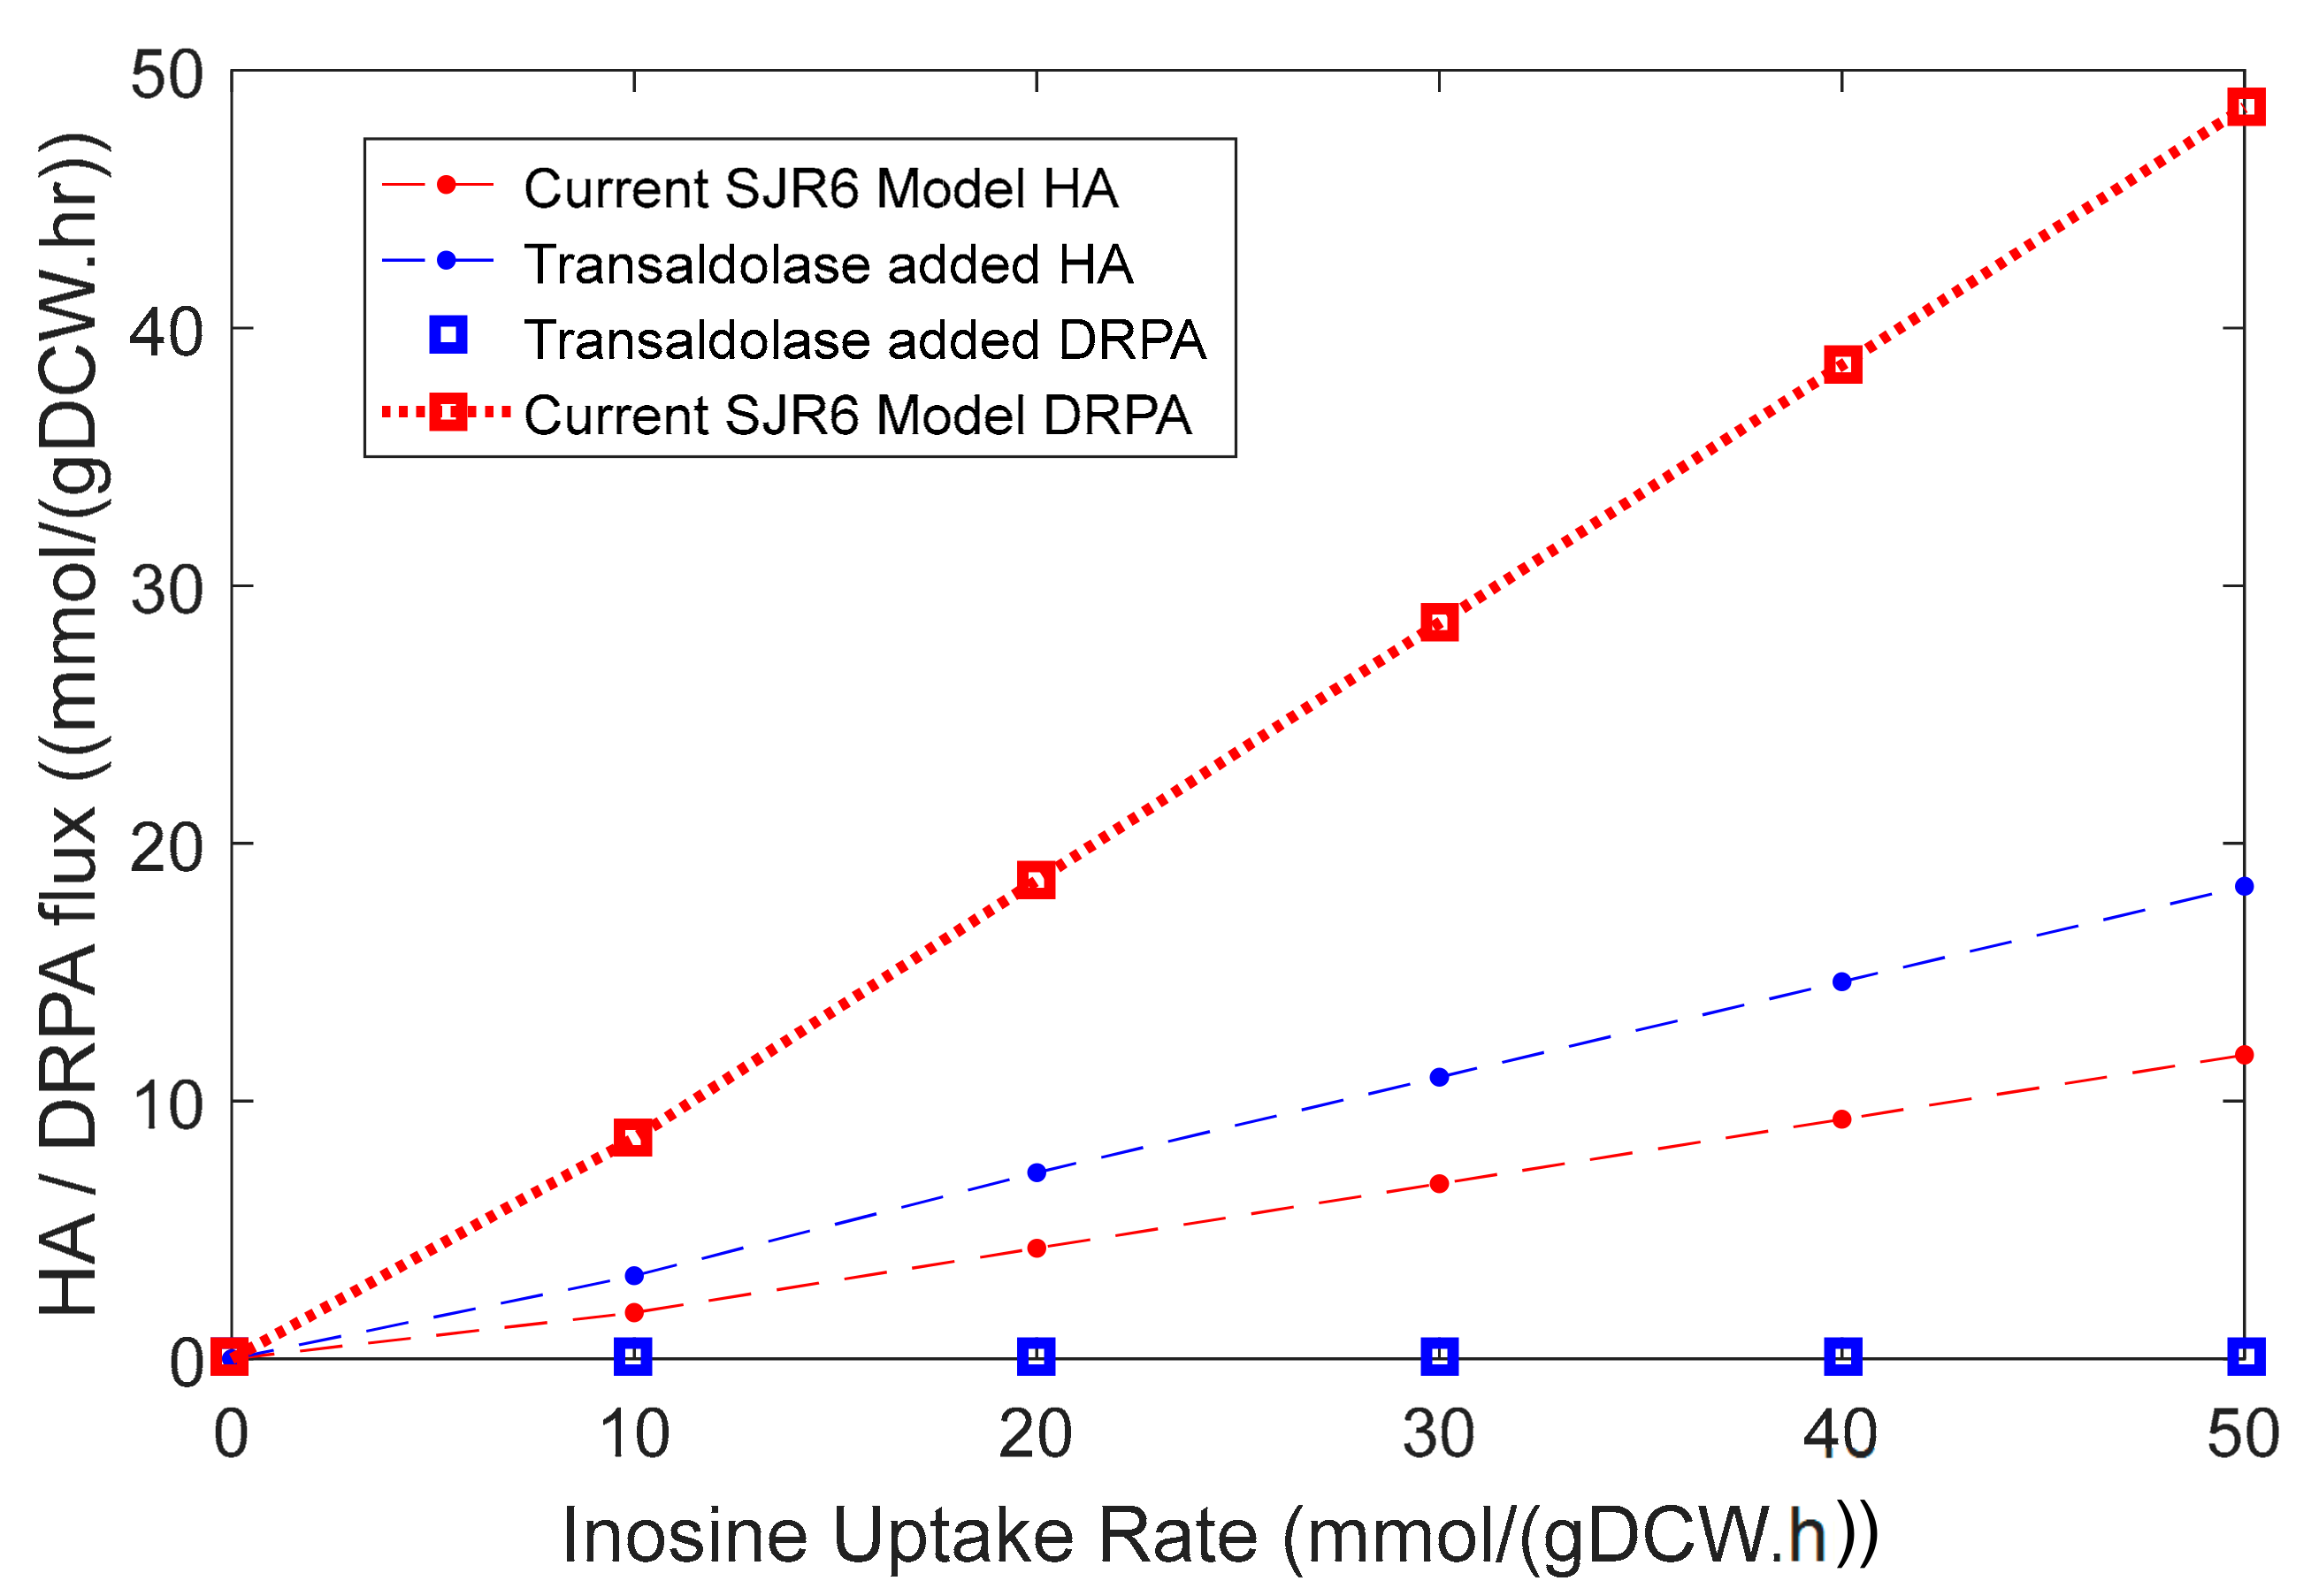
3.4.2. A Transaldolase Knock-In Improves the Inosine Strategy

Once in the cell, there are many fates of catabolism to the ribose moiety. According to Ipata and co-workers, the sinks for ribose phosphates in the cell are nucleoside interconversion reactions and pathways that catabolize ribose as a carbon/energy source [46]. The most common way to use ribose as a carbon/energy source is to join the pentose phosphate pathway. Contrarily, converting the ribose to deoxyribose to metabolize it, as shown in the model analysis, seems to be a convoluted way to contribute to HA production.
However, the pentose phosphate pathway (PPP) is incomplete in L. lactis due to the absence of the transaldolase enzyme. This enzyme catalyzes the conversion of glyceraldehyde 3-phosphate and sedoheptulose 7-phosphate to fructose 6-phosphate and erythrose 4-phosphate. This could be the reason why the model predicted a path from inosine to HA via 2-deoxyribose-5-phosphate aldolase instead of PPP. Calculating a stoichiometric HA yield from this ribose moiety for each of the conditions (Table 3) indicates that fluxing the ribose through the complete PPP leads to the most efficient conversion. Accordingly, a knock-in of transaldolase would help in the full realization of the inosine addition strategy by facilitating the synthesis of one HA monomer from 2.4 ribose molecules. Although we did not test this in vivo, we evaluated this strategy in the model, the results of which are shown in Figure 8. This way, the model also served as a source for verifying an improvisation to the inosine addition strategy.

4. Discussion

Literature reports on HA production have mostly focused on improving process strategies and estimating the sensitivity of the system to external factors [47,48,49]. A few other studies discuss genetic engineering strategies that confer HA producing capabilities to GRAS organisms that originally did not produce HA [8,9,10,11,12,13,14,15]. Flux analysis studies have predominantly looked at agreeing with conditions observed in the real system, though some of them have furthered to identify bottlenecks in HA production [7,20,50]. However, these studies have not attempted a systematic identification of metabolic engineering strategies using a genome-scale model of the microorganism. The analysis of the GEM in this study yielded several unexplored and interesting strategies for improving the biosynthesis of HA in L. lactis.
This study used FSEOF to delineate the entire sub-network related to product synthesis. Further screening to identify overexpression targets was done by categorizing the locations of the enzymes in the sub-network and then looking at relative variability rather than a flux variability analysis as reported in the original paper by Lee and co-workers [26]. This study also excavates an extensive range of new leads from the in vivo validation of the inosine strategy section, as described in Section 3.4. We predict the presence of a hypoxanthine transporter as well as a further increase in HA flux upon transaldolase knock-in. Both of these are great starting points for further studies in this area. Thus, we show that the strategies predicted by these models can be further analyzed thoroughly to get more insights for improvisation.
The updated version of the model, as well as the experiments in this study, suggest that the key contributor to the HA pathway in the inosine strategy is ribose. However, since L. lactis cannot catabolize ribose, inosine seems to be an alternate way to get ribose in the cell. In ribose catabolizing organisms, the uptake would be severely limited by the presence of glucose (catabolite repression), leading to a diauxic growth pattern. However, an equivalent strategy in such organisms would be to engineer co-utilization of ribose and glucose. Several strategies to do this, including phosphotransferase transport system deletion [51] and alteration of the regulatory proteins [52] have been employed in model organisms like E. coli.
This study did not take cofactor limitations into account on HA production. As seen from Figure 2, cofactors such as NAD+, UTP and acetyl CoA played a crucial role in the two pathways for the production of the HA-precursors. We have seen that NAD+/NADH ratios play a crucial role in the molecular weight of HA, through the regulation of genes by NADH-coupled transcription factors [22]. However, such information is more difficult to incorporate in the model developed in this manuscript. Future work would incorporate regulatory models and assessment of metabolic intermediates, which would allow better model predications.

5. Conclusions

In this era where GEMs are becoming increasingly popular as tools for model-driven design of experiments [53,54], this study exploited the power of analyzing such models for enhancing the production of HA. This study was hence the first to systematically identify strategies for HA production from the L. lactis metabolic network. It was also the first report, to the best of our knowledge, that considers the entire L. lactis network for HA production. These results would guide a more nuanced metabolic engineering of L. lactis to overproduce HA.
Contrary to previous focus on the traditional HA biosynthetic pathway, the results reported here indicate that the cell is capable of involving a much larger subset of metabolism for producing HA. Apart from identifying a total of 10 new over-expression, this study also experimentally demonstrated a novel route for in HA synthesis. This work, for the first time, reported the use of a nucleoside to enhance HA production. A three-fold increase in HA titer was also observed in batch fermentations supplemented with 4 g/L inosine. We also show that enhancements of the predicted strategies are possible by further model analysis. Since the product of our interest, HA, shares precursors with other glycosaminoglycans such as heparosan and chondroitin, we speculate that some of our strategies might be transferrable to biological systems producing these HA-like glycosaminoglycans as well.
Overall, in this study, we have predicted and tested (in vivo) metabolic perturbations based on the analysis of the GEM. We have also generated some secondary perturbation predictions based on the in vivo experiments as suggestions for future work to improve HA yields. Based on our results, we postulate that the method used in this study can be applied to predict strategies and improve the production of other valuable high-value metabolites from such model biological systems.

Supplementary Materials

The following are available at https://www.mdpi.com/2227-9717/7/6/343/s1, Supplementary figures and tables Section A: Table A.1: 78 Reactions identified by FSEOF; Figure A.1: Sub-network of over-expression targets from FSEOF analysis created using Escher [38]; Figure A.2: Reverse Phase Chromatogram of spent media at the (a) start with just inosine peak (RT = 13.5 min) and (b) end with hypoxanthine (RT = 11 min) and superimposed hypoxanthine standard (dashed) peaks; Supplementary methods section B: B.1 Standard plots and HPLC protocol; B.2 Adaptations to available L. lactis model; Supplementary Results Section C: C.1 Characteristics of in silico HA production; C.2 Knock-outs predicted to increase the theoretical maximum; C.3 Knock-outs to reach the theoretical maximum. Supplementary file A1.pdf containing a higher resolution of the sub-network. Supplementary model file S.xml.

Author Contributions

A.B., K.R. and G.J. conceptualized and designed the research; A.B. conducted the experimental investigation, validation, formal analysis, computer programming and data visualization; K.R. and G.J. supervised the research; A.B. wrote the original draft of the manuscript and K.R. and G.J. reviewed, edited and polished the manuscript to its final form.

Funding

The research was funded by the Indian Institute of Technology Madras, Department of Biotechnology (Project No. BT/IN/Finland/30/GJ/2013), Government of India and the Ministry of Human Resource and Development, Government of India.

Conflicts of Interest

The authors declare no conflict of interest.

References

  1. Balazs, E.A.; Denlinger, J.L. Viscosupplementation: A new concept in the treatment of osteoarthritis. J. Rheumatol. Suppl. 1993, 39, 3–9. [Google Scholar] [PubMed]
  2. Denlinger, J.L.; Balazs, E.A. Replacement of the liquid vitreus with sodium hyaluronate in monkeys. Exp. Eye Res. 1980, 31, 81–99. [Google Scholar] [CrossRef]
  3. Kogan, G.; Šoltés, L.; Stern, R.; Gemeiner, P. Hyaluronic acid: A natural biopolymer with a broad range of biomedical and industrial applications. Biotechnol. Lett. 2006, 29, 17–25. [Google Scholar] [CrossRef] [PubMed]
  4. Chen, S.-J.; Chen, J.-L.; Huang, W.-C.; Chen, H.-L. Fermentation process development for hyaluronic acid production by Streptococcus zooepidemicus ATCC 39920. Korean J. Chem. Eng. 2009, 26, 428–432. [Google Scholar] [CrossRef]
  5. Gao, H.-J.; Du, G.-C.; Chen, J. Analysis of metabolic fluxes for hyaluronic acid (HA) production by Streptococcus zooepidemicus. World J. Microbiol. Biotechnol. 2006, 22, 399–408. [Google Scholar] [CrossRef]
  6. Liu, L.; Sun, J.; Xu, W.; Du, G.; Chen, J. Modeling and optimization of microbial hyaluronic acid production by Streptococcus zooepidemicus using radial basis function neural network coupling quantum-behaved particle swarm optimization algorithm. Biotechnol. Prog. 2009, 25. [Google Scholar] [CrossRef]
  7. Shah, M.V.; Badle, S.S.; Ramachandran, K.B. Hyaluronic acid production and molecular weight improvement by redirection of carbon flux towards its biosynthesis pathway. Biochem. Eng. J. 2013, 80, 53–60. [Google Scholar] [CrossRef]
  8. Widner, B.; Von Dollen, S.; Tang, M.; Heu, T.; Sloma, A.; Sternberg, D.; Deangelis, P.L.; Weigel, P.H.; Brown, S. Hyaluronic acid production in Bacillus subtilis. Appl. Environ. Microbiol. 2005, 71, 3747–3752. [Google Scholar] [CrossRef]
  9. Chien, L.J.; Lee, C.K. Hyaluronic acid production by recombinant Lactococcus lactis. Appl. Microbiol. Biotechnol. 2007, 77, 339–346. [Google Scholar] [CrossRef]
  10. Prasad, S.B. Metabolic Engineering of Lactococcus Lactis for Hyaluronan Production. Ph.D. Thesis, Indian Institute of Technology-Madras, Chennai, India, 2011. [Google Scholar]
  11. Hoffmann, J.; Altenbuchner, J. Hyaluronic acid production with Corynebacterium glutamicum: Effect of media composition on yield and molecular weight. J. Appl. Microbiol. 2014, 117, 663–678. [Google Scholar] [CrossRef]
  12. Cheng, F.; Gong, Q.; Yu, H.; Stephanopoulos, G. High-titer biosynthesis of hyaluronic acid by recombinant Corynebacterium glutamicum. Biotechnol. J. 2016, 11, 574–584. [Google Scholar] [CrossRef] [PubMed]
  13. Mao, Z.; Shin, H.-D.; Chen, R. A recombinant E. coli bioprocess for hyaluronan synthesis. Appl. Microbiol. Biotechnol. 2009, 84, 63–69. [Google Scholar] [CrossRef] [PubMed]
  14. Mao, Z.; Chen, R.R. Recombinant synthesis of hyaluronan by Agrobacterium sp. Biotechnol. Prog. 2007, 23, 1038–1042. [Google Scholar] [CrossRef]
  15. Jeong, E.; Shim, W.Y.; Kim, J.H. Metabolic engineering of Pichia pastoris for production of hyaluronic acid with high molecular weight. J. Biotechnol. 2014, 185, 28–36. [Google Scholar] [CrossRef] [PubMed]
  16. Liu, L.; Liu, Y.; Li, J.; Du, G.; Chen, J. Microbial production of hyaluronic acid: Current state, challenges, and perspectives. Microb. Cell Fact. 2011, 10, 99. [Google Scholar] [CrossRef] [PubMed]
  17. Jia, Y.; Zhu, J.; Chen, X.; Tang, D.; Su, D.; Yao, W.; Gao, X. Metabolic engineering of Bacillus subtilis for the efficient biosynthesis of uniform hyaluronic acid with controlled molecular weights. Bioresour. Technol. 2013, 132, 427–431. [Google Scholar] [CrossRef] [PubMed]
  18. Prasad, S.B.; Ramachandran, K.B.; Jayaraman, G. Transcription analysis of hyaluronan biosynthesis genes in Streptococcus zooepidemicus and metabolically engineered Lactococcus lactis. Appl. Microbiol. Biotechnol. 2012, 94, 1593–1607. [Google Scholar] [CrossRef] [PubMed]
  19. Prasad, S.B.; Jayaraman, G.; Ramachandran, K.B. Hyaluronic acid production is enhanced by the additional co-expression of UDP-glucose pyrophosphorylase in Lactococcus lactis. Appl. Microbiol. Biotechnol. 2010, 86, 273–283. [Google Scholar] [CrossRef]
  20. Badle, S.S.; Jayaraman, G.; Ramachandran, K.B. Ratio of intracellular precursors concentration and their flux influences hyaluronic acid molecular weight in Streptococcus zooepidemicus and recombinant Lactococcus lactis. Bioresour. Technol. 2014, 163, 222–227. [Google Scholar] [CrossRef]
  21. Chauhan, A.S.; Badle, S.S.; Ramachandran, K.B.; Jayaraman, G. The P170 expression system enhances hyaluronan molecular weight and production in metabolically-engineered Lactococcus lactis. Biochem. Eng. J. 2014, 90, 73–78. [Google Scholar] [CrossRef]
  22. Kaur, M.; Jayaraman, G. Hyaluronan production and molecular weight is enhanced in pathway-engineered strains of lactate dehydrogenase-deficient Lactococcus lactis. Metab. Eng. Commun. 2016, 3, 15–23. [Google Scholar] [CrossRef] [PubMed]
  23. Sanghe, M.B.N. Bioreactor Studies and Flux Analysis for Hyaluronic Acid Production in Pathway Engineered Lactococcus lactis. Master’s Thesis, Indian Institute of Technology-Madras , Chennai, India, 2012. [Google Scholar]
  24. Lee, J.W.; Na, D.; Park, J.M.; Lee, J.; Choi, S.; Lee, S.Y. Systems metabolic engineering of microorganisms for natural and non-natural chemicals. Nat. Chem. Biol. 2012, 8, 536–546. [Google Scholar] [CrossRef] [PubMed]
  25. Burgard, A.P.; Pharkya, P.; Maranas, C.D. Optknock: A bilevel programming framework for identifying gene knockout strategies for microbial strain optimization. Biotechnol. Bioeng. 2003, 84, 647–657. [Google Scholar] [CrossRef] [PubMed]
  26. Choi, H.S.; Lee, S.Y.; Kim, T.Y.; Woo, H.M. In silico identification of gene amplification targets for improvement of lycopene production. Appl. Environ. Microbiol. 2010, 76, 3097–3105. [Google Scholar] [CrossRef] [PubMed]
  27. Hädicke, O.; Klamt, S. CASOP: A computational approach for strain optimization aiming at high productivity. J. Biotechnol. 2010, 147, 88–101. [Google Scholar] [CrossRef] [PubMed]
  28. Kim, J.; Reed, J.L. RELATCH: Relative optimality in metabolic networks explains robust metabolic and regulatory responses to perturbations. Genome Biol. 2012, 13, R78. [Google Scholar] [CrossRef] [PubMed]
  29. Pharkya, P.; Burgard, A.P.; Maranas, C.D. OptStrain: A computational framework for redesign of microbial production systems. Genome Res. 2004, 14, 2367–2376. [Google Scholar] [CrossRef] [Green Version]
  30. Zomorrodi, A.R.; Maranas, C.D. OptCom: A multi-level optimization framework for the metabolic modeling and analysis of microbial communities. PLoS Comput. Biol. 2012, 8, e1002363. [Google Scholar] [CrossRef]
  31. Oliveira, A.P.; Nielsen, J.; Förster, J. Modeling Lactococcus lactis using a genome-scale flux model. BMC Microbiol. 2005, 5, 39. [Google Scholar] [CrossRef]
  32. Verouden, M.P.H.; Notebaart, R.A.; Westerhuis, J.A.; van der Werf, M.J.; Teusink, B.; Smilde, A.K. Multi-way analysis of flux distributions across multiple conditions. J. Chemom. 2009, 23, 406–420. [Google Scholar] [CrossRef]
  33. Notebaart, R.A.; van Enckevort, F.H.J.; Francke, C.; Siezen, R.J.; Teusink, B. Accelerating the reconstruction of genome-scale metabolic networks. BMC Bioinform. 2006, 7, 296. [Google Scholar] [CrossRef] [PubMed]
  34. Flahaut, N.A.L.; Wiersma, A.; van de Bunt, B.; Martens, D.E.; Schaap, P.J.; Sijtsma, L.; dos Santos, V.A.M.; de Vos, W.M. Genome-scale metabolic model for Lactococcus lactis MG1363 and its application to the analysis of flavor formation. Appl. Microbiol. Biotechnol. 2013, 97, 8729–8739. [Google Scholar] [CrossRef]
  35. Schellenberger, J.; Que, R.; Fleming, R.M.T.; Thiele, I.; Orth, J.D.; Feist, A.M.; Zielinski, D.C.; Bordbar, A.; Lewis, N.E.; Rahmanian, S.; et al. Quantitative prediction of cellular metabolism with constraint-based models: The COBRA Toolbox v2.0. Nat. Protoc. 2011, 6, 1290–1307. [Google Scholar] [CrossRef]
  36. Varma, A.; Palsson, B.O. Stoichiometric flux balance models quantitatively predict growth and metabolic by-product secretion in wild-type Escherichia coli W3110. Appl. Environ. Microbiol. 1994, 60, 3724–3731. [Google Scholar] [PubMed]
  37. Segre, D.; Vitkup, D.; Church, G.M. Analysis of optimality in natural and perturbed metabolic networks. Proc. Natl. Acad. Sci. USA 2002, 99, 15112–15117. [Google Scholar] [CrossRef] [PubMed] [Green Version]
  38. King, Z.A.; Dräger, A.; Ebrahim, A.; Sonnenschein, N.; Lewis, N.E.; Palsson, B.O. Escher: A web application for building, sharing, and embedding data-rich visualizations of biological pathways. PLOS Comput. Biol. 2015, 11, e1004321. [Google Scholar] [CrossRef] [PubMed]
  39. Bitter, T.; Muir, H.M. A modified uronic acid carbazole reaction. Anal. Biochem. 1962, 4, 330–334. [Google Scholar] [CrossRef]
  40. Farthing, D.; Sica, D.; Gehr, T.; Wilson, B.; Fakhry, I.; Larus, T.; Farthing, C.; Karnes, H.T. An HPLC method for determination of inosine and hypoxanthine in human plasma from healthy volunteers and patients presenting with potential acute cardiac ischemia. J. Chromatogr. B 2007, 854, 158–164. [Google Scholar] [CrossRef]
  41. Farmer, W.R.; Liao, J.C. Improving lycopene production in Escherichia coli by engineering metabolic control. Nat. Biotechnol. 2000, 18, 533–537. [Google Scholar] [CrossRef]
  42. Shimada, H.; Kondo, K.; Fraser, P.D.; Miura, Y.; Saito, T.; Misawa, N. Increased carotenoid production by the food yeast Candida utilis through metabolic engineering of the isoprenoid pathway. Appl. Environ. Microbiol. 1998, 64, 2676–2680. [Google Scholar]
  43. Zhang, Y.; Luo, K.; Zhao, Q.; Qi, Z.; Nielsen, L.K.; Liu, H. Genetic and biochemical characterization of genes involved in hyaluronic acid synthesis in Streptococcus zooepidemicus. Appl. Microbiol. Biotechnol. 2016, 100, 3611–3620. [Google Scholar] [CrossRef] [PubMed]
  44. Bzowska, A.; Kulikowska, E.; Shugar, D. Purine nucleoside phosphorylases: Properties, functions, and clinical aspects. Pharmacol. Ther. 2000, 88, 349–425. [Google Scholar] [CrossRef]
  45. He, Y.; Sanderson, I.R.; Walker, W.A. Uptake, transport and metabolism of exogenous nucleosides in intestinal epithelial cell cultures. J. Nutr. 1994, 124, 1942–1949. [Google Scholar] [CrossRef] [PubMed]
  46. Tozzi, M.G.; Camici, M.; Mascia, L.; Sgarrella, F.; Ipata, P.L. Pentose phosphates in nucleoside interconversion and catabolism. FEBS J. 2006, 273, 1089–1101. [Google Scholar] [CrossRef] [PubMed]
  47. Liu, L.; Yang, H.; Zhang, D.; Du, G.; Chen, J.; Wang, M.; Sun, J. Enhancement of hyaluronic acid production by batch culture of Streptococcus zooepidemicus with N-Dodecane as an oxygen vector. J. Microbiol. Biotechnol. 2009, 19, 596–603. [Google Scholar] [PubMed]
  48. Duan, X.-J.; Yang, L.; Zhang, X.; Tan, W.-S. Effect of oxygen and shear stress on molecular weight of hyaluronic acid. J. Microbiol. Biotechnol. 2008, 18, 718–24. [Google Scholar] [PubMed]
  49. Vázquez, J.A.; Montemayor, M.I.; Fraguas, J.; Murado, M.A. Hyaluronic acid production by Streptococcus zooepidemicus in marine by-products media from mussel processing wastewaters and tuna peptone viscera. Microb. Cell Fact. 2010, 9, 46. [Google Scholar] [CrossRef]
  50. Jagannath, S.; Ramachandran, K.B. Influence of competing metabolic processes on the molecular weight of hyaluronic acid synthesized by Streptococcus zooepidemicus. Biochem. Eng. J. 2010, 48, 148–158. [Google Scholar] [CrossRef]
  51. Nichols, N.N.; Dien, B.S.; Bothast, R.J. Use of catabolite repression mutants for fermentation of sugar mixtures to ethanol. Appl. Microbiol. Biotechnol. 2001, 56, 120–125. [Google Scholar] [CrossRef]
  52. Yao, R.; Shimizu, K. Recent progress in metabolic engineering for the production of biofuels and biochemicals from renewable sources with particular emphasis on catabolite regulation and its modulation. Process. Biochem. 2013, 48, 1409–1417. [Google Scholar] [CrossRef]
  53. McCloskey, D.; Palsson, B.O.; Feist, A.M. Basic and applied uses of genome-scale metabolic network reconstructions of Escherichia coli. Mol. Syst. Biol. 2014, 9, 661–661. [Google Scholar] [CrossRef] [PubMed]
  54. Mienda, B.S. Genome-scale metabolic models as platforms for strain design and biological discovery. J. Biomol. Struct. Dyn. 2016, 35, 1–23. [Google Scholar] [CrossRef] [PubMed]
Figure 1. Hyaluronan (HA) structure with repeating units of glucuronic acid (left) and N acetyl glucosamine (right) connected as beta (1–3) glucuronide and beta (1–4) glucosaminidic bonds.
Processes 07 00343 g001
Figure 2. Traditional HA biosynthetic pathway (solid arrows) in microorganisms. The corresponding genes in engineered Lactococcus lactis are labeled with their gene symbol in an italicized font. Striped arrows indicate competing pathways that take metabolic intermediates away from HA biosynthesis.
Processes 07 00343 g002
Figure 3. Categories of over-expression targets in the product sub-network of a model cell: S1, S2 and S3 are taken up by the cell and contribute to the production of the product in different ways. Type I targets (bold solid arrows) from the traditional biosynthetic pathway; Type II(A) targets (dotted arrow) can be overexpressed to add a bias at the branch point metabolite associated with it. Type II(B) targets (double compound arrow) can be traced out from contributors (dashed arrow) that are parts of a linear path.
Processes 07 00343 g003
Figure 4. Equimolar Hypoxanthine (×) production with inosine (♦) consumption for (a) 1.5 g/L inosine and (b) 3 g/L inosine runs.
Processes 07 00343 g004
Figure 5. Batch experiments in bioreactors. Final HA concentration vs. initial inosine concentration in the batch bioreactor study with 20 g/L glucose.
Processes 07 00343 g005
Figure 6. Fermentation profiles of batch run with 20 g/L glucose and inosine at 0 g/L (a), 1.5 g/L (b), 3 g/L (c) and 4 g/L (d). Unconsumed inosine observed in (c) and (d). Glucose (◆); biomass (⬤); HA (■) and inosine (▲).
Processes 07 00343 g006
Figure 7. Fermentation profile of a batch run with 3 g/L inosine and 30 g/L glucose showing higher inosine consumption (glucose (▲); biomass (⬤); HA (■) and inosine (◆)).
Processes 07 00343 g007
Figure 8. Simulations showing an increase in the slope of the HA flux from inosine in the current model. Red data points represent flux values from the current model, while blue data points represent values from the model with transaldolase knock-in. One can observe the increase in the slope of HA flux with inosine flux upon transaldolase knock-in (blue dashed line) compared to that in the current model (red dashed line). The square markers represent 2-deoxyribose-5-phosphate aldolase (DRPA) reaction when transaldolase is present.
Processes 07 00343 g008
Table 1. Effect of each predicted Type-II over-expression strategy on HA flux.
StrategySlope of Maximum HA Flux vs. Strategy Flux
Type-II(A)
2-dexyribose-5-phosphate aldolase6.23
Glutamine synthase1
Acetaldehyde dehydrogenase (acetylating)0.66
l-serine deaminase0.56
Deoxycytidine deaminase0.25
Type-II(B)
Glutamine uptake1
Inosine uptake0.25
Serine uptake 0.07
Isoleucine uptake0.03
Aspartate uptake0.03
Table 2. Yield of HA from inosine and glucose in the batch bioreactor runs.
ParameterControlInitial Inosine 1.5 g/LInitial Inosine 3 g/LInitial Inosine 4 g/L
ΔGlucose (g/L)20202020
C-moles of Glucose0.670.670.670.67
Average ΔInosine (g/L)01.522.5
C-moles of inosine00.060.080.09
Average HA titer (g/L)0.370.530.641.10
C-moles of HA monomer0.010.020.020.04
YHA/S_total (C-mole/C-mole)0.020.030.030.05
Table 3. Stoichiometric yield of HA from ribose phosphate of inosine through different paths. (PPP—pentose phosphate pathway; G6P—glucose-6-phosphate; G3P—glyceraldehyde-3-phosphate and R1P—ribose-1-phosphate).
PathNo. of G6Ps per MonomerNo. of G3Ps per MonomerNo. of R1Ps per MonomerStoichiometric YieldRemarks
Incomplete PPP2480.12No transaldolase
2dr5P aldolase40.25Model predicted this to be the best path for maximum HA
PPP2.40.42Added knock-in helps in improving the yield (stoichiometric)

