Aeration Process in Bioreactors as the Main Energy Consumer in a Wastewater Treatment Plant. Review of Solutions and Methods of Process Optimization


Abstract
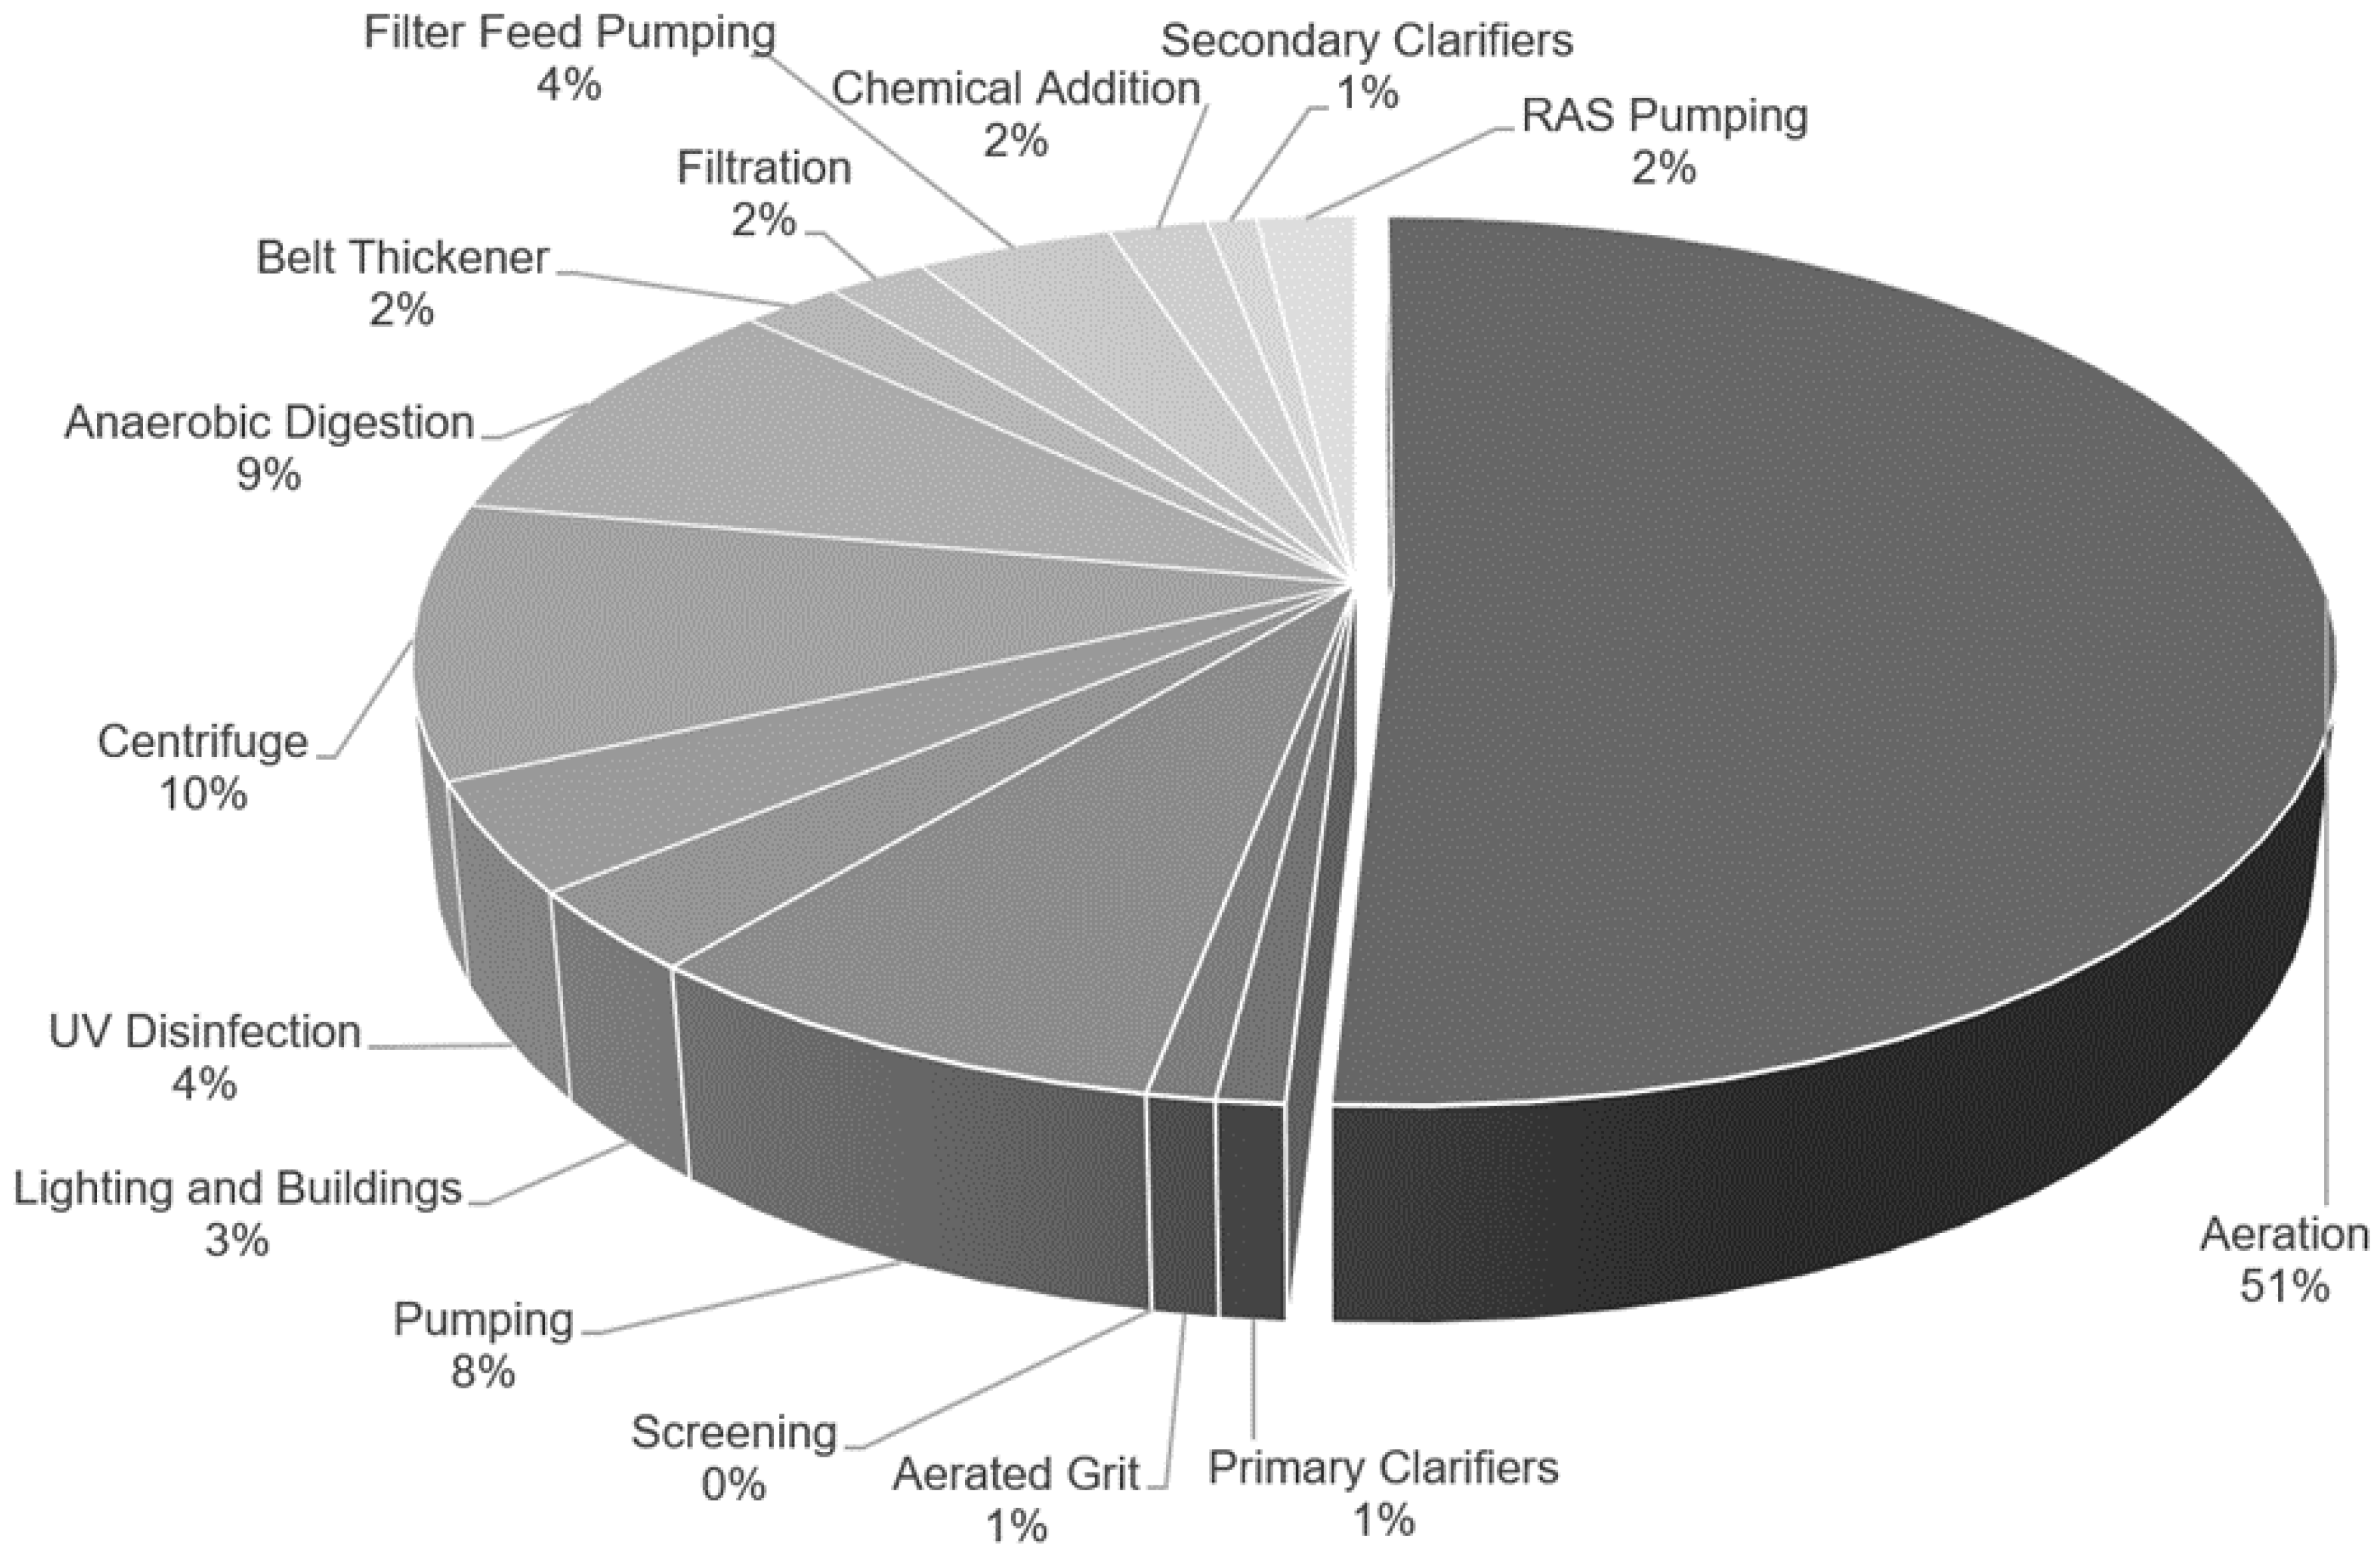
:1. Introduction
2. Aeration Systems Construction
2.1. Surface Aeration
2.2. Aeration by Means of Blowers
3. Oxygen Transfer Efficiency
- substances contained in wastewater and activated sludge;
- SOTE—Standard Oxygen Transfer Efficiency, e.g., [%/m];
- concentration of dissolved oxygen [g O2/m3];
- depth of diffusers location [m];
- stream of air flowing through a diffuser [m3/diffuser h];
- wastewater temperature;
- degree of diffuser fouling.
3.1. Influence of the Substances Contained in a Wastewater Mixture and Activated Sludge
3.2. Standard Oxygen Transfer Efficiency
3.3. Concentration of Dissolved Oxygen
3.4. Depth of Diffuser Arrangement
3.5. Air Flow Rate through a Diffuser
3.6. Wastewater Temperature
3.7. Diffuser Fouling
- fibrous substances;
- organic and inorganic substances infiltrating into diffuser pores as a result of insufficient air flow;
- oils, greases and fats;
- precipitated substances, e.g., iron compounds, carbonates;
- biofilm;
- organic and inorganic substances trapped in the biofilm growing on diffuser material.
- particulate matter from a non-purified or inappropriately purified air;
- oils leaks from blowers;
- corrosion and residues from corroding pipes supplied compressed air;
- pollutants contained in wastewater infiltrating to the pipe with compressed air via damaged diffusers or cracked pipes.
3.7.1. Types of Diffuser Fouling
3.7.2. Effects of Diffuser Fouling
3.7.3. Rate of Fouling and Diagnosing the Diffuser Condition
3.7.4. Methods of Dealing with Diffuser Fouling
- high pressure washing;
- pouring with hydrochloric acid;
- submerging in hydrochloric acid (disassembly required);
- firing (disassembly required);
- sanding (disassembly required).
3.7.5. Diffuser Selection
4. “Smart Control” in Wastewater Treatment
- the simplest strategies do not use the feedback signals and are only based on supplying appropriate amount of air to the object;
- more advanced strategies employ the feedback from the oxygen level in nitrification zones;
- the most recent strategies involve the feedback from the remaining variables (ammonia nitrogen, total nitrogen) and use it to adjust the optimal level of oxygen concentration (and recirculation) in aerobic.
- Economic efficiency analysis (EEA)—EEA involves the analysis of capital and operating costs, as well as the economic benefit characterizing WWTPs. It focuses on decreasing the operating costs using advanced systems of control, and improving the energy recovery, thus increasing the economic benefit [80,81,82];
- Carbon footprint analysis (CFA)—CFA is employed for measuring the total amount of greenhouse gases produced during the operation of wastewater treatment plant. The carbon footprint in WWTPs can be mitigated by decreasing the energy consumption through on-site energy recovery and improving the efficiency of aeration [83,84,85,86,87,88];
- Life cycle assessment (LCA)—LCA constitutes a standardized procedure which is employed for examining the environmental aspects characterizing wastewater treatment plants. This approach was adopted in a few studies in order to investigate the energy-related issues, including the production of biogas as well as AD [89,90,91];
- Data envelopment analysis (DEA)—DEA is commonly used to evaluate the eco-efficiency, frequently when the available data is limited. The eco-efficiency of a treatment plant is determined by integrating such factors as energy consumption, economic cost, removal of pollutants as well as contribution to the global warming effect [24,92,93,94,95];
- Plant-wide modeling—the performance of wastewater treatment plant can be predicted using simulation tools and analysis of the data pertaining to energy consumption as well as the influent and effluent quality. This approach is also viable when one wishes to compare various strategies of achieving energy neutral condition. The performance of wastewater treatment plants can also be evaluated using multi-objective approach with dynamic process model involving LCA, detailed energy models, GHG and operational costs [10,11,12,13,14,15,16].
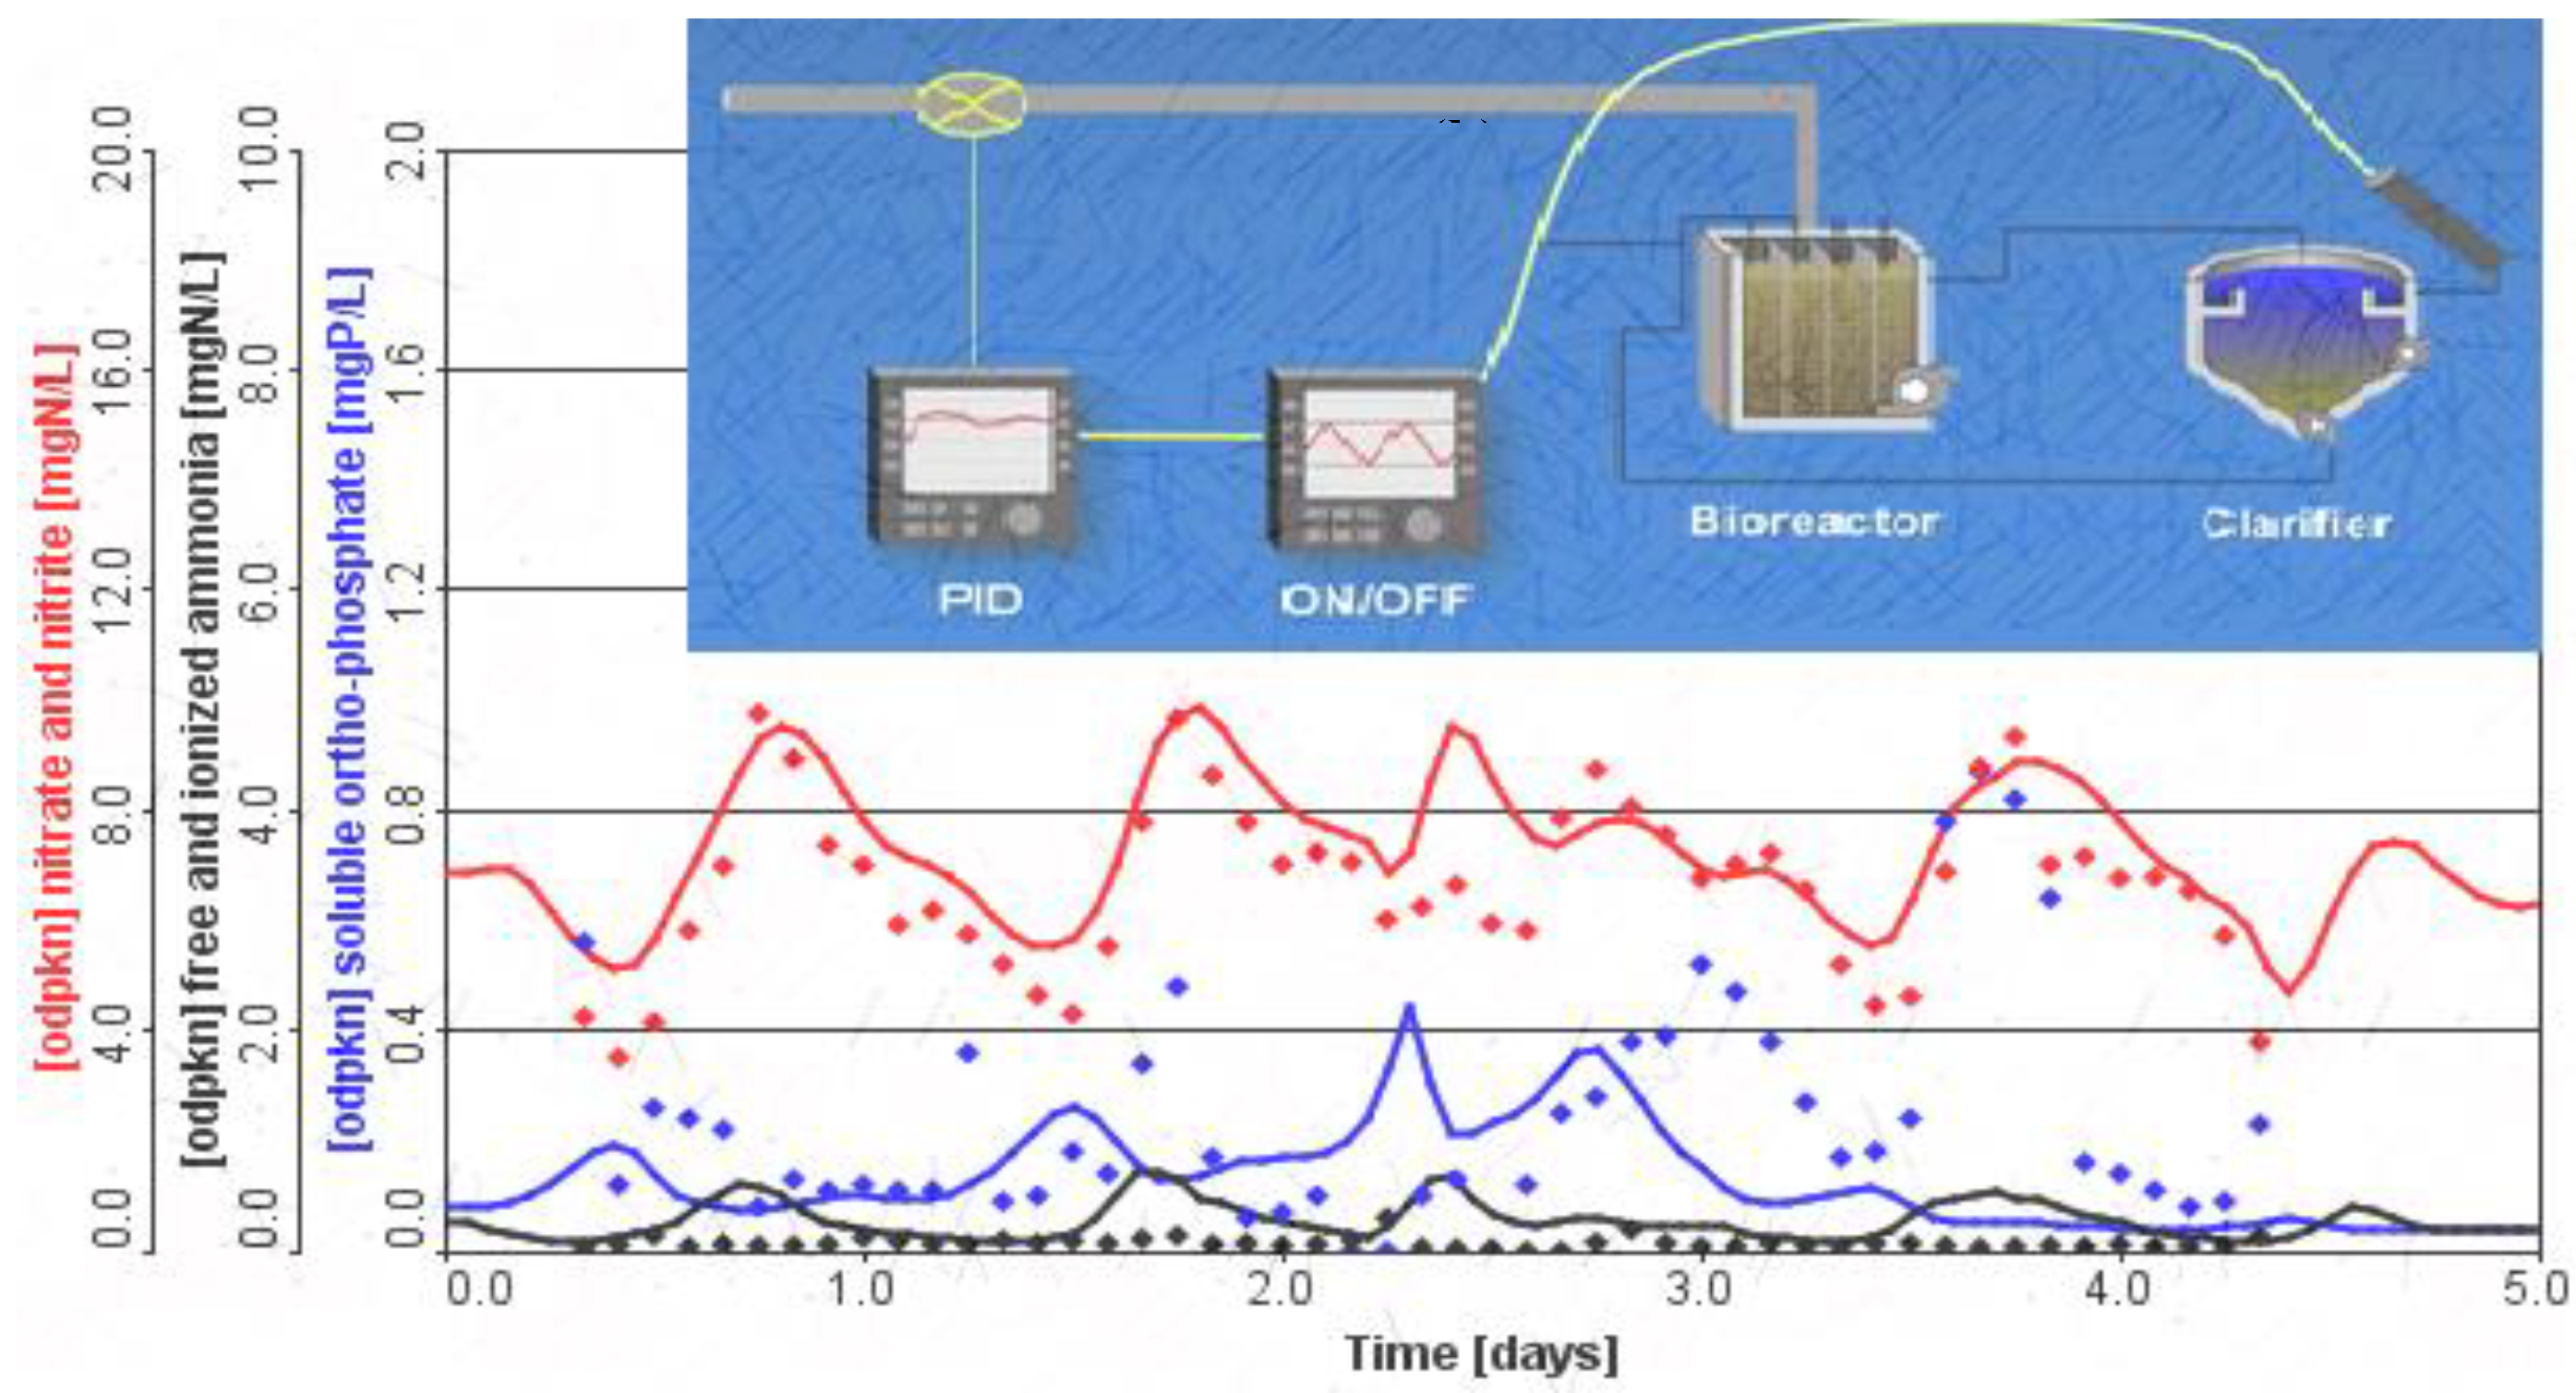
5. Modelling, Design, and Functions of the Control System on the Example of “Dębogórze” WWTP
- implementation of an automatic process control algorithm in the allocated area,
- remote control via computer in the Central Dispatcher (manual and automatic),
- transmitting the information on technological parameters and device condition via the computer network to the Central Dispatche.
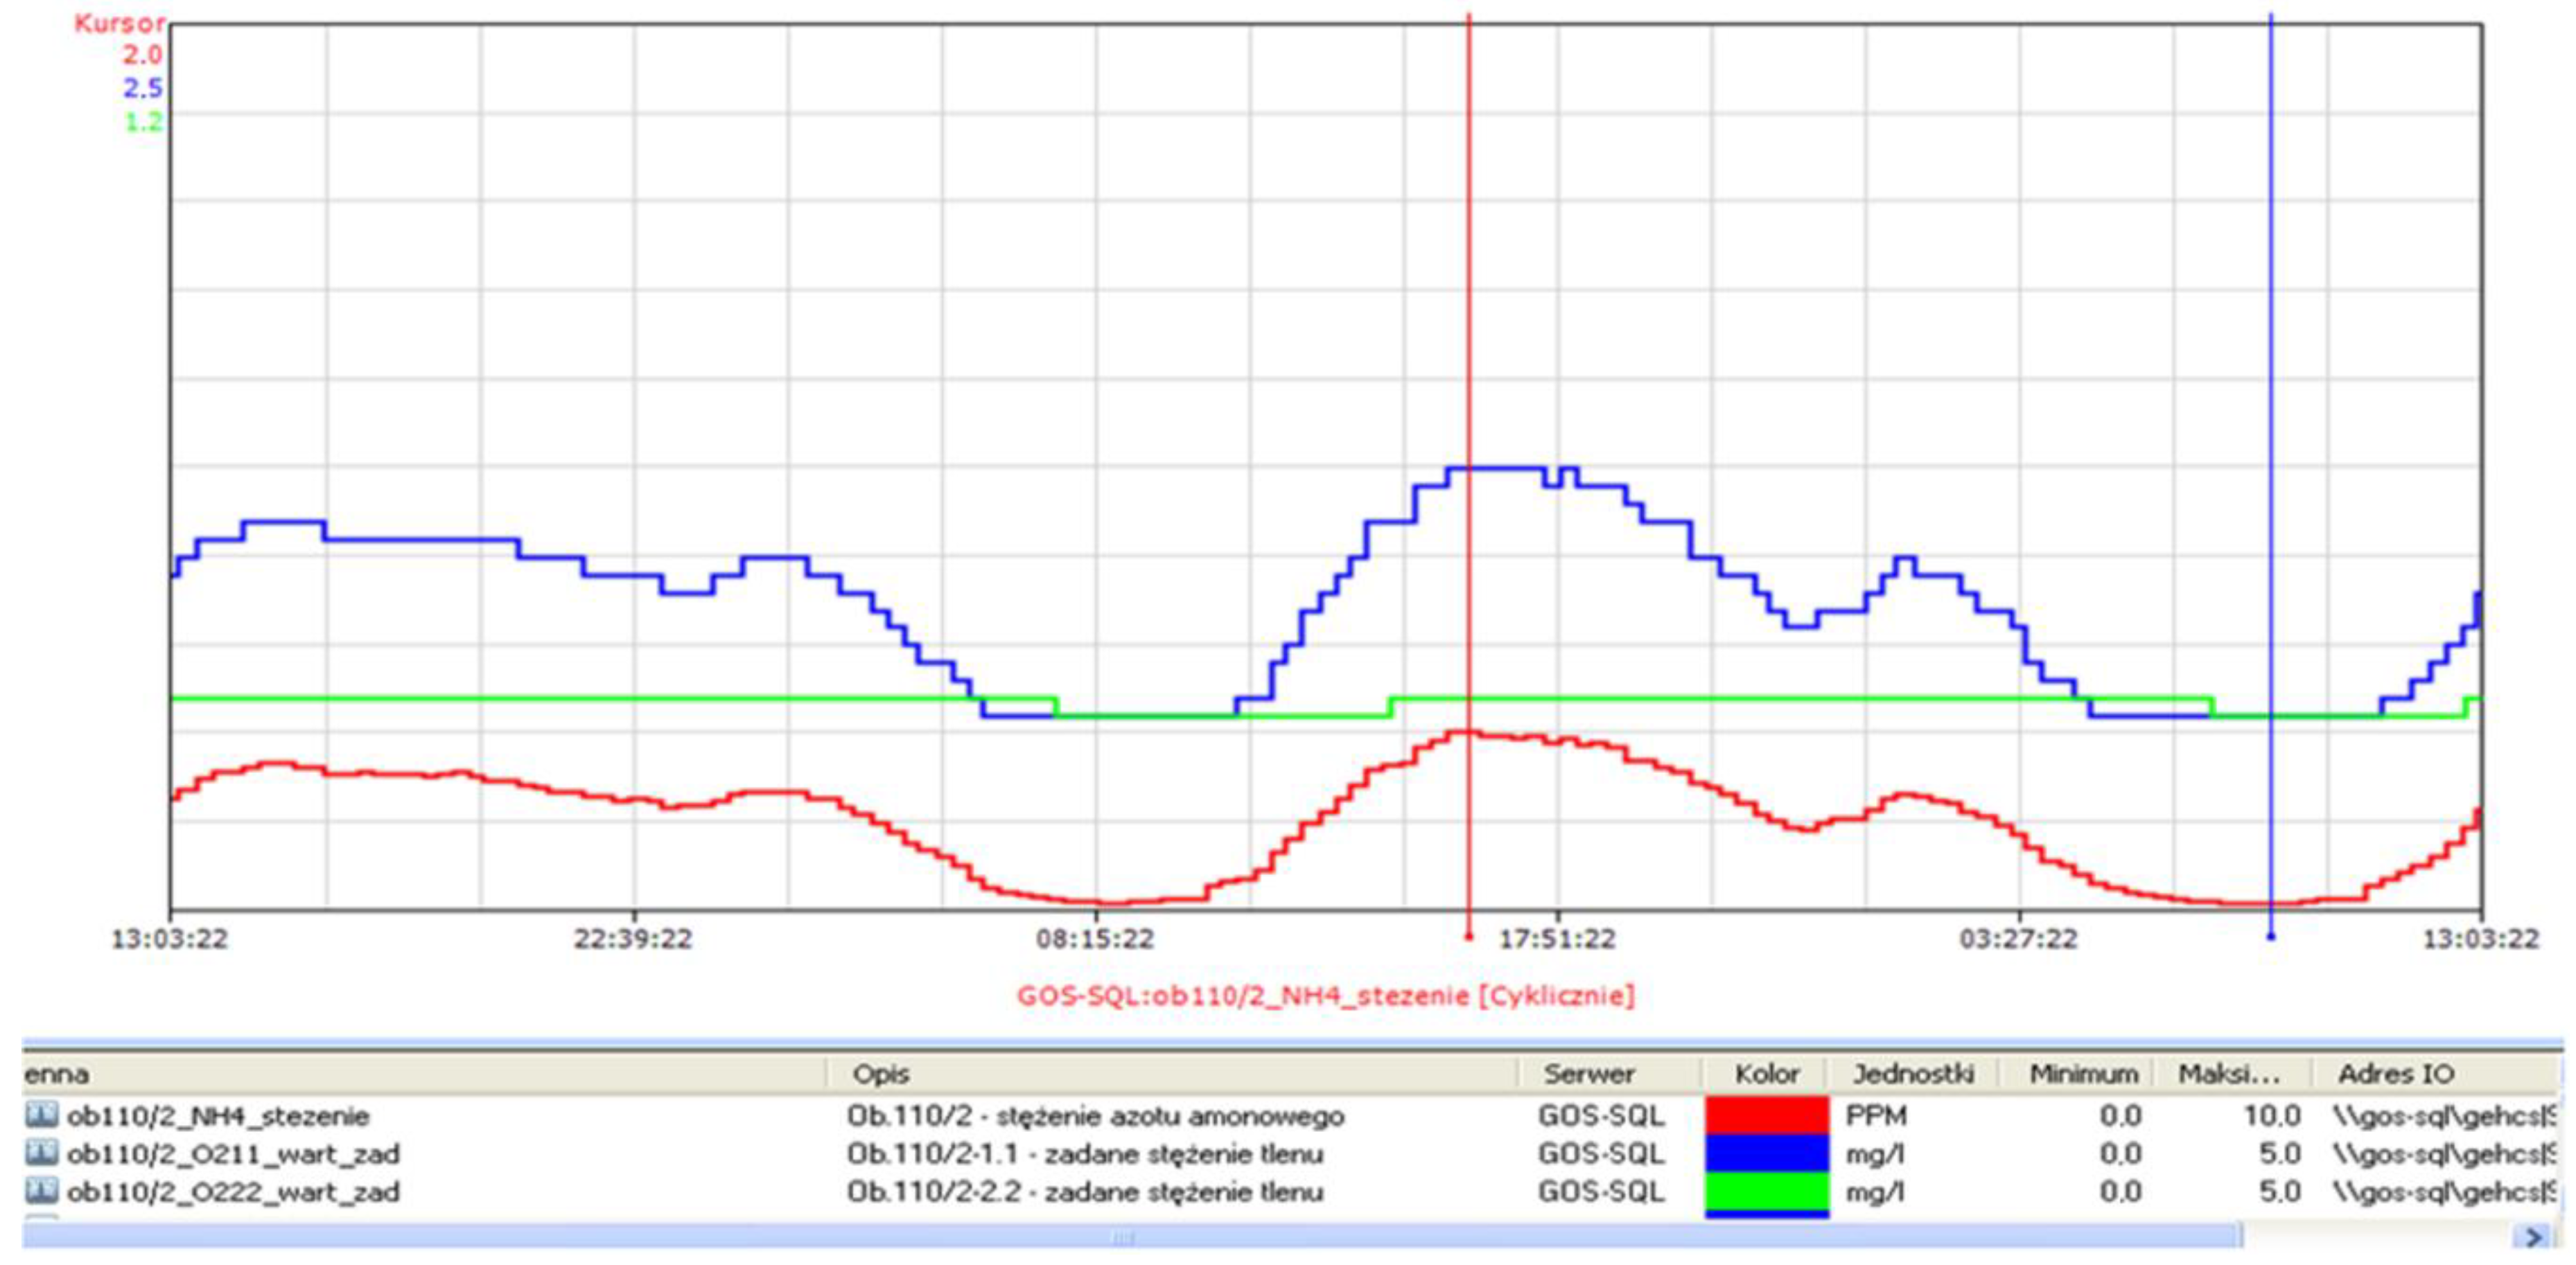
- controlling the correctness of the nitrification process on the basis of readouts from the ammonia nitrogen measurement devices installed at the outlets from particular reactor blocks;
- automatic regulation of the aeration level depending on the concentration of ammonia nitrogen at the reactor outlets—the control system sets the oxygen concentration which should be maintained in particular aerobic zones of reactors;
- probes ensure automatic regulation of the correct oxygen level in particular aerobic zones—the amount of air supplied to particular zones is controlled with electric throttle valve, while the control system ensures the high efficiency of blowers.
- NH4-N/NH3-N probe, AMTAX/NITRATAX (reagent analyzers) together with the probe filter, type: LXG421/LXG417,
- DO concentration in each of the three oxygen sections at each bioreactor was measured on-line by using a luminescent dissolved oxygen probe,
- pH and ORP were on-line measured by using pH and ORP probes supplied by Hach-Lange.
6. Summary and Conclusions
Author Contributions
Funding
Conflicts of Interest
References
- Spencer, D.; Murdoch, F. The Role of Respirometry in Maximising Aerobic Treatment Plant Efficiency; Strathkelvin Instruments Ltd.: Glasgow, UK, 2002. [Google Scholar]
- Bodington, V.; Langford, A.; Dooley, M.; Diamond, K. Cardiff WWTW Aeration Optimisation through Scientific Control; Strathkelvin Instruments Ltd.: Glasgow, UK, 2009. [Google Scholar]
- Godniok, M.; Korczak, K.; Zdebik, D. Metodyczne aspekty analizy aktywności oddechowej mikroorganizmów osadu czynnego w odniesieniu do możliwości optymalizacji pracy biologicznej oczyszczalni ścieków/ Methodical aspects of analysis of respiratory activity of microorganisms in the activated sludge, in reference to the possibility of biological treatment plant work optimization. Prace Naukowe GIG 2010, 1, 5–15. [Google Scholar]
- Quant, B.; Remiszewska-Skwarek, A.; Manini, K. Dezintegracja niskotemperaturowa jako skuteczny sposób kondycjonowania osadów ściekowych. In Polska Inżynieria Środowiska; Dudzińska, M.R., Pawłowski, A., Eds.; Komitetu Inżynierii Środowiska PAN: Lublin, Poland, 2012; Volume 99, pp. 131–146. [Google Scholar]
- Woźniak-Vecchie, R. Biologiczne oczyszczanie ścieków. Sztuka napowietrzania. Mag. Instal. 2014, 187, 46–48. [Google Scholar]
- Dereszewska, A.; Cytawa, S. Zastosowanie sondy do pomiaru zawartości azotu amonowego i azotanowego jako element sterowania procesem oczyszczania ścieków/Implementation of the ammonium and nitrate sensor as an element of wastewater treatment process control. Econ. Menag. 2012, 1, 127–136. [Google Scholar]
- Bennett, A. Wastewater treatment: Bubbling up for major energy saving. Filtr. Separat. 2011, 48, 42–43. [Google Scholar]
- Water Environment Federation. Energy Conservation in Wastewater Treatment Facilities—Manual and Practice; No 32; WEF Press: Alexandria, VA, USA, 2009. [Google Scholar]
- Turunen, V.; Sorvari, J.; Mikola, A. A decision support tool for selecting the optimal sewage sludge treatment. Chemosphere 2018, 193, 521–529. [Google Scholar] [CrossRef]
- Flores-Alsina, X.; Arnell, M.; Amerlinck, Y.; Corominase, L.; Gernaey, K.V.; Guo, L.; Lindbloma, E.; Nopens, I.; Porro, J.; Shaw, A.; et al. Balancing effluent quality, economic cost and greenhouse gas emissions during the evaluation of (plant-wide) control/operational strategies in WWTPs. Sci. Total Environ. 2014, 466–467, 616–624. [Google Scholar] [CrossRef] [PubMed]
- Mannina, G.; Cosenza, A.; Gori, R.; Garrido-Baserba, M.; Sobhani, R.; Rosso, D. Greenhouse gas emissions from wastewater treatment plants on a plantwide scale: Sensitivity and uncertainty analysis. J. Environ. Eng. 2016, 142, 04016017. [Google Scholar] [CrossRef]
- Mannina, G.; Ekama, G.; Caniani, D.; Cosenza, A.; Esposito, G.; Gori, R.; Garrido-Baserba, M.; Rosso, D.; Olsson, G. Greenhouse gases from wastewater treatment—A review of modelling tools. Sci. Total Environ. 2016, 551–552, 254–270. [Google Scholar] [CrossRef]
- Barbu, M.; Vilanova, R.; Meneses, M.; Santin, I. Global evaluation of wastewater treatment plants control strategies including CO2 emissions. IFAC Pap OnLine 2017, 50, 12956–12961. [Google Scholar] [CrossRef]
- Solon, K.; Flores-Alsina, X.; Kazadi Mbamba, C.; Ikumi, D.; Volcke, E.I.P.; Vaneeckhaute, C.; Ekama, G.; Vanrolleghem, P.A.; Batstone, D.J.; Gernaey, K.V.; et al. Plantwide modelling of phosphorus transformations in wastewater treatment systems: Impacts of control an operational strategies. Water Res. 2017, 113, 97–110. [Google Scholar] [CrossRef]
- Arnell, M.; Rahmberg, M.; Oliveira, F.; Jeppsson, U. Multiobjective performance assessment of wastewater treatment plants combining plant-wide process models and life cycle assessment. J. Water Clim. Chang. 2017, 8, 715–729. [Google Scholar] [CrossRef]
- Zaborowska, E.; Czerwionka, K.; Makinia, J. Strategies for achieving energy neutrality in biological nutrient removal systems—A case study of the Slupsk WWTP (northern Poland). Water Sci. Technol. 2017, 75, 727–740. [Google Scholar] [CrossRef] [PubMed]
- Dominguez, D.; Gujer, W. Evolution of a wastewater treatment plant challenges traditional design concepts. Water Res. 2006, 40, 1389–1396. [Google Scholar] [CrossRef] [PubMed]
- Drewnowski, J.; Remiszewska-Skwarek, A.; Fernandez-Morales, F.J. Model based evaluation of plant improvement at a large wastewater treatment plant (WWTP). J. Environ. Sci. Health A 2018, 53, 1–7. [Google Scholar] [CrossRef]
- Drewnowski, J.; Remiszewska-Skwarek, A.; Fudala-Ksiazek, S.; Luczkiewicz, A.; Kumari, S.; Bux, F. The evaluation of COD fractionation and modeling as a key factor for appropriate optimization and monitoring of modern cost-effective activated sludge systems. J. Environ. Sci. Health A 2019, 54, 1–7. [Google Scholar] [CrossRef] [PubMed]
- Heidrich, Z.; Witkowski, A. Wybór systemu napowietrzania w procesie oczyszczania ścieków metoda osadu czynnego. Inż. Ekol. 2006, 14, 12–15. [Google Scholar]
- Łomotowski, J.; Szpindor, A. Nowoczesne Systemy Oczyszczania Ścieków; Arkady: Warszawa, Poland, 1999. [Google Scholar]
- Bever, J.; Stein, A.; Teichmann, H. Zaawansowane Metody Oczyszczania Ścieków; Oficyna Wydawnicza Projprzem-Eko: Bydgoszcz, Poland, 1997. [Google Scholar]
- Longo, S.; Mirko, B.A.; Bongards, M.; Chaparro, A.; Cronrath, A.; Fatone, F.; Lema, J.M.; Mauricio-Iglesias, M.; Soares, A.; Hospido, A. Monitoring and diagnosis of energy consumption in wastewater treatment plants. A state of the art and proposals for improvement. Appl. Energy 2016, 179, 1251–1268. [Google Scholar] [CrossRef]
- Guerrini, A.; Romano, G.; Indipendenza, A. Energy Efficiency Drivers in Wastewater Treatment Plants: A Double Bootstrap DEA Analysis. Sustainability 2017, 9, 1126. [Google Scholar] [CrossRef]
- Janiak, K. Stopień wykorzystania tlenu i czynniki na niego wpływające: Część I/ Oxygen transfer efficiency and its influencing factors: Part 1. Forum Eksploatatora 2012, 4, 44–49. [Google Scholar]
- German, A.T.V. Rules and Standards. In ATV M 209E, Measurement of the Oxygen Transfer Inactivated Sludge Aeration Tanks with Clean Water and in Mixed Liquor; Gesellschaft zur Förderung der Abwassertechnik e.V. (GFA): Hennef, Germany, 1996. [Google Scholar]
- Chern, J.M.; Chou, S.R.; Shang, C.S. Effects of impurities on oxygen transfer rates in diffused aeration system. Water Res. 2001, 35, 3041–3048. [Google Scholar] [CrossRef]
- US EPA. Development of Standard Procedures for Evaluating Oxygen Transfer Devices; EPA-600/2-83-102; EPA: Washington, DC, USA, 1983.
- Stenstrom, M.K.; Gilbert, R.G. Effects of α, β and θ factor upon the design, specification and operation of aeration systems. Water Res. 1981, 15, 643–654. [Google Scholar] [CrossRef]
- Downing, A.L.; Bayley, R.W.; Boon, A.G. The performance of mechanical aerators. J. Inst. Sewage Purif. 1960, 3, 231–242. [Google Scholar]
- Eckenfelder, W.W.; Raymond, L.W.; Lauria, D.T. Effect of various organic substances on oxygen absorption efficiency. Sewage Ind. Wastes 1956, 28, 1357–1364. [Google Scholar]
- Fisher, M.J.; Boyle, W.C. Effect of anaerobic anoxic selectors on oxygen transfer in wastewater. Wat. Environ. Res. 1999, 71, 84–93. [Google Scholar] [CrossRef]
- Hwang, H.J.; Stenstrom, M.K. The Effect of Surface Active Agent on Oxygen Transfer; UCLA-ENG-79-30; University of California: Los Angeles, CA, USA, 1979. [Google Scholar]
- Krampe, J.; Krauth, K. Oxygen transfer into activated sludge with high MLSS concentrations. Water Sci. Technol. 2003, 47, 297–303. [Google Scholar] [CrossRef] [PubMed]
- Rosso, D.; Larson, L.E.; Stenstrom, M.K. Aeration of large-scale municipal wastewater treatment plants state of the art. Water Sci. Technol. 2008, 57, 973–978. [Google Scholar] [CrossRef]
- Mueller, J.A.; Boyle, W.C.; Pöpel, H.J. Aeration: Principles and Practice; CRC Press: Boca Raton, FL, USA, 2002. [Google Scholar]
- Wagner, M.; Krause, S. Investigation of oxygen transfer rates in full scale membrane bioreactors. Water Sci. Technol. 2003, 47, 313–319. [Google Scholar] [CrossRef]
- Fröse, G. Praxiserfahrungen mit dem ATV-Merkblatt M 209 und Vorstellung des neuen europäischen Norm-Entwurfes DIN EN 12255-15 zur Messung der Sauerstoffzufuhr in Reinwasser. Schriftenreihe WAR 2001, 134, 57–70. [Google Scholar]
- Piotrowski, R. Wielopoziomowy system sterowania stężeniem tlenu I wyznaczania trajektorii zadanej stężenia tlenu w biologicznej oczyszczalni ścieków/Multilevel control system for dissolved oxygen control and determining the set point trajectory of dissolved oxygen in a biological watewater treatment plant. Pomiary Automatyka Robotyka 2018, 4, 19–23. [Google Scholar] [CrossRef]
- US EPA. Fine Pore Aeration Systems-Design Manual; EPA/625/1-89/023; EPA: Washington, DC, USA, 1989.
- Hung, C.H.; Boyle, W.C. The effect of acid cleaning on a fine pore ceramic diffuser aeration, system. Water Sci. Technol. 2001, 44, 211–218. [Google Scholar] [CrossRef] [PubMed]
- Szetela, R.; Janiak, K.; Balbierz, P.; Knap, M. Optymalizacja pracy systemu napowietrzania bloków biologicznych pod kątem minimalizacji kosztów napowietrzania Wrocławskiej Oczyszczalni Ścieków cz. 3, Raport serii SPR nr 7/2012; Instytut Inżynierii Ochrony Środowiska, Politechnika Wrocławska: Wrocław, Poland, 2012. [Google Scholar]
- Janiak, K. Stopień wykorzystania tlenu i czynniki na niego wpływające: Część II Zarastanie dyfuzorów/ Oxygen transfer efficiency and its influencing factors Part 2: Diffuser’s fouling. Forum Eksploatatora 2012, 5, 30–36. [Google Scholar]
- Frey, W.; Thonhauser, C. Clogging and cleaning of fine-pore membrane diffusers. Water Sci. Technol. 2004, 50, 69–77. [Google Scholar] [CrossRef]
- Hansen, E.J.; Estevez, M.A.; Es-Said, O.S. On the shrinking and hardening of EPDM rubber membranes in water sanitation filtration tanks. Eng. Fail. Anal. 2004, 11, 361–367. [Google Scholar] [CrossRef]
- Wagner, M.; Hoessle, V.R. Biological coating of EPDM-membranes of fine bubble diffusers. Water Sci. Technol. 2004, 50, 79–85. [Google Scholar] [CrossRef] [PubMed]
- Libra, J.A.; Sahlmann, C.; Schuchardt, A.; Handschag, J.; Wiesmann, U.; Gnirss, R. Evaluation of ceramic and membrane diffusers under operating conditions with the dynamic of gas method. Water Environ. Res. 2005, 77, 447–454. [Google Scholar] [CrossRef]
- Szetela, R.; Janiak, K.; Balbierz, P.; Knap, M. Ekspertyza techniczna—Badania laboratoryjne stopnia wykorzystania tlenu oraz strat ciśnienia dyfuzorów wymontowanych z nowo wybudowanych reaktorów tlenowych Wrocławskiej Oczyszczalni Ścieków; Instytut Inżynierii Ochrony Środowiska, Politechnika Wrocławska: Wrocław, Poland, 2011. [Google Scholar]
- Thomas, C.D.; Barratt, P.A.; Holmes, R.B. Systemy Oxy-Dep Vsa, Nowe rewolucyjne podejście do kwestii napowietrzania w procesie oczyszczania ścieków. Inży. Ekol. 2006, 14, 17–29. [Google Scholar]
- EPA 832-F-99-065 Wastewater Technology Fact Sheet—Fine Bubble Aeration; EPA: Washington, DC, USA, 1999.
- Ovezea, A. Saving energy: Using fine bubble diffusers. Filtr. Sep. 2009, 46, 24–27. [Google Scholar] [CrossRef]
- Roman, M.D.; Muresan, M.V. Analysis of oxygen requirements and transfer efficiency in a wastewater treatment plant. Int. J. Latest Res. Sci. Technol. 2014, 3, 30–33. [Google Scholar]
- Garrido-Baserba, M.; Asvapathanagul, P.; McCarthy, G.W.; Gocke, T.E.; Olson, B.H.; Park, H.; Al-Omari, A.; Murthy, S.; Bott, C.B.; Wett, B.; et al. Linking biofilm growth to fouling and aeration performance of fine-pore diffuser in activated sludge. Water Res. 2016, 90, 317–328. [Google Scholar] [CrossRef]
- Garrido-Baserba, M.; Sobhani, R.; Asvapathanagul, P.; McCarthy, G.W.; Gocke, T.E.; Olson, B.H.; Odize, V.; Al-Omari, A.; Murthy, S.; Nifong, A.; et al. Modelling the link amongst fine-pore diffuser fouling, oxygen transfer efficiency, and aeration energy intensity. Water Res. 2017, 111, 127–139. [Google Scholar] [CrossRef]
- Sadecka, Z.; Płuciennik-Koropczuk, E.; Sieciechowicz, A. Modele biokinetyczne ASM/Biokinetic models ASM. Zeszyty Naukowe. Inżynieria Środowiska Uniwersytet Zielonogórski 2011, 141, 113–125. [Google Scholar]
- Henze, M.; Gujer, W.; Mino, T.; Loosdrecht, M. Activated Sludge Models ASM1, ASM2, ASM2D and ASM3; Edited by IWA Task Group on Mathematical Modelling for Design and Operation of Biological Wastewater Treatment; IWA Publishing: London, UK, 2000. [Google Scholar]
- Olsson, G.; Newell, B. Wastewater Treatment Systems. Modeling, Diagnosis and Control; IWA Publishing: London, UK, 1999. [Google Scholar]
- Szetela, R. Model Dynamiczny Oczyszczalni ścieków z Osadem Czynnym; Prace Naukowe Instytutu Ochrony Środowiska Politechniki Wrocławskiej, 64, Monografie 32; Wydawnictwo Politechniki Wrocławskiej: Wrocław, Poland, 1990. [Google Scholar]
- Urban, R.; Szetela, R. Calibration of the activated sludge model with genetic algorithms. Part i. Calibration results. Environ. Prot. Eng. 2007, 33, 31–49. [Google Scholar]
- Cawley, G.; Janarek, G.; Haylock, M.; Dorling, S. Predictive uncertainty in environmental modelling. Neural Netw. 2007, 20, 537–549. [Google Scholar] [CrossRef] [PubMed]
- Bsdys, M.A.; Díaz Maíquez, J. Application of Fuzzy Model Predictive Control to the Dissolved Oxygen Concentration Tracking in an Activated Sludge Process. In Proceedings of the 15th IFAC World Congress, Barcelona, Spain, 21–26 July 2002. [Google Scholar]
- Szetela, R.; Dymaczewski, Z. Modyfikacja obecnej postaci modelu osadu czynnego ASM 2d/ Modification of the present form of the ASM 2d acivated sludge model. Ochr. Środ. 2002, 1, 3–8. [Google Scholar]
- Gujer, W.; Henze, M.; Mino, T.; Matsuo, T.; Wentzel, M.C.; Marais, G.V.R. The Activated Sludge Model. Water Sci. Technol. 1995, 31, 1–11. [Google Scholar] [CrossRef]
- Henze, M.; Gujer, W.; Mino, T.; Matsuo, T.; Wentzel, M.C.; Marais, G.V.R.; Van Loosdrecht, C.M. Activated sludge model No.2D, ASM2D. Water Sci. Technol. 1999, 39, 165–182. [Google Scholar] [CrossRef]
- Winkler, S.; Müller-Rechberger, H.; Nowak, O.; Svardal, K.; Wandl, G. A New approach towards model ling of the carbon degradation cycle AT two-stage activated sludge plants. Water Sci. Technol. 2001, 43, 19–27. [Google Scholar] [CrossRef] [PubMed]
- Rieger, L.; Koch, G.; Kühni, M.; Gujer, W.; Siegrist, H. The EWAG BIO-P module for Activated Sludge Model No. 3. Water Res. 2001, 35, 3887–3903. [Google Scholar] [CrossRef]
- Jones, G.L. A mathematical model for bacterial growth and substrate utilisation in the activated-sludge process. In Mathematical Models in Water Pollution Control; James, A., Ed.; John Wiley and Sons: London, UK, 1978; pp. 265–279. [Google Scholar]
- Chambers, B.; Jones, G.L. Optimisation and Uprating of Activated Sludge Plants by Efficient Process Design. Water Sci. Technol. 1988, 20, 121–132. [Google Scholar] [CrossRef]
- Murnleitner, E.; Kuba, T.; Van Loosdrecht, M.C.M.; Heijnen, J.J. An integrated metabolic model for the aerobic and denitrifying biological phosphorus removal. Biotechnol. Bioeng. 1997, 54, 434–450. [Google Scholar] [CrossRef]
- Van Veldhuizen, H.M.; Van Loosdrecht, M.C.M.; Heijnen, J.J. Modelling biological phosphorus and nitro gen removal in a full scale activated sludge process. Water Res. 1999, 33, 3459–3468. [Google Scholar] [CrossRef]
- Szabat, K.; Urban, R. Zastosowanie logiki rozmytej do sterowania napędowymi układami napowietrzania komór tlenowych w oczyszczalni ścieków/Application of the fuzzy logic to control the electrical blowers in the sewage treatment plant. Prace Naukowe IMNiPE Politechniki Wrocławskiej 2009, 63, 341–354. [Google Scholar]
- Kalker, T.J.J.; Van Goor, C.P.; Roeleveld, P.; Ruland, M.F. Fuzzy Control of Aeration in an Activated Sludge Wastewater Treatment Plant: Design, Simulation and Evaluation. Water Sci. Technol. 1999, 4, 71–78. [Google Scholar] [CrossRef]
- Stare, A.; Vrecko, D.; Hvala, N.; Strmcnik, S. Comparison of control strategies for nitrogen removal in an activated sludge process in terms of operating costs: Simulation study. Water Res. 2007, 41, 2004–2014. [Google Scholar] [CrossRef] [PubMed]
- Borowa, A.; Brdyś, M.; Mazur, K. Modeling of wastewater treatment plant for monitoring and control purposes by state-space wavelet networks. IJCCC 2007, 2, 121–131. [Google Scholar] [CrossRef]
- Amand, L.; Carlsson, B. Aeration Control with Gain Scheduling in a Full-scale Wastewater Treatment Plant. IFAC Proc. Vol. 2014, 47, 7146–7151. [Google Scholar] [CrossRef] [Green Version]
- Regmi, P.; Miller, M.W.; Holgate, B.; Bunce, R.; Park, H.; Chandran, K.; Wett, B.; Murthy, S.; Bott, C.B. Control of aeration, aerobic SRT and COD input for mainstream nitritation/denitritation. Water Res. 2014, 57, 162–171. [Google Scholar] [CrossRef] [PubMed]
- Kaelin, D.; Manser, R.; Rieger, L.; Eugster, J.; Rottermann, K.; Siegrist, H. Extension of ASM3 for two-step nitrification and denitrification and its calibration and validation with batch tests and pilot scale data. Water Res. 2009, 43, 1680–1692. [Google Scholar] [CrossRef] [PubMed]
- Zaborowska, E.; Majtacz, J.; Drewnowski, J.; Sobotka, D.; Al-Hazmi, H.; Kowal, P.; Mąkinia, J. Improving the energy balance in wastewater treatment plants by optimization of aeration control and application of new technologies. In Water Supply and Wastewater Disposal; Sobczuk, H., Kowalska, B., Eds.; LUT: Lublin, Poland, 2018; pp. 317–328. [Google Scholar]
- Maktabifard, M.; Zaborowska, E.; Makinia, J. Achieving energy neutrality in wastewater treatment plants through energy savings and enhancing renewable energy production. Rev. Environ. Sci. Biotechnol. 2018, 17, 655–689. [Google Scholar] [CrossRef] [Green Version]
- U.S. Municipal Solid Waste Sector Action Plan. 2013. Available online: https://www.globalmethane.org/documents/landfills_cap_usa.pdf. (accessed on 5 May 2019).
- Piao, W.; Kim, Y.; Kim, H.; Kim, M.; Kim, C. Life cycle assessment and economic efficiency analysis of integrated management of wastewater treatment plants. J. Clean. Prod. 2016, 113, 325–337. [Google Scholar] [CrossRef]
- Guerrini, A.; Romano, G.; Leardini, C. Economic of scale and density in the Italian water industry: A stochastic frontier approach. Util. Policy 2018, 52, 103–111. [Google Scholar] [CrossRef]
- Daelman, M.R.J.; Van Voorthuizen, E.M.; Van Dongen, L.G.J.M.; Volcke, E.I.P.; van Loosdrecht, M.C.M. Methane and nitrous oxide emissions from municipal wastewater treatment—Results from a long-term study. Water Sci. Technol. 2013, 67, 2350–2355. [Google Scholar] [CrossRef] [PubMed]
- Remy, C.; Lesjean, B.; Waschnewski, J. Identifying energy and carbon footprint optimization potentials of a sludge treatment line with life cycle assessment. Water Sci. Technol. 2013, 67, 63–73. [Google Scholar] [CrossRef] [PubMed]
- De Haas, D.W.; Pepperell, C.; Foley, J. Perspectives on greenhouse gas emission estimates based on Australian wastewater treatment plant operating data. Water Sci. Technol. 2014, 69, 451–463. [Google Scholar] [CrossRef]
- Mamais, D.; Noutsopoulos, C.; Dimopoulou, A.; Stasinakis, A.; Lekkas, T.D. Wastewater treatment process impact on energy savings and greenhouse gas emissions. Water Sci. Technol. 2015, 71, 303–308. [Google Scholar] [CrossRef] [PubMed]
- Bao, Z.; Sun, S.; Sun, D. Assessment of greenhouse gas emission from A/O and SBR wastewater treatment plants in Beijing, China. Int. Biodeterior. Biodegrad. 2016, 108, 108–114. [Google Scholar] [CrossRef]
- Wang, H.; Yang, Y.; Keller, A.A.; Li, X.; Feng, S.; Dong, Y.; Li, F. Comparative analysis of energy intensity and carbon emissions in wastewater treatment in USA, Germany, China and South Africa. Appl. Energy 2016, 184, 873–881. [Google Scholar] [CrossRef] [Green Version]
- Evangelisti, S.; Lettieri, P.; Borello, D.; Clift, R. Life cycle assessment of energy from waste via anaerobic digestion: A UK case study. Waste Manag. 2014, 34, 226–237. [Google Scholar] [CrossRef]
- Arashiro, L.T.; Montero, N.; Ferrer, I.; Acién, F.G.; Gómez, C.; Garfí, M. Life cycle assessment of high rate algal ponds for wastewater treatment and resource recovery. Sci. Total Environ. 2018, 622–623, 1118–1130. [Google Scholar] [CrossRef]
- Polruang, S.; Sirivithayapakorn, S.; Prateep Na Talang, R. A comparative life cycle assessment of municipal wastewater treatment plants in Thailand under variable power schemes and effluent management programs. J. Clean. Prod. 2018, 172, 635–648. [Google Scholar] [CrossRef]
- Herna’ndez-Sancho, F.; Molinos-Senante, M.; Sala-Garrido, R. Energy efficiency in Spanish wastewater treatment plants: A non-radial DEA approach. Sci. Total Environ. 2011, 409, 2693–2699. [Google Scholar] [CrossRef] [PubMed]
- Sala-Garrido, R.; Herna´ndez-Sancho, F.; Molinos-Senante, M. Assessing the efficiency of wastewater treatment plants in an uncertain context: A DEA with tolerances approach. Environ. Sci. Policy 2012, 18, 34–44. [Google Scholar] [CrossRef]
- Molinos-Senante, M.; Hernández-Sancho, F.; Mocholí-Arce, M.; Sala-Garrido, R. Economic and environmental performance of wastewater treatment plants: Potential reductions in greenhouse gases emissions. Resour. Energy Econ. 2014, 38, 125–140. [Google Scholar] [CrossRef]
- Lorenzo-Toja, Y.; Alfonsin, C.; Amores, M.J.; Aldea, X.; Marin, D.; Moreira, M.T.; Feijoo, G. Beyond the conventional life cycle inventory in wastewater treatment plants. Sci. Total Environ. 2016, 553, 71–82. [Google Scholar] [CrossRef] [PubMed]
- Hydromantis ESS, Inc. GPS-X Technical Reference; Hydromantis ESS, Inc.: Hamilton, ON, Canada, 2017. [Google Scholar]
- Nelder, J.A.; Mead, R. A simplex method for function minimization. Comput. J. 1965, 7, 308–313. [Google Scholar] [CrossRef]


| Aeration Device | Oxygen Transfer Rate, kgO2/kWh | Application | Advantages | Disadvantages |
|---|---|---|---|---|
| Fine bubble diffusers | 2.0–2.5 | It is a standard solution used in wastewater treatment plants | Small bubbles dissolve better in the wastewater, which gives a better aeration efficiency and allows for savings by reducing energy consumption. It does not cause a mechanical disruption of the flocks.Air bubbles propagate evenly. Result is lower volatile organic compound emissions than nonporous diffusers or mechanical aeration devices. | Fine pore diffusers are susceptible to biological or chemical fouling, which may weaken transfer efficiency and generate high head loss, as a result, they require repetitive cleaning. Diffusers are subject to fouling and scaling, resulting in loss in transfer efficiency as biofilms form and change material properties producing larger bubbles, hindering mass transfer and contributing to increased costs of energy. |
| Coarse bubble diffusers | 0.8–1.2 | Used in special cases, i.e., oxygen stabilization of sludge, in sand-pitches or in the need of aeration of a pumping station. | It works well in chambers with a high concentration of solids. Larger air outlets in the coarse diffuser helps to increase the rate of oxygen transfer. | It requires more air consumption, and thus energy, than fine bubble aeration. |
| Vertical shaft aerators | up to 2.0 | Used in vertical shaft bioreactors | Low operating and maintenance costs. High oxygen transfer efficiency. A fixed or floating set of devices (Fully accessible without the need of draining the tanks). | It can cause a mechanical disruption of the flocks. To obtain optimum peripheral velocity, highest rotation speed and smallest impeller diameter ratio should be applied. |
| Horizontal shaft aerators | up to 2.0 | They are especially preferred in ditch type aeration basins, due to their effective mixing and high oxygen transfer efficiency in shallow, wide channels. As the rotor turns, a vertical movement of water is created and water is aerated. | It works well in chambers with a high concentration of solids. Fully accessible without the need of draining the tanks. Simple construction, easy, to build, maintain and repair | Limited Mixing Performance—A surface aerator can really only mix the water in its immediate vicinity. The combination of splashing water, and being exposed to freezing rain and snow, makes these motors prone to failure in cold weather |
© 2019 by the authors. Licensee MDPI, Basel, Switzerland. This article is an open access article distributed under the terms and conditions of the Creative Commons Attribution (CC BY) license (http://creativecommons.org/licenses/by/4.0/).
Share and Cite
Drewnowski, J.; Remiszewska-Skwarek, A.; Duda, S.; Łagód, G. Aeration Process in Bioreactors as the Main Energy Consumer in a Wastewater Treatment Plant. Review of Solutions and Methods of Process Optimization. Processes 2019, 7, 311. https://doi.org/10.3390/pr7050311
Drewnowski J, Remiszewska-Skwarek A, Duda S, Łagód G. Aeration Process in Bioreactors as the Main Energy Consumer in a Wastewater Treatment Plant. Review of Solutions and Methods of Process Optimization. Processes. 2019; 7(5):311. https://doi.org/10.3390/pr7050311
Chicago/Turabian StyleDrewnowski, Jakub, Anna Remiszewska-Skwarek, Sylwia Duda, and Grzegorz Łagód. 2019. "Aeration Process in Bioreactors as the Main Energy Consumer in a Wastewater Treatment Plant. Review of Solutions and Methods of Process Optimization" Processes 7, no. 5: 311. https://doi.org/10.3390/pr7050311