1. Introduction
The preferred method for purification, form, and particle size distribution (PSD) control of an active pharmaceutical ingredient (API) is crystallization [
1]. While the necessity for purity and form control is clear, the importance of PSD control should not be overlooked. PSD can impact a variety of operations and properties, ranging from downstream processing operations, such as blending and granulation, to the bioavailability of an oral solid dosage [
2,
3,
4]. For example, the content uniformity of the dosage unit can be significantly impacted by PSD of the API, which is especially of concern for low-dosage drugs [
5]. For pulmonary delivery applications, PSD impacts particle penetration into airways and also impacts clinical response [
6]. For APIs that are sparingly soluble in vivo, PSD has a considerable impact on bioavailability [
7,
8]. The choice of granulation technique may be dictated by the PSD of the API for high drug load substances, as materials with a large population of fines may not be amenable to dry granulation [
8]. The PSD of the API strongly impacts the dissolution rate of the API in the polymer melt during pharmaceutical hot melt extrusion (HME) processes, which is considered the most critical step in HME [
9]. Thus, manufacturing an API with consistent PSD is of great importance.
The PSD during the crystallization process results from the interaction of simultaneous phenomena, such as nucleation, growth, agglomeration, and attrition [
10], and can be impacted by both processing parameters as well as equipment parameters. Process parameters include temperature profile, seed point, seed amount, seed PSD, antisolvent addition rates, age times, and agitation rates. Equipment parameters include crystallizer size, impeller style and size, and baffling configuration [
11]. As such, there are many factors that require investigation when designing a crystallization to reproducibly deliver a target PSD.
Traditionally, the influence of various parameters on product PSD has been investigated empirically by conducting multiple crystallization experiments at different scales across the parameter ranges of interest. While a rough understanding of the relationship between PSD and key process parameters can be obtained in this manner, the interdependency of many process parameters renders it difficult to make robust quantitative assessments. Additionally, this approach suffers the limitation of being both labor and resource intensive due to the high dimensionality of the process parameters. Due to the scale-dependency of this approach, the common practice is to first establish a suitable set of process parameter ranges that can robustly deliver an API with desired PSD at the lab scale. These ranges are then utilized as guidelines for initial pilot scale execution. The PSD resulting from the plant scale runs can differ from that generated at the lab scale, even when the runs are conducted using otherwise similar processes with linear scaling of most parameters. This can be due to different mixing time scales, equipment configurations, and hydrodynamics, all of which can impact the kinetics of many crystallization mechanisms. The impacts of process volume do not scale in a similar manner as other process parameters, and as such it is difficult to match process parameters with the power per unit volume achieved across the different scales [
2,
12]. Therefore, the current empirical paradigm faces some limitations in the ability to design a scalable process for delivering an API of consistent PSD.
Utilizing modeling to understand the fundamental crystallization kinetics can help to overcome the limitations of the design of experiments (DOE) approach. Prediction of PSD requires keeping track of the number and size of particles throughout the crystallization process, and, therefore, is a good application for population balance equations (PBEs) [
13], which were developed by Hulbert and Katz [
14] in 1964. Although population balance modeling (PBM) was initially applied to crystallization processes back in 1971 by Randolph and Larson [
15], broader utilization of PBM as a crystallization process tool did not start to occur until the last decade [
13,
16]. This is due to improvements in process analytical tools (PAT) and numerical software packages that can solve complex differential algebraic systems [
13,
16,
17]. As such, there are now many publications on the application of PBM for API crystallization from academic groups. For example, Hu et al. [
18] utilized PBE to optimize a cooling profile for a cooling crystallization, and Nowee et al. [
11] utilized PBE to optimize an antisolvent addition protocol based on predicted PSD. However, there seems to be a lag in mainstreaming PBM into the pharmaceutical industry workflow, with relatively few literature examples of industry utilizing PBM to guide crystallization process development [
19,
20].
Herein, application of PBM to an active pipeline compound (Bristol-Myers Squibb, BMS, compound A) via gPROMS FormulatedProducts (gFP; Process Systems Enterprise, Ltd, London, UK) is utilized to highlight advantages that PBM affords. BMS compound A is crystallized via a cooling antisolvent crystallization process, and generates equant, non-agglomerated particles. Although there was not a specific target PSD for this compound, delivery of consistent PSD across various scales and reactor configurations was desired. Consistent PSD would avoid the potential for unexpected differences in batch-to-batch powder properties that could arise from deviations in PSD. PBM is employed to help understand the crystallization mechanisms, and to probe processing parameters that are impactful on final PSD. This understanding is then utilized to guide lab-scale experiments, to ensure that the processing parameters that influence final PSD are explored appropriately. The general workflow that was utilized to generate the PBM is described here, along with model outputs, with the hopes of seeing PBM more readily adopted into the pharmaceutical workflow.
2. Generalized PBE
A generalized form of the PBE for calculating the number distribution of crystals as a function of size is [
21]:
where
n is the particle number density,
L is the length of the particle,
V is the volume,
t is time,
G is the growth rate,
B is birth rate,
D is the death rate, and
φin and
φout are the inlet and outlet streams, respectively. The φ terms, while important for continuous crystallizations, are zero for a batch crystallization, as there are no inlet and outlet streams. Birth at larger sizes happens due to agglomeration, while nucleation is only responsible for birth at very small sizes [
21]. Therefore, at the smallest size, the birth rate is described by the nucleation rate. In the case of BMS compound A, no agglomeration occurs, so the birth rate at larger sizes is zero. The death term describes disappearance of certain size crystals, which can occur at smaller sizes due to agglomeration (small size crystals “disappear” as they agglomerate into a larger size), or at larger sizes due to breakage, which is rare unless the shape of the crystal lends itself to breaking (i.e., long thin needles) [
21]. In the case of BMS compound A, agglomeration and breakage did not occur; thus, the death rate is zero. The PBE is a first-order partial differential equation with respect to crystal length and time. The PSD is discretized into particle size “bins” (50 for the BMS compound A case study), and, using the seed PSD as the initial condition, and the nucleation rates as the boundary condition, the equation is solved for each size bin utilizing a one-dimensional finite volume method via gPROMS FormulatedProducts (gFP, Version 1.2.2, Process Systems Enterprise, Ltd, London, UK), or other software platforms.
3. Crystallization Mechanisms
To solve the generalized PBE (Equation (1)), equations describing the relevant crystallization mechanisms (growth, nucleation, and agglomeration if relevant) are required. This necessitates some qualitative knowledge about the crystallization, such as whether or not agglomeration, Ostwald ripening, etc., is occurring. Typically, in seeded batch crystallizations, the common mechanisms governing the crystallization process are growth, secondary nucleation, and agglomeration [
22]; primary nucleation has negligible contributions to the process, and can be neglected [
22,
23]. In the case of BMS compound A, agglomeration did not occur; as such, it was not included in the model. Classical two-step growth [
24] and Evans’ secondary nucleation kinetics [
25], which attributes generations of nuclei to particle–impeller collisions, were selected for developing the PBM for the BMS compound A crystallization process.
The mass transfer step of the classical two-step growth model is described by [
24]:
where
G is the linear growth rate of the crystal,
kd is a mass transfer coefficient (a component of which is estimated by gFP),
Cbulk and
Cint are the concentration of the solute in the bulk liquid phase and the concentration at the crystal surface, respectively, and
is the molar density of the crystal phase.
The surface integration step is described by [
24]:
where
is a proportional factor for surface integration estimated by gFP,
is the activation energy for surface integration estimated by gFP, R is the gas constant, T is temperature in Kelvin,
and
are the concentration of the solute at the crystal surface and the saturation concentration, respectively, and
s is the supersaturation dependency of the surface integration rate, estimated by gFP.
Evans’ kinetics for secondary nucleation (resulting from crystal–impeller collisions) is described by [
25]:
where ln
kn is the natural logarithm of the secondary nucleation rate constant, which is estimated by gFP,
σs is the relative supersaturation,
nci is the supersaturation dependency, which is estimated by gFP,
NQ and
NP are the pumping and power numbers, respectively,
kv is the volumetric shape factor of the crystal,
is the crystal density, ε is the energy dissipation rate,
Lmin is the size above which crystals are prone to attrition, which is estimated by gFP,
n is the number density, and
L is the crystal size.
The energy dissipation rate ε (which appears in Equation (4)) is expressed as:
where
Np is the impeller power number,
ρl is the fluid density,
N is the impeller frequency,
D is the impeller diameter, and
M is the total mass. The impeller power number and impeller pumping number are related to the vessel and impeller configuration; thus, one can see how the vessel specifications influence the crystallization kinetics.
In order for the software to estimate the various parameters above, experimental data and details regarding the equipment are required; these are detailed in the following section.
4. Required Input for PBM
Generation of an accurate PBM requires accurate input. The necessary input can be classified into two broad categories: parameters related to vessel configuration, and experimental data. Vessel configuration includes impeller size, power number, and pumping number. The power number and pumping number can be calculated in the solid-liquid mixing utility of DynoChem (Scale-up Systems, Dublin, Ireland) or other mixing software. The general experimental data requirements are: API solubility, PSD of seed material, in-process concentration of API in mother liquor, and PSD of final material. As these data are typically generated during the course of traditional DOE-based crystallization process development, the modeling does not impose an additional experimental burden.
The solubility of the API across a range of solvent/antisolvent ratios and temperatures (required for cooling crystallizations, otherwise isothermal data are sufficient) is necessary. We have used both HPLC and Crystal16 (Technobis, Netherlands) to generate API solubility data for our models, and have found that an accurate solubility model across temperature and composition can be generated with approximately 15 data points.
Figure 1 shows measured API solubility (dotted shapes) compared to predicted solubility (solid shapes) across a range of antisolvent (IPA) compositions for different temperatures (as indicated with a marker shape). The predicted solubility, based on a hybrid polynomial/exponential model, is close to or overlapping with the measured values.
The standard method utilized for HPLC measurements is to stir the API at a known controlled temperature in a prepared solvent/antisolvent ratio, such that there are excess solids. After 24 h, the supernatant is then filtered, diluted, and run on HPLC. If the possibility of form conversion exists, confirmation of the crystalline form of the solid phase via X-ray diffraction is recommended. The standard method for solubility measurements via Crystal16 is to add a known weight of API to known weights of solvent/antisolvent combinations, crash cool the solution to achieve equilibrium, then slowly ramp up the temperature until the solution becomes clear again. When the instrument detects 100% transmission, the sample is fully dissolved. Thus, the solubility can be determined by the temperature at the point where 100% transmission occurs.
The PSD of both the seed material and final material is required. This can be inputted as quantiles calculated from the PSD, or as the entire PSD. For BMS compound A, the PSD is always unimodal, and as such, we can utilize calculated quantiles (D10, D50, D90) obtained from laser light scattering PSD (Malvern Mastersizer 3000, Malvern Panalytical, Malvern, UK), using both wet and dry methods. Use of chord length distributions from in-line probes should be used with caution, as there is not currently a substantial enough correlation between these measurements and the previously mentioned techniques. Optical microscopy is recommended as a qualitative check of crystal morphology and potential agglomeration, as certain morphologies, such as long thin needles or agglomerates, may require additional model parameters. We have found that a reasonably accurate model can be generated with a minimum of four data sets of seed size quantiles, API solution concentration during crystallization, and final product quantiles.
5. Application of PBM for Cooling Antisolvent Crystallization
PBM was utilized to model a cooling antisolvent crystallization of BMS (Britsol-Myers Squibb, New Brunswick, NJ, USA) compound A. In a typical crystallization process, 10 g of BMS Compound A was dissolved in 60 mL of N-Methyl-2-pyrrolidone (Sigma-Aldrich, St. Louis, MO, USA) at 70 °C, using an impeller speed of 260 revolutions per minute (RPM), in a 250 mL Chemglass reactor (Chemglass Life Sciences LLC, Vineland, NJ, USA) equipped with a half-moon impeller. Thirty milliliters (30 mL) of isopropanol (IPA, Sigma-Aldrich, St. Louis, MO, USA) was added, followed by 1 wt% (of input API) seeds. The seed bed was aged for 1 h, then 60 mL of IPA was added over 1 h. After the IPA addition, the reactor was cooled to 0 °C over 3.5 h. The final slurry was isolated on a Buchner funnel, washed three times with 30 mL IPA, and dried approximately 16 h in a vacuum oven at 50 °C.
The required inputs detailed in
Section 3 were collected and entered into gFP for four different lab scale crystallization experiments, run with slightly different ratios of solvent to antisolvent. Based on the experimental desupersaturation data and size quantiles, values for parameters indicated in the kinetic equations listed above (
Section 3) were estimated. The PBM was then utilized to elucidate the crystallization mechanisms, and predict the PSD of crystallizations run under different processing conditions, in order to highlight which processing parameters had the greatest impact on product PSD. Follow-up lab-scale experiments were run to verify model predictions and to provide parameter ranges for scale-up batches.
Simulated growth and nucleation rates throughout the crystallization process, predicted from the PBM, are shown in
Figure 2. They indicate that growth occurs in an early stage of the process, and that secondary nucleation due to attrition occurs throughout the process. As such, one would expect processing parameters that impact secondary nucleation to play an important role in impacting the final PSD, possibly having a greater influence than factors impacting growth. To probe the impact of various processing parameters on the final PSD, virtual DOEs were conducted via the PBM.
Figure 3 shows the model predictions of final D90 (circles) versus the seed D50. Three points were verified experimentally (squares) with good agreement with model predictions. Error bars in the measured quantile values are based on a linear variance model
where
is the standard deviation,
is the relative term, with a value of 0.1 for this case,
is the constant term, with a value of 1 µm for this case, and
is the value as measured. This is used to account for the precision and accuracy of the experimental measurements. As seen from the plot, at seed D50 > ~40 μm, the impact on final D90 is small (a <~20 μm difference). These data were utilized to provide guidance for recommended seed size range for the crystallization process.
The predicted impact of seed load on final D90 was less significant (
Figure 4), resulting in a D90 variation of ~25 μm. Given that tight PSD control was not required for BMS compound A, this process parameter was not probed further experimentally.
The predicted impact of agitation rate (in a 250 mL Chemglass lab reactor) on final D90 (
Figure 5) is quite large, with D90 values ranging from ~220 μm at the low end of agitation (100 RPM) down to ~110 μm at the upper end of agitation (500 RPM).
As the predicted impact of this processing parameter was very significant, further lab-scale studies were conducted to evaluate the impact of mixing conditions on the final D90. These were carried out in 1 L reactors equipped with a pitched blade turbine (PBT) of different sizes, run at different operating speeds. The blade configuration, agitation conditions, pumping number to power number ratio, and measured D90 are summarized in
Table 1.
The lowest D90 value resulted from the 75 mm pitched blade turbine operated at 550 RPM, and the highest D90 resulted from 50 mm pitched blade turbine operated at 300 RPM. This correlates with the ratio of pumping to power number, which appears directly in Evans’ secondary nucleation equation (Equation (4)). This substantiates that the impact of the mixing environment on final D90 is a result of secondary nucleation, which was predicted to occur throughout the crystallization (
Figure 2).
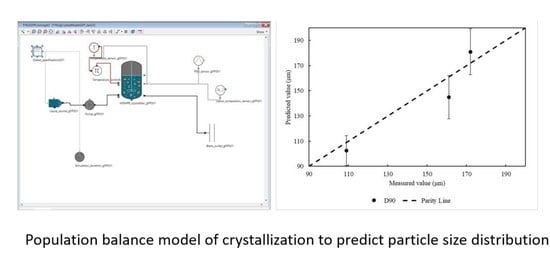
The predicted D90 values for these experiments, as compared to the measured D90 values, are shown in
Figure 6. The predicted values have a reasonable agreement with the measured values, as the points lie within a standard deviation away from the parity line.
6. Development Opportunities
Despite the advantages of PBM, there are certain processes for which PBM may be less successful. There may be cases where application of the kinetic parameter values obtained based on lab-scale data may underestimate the PSD when used to predict scale-up batches. For example, secondary nucleation due to attrition resulting from particle–impeller collisions can have scale dependency [
22]. Therefore, when using PBM for predicting PSD of initial scale-up batches, caution should be exercised. Additionally, most software for PBM employs the assumption of perfect mixing. As this is not always a valid assumption, care must be taken when utilizing PSD predictions from PBM software.
Another challenge is that most PATs and PBM models developed to date use a one-dimensional (1D) population balance approach, but crystals frequently form morphologies that significantly deviate from cubes or spheres, e.g., needles with high aspect ratios that may fuse, agglomerate, which limits the applicability of 1D PBM [
13]. Our experience with modeling high aspect ratio thin needles has been that it is difficult to generate highly accurate PSD predictions. Thus, there are still development opportunities to be realized with application of PBM for API crystallization processes.
7. Conclusions
API particle size distribution is important for both downstream processing operations and in vivo performance. Crystallization process parameters and reactor configuration are important in controlling API PSD. Given the large amount of parameters and the scale-dependence of many parameters, it can be difficult to design a scalable crystallization process that delivers a target PSD. Population balance modeling is a useful tool for understanding crystallization kinetics, predicting PSD, and studying the impact of process parameters on PSD. A PBM, developed for BMS compound A, is utilized to better understand the crystallization kinetics, and probe the impact of various processing parameters on final PSD, in order to help guide lab experiments in an efficient manner. PBM predictions indicated that seed D50 impacted final PSD, and as such, this was further explored experimentally, with good agreement of the predictions to measured data. The PBM predictions, substantiated with the measured data, were useful for guiding the selection of a desired seed size range for future scale-up batches. Seed load was predicted to have only a negligible impact on final D90, and as such was not further explored experimentally. PBM predictions indicated a strong effect of agitation rate on final D90. This was investigated experimentally by conducting crystallization under different mixing conditions. A relationship between the pumping number to power number ratio and the final D90 was observed, indicating that the impact of RPM on final D90 is likely due to secondary nucleation, as depicted by the PBM. This understanding is important when selecting agitation rates for future scale-up batches. Although PBM does have certain limitations, such as potential scale-dependency of secondary nucleation, and is currently limited in commercial software packages to one particle dimension, which has difficulty in predicting PSD for high-aspect-ratio morphologies, there is still much to be gained from applying PBM for API crystallization processes.


