1. Introduction
Aquaculture production involves the use of different types of water resources, namely freshwater, brackish water, and seawater resources. Globally, both inland and marine aquaculture production are increasing rapidly to fulfill the growing demand for fishery products [
1]. The rapid growth of aquaculture means greater demand for water resources, and the shortage of water has become a limiting factor for production at existing aquaculture farms and the expansion of aquaculture facilities [
2]. Therefore, it is crucial to apply different culture methods and techniques for the efficient use of water resources in aquaculture [
3].
Aquaculture production can use monoculture (culturing single species) or polyculture (co-culture of multiple species). Aquaculture systems are classified as extensive, semi-intensive, and intensive farming based on culture [
3]. While environmentally compatible traditional aquaculture had fewer negative effects on the environments in the past [
4], the current practices of intensive aquaculture require relatively high quantities of inputs such as feed, fertilizer, and chemicals, emitting considerable amounts of waste, causing environmental issues [
2,
5,
6,
7].
Aquaculture effluent contains high concentrations of nitrogen (N) and phosphorous (P) as dissolved nutrients [
8,
9]. These nutrients originate from pond fertilization, feed, and metabolic processes. Accumulation of large amounts of plant nutrients such as phosphorous and nitrogen results in harmful algal blooms and deterioration of water quality [
10]. This condition contributes to an imbalance in primary and secondary productivity and creating negative impacts on the structure and function of aquatic ecosystems [
11]. Environmental impacts of eutrophication include hypoxia (low oxygen level), which may result in a reduction in the population of fish and other aquatic animals [
12]. Eutrophication has, therefore, become a major environmental concern in many countries. Hence, the implementation of effective effluent treatment and investigation of methods for increasing water-use efficiency are essential for the sustainability and development of the aquaculture sector [
13]. The reduction in nutrient concentrations through appropriate effluent treatment methods before discharge to the environment is the most practical and economical approach for effluent treatment [
7,
9].Removal of inorganic nutrients from aquaculture effluent is vital to meet the environmental regulations [
14,
15].
To mitigate the negative impacts of aquaculture effluent, integration of pisciculture with macroalgal culture has been explored in different countries as a way to remove the high concentration of inorganic nutrients from effluent. Land-based recirculating aquaculture systems (RASs) are considered as a sustainable approach in aquaculture [
3,
16,
17]. It is vital to popularize RASs considering the economic benefits and environmental sustainability of the industry [
7]. The significance of this culture method is the ability to operate independently from natural environments allowing the production of most aquaculture species regardless of their natural distribution and habitat conditions [
18].
Integration of fed fish with extractive species at different trophic levels is being practiced as an effective polyculture system to mitigate the impact of aquaculture effluent referred to as Integrated Multi-Trophic Aquaculture (IMTA) [
3,
19,
20]. Extractive species include filter feeders (e.g., mussels), deposit feeders (e.g., sea urchins), and macroalgae (e.g., kelps). The filter feeders and deposit feeders use the organic particulate nutrients (uneaten feed and feces) for nourishment, while the macroalgal extract the inorganic dissolved nutrients (e.g., nitrogen and phosphorus) that are produced by the other farmed species. Essentially, extractive species act as biofilters. The ability of biofilters to recycle the nutrients (or wastes) that are present in and around aquaculture farms helps growers improve the environmental performance of their aquaculture sites. Besides, the extractive species chosen for an IMTA site are selected for their value as marketable products, providing extra economic benefits to farmers [
20]. However, integrating several species is a complicated process which must consider many factors for each component of the system. Furthermore, it has been suggested that site-specific practices be implemented in IMTA systems, highlighting challenges in their application [
21].
Use of macroalgae for effluent treatment is regarded as a prominent approach, and previous studies have demonstrated that some
Caulerpa species have the potential for bioremediation of intensive tank-based aquaculture due to the luxury uptake and fast growth rates [
22]. Integrated cultivation of macroalgae with aquatic animals has been suggested as a potential bioremediation method which can increase economic benefits through species diversification [
10,
20]. In particular, [
23] reported that Chlorophyte was more effective than Rhodophyte in treating fish culture effluent using tank-cultured macroalgae.
Caulerpa lentillifera J. Agardh is a potential bioremediatory species for removal of dissolved, inorganic nutrients such as nitrogen and phosphorus [
2,
22].
The main purpose of this study was to assess the effectiveness of phytoremediation of C. lentillifera and to design an integrated recirculation system using fish and macroalgae. To achieve this objective, experiments were conducted using an integrated circulation system of C. lentillifera and a fish species as an instrument to reduce effluent discharge and increase water use efficiency.
The study adopted an on-station experiment to understand the bioremediation process and the water quality management, production of macroalgae and fish under outdoor conditions prior to implementing in an on-farm environment. The findings from this study are expected to inform dissemination of the emerging method for mitigation of water pollution caused by aquaculture effluent [
9,
16].
Poecilia latipinna (Lesueur), commonly called Sailfin molly, is a popular ornamental fish species [
24]. Sailfin molly is a livebearer, and this species can survive in wide ranges of environmental conditions including varying salinity levels (0–80 ppt) [
25]. Sailfin molly can be naturally observed in habitats such as lakes, ponds, streams, salt marshes, estuaries, and coastal waters with different salinity levels [
25,
26].
C. lentillifera is an economically important, fast-growing green macroalgal species found naturally in many countries, and its commercial cultivation is widely practiced [
27,
28,
29,
30]. Moreover, the species is cultivated by many shrimp farmers in their culture ponds for wastewater treatment purposes [
27]. However, farmers face difficulties with the utilization of this species in optimizing the bioremediation process because of insufficient knowledge regarding biophysical conditions that need to be maintained for efficient effluent treatment processes and the difficulty in fulfilling the requirements for effluent control standards [
31]. This species is resistant to a wide range of salinity [
32] and adaptable to a variety of environments [
30]. It is reported to have high nutrient uptake capacity as a bioremediator for marine fish aquaculture effluent treatment [
2]. Previous studies of nutrient uptake by
C. lentillifera have focused on comparing the advantages of its use with some other red and brown algae as biofilters [
2,
29]. To fill this knowledge gap,
C. lentillifera was selected as the target macroalgal species for this study, which was conducted under outdoor conditions.
2. Materials and Methods
2.1. Fish Collection and Acclimatization for Experiment
Sailfin mollies (
P. latipinna) 3–5 cm size in freshwater (of 0–0.5 ppt salinity) were procured from an ornamental fish dealer in Bangkok, and the study was performed at the Algal Bioresources Research Center, Kasetsart University, Thailand from May to July 2018. Three aerated plastic tanks filled with 150 L volume of water were arranged as fish rearing tanks and 40
P. latipinna individuals were stocked per tank [
25]. Fish acclimatization was conducted by adding filtered, concentrated seawater purchased from a salt farm located in Samutsakorn province, Thailand for 18 days by raising water salinity gradually from 0 to 30 ppt (+5 ppt every three days). Three outdoor plastic tanks (1 m × 0.6 m × 0.5 m size) were filled with 0 ppt, filtered (using a polyester fiber filter), 150 L water. Each tank was aerated with filtered air using a diaphragm blower and provided 50% of aeration rate using air controllers and air stones. Fish were fed twice a day with Sakura floating type fish feed at 4% of their body weight, and uneaten feed was removed from the fish tanks after approximately 5–7 min using a fine fish hand net. Ten fish from each of the three fish culture units were weighed to calculate the feeding rate. The fish weight was measured every ten days and fish feed amounts were adjusted according to the body weight of the fish. Bottom siphoning of the tanks was done once a day and tanks were refilled with filtered seawater to maintain the total volume of water in each tank at 150 L. The selected salinity level for the integrated system was 30 ppt based on the maximum nutrient uptake, preferred salinity level of
C. lentillifera, and salinity tolerance of
P. latipinna [
30,
33,
34].
2.2. Macroalgal Collection and Preparation for the Experiment
The macroalga C. lentillifera used for the experiment was collected from a commercial farm located in Petchaburi province, Thailand in June 2018 and were transported to Algal Bioresources Research Center, Kasetsart University, Thailand. The macroalgae were rinsed with filtered seawater and checked for quality, and visible epiphytes were removed. Macroalgae were selected and precultured in an aerated tank filled with filtered 30 ppt seawater.
2.3. Fish–Seaweed Integrated System
The fish and macroalgae integrated recirculating system was designed based on the results of laboratory experiments conducted by Bambaranda et al. [
34] who studied the optimum levels of seaweed density, salinity, and aeration for maximizing uptake of NO
2−-N, NO
3−-N, NH
3-N, and PO
43− by
C. lentillifera from aquaculture effluent obtained from
P. latipinna (sailfin molly) rearing tanks. They identified the critical levels of macroalgal density and salinity levels to maximize the uptake of each inorganic nutrient, which were approximately 30 g/L macroalgal density and 30 ppt salinity level. The water salinity was maintained using concentrated seawater purchased from a salt farm located in Samutsakorn province. These conditions were applied to the outdoor experiment in the current study to run the integrated circulation system. In addition, water motion or bubbling is crucial for the nutrient uptake and macroalgal growth [
35], and aeration showed a positive effect on nutrient uptake by
C. lentillifera in laboratory experiments [
34]. Therefore, macroalgal culture units were aerated using fish culture units, and seaweed units were aerated using air stones.
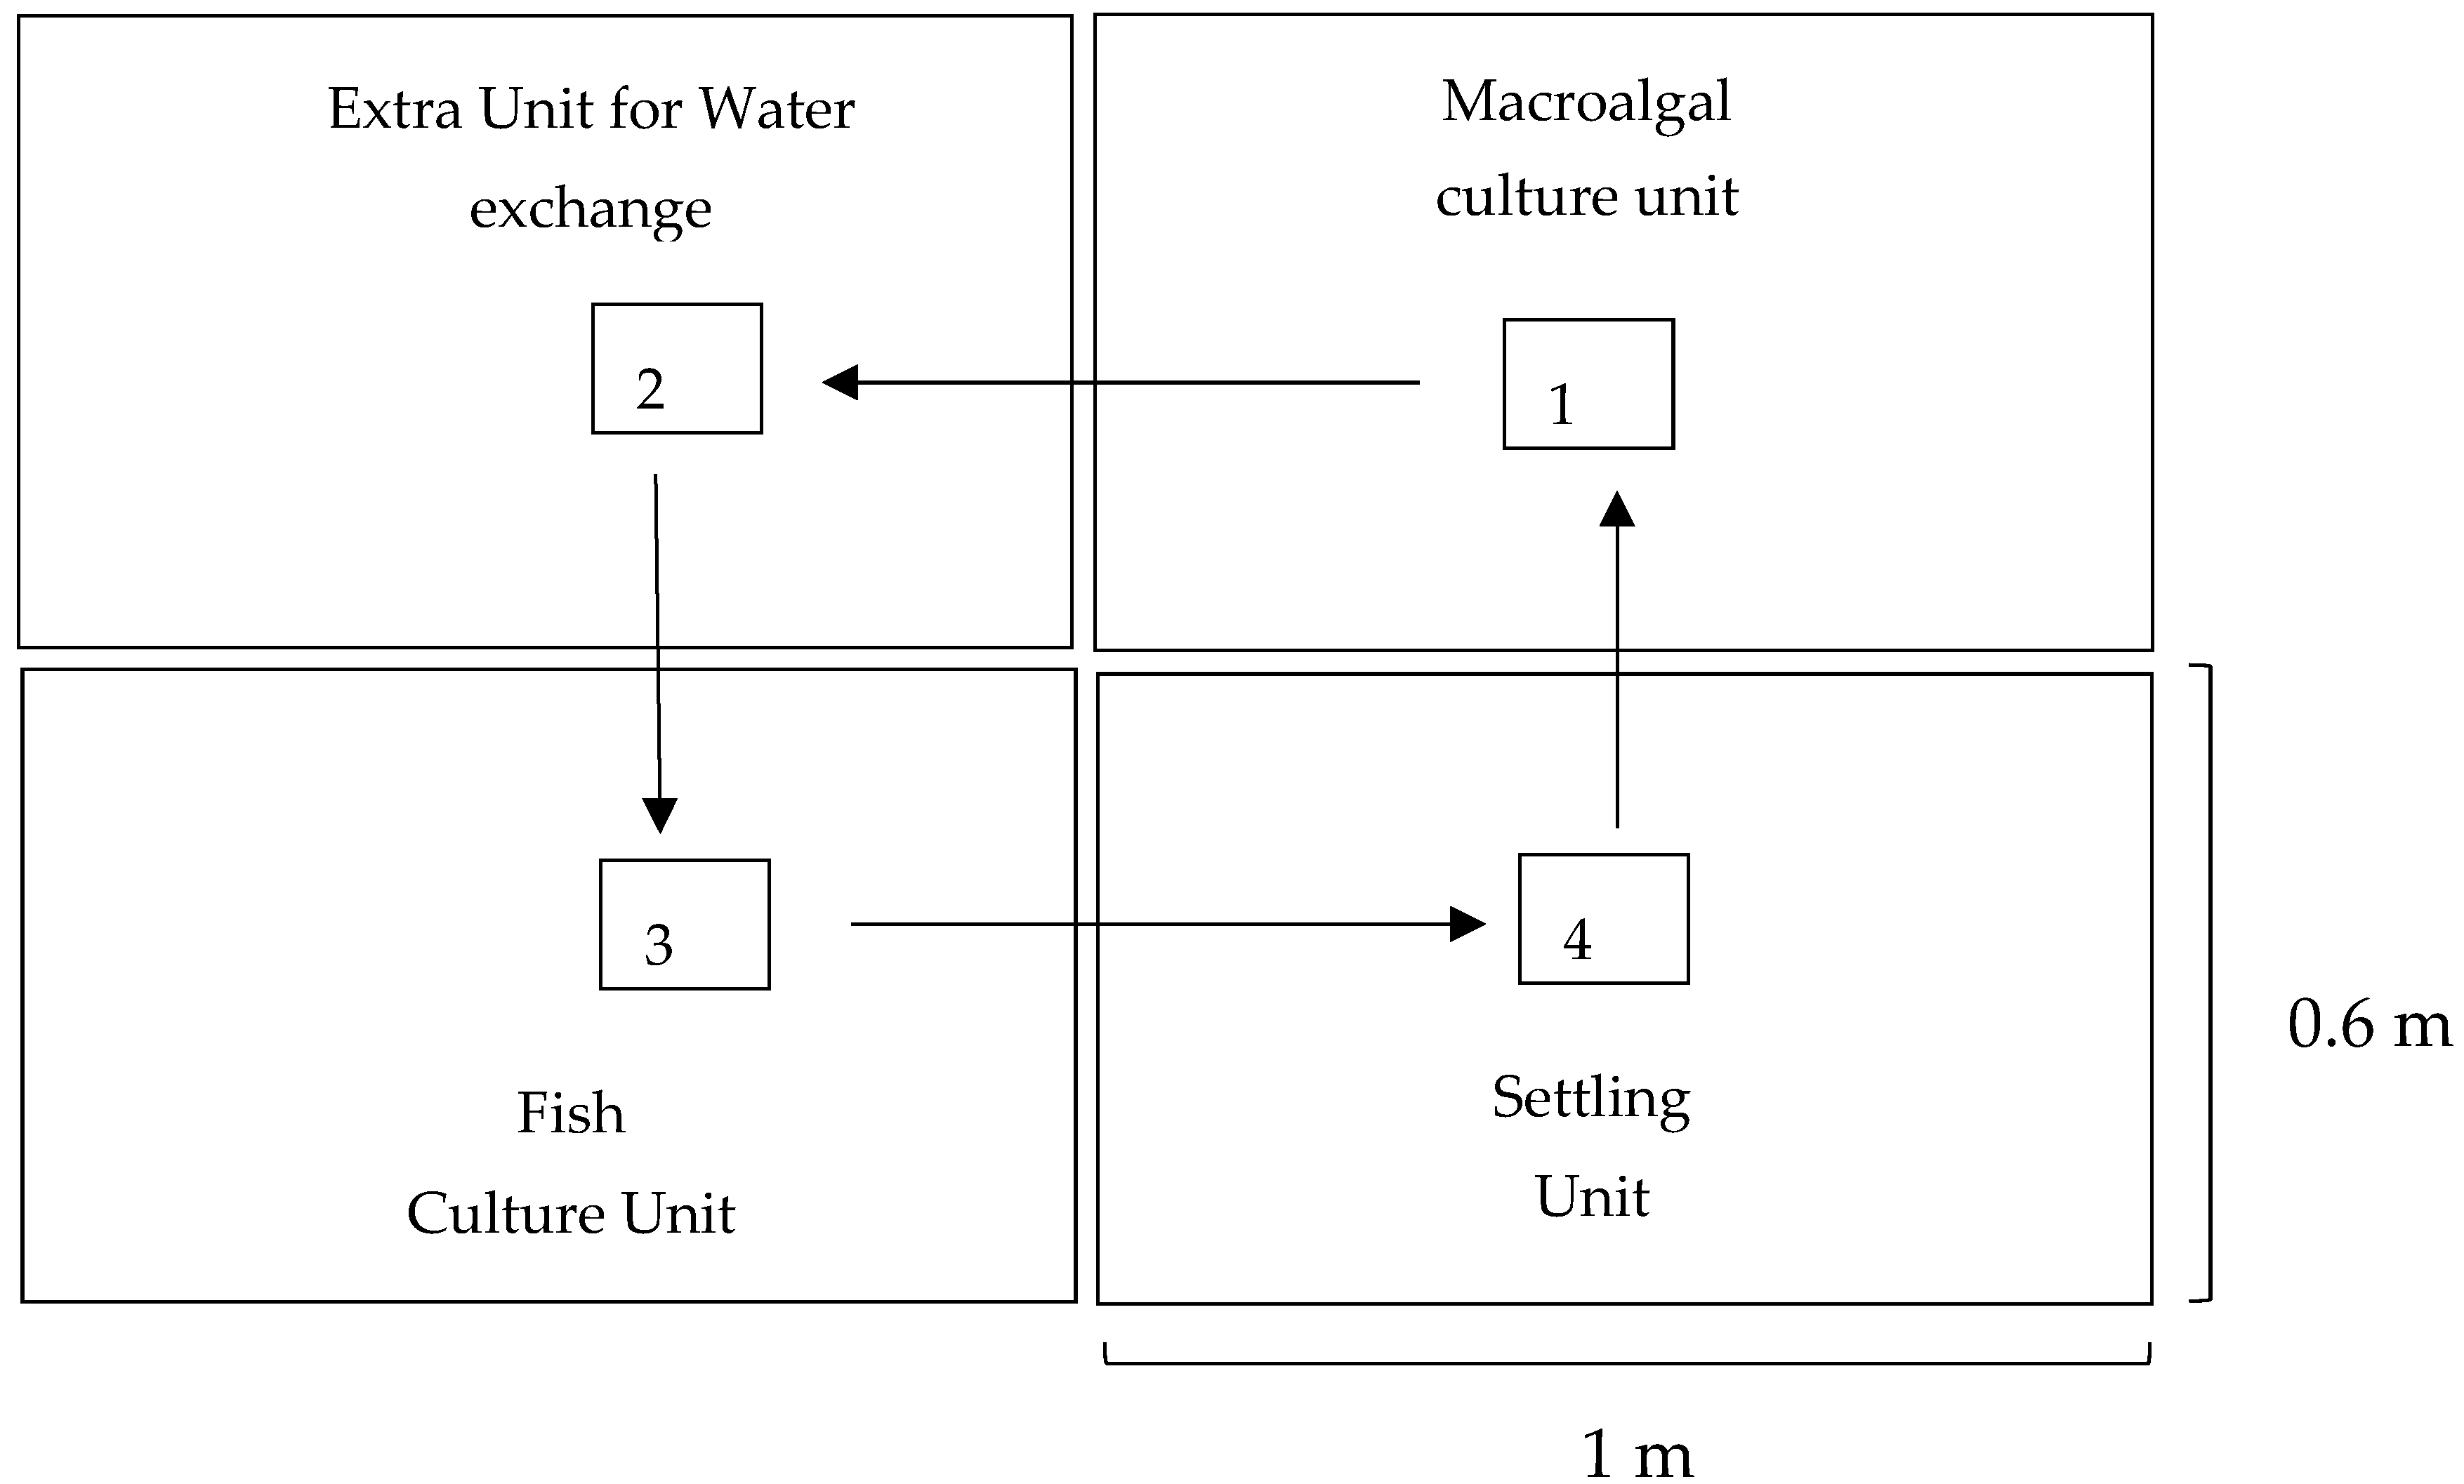
The integrated circulation system was designed by scaling the water volume up to 150 L under outdoor conditions. The system had three main components: fish culture unit, settling unit, and macroalgal culture unit (
Figure 1), and three replicates were used in parallel for the experiment. Each unit was a 1 m × 0.6 m × 0.5 m size rectangular shape plastic tank and 40 acclimatized
P. latipinna individuals were stocked in each tank. Polyester fiber sheeting was placed at the bottom of the settling unit to facilitate the sedimentation of solid particles.
C. lentillifera was cultured in three small bamboo cages of triangular shape at 25 cm height, placed in the macroalgal culture unit, where 4.5 kg of
C. lentillifera was stocked per tank and maintained. Macroalgae were left to grow under natural light. There was sufficient illumination because transparent sheets were set at the roof.
Each of the three replicates underwent 15 circulations of water. Therefore, there were 45 circulations in total for which the same set of measurements were conducted, which allowed us to assess the repeatability of the results.
Water circulation among the units was done every four days by siphoning water manually. The water circulation began with the macroalgal culture unit. The water from this unit was transferred to the extra tank first. Then the water in the settling unit was transferred to the macroalgal culture unit. The water volume in this unit was maintained at 150 L. As the next step, the water from the fish culture unit was transferred to the setting unit. During this transfer, the water level was maintained at 5 cm for fish and 80% of the water from the fish culture unit was recirculated among the units. As the final step, the water in the extra unit was transferred to the fish culture unit. In each of the three replicates of the fish culture unit, the number of fish was maintained at 40. The fries were removed from the unit twice a day. This circulation procedure was implemented for 60 days.
The concentrations of the four nutrient components (NO
2−-N, NO
3−-N, NH
3-N, and PO
43−) in the fish culture units exceeded the threshold levels of effluent standards after seven days of fish culture. In Thailand, the maximum permitted values of NH
3-N (ammonia nitrogen) and total phosphorus are 1.1 mg-N/L and 0.4 mg-P/L, respectively [
36]. After seven days, water began to be circulated among the units of the integrated system (i.e., the first circulation). Water from the fish culture unit was transferred through the settling units and macroalgal culture units, being kept in each unit for three days as described by Chirapart and Lewmanomont [
37]. The fish culture unit was bottom siphoned daily, and refilled adding 30 ppt water prepared using filtered, concentrated seawater.
Maintenance of water quality (physical, chemical, and biological characteristics) in culture systems is crucial for the production and survival in aquaculture [
15,
20,
35]. During the study period, biological, physical, and chemical parameters were monitored. Growth rates and production of fish and macroalgae were measured once every ten days. The macroalgae in each of the three macroalgal units were measured and adjusted to the initial weight by removing the excess mass of macroalgae [
37]. Water quality parameters, temperature, dissolved oxygen (DO), pH, and inorganic nutrient concentrations (NO
2−-N, NO
3−-N, NH
3-N,) of the system were measured daily. Monitoring of the water quality parameters and collection of water samples to determine the nutrient concentrations were performed at 9.00 a.m. before feeding and siphoning. The water samples were filtered through GF/C Whatman filter papers (0.45 µm). The concentrations of nitrite (NO
2−), nitrate (NO
3−), ammonia (NH
3), and phosphate (PO
43−) were determined according to the standard spectrophotometric methods, namely, the cadmium reduction method, naphthylethylenediamine method, phenate method, and ascorbic acid method, respectively [
38]. The initial and final C:N ratios were determined using macroalgal tissues from initial macroalgal stock (initial C:N ratio) and macroalgae from the integrated system at the end of the experiment as the final C:N ratio. Fresh tissues were dried at 85 °C for 24 h and then stored in a dry place until C and N determinations at the Laboratory of Forest Soil, Faculty of Forestry, Kasetsart University, Thailand. Carbon and N tissue contents were determined using a Perkin Elmer Model 2400 CHN analyzer.
The initial and final heavy metal contents (Pb, As, and Cd) were measured, and the fecal coliform test was performed using fresh macroalgal materials at the Central Laboratory, Thailand. The concentrations of Pb, As, and Cd were determined using the AOAC (Association of Official Agricultural Chemists) (2016) method.
2.4. Statistical Analysis
Nutrient concentration in the macroalgae unit was mainly used as the outcome variables in the analysis to determine the effects of the circulation system on nutrient removal. For descriptive analysis, the mean concentration of each nutrient was averaged over the 15 circulations and plotted for each day for macroalgae units in line graphs to see how the concentration changed from day to day within the four-day cycle. Likewise, the concentration was averaged over the four days and plotted for each circulation in line graphs to see if there was any change in concentration from circulation to circulation.
For inferential analysis, the ANOVA (Analysis of Variance) test was used. While the concentrations of NO2−-N, NO3−-N, NH3-N, and PO43− were expected to significantly reduce from Day 0 to Day 1, changes thereafter remain uncertain. Therefore, the ANOVA test examined the mean difference in concentration across Day 1, Day 2, and Day 3, as well as the mean difference among the 15 circulations.
To formally determine the effects of the integrated circulation system on the concentration of each nutrient, multiple linear regression analysis [
39] was employed to control for covariates. In our case, the model utilized a series of dummy variables to estimate the effects of the system for each day and each circulation. Specifically, the model included dummies for Day 1, Day 2, and Day 3, where Day 0 was taken as the base category, and a series of dummies for Circulation 1 and Circulations 3–15, where Circulation 2 was taken as the base category. The latter was considered because the descriptive result suggested relatively low concentrations at Circulation 2 compared to the rest. That is, if differences between Circulation 2 and the other circulations were insignificant, we could conclude that there is no significant difference between any other pair of circulations.
where i refers to Observation ID (i = 1, 2, 3, ….., 180 = 4 days × 15 circulation × 3 replications), y is the nutrient concentration (mg/L),
is the dummy variable for Day 1 (i.e., the variable takes the value of one for observations made on Day 1, and zero otherwise),
and
are Day 2 and Day 3 dummies, respectively,
is the 1st circulation dummy,
to
are the 3rd to 15th circulation dummies, and ε is the random error term. Furthermore, to account for any autocorrelation within the day specific time series, the error term was clustered on each day, rendering the cluster-robust to standard errors [
40].
The weights of fish and macroalgae were measured every ten days. Macroalgae were restocked to the same initial weight, following the method described by Chirapart and Lewmanomont [
37] and growth performance of fish was evaluated using Formulas (3) and (4):
The average daily growth rate (ADG) of fish:
where DW1 is the mean final weight of fish (g), DW0 is the mean initial weight of fish (g), and T is time (days).
The relative daily growth rates (RGR) for macroalgae were calculated according to the following equation [
41,
42].
where Wt is the final fresh weight, W0 is the initial fresh weight, and t is time (days).
Data analysis was performed using STATA 15 and MS Excel [
43].
3. Results and Discussions
3.1. Nutrient Removal
Figure 2 shows that on Day 0 the mean concentrations were 0.52 ± 0.03 mg/L, NO
2−-N; 121.6 ± 2.15 mg/L, NO
3−-N; 1.27 ± 0.04 mg/L NH
3-N; and 0.4 ± 0.01 mg/L PO
43−. These concentrations decreased to 0.10 ± 0.01 mg/L, NO
2−-N; 38.1 ± 1.55 mg/L, NO
3−-N; 0.61 ± 0.03 mg/L NH
3-N; and 0.1 ± 0.01 mg/L PO
43− by Day 1, respectively. The mean concentrations of all these nutrients slightly decreased further on the following two days. In fact, in each circulation, the nutrient concentrations in the macroalgae culture unit were highest on Day 0, which was due to the effluent that had been generated in the fish culture unit and transferred from the settling unit.
The average concentrations of the four nutrients in each circulation over the three replicates during the study period are shown in
Figure 3. There were statistically significant differences found in concentrations among the 15 circulations as a whole, for each of the four nutrients.
Table 1 presents the effects of the integrated circulation system on nutrient concentration for each day of the four-day cycle and for each circulation. The effects were highly significant for all the four nutrients and for all the three days after the macroalgae were applied. The negative coefficients mean that the concentrations were reduced compared to Day 0. For example, the NO
2−-N concentration in Day 1 was lower by 0.2469 mg/L on average, holding other variables unchanged. The differences in nutrient concentrations between Circulation 2 and each of the 14 other circulations were generally insignificant, except that the NH
3-N concentration was significantly higher in Circulation 1. This must be due to the water of the fish culture unit that was circulated among the units of the integrated system after seven days of the acclimatization.
After the acclimatization, another seven days were spent circulating water among the units to increase the nutrient content in the effluent to minimize the possible nutrient limitations for macroalgal growth. The significant difference in NH
3 concentration between Circulations 1 and 2 may be due to the effluent collection from the fish culture unit seven days after the completion of the acclimatization process, by which time the dissolved nutrient concentrations exceeded the standards in Thailand [
34]. The initial results were not stable, but the system seemed to have become stable after several circulations of nutrient uptake from effluent, particularly after Circulation 8 all the way up to Circulation 15. This implies that the repeatability of the measurements was sufficiently high after eight circulations in this system.
3.2. Fish Growth and Production
The fish grew from 0.9 ± 0.12 g/d to 2.9 ± 0.15 g/d during the experimental period. The maximum average daily weight gain (ADG) of fish was observed (0.06 g/d) on Day 20 of the 60-day period and after that, ADG slightly declined during the rest of the study period which was when water was circulated within a four-day period (
Figure 4). Survival percentage during the first seven days was 75.6% and during the period of Day 7 to Day 60, it was 96.8%. Fry production of the system was observed after Day 14 and the total number of fry production during the study period was 348.
3.3. Macroalgae Growth
The maximum relative growth rate (RGR) for the macroalgae was observed on Day 20 (
Figure 5). However, the RGR decreased rapidly until Day 40. The RGR for the whole study period was 2.7 g/d.
The RGR of macroalgae registered peak values on Day 20 and decreased thereafter. Possible reasons include the reduction in nutrient content in effluent due to the slow growth of fish after Day 20 and the self-shading with the high growth rates of
C. lentillifera [
25,
26,
27,
28]. Another reason may be that the optimum growth of macroalgae requires specific chemical, biological, and environmental conditions [
33]. Therefore, for the commercial use of the fish and macroalgae integrated system, it is important to consider the factors affecting the growth of both fish and macroalgae, as well as the nutrient requirements. The maximum macroalgal growth found on Day 20 with the RGR being 4.29% per day was comparable with a previous study by Mosquera-Murillo and Pena-Salamanca [
44] which found that during 24 days of culture, RGRs of
Caulerpa sertularioides were 4.82% per day at 25 ppt salinity.
A decrease in C:N ratio is considered as an indicator of nutrient uptake by macroalgae [
45]. In the present study, the initial C:N ratio was 10.14 ± 0.14 and the final was 8.09 ± 0.16. Therefore, the nutrient uptake by
C. lentillifera was supported by the decrease in C:N ratio [
2,
20]. The C:N ratio also helps determine whether the macroalgae are faced with a condition of deficiency in N. When it exceeds 15, it means that N is limited. In our study, both the initial and final C:N ratios indicate that there was no N limitation for seaweed growth [
35,
46].
The study revealed that green seaweed
C. lentillifera is a promising candidate for bioremediation of aquaculture effluents due to its high growth rates and nutrient removal efficiencies and can be used to reduce the concentrations of NO
2−-N, NO
3−-N, NH
3-N, and PO
43− to below acceptable levels [
34]. Furthermore, this study revealed that the highly salinity tolerant fish species such as
P. latipinna (Sailfin mollies) could be cultured by integrating macroalgae in order to decrease inorganic nutrient discharge to the environments with enhanced efficiency in water resource use.
3.4. Water Quality and the Water Consumption of the Culture System
Water salinity in each tank was maintained at 30 ppt. Thus, there was no significant difference (p > 0.15) in water quality parameters (water temperature, dissolved oxygen (DO), pH during the study period. The water temperature in the system fluctuated between 27 °C and 28 °C, averaged at 27.2 ± 0.03 °C. Average DO in the fish unit, settling unit, and macroalgae unit were 4.54 ± 0.05 mg/L, 2.17 ± 0.06 mg/L, and 4.46 ± 0.04 mg/L, respectively. The average pH in the fish unit, settling unit, and macroalgae unit were 8.23 ± 0.01 mg/L, 8.11 ± 002 mg/L, and 8.19 ± 0.02 mg/L.
In the present study, the average pH was 8.16 ± 0.02, the mean DO was 4.4 ± 0.01 mg/L, and the mean temperature was 27.5 °C during the study period. These are compatible with the water quality parameters reported in the commercial and experimental culture of
Caulerpa spp [
47], which used 7.0–7.9 pH, 3.0–4.4 DO, and 27.7–30.3 °C.
Apart from the water quality, water consumption for aquaculture is a limiting factor in many countries [
2]. In this recirculating system, bottom siphoning was used daily for the removal of the solid fecal materials to reduce water turbidity. Twenty percent of water volume was consumed daily to refill each fish culture unit to maintain the total volume. Hence, this system shows potential in increasing the water use efficiency through bioremediation processes with macroalgae.
3.5. Heavy Metal Content
The mean initial arsenic (As) content in the macroalgae was 0.306 ± 0.02 mg/kg ww (wet weight) and the mean final As content was 0.222 ± 0.01 mg/kg ww. The mean initial Pb and Cd contents were 0.183 ± 0.02 mg/kg ww and 0.333 ± 0.001 mg/kg ww, while the final Pb and Cd contents were 0.138 ± 0.004 mg/kg ww and 0.032 ± 0.001 mg/kg ww, respectively.
In the initial specimen, the heavy metal concentrations were higher than the final concentrations. The initial specimens were purchased from a commercial macroalgal farm which used the coastal area for the culture. The coastal area can be contaminated with different heavy metals due to industrial waste. The macroalgae can absorb heavy metals from the water source. However, for our study, we used concentrated seawater and normal tap water. The excess growth of macroalgae was harvested every 10 days, and the heavy metal content of the final sample was lower than the initial contents. The final sample may consist of a certain part of the initial sample and newly grown parts during the study period.
Consumption of different macroalgal species as human food is widespread in many countries [
46].
C. lentillifera is considered as a sustainable food source for human consumption due to its high nutritional value [
27,
48]. However, macroalgae can absorb and accumulate heavy metals quickly from the growth medium. Hence, although macroalgae are rich in nutritional components, including essential minerals, there is a potential risk of containing high levels of heavy metals which are harmful to human health [
49,
50]. Nonetheless, the initial concentrations of Cd and Pb in macroalgae which was obtained from a commercial farm in Petchaburi area of Thailand for this study and the final concentrations in macroalgae harvested from the integrated system were both lower than the European Union (EU)’s maximum allowable values of 0.05 mg/kg ww and 0.30 mg/kg ww, respectively [
51,
52,
53]. In contrast, while the concentration of As in a certain green macroalgae (Chlorophyta) species being above 10 mg/kg dw (dry weight) is considered as a high total Arsenic containing species, the maximum permissible level of total As content in green macroalgae
Ulva rigida is 3.0 mg/kg dw [
49]. In the present study, the initial and final total As concentrations were within the acceptable range. Therefore, the macroalgae produced in the integrated system were at the safe level of concentrations of the heavy metals for human consumption.
The recirculation system integrating P. latipinna (Sailfin mollies) and C. lentillifera can be used as an effective culture method for removal of inorganic nutrients, maintenance of water quality, and reduction in water consumption for fish and macroalgal production.
In general, nutrients are classified into three main groups: macronutrients, micronutrients or trace elements, and vitamins [
35]. Therefore, future research is recommended to focus on the analysis of a complete set of available nutrients, their concentrations in the effluent, and other limiting factors affecting the macroalgal growth in the integrated system.
4. Conclusions
The capacity of C. lentillifera in the removal of NO2−-N, NO3−-N, NH3-N, and PO43− from fish culture effluent in a recirculating aquaculture system were determined using P. latipinna under outdoor conditions in 150 L medium for 60 days. The study provided evidence that green macroalgae C. lentillifera can be cultured with P. latipinna and that proper water quality can be maintained for the growth and production of fish and macroalgae. On average over the 15 circulations, the first one day of application decreased the concentrations of NO2−-N, NO3−-N, NH3-N, and PO43− by 0.247, 81.6, 0.682, and 0.352 mg/L, respectively. Our findings suggest the nutrient removal from C. lentillifera from P. latipinna based on decreased C:N ratio of macroalgae during the 60-day application period. We also found that C. lentillifera produced from the integrated system had safe levels of Cd, Pb, and As for human consumption. However, we recommend that a recirculating system can be implemented at the farm level after field trials are undertaken and associated cost and benefit analysis is performed.
This study revealed the potential of C. lentillifera for the treatment of aquaculture effluent using a fish species in a recirculating aquaculture system. This contributes to strengthening the implication of an integrated aquaculture system. This may also serve as a guide for policymakers in the design and implementation of new policy measures to overcome the problem of effluent treatment in the aquaculture industry.

 ,
, 


