Polyetherimide-Montmorillonite Nano-Hybrid Composite Membranes: CO2 Permeance Study via Theoretical Models
by
 ,
,
Asif Jamil
1, 
Oh Pei Ching
2,*,
Muhammad Naqvi
3,*,
Hafiza Aroosa Aslam Khan
1 and
Salman Raza Naqvi
4 1
Department of Chemical, Polymer and Composite Materials Engineering, University of Engineering and Technology (New-Campus), Lahore 39021, Pakistan
2
CO2 Research Centre (CO2RES), Institute of Contaminant Management, Department of Chemical Engineering, University Technology PETRONAS, Bandar Seri Iskandar, Perak 32610, Malaysia
3
Department of Engineering and Chemical Sciences, Karlstad University, 65188 Karlstad, Sweden
4
School of Chemical and Materials Engineering, National University of Sciences and Technology, Islamabad 44000, Pakistan
*
Authors to whom correspondence should be addressed.
Processes 2020, 8(1), 118; https://doi.org/10.3390/pr8010118
Submission received: 15 December 2019
/
Revised: 5 January 2020
/
Accepted: 14 January 2020
/
Published: 17 January 2020
(This article belongs to the Special Issue Nano-Hybrid Composite Membranes)
Abstract
:The incorporation of aminolauric acid modified montmorillonite (f-MMT) in polyetherimide (PEI) has been implemented to develop hollow fibre nano-hybrid composite membranes (NHCMs) with improved gas separation characteristics. The aforementioned characteristics are caused by enhanced f-MMT spatial dispersion and interfacial interactions with PEI matrix. In this study, existing gas permeation models such as, Nielsen, Cussler, Yang–Cussler, Lape–Cussler and Bharadwaj were adopted to estimate the dispersion state of f-MMT and to predict the CO2 permeance in developed NHCMs. It was found out that the average aspect ratio estimated was 53, with 3 numbers of stacks per unit tactoid, which showed that the intercalation f-MMT morphology is the dominating dispersion state of filler in PEI matrix. Moreover, it was observed that Bharadwaj model showed the least average absolute relative error (%AARE) values till 3 wt. % f-MMT loading in the range of ±10 for a pressure range of 2 to 10 bar. Hence, Bharadwaj was the best fit model for the experimental data compared to other models, as it considers the platelets orientation.
1. Introduction
Today, among world community, the concerns over global warming have increased due to its impact on climate and weather change. Nevertheless, the global warming has changed the human life and the risk can be even more in future [1]. Carbon dioxide, a major greenhouse gas, contributes a lot to global warming. As a result, increasing efforts have been observed worldwide in order to counter the dangers of CO2 emission [2]. The research community around the globe put serious efforts in order to separate CO2 from its emission source. The conventional separation methods like absorption, adsorption, and cryogenic distillation have been used industrially; however, the newer technologies like membrane-based processes are getting overwhelming response owing to cleaner, simpler and cost-effective technique [3,4]. In membrane-based separation technology, gas-gas separations are rapidly growing industrial processes, and increasingly used for nitrogen separation from air, hydrogen recovery in ammonia synthesis, petroleum cracking plants and natural gas purification [5,6].
The nucleus of membrane-based separation process is the membrane itself. For gas separation processes, various types of membranes including polymeric, inorganic, and mixed matrix membrane have been reported in the literature [7,8]. Inorganic membranes are superior in terms of thermal and chemical stability, mechanical strength and longer lifespan. Despite superior properties, the defect-free morphology and reproducibility, along with economic viability, are the factors to limit its commercial applications [9]. On the contrary, polymeric membranes dominates the industrial sector owing to materials’ availability, extensive polymer properties, high packing density, easy processing, and cost effectiveness [10]. Composite membranes combined the synergistic advantage of both phases. Subsequently, the inorganic phase is dispersed in polymer matrix ascertain the separation capabilities of inorganic phase with an ease of processing of polymeric membranes [11,12].
As mentioned in our previous works [13,14], montmorillonite, a type of clay, has been incorporated in polyetherimide to develop mixed hybrid composite membranes in order to separate CO2 from CH4 gas. At first, MMT modification was performed, and modified montmorillonite (f-MMT) render improved filler dispersion by increasing the basal spacing to 17.22 Å from 12.38 Å. It was observed that higher basal spacing not only favors dispersion, the gas separation performance also increases due to improved filler polymer interfacial interactions. In addition, the effect of filler concentrations was studied by varying feed pressure (2 to 10 bar). It was observed that up to 2 wt. % of f-MMT loadings, NHCMs separation performance increases against all feed pressures. However, beyond this loading opposite trend was noticed due to f-MMT agglomeration. The developed NHCMs exhibited the highest ideal selectivity of 18.35 with 2 wt. % of f-MMT loading at 4 bar pressure, as shown in Table S1. Here in this study, the developed membranes are denoted as PEI-f-MMT (1), PEI-f-MMT (2), PEI-f-MMT (3), and PEI-f-MMT (4), which represent NHCMs containing 1, 2, 3, and 4 wt. % f-MMT loadings in PEI matrix.
The theoretical prediction of gas permeation behavior is of high importance, especially when these membranes get overwhelming response for gas separation processes. Various theoretical models for predicting gas permeation behavior of composite membranes are reported such as Maxwell, Bruggeman, Lewis-Nielsen and Pal models, however, these models considered the spherical shape of impermeable inorganic particles. Nonetheless, the new generation of NHCMs contain layered structure inorganic particles such as phyllosilicates, and possess a high aspect ratio (width/thickness) in order of 10 to 10,000 [15]. The aspect ratio of the particles plays a vital role in determining the dispersion and gas permeation characteristics of NHCMs, and theoretical expressions like Nielsen, Cussler, Yang–Cussler, Lape–Cussler and Bhardwaj models incorporate aspect ratio of layered filler and are considered for this study [15,16,17].
The objective of this paper is to theoretically estimate the f-MMT dispersion state and to compare and validate the gas permeation performance of the developed PEI-f-MMT membranes with existing phenomenological permeation models to understand the gas transportation mechanism through the membranes.
Background of Gas Permeation Models
The gas molecules passage through permeation membranes is governed by viscous flow, Knudsen diffusion, surface diffusion, molecular sieving or solution diffusion. The permeation of gas molecules across membranes is dependent on the membrane morphology which is either porous or non-porous in nature. For porous morphology, the size and shape of the gas molecules and pore size are responsible for gas molecules transport.
To the contrary, the gas molecules permeation through non-porous clay particles is governed by solution-diffusion mechanism. The gas molecules permeation through polymer phase takes place in four steps; the sorption of penetrant gas molecules at the membrane surface, gas dissolution inside membrane, diffusion through membrane, and desorption from the other surface [18]. Hence, the gas molecules mobility across polymer phase depends on both thermodynamic and kinetic properties of penetrant gas [19]. Subsequently, the gas permeation in polymer matrix depends on both diffusion (D) and solubility (S) coefficients as explained by Fickian diffusion as given in Equation (1) [20].
However, the presence of impermeable inorganic filler like f-MMT in polymer phase increases the diffusion path for penetrant molecules. This obstruction in the diffusion pathways depend on filler’s loading, aspect ratio and platelets orientation.
The increase in impermeable filler phase decreases the diffusion coefficient due to tortuosity, and consequently the permeability of membrane decreases [21]. The f-MMT orientation in polymer matrix is another key aspect that defines the membrane performance. For instance, the parallel orientation of layered fillers to the diffusion path results in increment of diffusion coefficient of penetrant molecules, whereas, opposite behavior is observed with perpendicular orientation. In addition, aspect ratio plays an important role in layered structure filler’s intercalation and exfoliation in polymer matrix. The higher aspect ratio of filler favors exfoliation due to weak inter-layer bonding and eventually improved dispersion can be achieved [22]. Delamination state of filler represents the intercalation of polymer chain in filler inter-layer spacing, whereas, exfoliation shows the complete separation of filler layers. Exfoliation is the most desired state as the enhanced membrane performance can be ascertained at lower loadings. Generally, complete exfoliation state of the clay is not achieved in polymer matrix, however, mixed morphology containing intercalated and exfoliated state are often observed [23].
2. Methods
2.1. Models Used for Developed Membranes
Various models are reported in the literature to predict the gas permeation behavior of membranes incorporating layer structured fillers in polymer phase, a few are provided in Table 1. These models are based on specific assumptions; therefore, each model has certain limitations. Nielsen model is the simplest model as it considers the rectangular shaped layers arranged in the gas diffusion pathways. Since the model is based on diffusion path obstruction due to platelets. Therefore, this model is also known as “tortuous path” model [24]. This model assumes the layered filler rectangular shaped nanoparticles are dispersed in polymer phase.
Cussler considered the nano-filler arrangement in layered form and each layer is separated by narrow slits [25]. Since, this model encompasses the effect of filler aspect ratio along with volume fraction; it is more reliable in permeability prediction than the Nielsen model. Furthermore, Yang–Cussler model was developed by considering the mono-dispersion of nanoparticles with varied aspect ratio and parallel alignment of platelets to the gas diffusion path [26]. On the other hand, Lape–Cussler assumed the rectangular shaped filler platelets that have uniform aspect ratio, random dispersion in polymer phase and are in parallel alignment to each other along the gas flow direction [27].
The common considerations in all of the above-stated models are the complete platelets exfoliation and their horizontal arrangement to the penetrant diffusion path. Later, Bharadwaj introduced the platelets orientation factor in his permeation model [28]. The orientation factor includes various platelets arrangement such as horizontal, parallel or random distribution to the diffusion path. Unlike others, Bharadwaj model describes both intercalation and exfoliation states of the dispersed layered nanoparticles.
2.2. Estimation of f-MMT Aspect Ratio
In this section, the f-MMT aspect ratio and its dispersion state are determined by opting phenomenological models. In addition, the permeance at 2 bar pressure is considered for uncoated PEI-f-MMT NHCM. The rationale behind choosing low pressure was to eliminate the effect of surface defects and plasticization. Furthermore, uncoated membranes carried the effect of f-MMT only and independent of PDMS coating characteristics.
The aspect ratio, dispersion state and the length of the f-MMT flakes together with its phase interactions with PEI matrix defines the permeation properties of the developed NHCMs. The average aspect ratio of the clay platelets can either determined by using TEM analysis or estimated through theoretical permeation models [17,29,30]. In the latter case, the experimentally determined permeation values are inserted in permeation models. The theoretical aspect ratio value, at which the experimental permeation values are in close agreement to the theoretically determined values, is considered as clay’s average aspect ratio. Zulhairun and Ismail developed NHCM and estimated the average aspect ratio of cloisite flakes in polysulfone by adopting theoretical permeation models [31].
3. Results and Discussion
Figure 1 depicts various theoretical permeation curves generated via Nielsen, Cussler, Yang–Cussler, Lape–Cussler and Bharadwaj models. Where, Pc, represent the permeance of NHCM; Po, permeance of neat membrane; and, a, is the aspect ratio of f-MMT inside PEI matrix. For all the models, it is observed that, the relative permeation curves fall-off as the volume fraction and aspect ratio of the nano-filler increases. In addition, the experimental data points and theoretical curves are developed against several aspect ratios of the nano-clay. Furthermore, it is observed that the experimental data points are not fully fit the theoretical curves; nevertheless, they exhibit the same trend at volume fraction above 0.005 for CO2 gas.
Moreover, the calculated relative permeance using theoretical models displays a trend same as the experimentally determined relative permeation data. Nevertheless, an abrupt increase in relative permeance is noted at 0.020 filler volume fraction, which might show the clay agglomeration at this loading. Table 2 shows the relative permeance data of CO2 gas determined via experiments and calculated by using phenomenological models at aspect ratios 40, 40, 60, 15 and 110 respectively.
The average aspect ratio calculated by all these models is 53 for PEI-f-MMT. Equation (2) describes the average absolute relative error (%AARE), which is the tuning parameter and relates the difference between experimental and calculated values. The lower the %AARE, the closer agreement exists between experimental and calculated data.
where Pcali and Pexpi are the relative permeance for the ith experimental value and NDP represents the number of data points.
Furthermore, Table 2 presents the calculated and experimental Pc/Po values of all PEI-f-MMT NHCMs with %AARE at different aspect ratio of f-MMT. For volume fraction 0.005 to 0.015, %AARE values varied from +8.84 to −3.41 for Nielsen model, +8.61 to −4.95 for Lape–Cussler and it varied from +9.65 to −1.57 for Bharadwaj. All these stated %AARE values showed ±10% deviation indicating a close agreement of experimental values to the theoretical curve. However, Cussler and Yang–Cussler models calculated approximately +15 %AARE for PEI-f-MMT (1). Moreover, for volume fraction 0.002, the agglomeration took place and abrupt increase in permeation is observed. This agglomeration behavior of filler was not considered in theoretical permeation models.
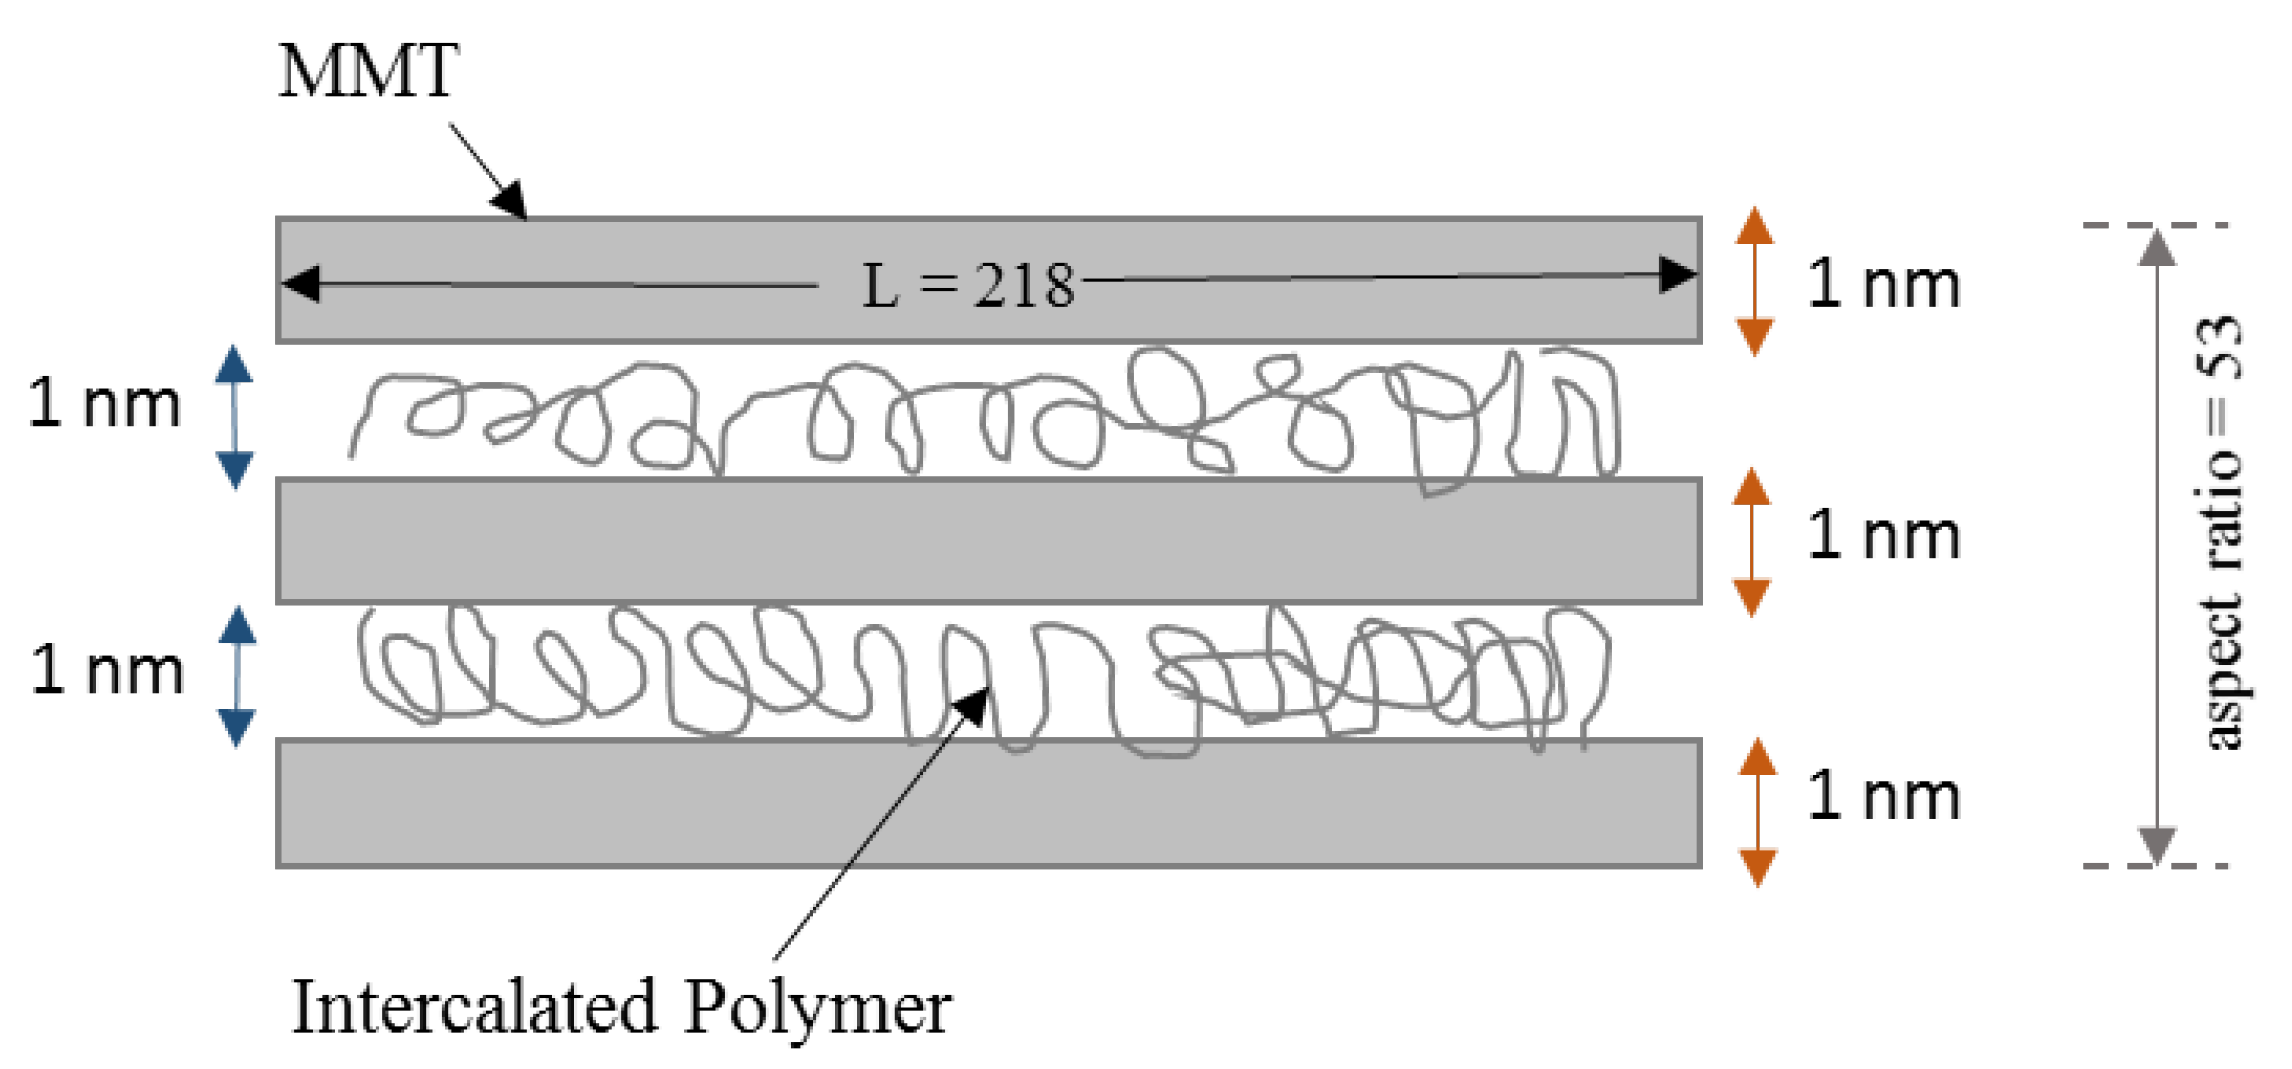
Moreover, in order to approximate the number of stacks of flakes per unit tactoid, Bharadwaj proposed a method for layered nanoparticles [28]. In order to approximate the average aspect ratio, the lateral dimension of f-MMT is required. Yano et al. studied the polyimide-Na-MMT for water permeability and determined the lateral dimension as 218 nm and width of 1 nm [29]. In addition, the polymer chains expanded by f-MMT interlayer space to 1 nm as suggested by Bharadwaj. The number of stacks per unit tactoid calculated using average aspect ratio as explained in Figure 2, and is approximately 4 for volume fraction of 0.005 to 0.020. This number shows superior dispersion properties of f-MMT for 1 to 3 wt. % loading in PEI matrix. Though, it does not show complete f-MMT exfoliation, however, the intercalation consists of only 3 stacks per unit tactoid, and this in agreement to reported literature. Zulhairun and Ismail determined the intercalation morphology of cloisite 15A via theoretical models and reported 2 to 4 number of stacks in a tactoid ranged from 2 to 4 [15]. Similarly, in another study, 2–3 stacks in a tactoid for 5 wt. % cloisite 15A loadings [21]. Furthermore, Kim et al. used high shear mixer to develop cellulose-AMH-3 NHCM owing to achieve enhanced filler dispersion and reported 2–3 stacks per unit tactoid [16]. Picard et al. experimentally estimated the average aspect ratio of f-MMT in Nylon 6, and the experimental value of 20 was then validated via Lape–Cussler model, which provides closer value of 17.2 [17]. Therefore, it can be concluded that promising dispersion and improved interactions exists between f-MMT and PEI.
4. Validation of Developed Membranes CO2 Permeance via Theoretical Models
In order to validate the experimental CO2 permeation values with existing theoretical models, Nielsen, Cussler, Yang–Cussler, Lape–Cussler and Bhardwaj models were considered at pressure range from 2 to 10 bar. The above stated models are available models that considered the layered form of dispersed filler. Since f-MMT is a type of clay and consist of alumino silicates in layered form, the aforementioned models were adopted for this study. Table 3 shows the %AARE calculated for PDMS coated PEI-f-MMT composite membranes from theoretically generated curves.
Nielsen model considered the horizontal dispersion of f-MMT in the PEI matrix. The experimentally determined value showed deviation from the theoretical values as depicted in Table 3. However, it exhibits similar decreasing trend with pressure. NHCM with 1 wt. % f-MMT shows minimum deviation whereas highest deviation is observed for 4 wt. % f-MMT. The absolute average from the theoretical generated values are given as −8.46, 10.17, −14.08, −11.72 and −5.30 for 1 wt. % f-MMT loading at 2, 4, 6, 8 and 10 bar pressure. However, for all other loadings, the deviation from experimental values is very high.
Moreover, Cussler model showed a similar deviating trend from experimentally determined permeance till 8 bar for all developed PEI-f-MMT NHCMs. Furthermore, the experimentally determined CO2 permeance values for PEI-f-MMT (1) showed close agreement to the theoretically generated values. In contrast, NHCM containing 4 wt. % of f-MMT showed the maximum deviation from the theoretical curve. This is mainly due to agglomeration of f-MMT in PEI matrix, which was not considered in the models.
In contrast to aforementioned models, Yang–Cussler model considered the mono dispersion of nano filler containing variations in aspect ratio. Therefore, it can be seen that the CO2 permeance values follow a similar trend with their respective theoretical curves. For 1 and 2 wt. % f-MMT loadings in PEI polymer, the calculated %AARE values are less than ±10 as tabulated in Table 3. However, for PEI-f-MMT (3), the %AARE is ±20. This model is better suited to experimentally determined data compared to Nielsen and Cussler models. This is due to Yang–Cussler model incorporated the concept of flakes for filler, which is a relevant assumption to f-MMT structure. Thus, the theoretical and experimental values are in close agreement for lower filler loadings.
Since, Lape–Cussler model considered the rectangular shape of incorporated fillers with random dispersibility in host polymer matrix. It is noted that the experimental points are poorly suited with theoretical curves. The minimum %AARE for any membrane at any pressure is between ±20 to ±60, which indicates the poor performance of developed membrane based on Lape–Cussler’s assumptions. The assumption of parallel distribution of clay platelets in the diffusion path was unable to relate the actual distribution of clay platelets in PEI matrix.
Table 3 shows that the Bharadwaj model is the most suitable model for developed membranes. It is observed that for all feed pressure range, the PEI membranes incorporated with 1 to 3 wt. % of f-MMT has shown close agreement with %AARE less than ±10. This showed excellent performance of Bharadwaj model in order to fit the experimentally determined CO2 permeance values at feed pressure of 2 to 10 bar for PEI-f-MMT NHCMs. However, PEI-f-MMT (4) also showed close agreement to theoretically generated data points, the deviations for all pressure ranges are below 24 value of %AARE. This %AARE value shows lower deviation for 4 wt. % f-MMT for all the aforementioned models despite higher filler agglomeration at this loading.
Figure 3 presents the experimental point for spun hollow fibre NHCMs in comparison to Bharadwaj model’s generated curves. It is observed that CO2 permeance trend against pressure by theoretical curve is the same as experimentally observed data points. Moreover, for 1 to 3 wt. % of f-MMT incorporation in PEI matrix shows closer CO2 permeance behavior compared to their respective theoretical curves. However, the model does not consider the effect of filler agglomeration. As a result, due to high f-MMT agglomeration at 4 wt. %, the model showed significant deviation compared to theoretically generated curve.
Bharadwaj model is the most advanced and versatile which incorporates the orientation geometry of the dispersed filler. Due to this assumption, Bharadwaj model is the best suited to PEI-f-MMT hollow fibre NHCMs at various feed pressure and f-MMT loadings, compared to other considered theoretical models.
5. Conclusions
Existing phenomenological models, Nielsen, Cussler, Yang–Cussler, Lape–Cussler, and Bharadwaj models were opted in order to validate the experimental data. In the first place, the aspect ratio of the f-MMT filler was estimated by incorporating the experimentally determined permeation values in theoretical models. The average aspect ratio was found to be 53, with 3 numbers of stacks per tactoid, which showed that the intercalation morphology is the dominating dispersion state of f-MMT filler in PEI matrix. Afterwards, to validate the experimental CO2 permeation values with existing theoretical models were considered at pressure range from 2 to 10 bars. Bharadwaj model proved to be the most suitable against at all feed pressures. The Bharadwaj model is versatile in nature, which assumed both parallel and horizontal distribution of incorporated filler. For f-MMT loading of 1 to 3 at full pressure range, the %AARE range from −10.11 to 8.55, which showed closer agreement to the experimentally determined permeation values. However, at further loading, f-MMT agglomeration started and deviation from the experimental data was observed.
Supplementary Materials
The following are available online at https://www.mdpi.com/2227-9717/8/1/118/s1, Table S1: Gas permeance of PEI-f-MMT hollow fiber nano-hybrid composite membranes.
Author Contributions
A.J. and O.P.C. designed the study, conducted parts of the experiments and write the initial draft of the paper. M.N., H.A.A.K., S.R.N. completed the data analysis and proof read the manuscript. M.N. and O.P.C. supervised the project and helped to revise the manuscript and add references. A.J. & S.R.N. proof read and edited the final manuscript. All authors have read and agreed to the published version of the manuscript.
Funding
This research work was funded by YUTP-FRG grant No. 015LC0-103, and the APC was funded by Karlstad University, 65188 Karlstad, Sweden.
Acknowledgments
The research work was supported by Universiti Teknologi PETRONAS, Malaysia, Karlstad University, Sweden and Department of Chemical, Polymer and Composite Materials Engineering, University of Engineering and Technology (New-Campus), Lahore.
Conflicts of Interest
The authors declare no conflict of interest.
References
- He, X.; Hagg, M.-B. Membranes for environmentally friendly energy processes. Membranes 2012, 2, 706–726. [Google Scholar] [CrossRef] [PubMed] [Green Version]
- Nguyen, Q.T.; Sublet, J.; Langevin, D.; Chappey, C.; Marais, S.E.; Valleton, J.M.; Poncin-Epaillard, F. CO2 Permeation with pebax based membranes for global warming reduction. Membr. Gas Sep. 2010, 9, 255–277. [Google Scholar]
- Baicha, Z.; Salar-García, M.J.; Ortiz-Martínez, V.M.; Hernández-Fernández, F.J.; de los Ríos, A.P.; Maqueda Marín, D.P.; Collado, J.A.; Tomás-Alonso, F.; El Mahi, M. On the Selective Transport of Nutrients through Polymer Inclusion Membranes Based on Ionic Liquids. Processes 2019, 7, 544. [Google Scholar] [CrossRef] [Green Version]
- Murali, R.S.; Sankarshana, T.; Sridhar, S. Air separation by polymer-based membrane technology. Sep. Purif. Rev. 2013, 42, 130–186. [Google Scholar] [CrossRef]
- Jusoh, N.; Yeong, Y.F.; Lau, K.K.; Shariff, A.M. Fabrication of silanated zeolite T/6FDA-durene composite membranes for CO2/CH4 separation. J. Clean. Prod. 2017, 166, 1043–1058. [Google Scholar] [CrossRef]
- Baker, R.W.; Low, B.T. Gas separation membrane materials: A perspective. Macromolecules 2014, 47, 6999–7013. [Google Scholar] [CrossRef]
- Mustafa, M.Z.; bin Mukhtar, H.; Md Nordin, N.A.; Mannan, H.A.; Nasir, R.; Fazil, N. Recent Developments and Applications of Ionic Liquids in Gas Separation Membranes. Chem. Eng. Technol. 2019, 42, 2580–2593. [Google Scholar] [CrossRef]
- Bernardo, P.; Drioli, E.; Golemme, G. Membrane gas separation: A review/state of the art. Ind. Eng. Chem. Res. 2009, 48, 4638–4663. [Google Scholar] [CrossRef]
- Nasir, R.; Kim, J.O.; Chae, S.R. Material Advancements in Fabrication of Nano-hybrid composite membranes. Chem. Eng. Technol. 2013, 36, 717–727. [Google Scholar] [CrossRef]
- Oh, P.C.; Mansur, N.A. Effects of Aluminosilicate Mineral Nano-Clay Fillers on Polysulfone Mixed Matrix Membrane for Carbon Dioxide Removal. J. Teknol. 2014, 69, 23–27. [Google Scholar]
- Jamil, A.; Ching, O.P.; Shariff, A.B.M. Current Status and Future Prospect of Polymer Layered Silicate Mixed Matrix Membranes for CO2/CH4 Separation. Chem. Eng. Technol. 2016, 39, 1393–1405. [Google Scholar] [CrossRef]
- Khan, A.L.; Klaysom, C.; Gahlaut, A.; Khan, A.U.; Vankelecom, I.F. Mixed matrix membranes comprising of Matrimid and SO3H functionalized mesoporous MCM-41 for gas separation. J. Membr. Sci. 2013, 447, 73–79. [Google Scholar] [CrossRef]
- Jamil, A.; Ching, O.P.; Shariff, A.M. Mixed matrix hollow fibre membrane comprising polyetherimide and modified montmorillonite with improved filler dispersion and CO2/CH4 separation performance. App. Clay Sci. 2017, 143, 115–124. [Google Scholar] [CrossRef]
- Jamil, A.; Oh, P.C.; Shariff, A.M. Polyetherimide-montmorillonite mixed matrix hollow fibre membranes: Effect of inorganic/organic montmorillonite on CO2/CH4 separation. Sep. Purif. Technol. 2018, 206, 256–267. [Google Scholar] [CrossRef]
- Zulhairun, A.K.; Ismail, A.F. The role of layered silicate loadings and their dispersion states on the gas separation performance of mixed matrix membrane. J. Membr. Sci. 2014, 468, 20–30. [Google Scholar] [CrossRef]
- Kim, W.G.; Lee, J.S.; Bucknall, D.G.; Koros, W.J.; Nair, S. Nanoporous layered silicate AMH-3/cellulose acetate nanocomposite membranes for gas separations. J. Membr. Sci. 2013, 441, 129–136. [Google Scholar] [CrossRef]
- Picard, E.; Vermogen, A.; Gérard, J.F.; Espuche, E. Barrier properties of nylon 6-montmorillonite nanocomposite membranes prepared by melt blending: Influence of the clay content and dispersion state: Consequences on modelling. J. Membr. Sci. 2007, 292, 133–144. [Google Scholar] [CrossRef]
- Cui, Y.; Kumar, S.; Kona, B.R.; van Houcke, D. Gas barrier properties of polymer/clay nanocomposites. RSC Adv. 2013, 5, 63669–63690. [Google Scholar] [CrossRef]
- Yampolskii, Y. Polymeric gas separation membranes. Macromolecules 2012, 45, 3298–3311. [Google Scholar] [CrossRef]
- Scholes, C.A.; Ghosh, U.K. Review of membranes for helium separation and purification. Membranes 2017, 7, 9. [Google Scholar] [CrossRef] [PubMed] [Green Version]
- Ismail, N.M.; Ismail, A.F.; Mustafa, A.; Matsuura, T.; Soga, T.; Nagata, K.; Asaka, T. Qualitative and quantitative analysis of intercalated and exfoliated silicate layers in asymmetric polyethersulfone/cloisite15A mixed matrix membrane for CO2/CH4 separation. Chem. Eng. J. 2015, 268, 371–383. [Google Scholar] [CrossRef] [Green Version]
- Behroozi, M.; Pakizeh, M. Study the effects of Cloisite15 A nanoclay incorporation on the morphology and gas permeation properties of Pebax2533 polymer. J. App. Poly. Sci. 2017, 134, 45302. [Google Scholar] [CrossRef]
- Choudalakis, G.; Gotsis, A.D. Permeability of polymer/clay nanocomposites: A review. Euro. Poly. J. 2009, 45, 967–984. [Google Scholar] [CrossRef]
- Nielsen, L.E. Models for the permeability of filled polymer systems. J. Macromol. Sci. 1967, 1, 929–942. [Google Scholar] [CrossRef]
- Cussler, E.L.; Hughes, S.E.; Ward, W.J., III; Aris, R. Barrier membranes. J. Membr. Sci. 1988, 38, 161–174. [Google Scholar] [CrossRef]
- Yang, C.; Smyrl, W.H.; Cussler, E.L. Flake alignment in composite coatings. J. Membr. Sci. 2004, 231, 1–12. [Google Scholar] [CrossRef]
- Lape, N.K.; Nuxoll, E.E.; Cussler, E.L. Polydisperse flakes in barrier films. J. Membr. Sci. 2004, 236, 29–37. [Google Scholar] [CrossRef]
- Bharadwaj, R.K. Modeling the barrier properties of polymer-layered silicate nanocomposites. Macromolecules 2001, 34, 9189–9192. [Google Scholar] [CrossRef]
- Yano, K.; Usuki, A.; Okada, A. Synthesis and properties of polyimide-clay hybrid films. J. Poly. Sci. Part A Poly. Chem. 1997, 35, 2289–2294. [Google Scholar] [CrossRef]
- Bhole, Y.S.; Wanjale, S.D.; Kharul, U.K.; Jog, J.P. Assessing feasibility of polyarylate-clay nanocomposites towards improvement of gas selectivity. J. Membr. Sci. 2007, 306, 277–286. [Google Scholar] [CrossRef]
- Zulhairun, A.K.; Ismail, A.F.; Matsuura, T.; Abdullah, M.S.; Mustafa, A. Asymmetric mixed matrix membrane incorporating organically modified clay particle for gas separation. Chem. Eng. J. 2014, 241, 495–503. [Google Scholar] [CrossRef]
Figure 1.
Estimation of f-MMT aspect ratio by using (a) Nielsen, (b) Cussler, (c) Yang–Cussler, (d) Lape–Cussler, and (e) Bharadwaj, permeation models.
Figure 1.
Estimation of f-MMT aspect ratio by using (a) Nielsen, (b) Cussler, (c) Yang–Cussler, (d) Lape–Cussler, and (e) Bharadwaj, permeation models.

Figure 2.
Schematics of calculating stacks per unit tactoid via Bharadwaj method.

Figure 3.
Bharadwaj model for polyetherimide–modified montmorillonite (PEI-f-MMT) NHCMs.


Table 1.
Phenomenal models used to calculate gas permeance through nano-hybrid composite membranes (NHCM) using layered silicates as fillers.
Table 1.
Phenomenal models used to calculate gas permeance through nano-hybrid composite membranes (NHCM) using layered silicates as fillers.
| Models | Equation | Ref | Description |
|---|---|---|---|
| Nielsen | [24] | Where, Pc, Permeability of composite, P0, Permeability of neat polymeric membrane φ, Volume fraction of filler a, Aspect ratio of dispersed filler S, is the order factor S = 0, Random orientation S = −1/2, Parallel orientation to the gas diffusion path S = 1, Horizontal orientation to the gas diffusion path | |
| Cussler | [25] | ||
| Yang–Cussler | [26] | ||
| Lape–Cussler | [27] | ||
| Bharadwaj | [28] |
Table 2.
CO2 permeance data generated through models vs. experimental values.
| Model | Membrane | Pc/Po(exp) | Pc/Po(cal) | %AARE | Aspect Ratio |
|---|---|---|---|---|---|
| Nielsen | PEI-f-MMT (1) | 0.83 | 0.91 | 8.84 | 40 |
| PEI-f-MMT (2) | 0.79 | 0.83 | 4.82 | ||
| PEI-f-MMT (3) | 0.79 | 0.76 | −3.4 | ||
| PEI-f-MMT (4) | 0.92 | 0.71 | −22.65 | ||
| Cussler | PEI-f-MMT (1) | 0.83 | 0.96 | 15.61 | 40 |
| PEI-f-MMT (2) | 0.79 | 0.87 | 9.73 | ||
| PEI-f-MMT (3) | 0.79 | 0.75 | −5.63 | ||
| PEI-f-MMT (4) | 0.92 | 0.63 | −31.78 | ||
| Yang–Cussler | PEI-f-MMT (1) | 0.83 | 0.96 | 15.09 | 60 |
| PEI-f-MMT (2) | 0.79 | 0.85 | 7.95 | ||
| PEI-f-MMT (3) | 0.79 | 0.72 | -8.53 | ||
| PEI-f-MMT (4) | 0.92 | 0.60 | −34.83 | ||
| Lape–Cussler | PEI-f-MMT (1) | 0.83 | 0.91 | 8.6 | 15 |
| PEI-f-MMT (2) | 0.79 | 0.82 | 3.99 | ||
| PEI-f-MMT (3) | 0.79 | 0.75 | −4.95 | ||
| PEI-f-MMT (4) | 0.91 | 0.69 | −24.65 | ||
| Bharadwaj | PEI-f-MMT (1) | 0.83 | 0.91 | 9.65 | 110 |
| PEI-f-MMT (2) | 0.79 | 0.84 | 6.25 | ||
| PEI-f-MMT (3) | 0.79 | 0.80 | −1.57 | ||
| PEI-f-MMT (4) | 0.91 | 0.73 | −20.82 |
Table 3.
Average absolute relative error (%AARE) values for the developed membranes.
| Model | Membrane | CO2 Feed Pressure (bar) | ||||
|---|---|---|---|---|---|---|
| 2 | 4 | 6 | 8 | 10 | ||
| Nielsen | PEI-f-MMT (1) | −8.46 | −10.17 | −14.08 | −11.72 | −5.30 |
| PEI-f-MMT (2) | −12.28 | −15.99 | −18.38 | −19.60 | −6.22 | |
| PEI-f-MMT (3) | −18.16 | −20.38 | −23.38 | −26.70 | −14.28 | |
| PEI-f-MMT(4) | −36.97 | −38.23 | −40.86 | −40.67 | −31.19 | |
| Cussler | PEI-f-MMT (1) | −2.65 | −4.47 | −8.63 | −6.12 | 0.70 |
| PEI-f-MMT (2) | −12.06 | −15.78 | −18.17 | −19.40 | −5.98 | |
| PEI-f-MMT (3) | −27.99 | −29.95 | −32.72 | −35.50 | −24.58 | |
| PEI-f-MMT (4) | −52.78 | −53.72 | −55.69 | −55.54 | −48.45 | |
| Yang–Cussler | PEI-f-MMT (1) | 0.49 | −1.39 | −5.69 | −3.09 | 3.94 |
| PEI-f-MMT (2) | −1.75 | −5.91 | −8.58 | −9.95 | 5.04 | |
| PEI-f-MMT (3) | −11.49 | −13.90 | −17.30 | −20.72 | −7.29 | |
| PEI-f-MMT (4) | −36.50 | −37.77 | −40.42 | −40.22 | 30.68 | |
| Lape–Cussler | PEI-f-MMT (1) | −24.74 | −26.15 | −29.37 | −27.42 | −22.15 |
| PEI-f-MMT (2) | −38.79 | −41.38 | −43.05 | −43.90 | −34.56 | |
| PEI-f-MMT (3) | −50.39 | −51.73 | −53.65 | −55.57 | −48.04 | |
| PEI-f-MMT (4) | −66.21 | −66.89 | −68.30 | −68.19 | −63.12 | |
| Bharadwaj | PEI-f-MMT (1) | −0.92 | −2.77 | −7.01 | −4.45 | 2.49 |
| PEI-f-MMT (2) | 1.53 | −2.76 | −5.52 | −6.93 | 8.55 | |
| PEI-f-MMT (3) | 0.36 | −2.37 | −6.23 | −10.11 | 5.11 | |
| PEI-f-MMT (4) | −18.72 | −20.34 | −23.74 | −23.49 | −11.27 | |
© 2020 by the authors. Licensee MDPI, Basel, Switzerland. This article is an open access article distributed under the terms and conditions of the Creative Commons Attribution (CC BY) license (http://creativecommons.org/licenses/by/4.0/).
Share and Cite
MDPI and ACS Style
Jamil, A.; Ching, O.P.; Naqvi, M.; Khan, H.A.A.; Naqvi, S.R. Polyetherimide-Montmorillonite Nano-Hybrid Composite Membranes: CO2 Permeance Study via Theoretical Models. Processes 2020, 8, 118. https://doi.org/10.3390/pr8010118
AMA Style
Jamil A, Ching OP, Naqvi M, Khan HAA, Naqvi SR. Polyetherimide-Montmorillonite Nano-Hybrid Composite Membranes: CO2 Permeance Study via Theoretical Models. Processes. 2020; 8(1):118. https://doi.org/10.3390/pr8010118
Chicago/Turabian StyleJamil, Asif, Oh Pei Ching, Muhammad Naqvi, Hafiza Aroosa Aslam Khan, and Salman Raza Naqvi. 2020. "Polyetherimide-Montmorillonite Nano-Hybrid Composite Membranes: CO2 Permeance Study via Theoretical Models" Processes 8, no. 1: 118. https://doi.org/10.3390/pr8010118
Note that from the first issue of 2016, this journal uses article numbers instead of page numbers. See further details here.