Application and Mechanism of Sludge-Based Activated Carbon for Phenol and Cyanide Removal from Bio-Treated Effluent of Coking Wastewater

School of Civil Engineering, Nanjing Forestry University, Nanjing 210037, China
*
Author to whom correspondence should be addressed.
Processes 2020, 8(1), 82; https://doi.org/10.3390/pr8010082
Submission received: 9 December 2019
/
Revised: 31 December 2019
/
Accepted: 6 January 2020
/
Published: 8 January 2020
(This article belongs to the Special Issue Wastewater Treatment Processes)
Abstract
:The toxic pollutants phenol and cyanide in the bio-treated effluent of coking wastewater still need advanced treatment to meet environmental requirements. In this study, activated carbon prepared from municipal sludge and bamboo waste (SBAC) was used for simultaneous adsorption of phenol and cyanide from bio-treated effluent of coking wastewater. The results showed that the optimum removal efficiencies of volatile phenol (69.7%) and total cyanide (80.1%) were observed at a SBAC dosage of 8 g/L, a pH value of 8.0, and a contact time of 80 min. The physical and chemical properties of SBAC were analyzed using Brunauer–Emmett–Teller (BET) surface area (SBET), scanning electron microscopy (SEM), and Fourier transform infrared (FTIR) spectroscopy. SBAC had high SBET (289.58 m2/g) and rich mesoporous structure (average pore diameter of 3.688 nm), and carboxylic groups on SBAC surfaces were enhanced due to the addition of bamboo waste. In addition, a kinetic model of pseudo-first-order fitted well with the experimental data of volatile phenol, while the adsorption of total cyanide onto the SBAC was better described by a pseudo-second-order kinetic model.
1. Introduction
In China, approximately 31.2 million tons of coking wastewater were produced from coal gas purification, coal coking, and the by-products recovery process of coking in 2017 [1]. Coking wastewater contains a large amount of organic pollutants, such as phenol and cyanide, which are highly toxic to both human and aquatic life even at low concentrations [2]. Therefore, it is critical to treat coking wastewater before it is discharged into the environment.
To date, numerous methods have been developed and applied to coking wastewater treatment [3,4,5], however, biological technologies are still widely used in China because they are eco-friendly methods for degrading organic pollutants into harmless substances [5,6]. It is reported that almost 95–98% of the organics in coking wastewater can be removed by biological degradation, but the phenol and cyanide contents in the bio-treated effluent still need further treatment to meet strict environmental requirements [1]. Therefore, filtration, coagulation, adsorption, and ozonation are used in the advanced treatment of coking wastewater after biological treatments [6,7,8,9,10]. Adsorption with activated carbon (AC) has been considered one of the most attractive techniques due to its simplicity and high removal performance [11,12]. However, the application of commercial AC in wastewater treatment is limited by its high-cost and non-renewable nature, therefore, many efforts have recently been made to prepare AC from renewable, abundant, and low-cost biomass [13,14,15]. For example, Singh et al. [15] used copper-impregnated coconut shell AC (Cu-CSAC) in a binary aqueous solution of phenol and cyanide, and the results showed that the optimal adsorption efficiencies for phenol (71.43%) and cyanide (86.8%) were observed at the temperature of 30 °C, the pH of 8, and the adsorbent dose of 40 g/L.
Sludge is an inevitable by-product of municipal wastewater treatment plants (WWTPs). About 13 million tons (dry weight) of municipal sludge (MS) were produced in China in 2016 [16]. Preparation of AC from MS by pyrolysis/activation is a promising method for the sustainable management of MS, since MS is a carbon-rich, renewable, and readily accessible resource [12,17]. Nevertheless, the adsorption capacities of sludge-based AC (SAC) to contaminants are usually low due to the relatively high ash and inorganics in the MS [18]. Therefore, a wide variety of agricultural wastes, nuts, and plant leaves have been added into MS to improve its surface area, internal pore structure, and the chemical functional groups present on its surface [19,20]. Recent research has found that bamboo waste (BW) is a promising type of additive in the pyrolysis of MS because of its high lignocellulose content and specific morphological properties [21,22]. The hemicellulose and cellulose in BW are pyrolyzed to produce tar at 220–315 °C and 315–400 °C, respectively [23], and some tars are continuously decomposed above 400 °C into pyrolytic gas, promoting the formation of micropores [21]. Moreover, the AC prepared from BW has expanded carbon nanotubes and rich aromatic structures [22]. Currently, SAC has showed potential in removing metals, phenol, or cyanide from single or binary aqueous solutions [24]. However, the utilization of SAC for the co-adsorption of phenol and cyanide from real wastewater has not been reported yet.
Consequently, in this study, the AC produced from MS and BW (SBAC) was used for the simultaneous adsorption of volatile phenol and total cyanide from bio-treated effluent of real coking wastewater. The optimal values for operational parameters such as SBAC dosage, initial pH, and contact time for efficient adsorption of phenol and cyanide in coking wastewater were investigated. Simultaneously, the adsorption mechanism of phenol and cyanide was determined by analyzing the physical and chemical properties of SBAC using scanning electron microscopy (SEM) and Fourier transform infrared spectrometer (FTIR). Additionally, the adsorption of phenol and cyanide onto SBAC was evaluated using adsorption kinetic models.
2. Materials and Methods
2.1. Precursor of SBAC
The MS used in this study was collected from a dewatering room of the Qiaobei WWTP in Nanjing, China. The BW was obtained from a furniture factory in Nanjing, China. The characteristics of MS and BW are shown in Table 1. The MS and BW were dried to constant weight at 105 °C using a drying oven (DGG-9030A, Donglu, Shanghai, China) and then crushed and sieved to a size below 80-mesh. Finally, these two powders were separately packed in sealed plastic bags and stored in a desiccator until use.
2.2. Preparation of SBAC
The dry MS and BW were mixed well in a stainless steel reactor with mass ratio of 2:1, and then soaked in 5 mol/L of ZnCl2 solution (ZnCl2: raw material = 3:1, w/w) for 24 h. Next, the mixture was centrifuged at 1176× g for 3 min. Afterwards, the sediment was dried at 105 °C for 12 h, carbonized at 550 °C for 30 min in a resistance furnace (SX-12-10, Xinyi, Shanghai, China), and cooled to room temperature overnight. Next, the carbonized product was immersed in 1.0 mol/L HCl for 5 min at room temperature, and the above step was repeated three times. Finally, the product was rinsed to neutral pH with deionized water, dried, and pulverized to below 80-mesh to obtain SBAC.
The preparation steps of SAC were similar to that of SBAC, except that no BW was added to the MS.
2.3. Characteristics of SBAC
The porosity and surface area of SAC and SBAC samples were measured by a surface area pore analyzer (Micrometrics, ASAP2020, Norcross, GA, USA). The Brunauer–Emmett–Teller (BET) surface area (SBET) was calculated by use of the BET equation. The total pore volume (VT) was determined at relative pressure of 0.995, and the micropore volume (Vmic) was analyzed by the de Boer method [25]. The average pore diameter (DP) of the SBAC was calculated using the equation 4VT/SBET [26].
The surface morphology of SAC and SBAC was measured by a SEM microscope (QUANTA 200, FEI, Hillsboro, OR, USA). The surface functional groups on the SAC and SBAC were evaluated with a FTIR spectrometer (IR-360, Nicolet, Madison, WI, USA), and the spectra were obtained in a wavelength rang of 400–4200 cm−1.
2.4. Adsorption Tests
Adsorption tests of SBAC were performed in three trials, using coking wastewater as adsorbate. The coking wastewater was taken from the bio-treated effluent in Shougang Jingtang Iron and Steel Co., Ltd. (Tangshan, China). The characteristics of the wastewater are summarized in Table 2. The coking wastewater was stored at 4 °C to avoid any changes in physical and chemical properties before use.
Operational parameters are important variables affecting the adsorption process. The pH influences the surface charge and functional groups of absorbent, as well as the ionization capacity of the adsorbate [27]. Contact time is another important parameter to determine the equilibrium time and kinetics of adsorption process [12]. Larger surface area and more binding sites were found with increase of adsorbent dosage, which directly affects the removal efficiency of absorbate [28]. Therefore, the effects of different adsorption parameters such as initial pH (4–10), contact time (0–120 min), and adsorbent dosage (1–12 g/L) on adsorption process were investigated. All adsorption experiments were performed in 250.0-mL conical flasks, in each of which 100.0 mL of coking wastewater and different amounts of SBAC were placed. The solutions were shaken at 100 rpm using a thermostatic shaker incubator (SHZ-82, Changzhou Guohua Electric Appliance Co., Ltd., Changzhou, China). The initial pH values were adjusted by adding 1.0 M of hydrochloric acid or 1.0 M of sodium hydroxide solution. At the end of each experiment, samples were filtered through 0.45-μm Millipore HA membranes (Millipore, Billerica, MA, USA), and the concentrations of volatile phenol and total cyanide in the filtrates were determined.
All experiments were conducted in triplicate, and the average and standard deviation values were recorded.
2.5. Analytical Methods
The COD, ammonia nitrogen, water content, VS, and SS were measured according to standard methods [29]. The pH was measured by a pH meter (PHS-3C, Leici, Shanghai, China). The elemental composition of the MS and BW (C, H, and N) was determined by an automatic elemental analyzer (Vario EL cube, Elementar, Hanau, Germany). The concentrations of volatile phenol and total cyanide in the coking wastewater were determined by 4-aminoantipyrine (20, pp. 1014) and pyridine-barbituric acid (20, pp. 607) spectrophotometry, respectively [29].
The removal efficiency (, %) and the equilibrium adsorption capacity (qe, mg/g) of SBAC on volatile phenol and total cyanide were calculated using Equations (1) and (2):
where represents the amount of pollutants adsorbed in mg per g of SBAC at equilibrium conditions; and are initial and equilibrium concentrations of volatile phenol or total cyanide (mg/L), respectively; is the volume of coking wastewater (L); and is the weight of SBAC (g).
3. Results and Discussion
3.1. Characterizations of the SBAC
3.1.1. BET Surface Area and Pore Structure
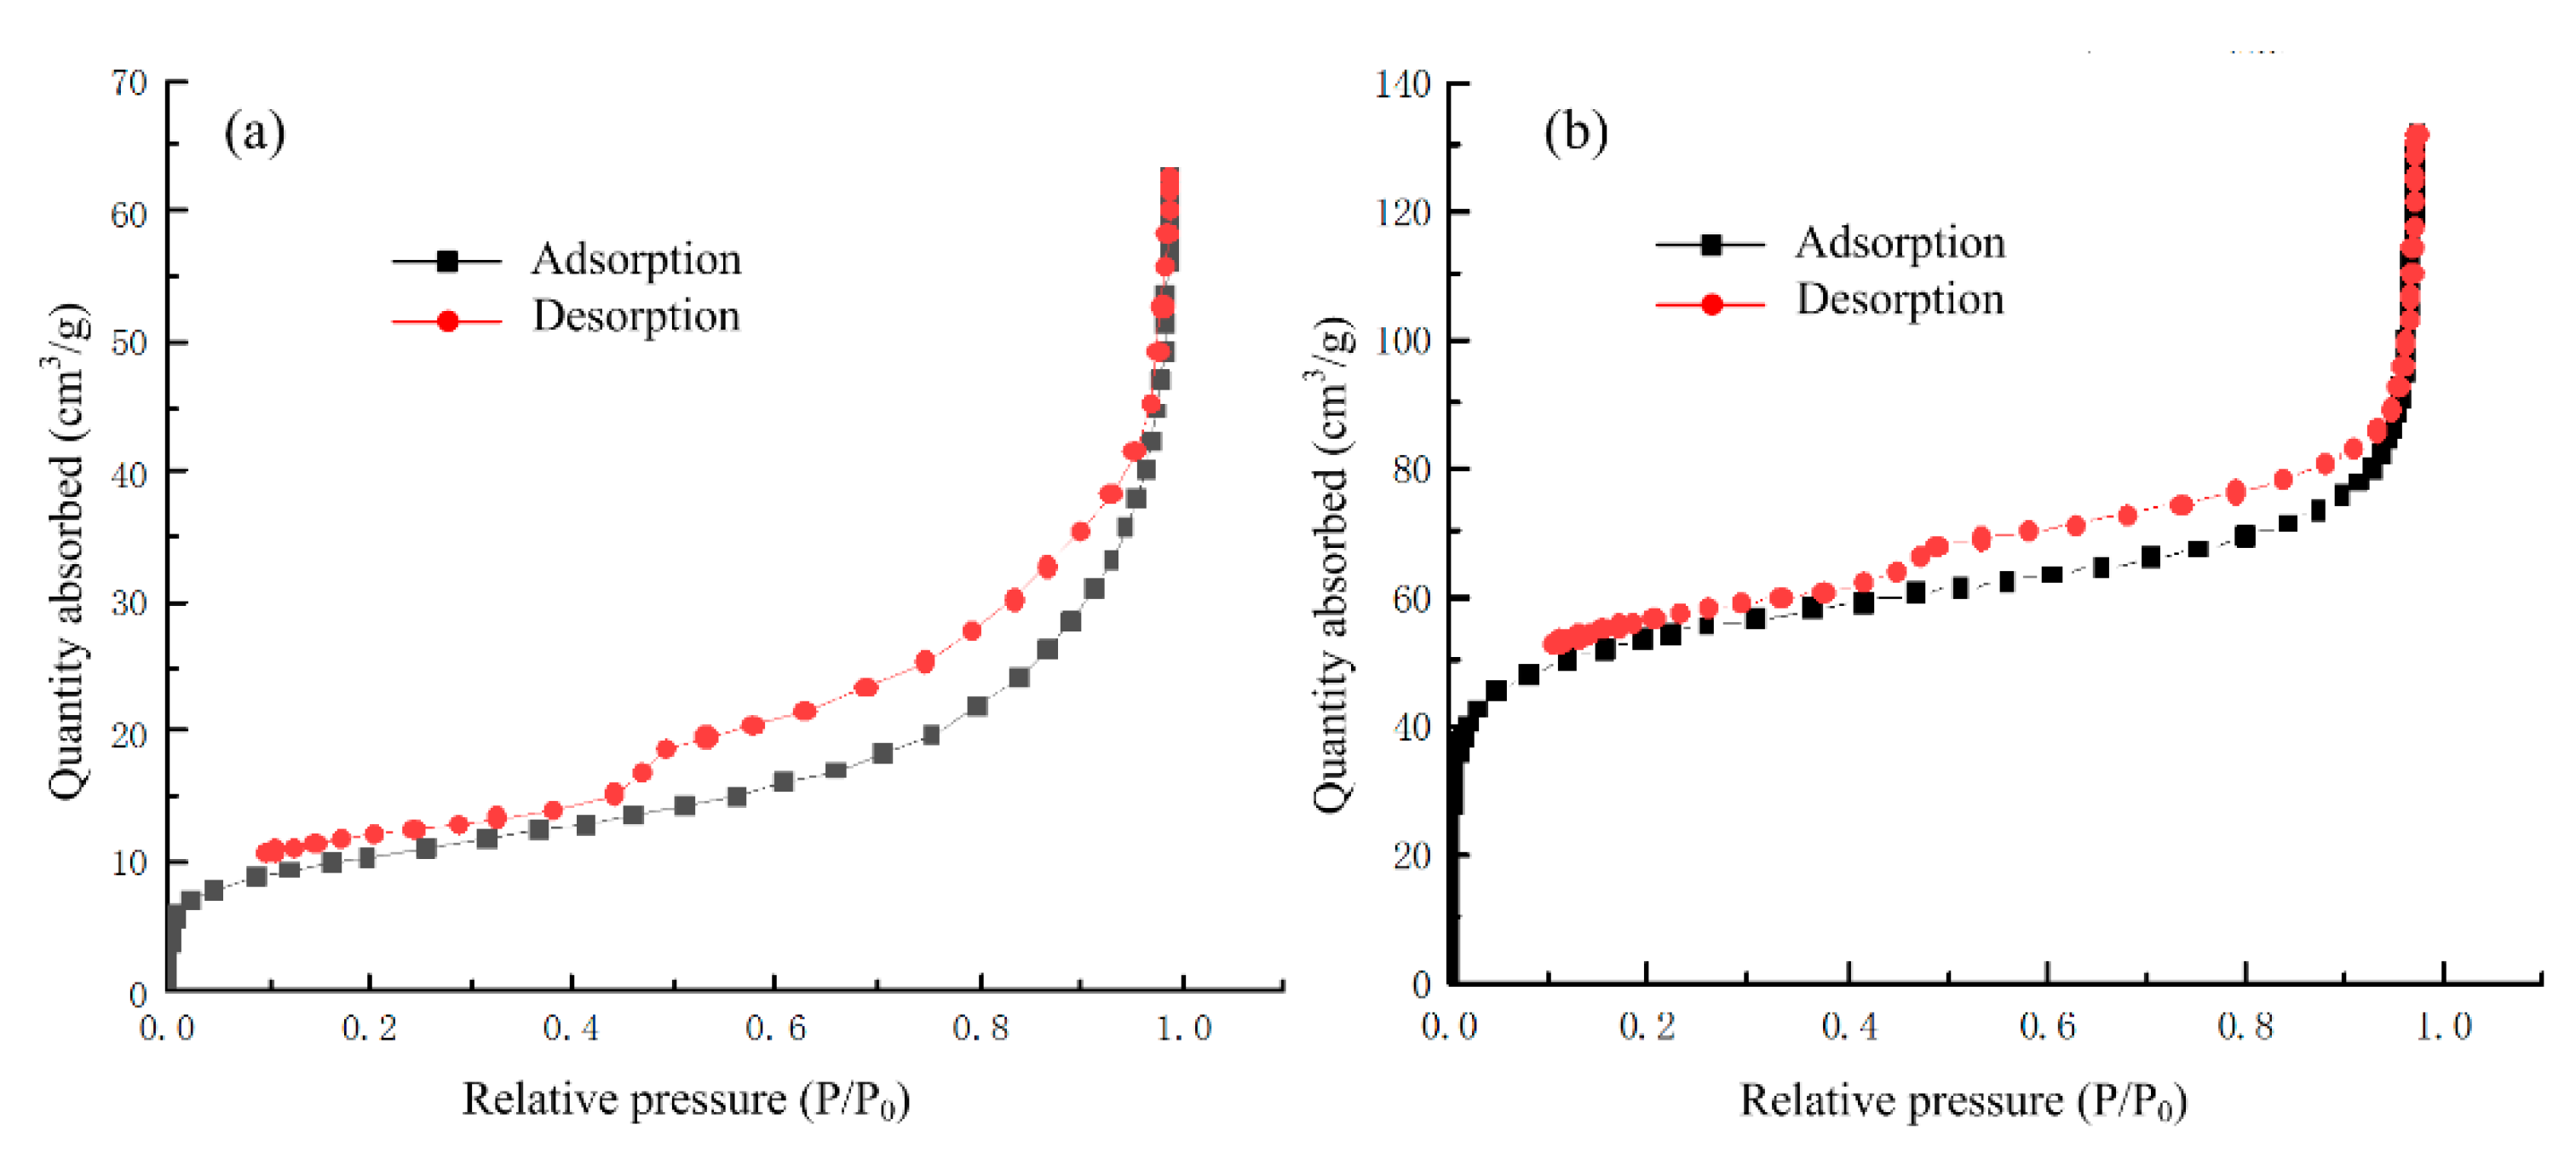
Nitrogen (N2) adsorption–desorption isotherms of SAC and SBAC are shown in Figure 1. According to the International Union of Pure and Applied Chemistry (IUPAC) classification, the shape of isotherms and hysteresis loops were classified as Type II with H3 hysteresis, which indicated that the SAC and SBAC samples had mesoporous structures [30]. Simultaneously, it can be seen that the adsorbed volume of SBAC was almost twice that of the SAC, indicating that SBAC had a richer mesoporous structure than SAC.
The pore structure characteristics of SAC and SBAC are listed in Table 3. The Dp of SBAC was 3.688 nm, which was much lower than that of SAC (10.941 nm). The SBET of the SBAC was found to be 289.578 m2/g with a VT of 0.267 cm3/g, which were almost 4.08 and 1.38 times higher than that of the SAC, respectively. It is argued that the addition of BW was effective in enhancing the surface area and pore volume by converting macropores or mesopores to micropores. As previously reported, when the temperature is above 400 °C, some tar produced from hemicellulose/cellulose in BW is broken down and converted into pyrolytic gas, thereby promoting the formation of pores [21]. Therefore, the addition of BW to improve carbon content in MS was the most likely reason for the significant increase in the surface area and pore volume of SBAC.
3.1.2. SEM Analyses
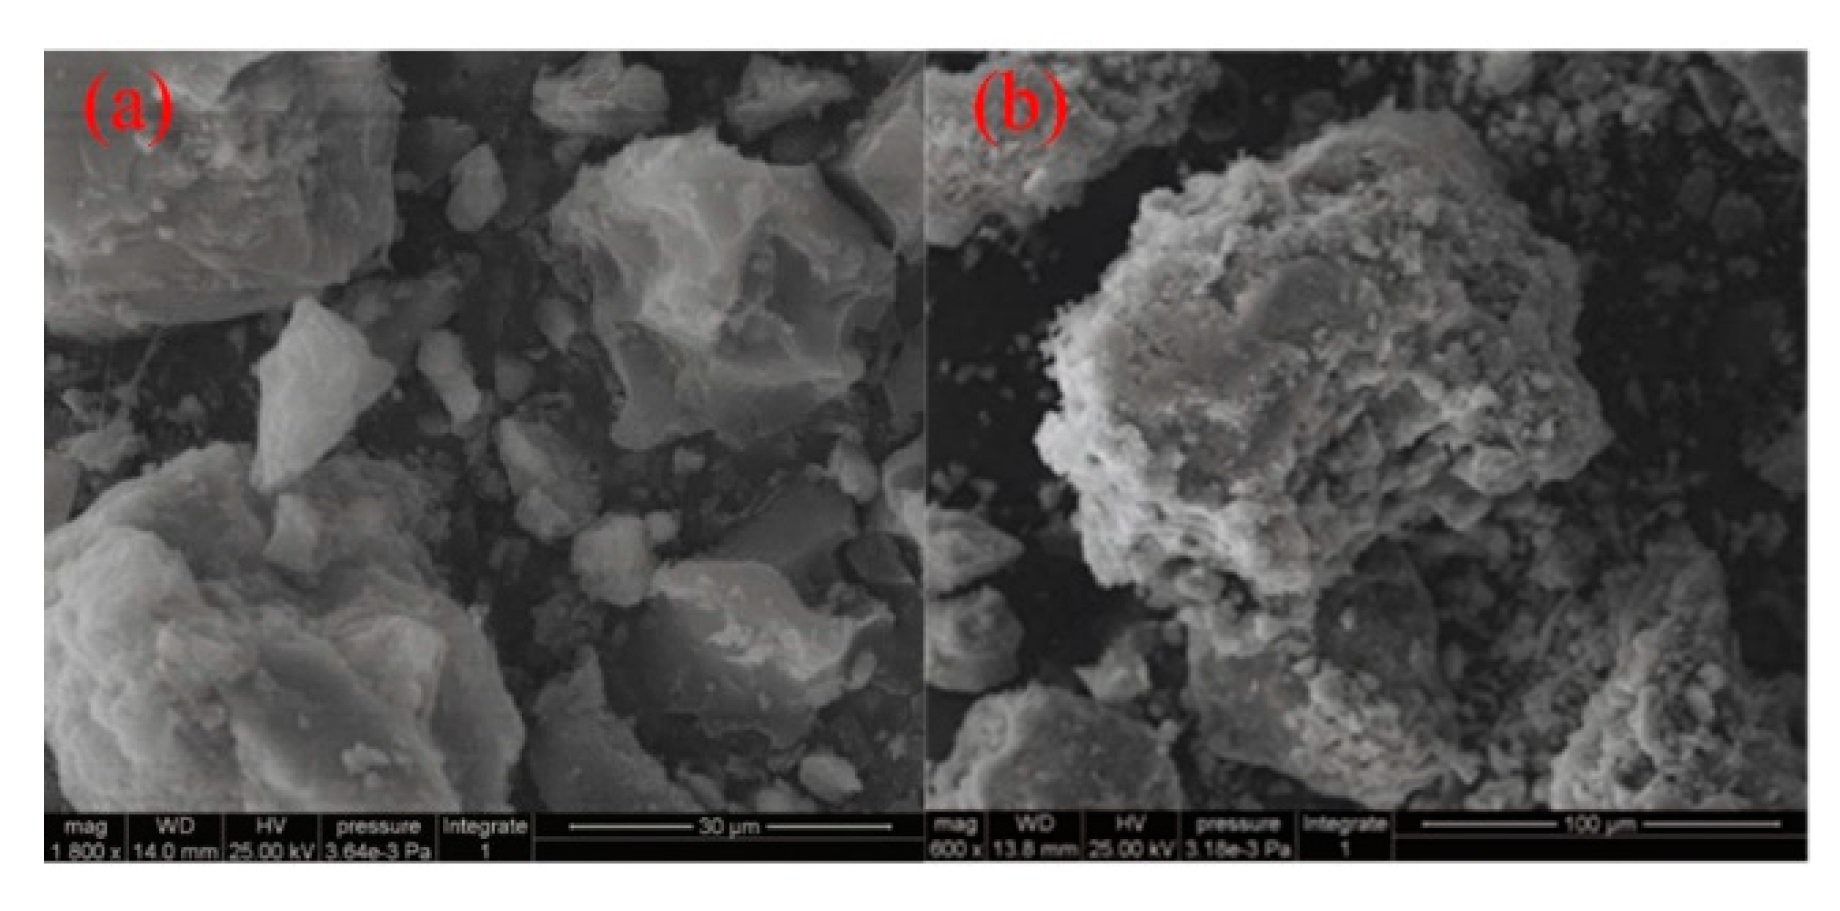
SEM analysis results of the SAC and SBAC samples are shown in Figure 2. Unlike the flaky and massive particles on the surface of the SAC, the SBAC exhibited a more irregular and looser surface morphology. These surface features might provide sufficient diffusion spaces for contaminants in the coking wastewater.
3.1.3. FTIR Analysis
It is well known that the adsorption performance of AC is strongly affected by functional groups such as carboxyl, carbonyl, phenolic hydroxyl, and lactones on the surface [30,31]. FTIR spectra of the SAC and SBAC samples are shown in Figure 3. The broad absorption band in the range of 3300–3600 cm−1 is ascribed to the O-H stretching vibrations, which correspond to associated peaks of hydroxyl groups from phenols and alcohols [19]. The distinctive peak observed at 1624 cm−1 can be attributed to the C=O and C=C vibration of carbonyl in carboxylic or ester groups [32]. The absorption peak at 1383 cm−1 seems to be due to the lactone groups [33]. The relatively intense band at 1042 cm−1 can be attributable to alcohol groups (C-OH) [32]. In addition, the peaks at 465 cm−1 represented the C-H stretching vibration [33]. In this study, the addition of BW led to an increase of oxygen-containing functional groups (C-OH, O-H, and C=O), which might contribute to the adsorption of total cyanide.
3.2. Adsorption Performances of SBAC
3.2.1. Effect of Initial pH
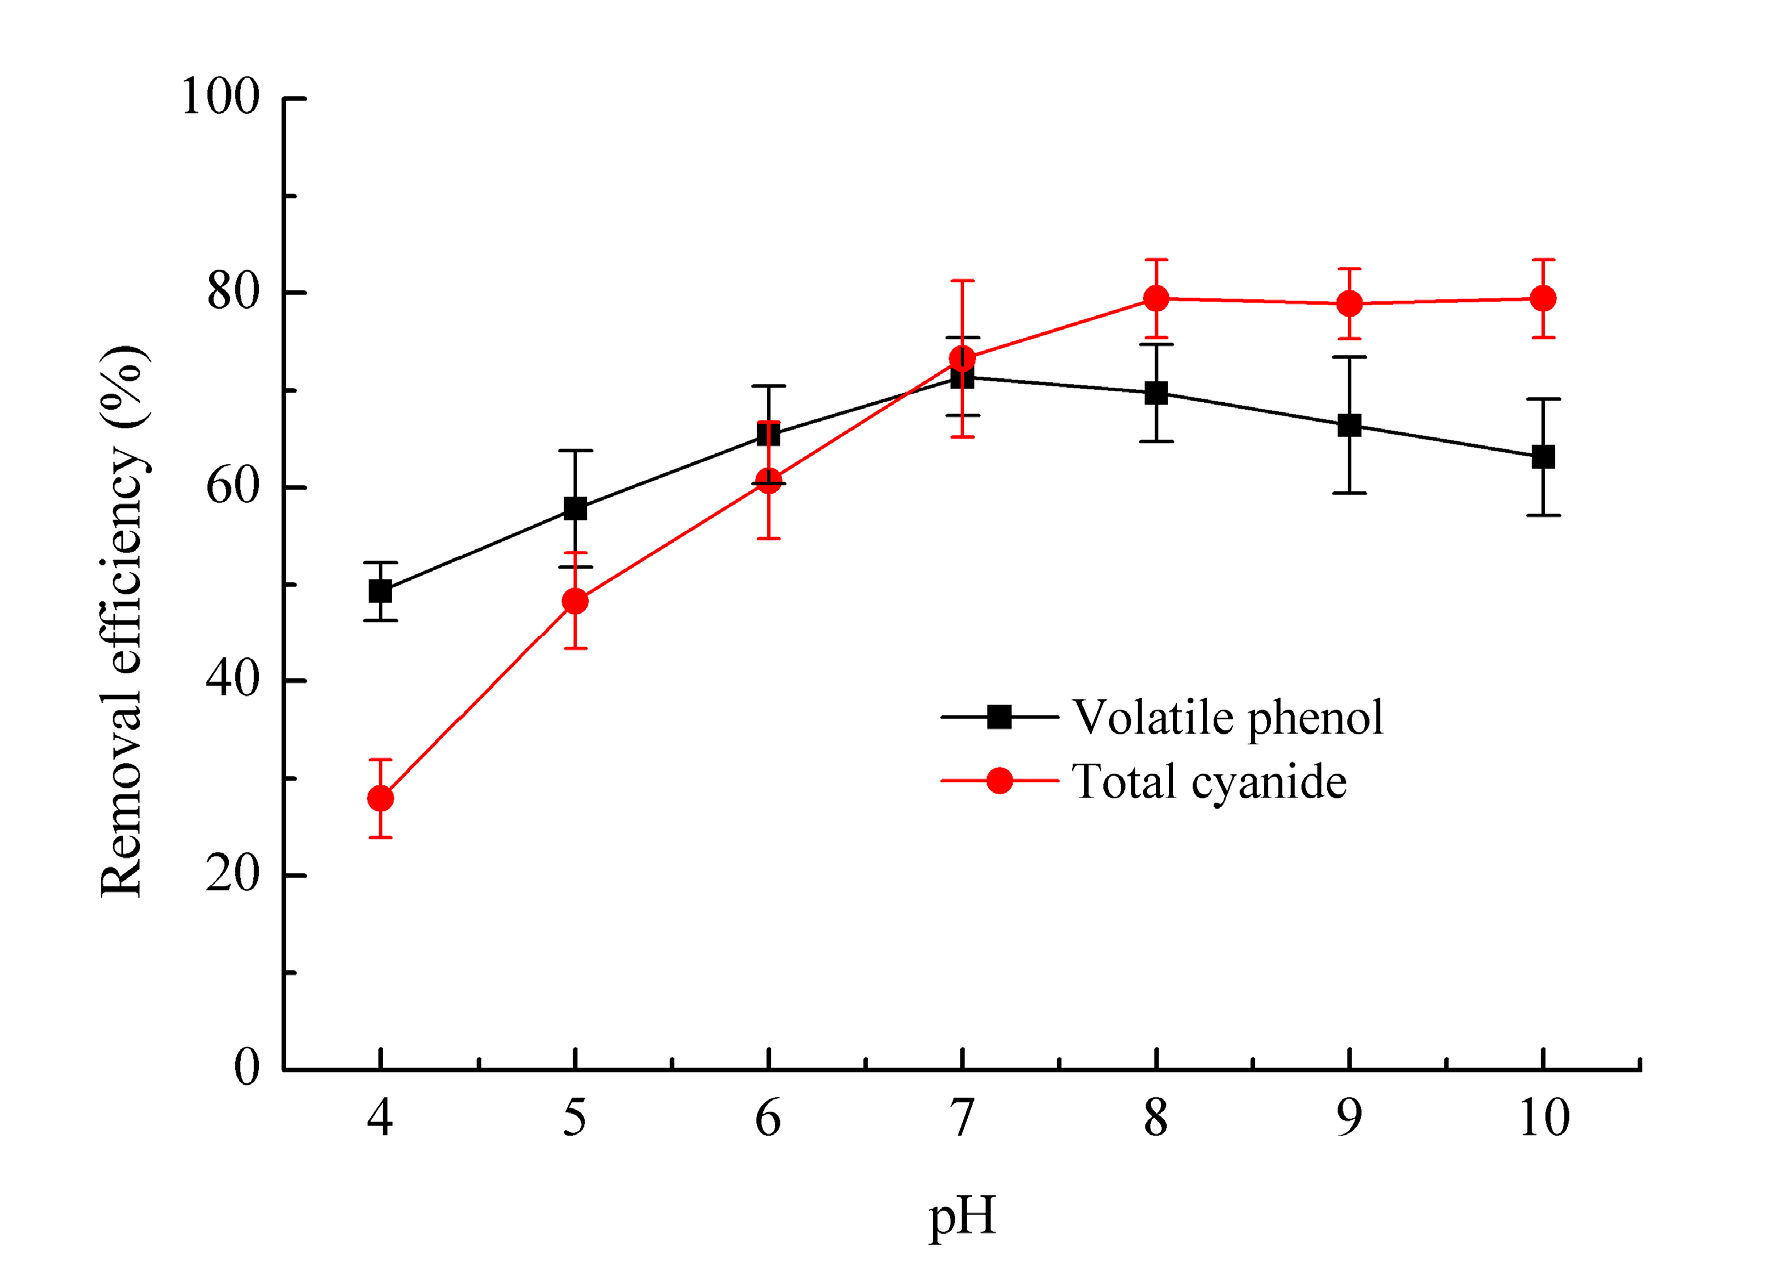
The effect of initial pH on the removal efficiencies of volatile phenol and total cyanide in coking wastewater was assessed at a SBAC dosage of 8 g/L and a contact time of 80 min. As shown in Figure 4, the removal efficiencies of volatile phenol increased at first and then decreased with the increase of pH, and the maximal removal efficiency (71.3%) was observed at pH 7.0. On the other hand, as the pH increased from 4.0 to 8.0, the removal efficiencies of total cyanide increased rapidly from 27.9% to 80.1%, and then maintained relative stability. Based on the above results, the optimal pH was determined to be 8.0 for simultaneous removal of volatile phenol and total cyanide in coking wastewater.
The adsorption of AC on phenol and cyanide may not only be related to the pore structure, but also affected by the types of functional groups and the chemical nature of absorbate. Changes in the pH might alter the electron-withdrawing effect of oxygen-containing functional groups on the surface of SBAC, thereby changing the π–π interaction between the pollutant molecules [34]. In addition, under strong alkaline conditions, the enhanced competition of ammonia nitrogen with phenols and cyanide might be another cause of the decrease in removal efficiency.
3.2.2. Effect of Contact Time
The effect of contact time on the removal efficiencies of volatile phenol and total cyanide in coking wastewater was investigated at a SBAC dosage of 8 g/L, a pH of 8.0, and a temperature of 25 °C. It can be seen from Figure 5 that in the first 60 min, the removal efficiencies of volatile phenol and total cyanide increased significantly, and remained relatively stable after 80 min. The maximal removal efficiencies of volatile phenol and total cyanide reached 69.7% and 80.1%, respectively. This might be owing to the fact that there were more available active sites on the surface of SBAC in the initial stage of adsorption, and, simultaneously, a higher concentration gradient between wastewater and SBAC was more conducive to the mass transfer of phenol and cyanide to SBAC [12]. However, with the passage of time, the vacant sites and active functional groups on the SBAC reached saturation, leading to the termination of phenol and cyanide adsorption [34].
3.2.3. Effect of SBAC Dosage
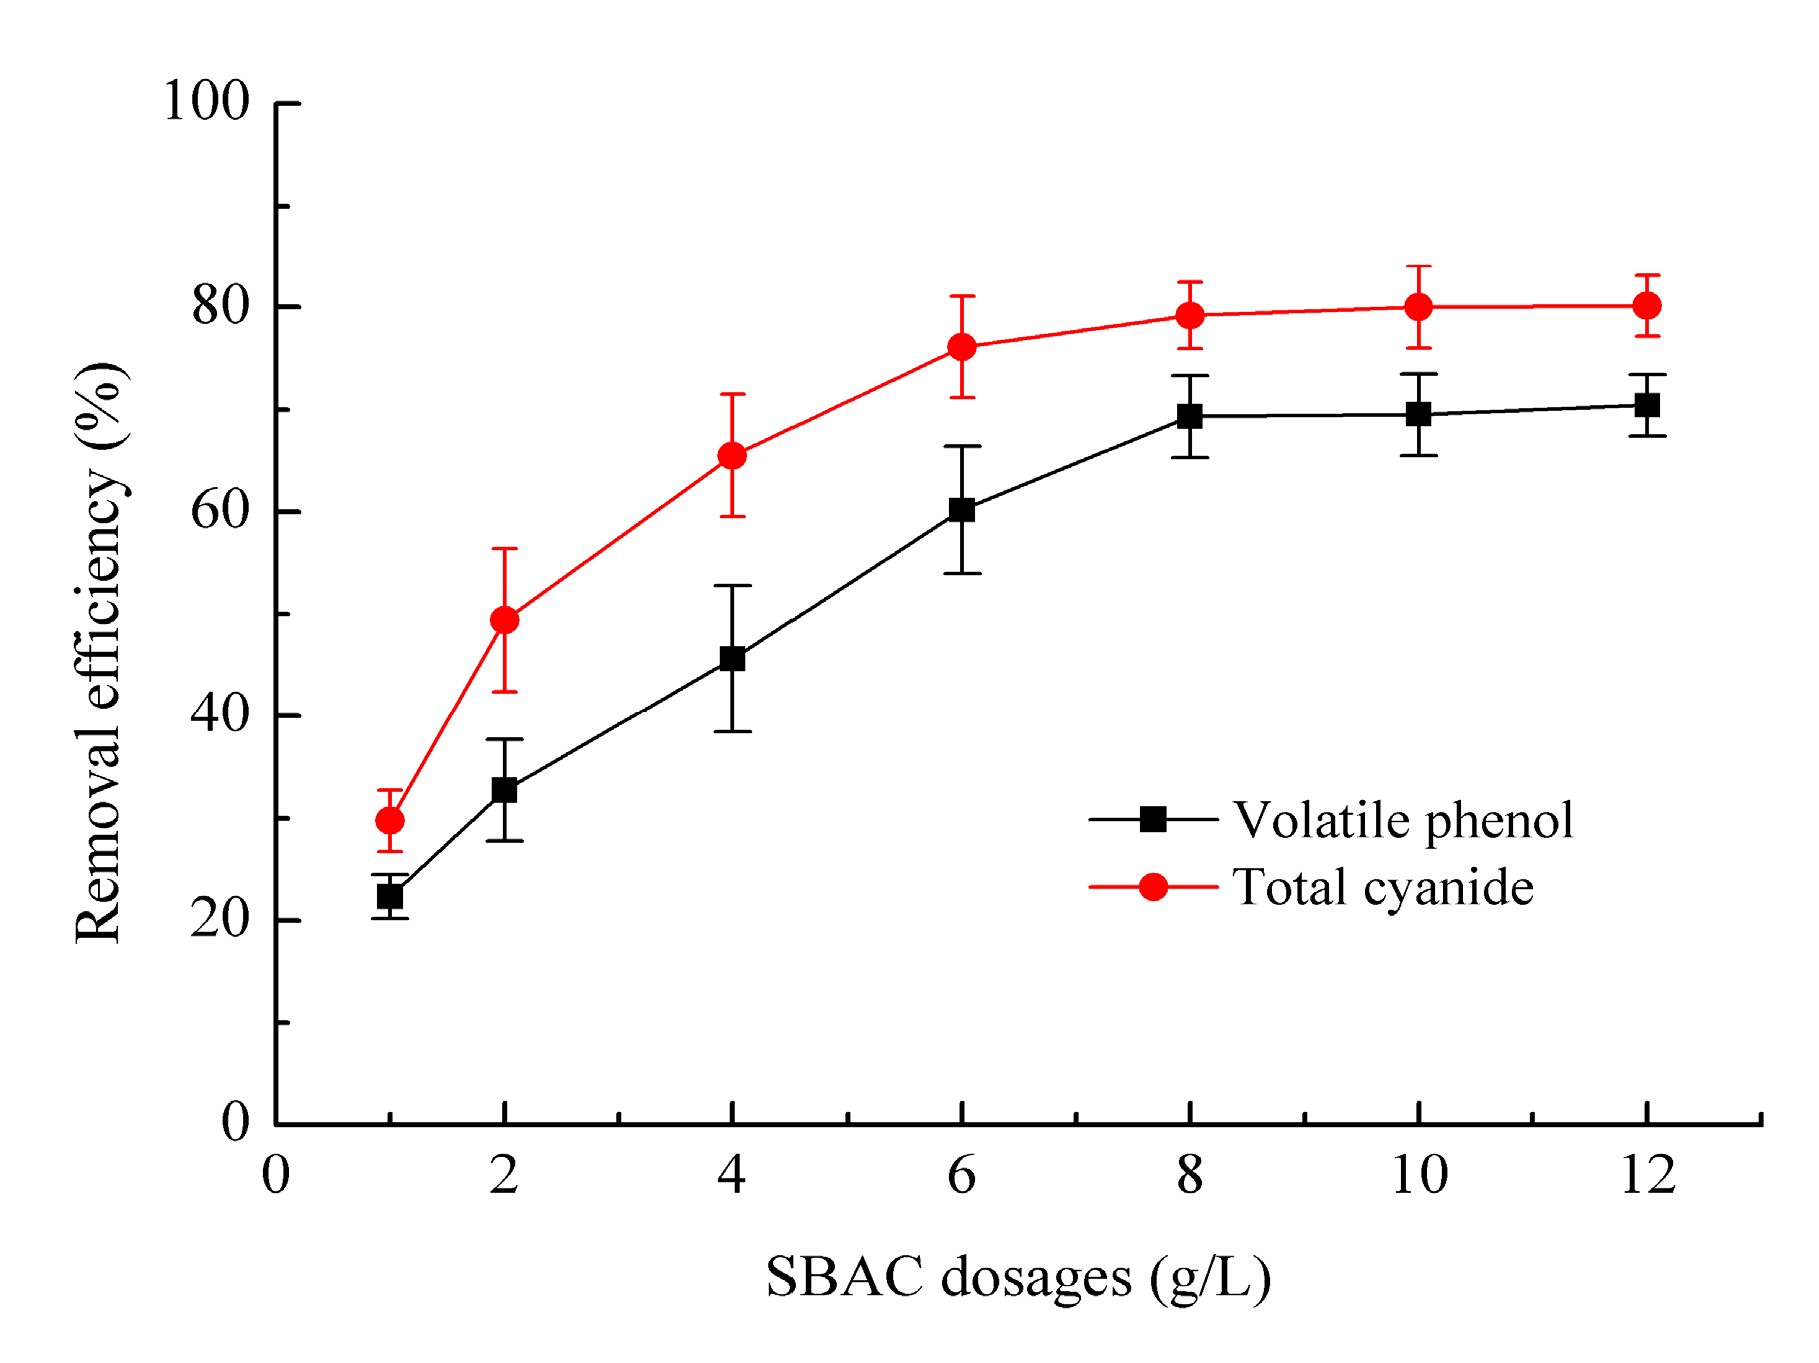
The effect of SBAC dosages (1–12 g/L) on the volatile phenol and total cyanide removal in coking wastewater was evaluated at a contact time of 80 min, a pH of 8.0, and a temperature of 25 °C. The result is shown in Figure 6. It can be seen that the removal efficiencies of volatile phenol and total cyanide increased gradually to 69.7% and 80.1%, respectively, with SBAC dosage increasing from 1 to 8 g/L. This phenomenon can be explained as follows: with the increase of SBAC dosage, the provided adsorption surface area and active sites were enhanced [35]. However, no significant changes in volatile phenol and total cyanide were observed when the SBAC dosage exceeded 8 g/L, probably due to the fact that at high SBAC dosage the overlap of some active sites not only reduced the surface area for adsorption, but also decreased the odds of point contacts between SBAC and contaminants [15]. It was also found that the SBAC dosage in this study was higher than other adsorption studies of only phenol or cyanide, which might be attributed to the competitive adsorption of other pollutants in the coking wastewater.
3.3. Kinetics of Volatile Phenol and Total Cyanide
In this study, pseudo-first-order [36] and pseudo-second-order kinetic models [37] were used for the experimental data to evaluate the adsorption mechanism of volatile phenol or total cyanide onto the SBAC. The linear form of pseudo-first and pseudo-second order kinetic models are shown as Equations (3) and (4), respectively.
where is the adsorption amount (mg/g) of volatile phenol or total cyanide at time (min), and the and are the rate constants of the pseudo-first-order (1/min) and pseudo-second-order adsorption (g/(mg·min)), respectively.
The average relative error () between the experimental data () and calculated values () was used to validate the goodness of fit of the kinetic models [15]. ARE is calculated according to Equation (5):
where is the number of observations in the kinetic experiment, and is the number of parameters in the regression model. The smaller ARE values indicate more accurate estimation of [15].
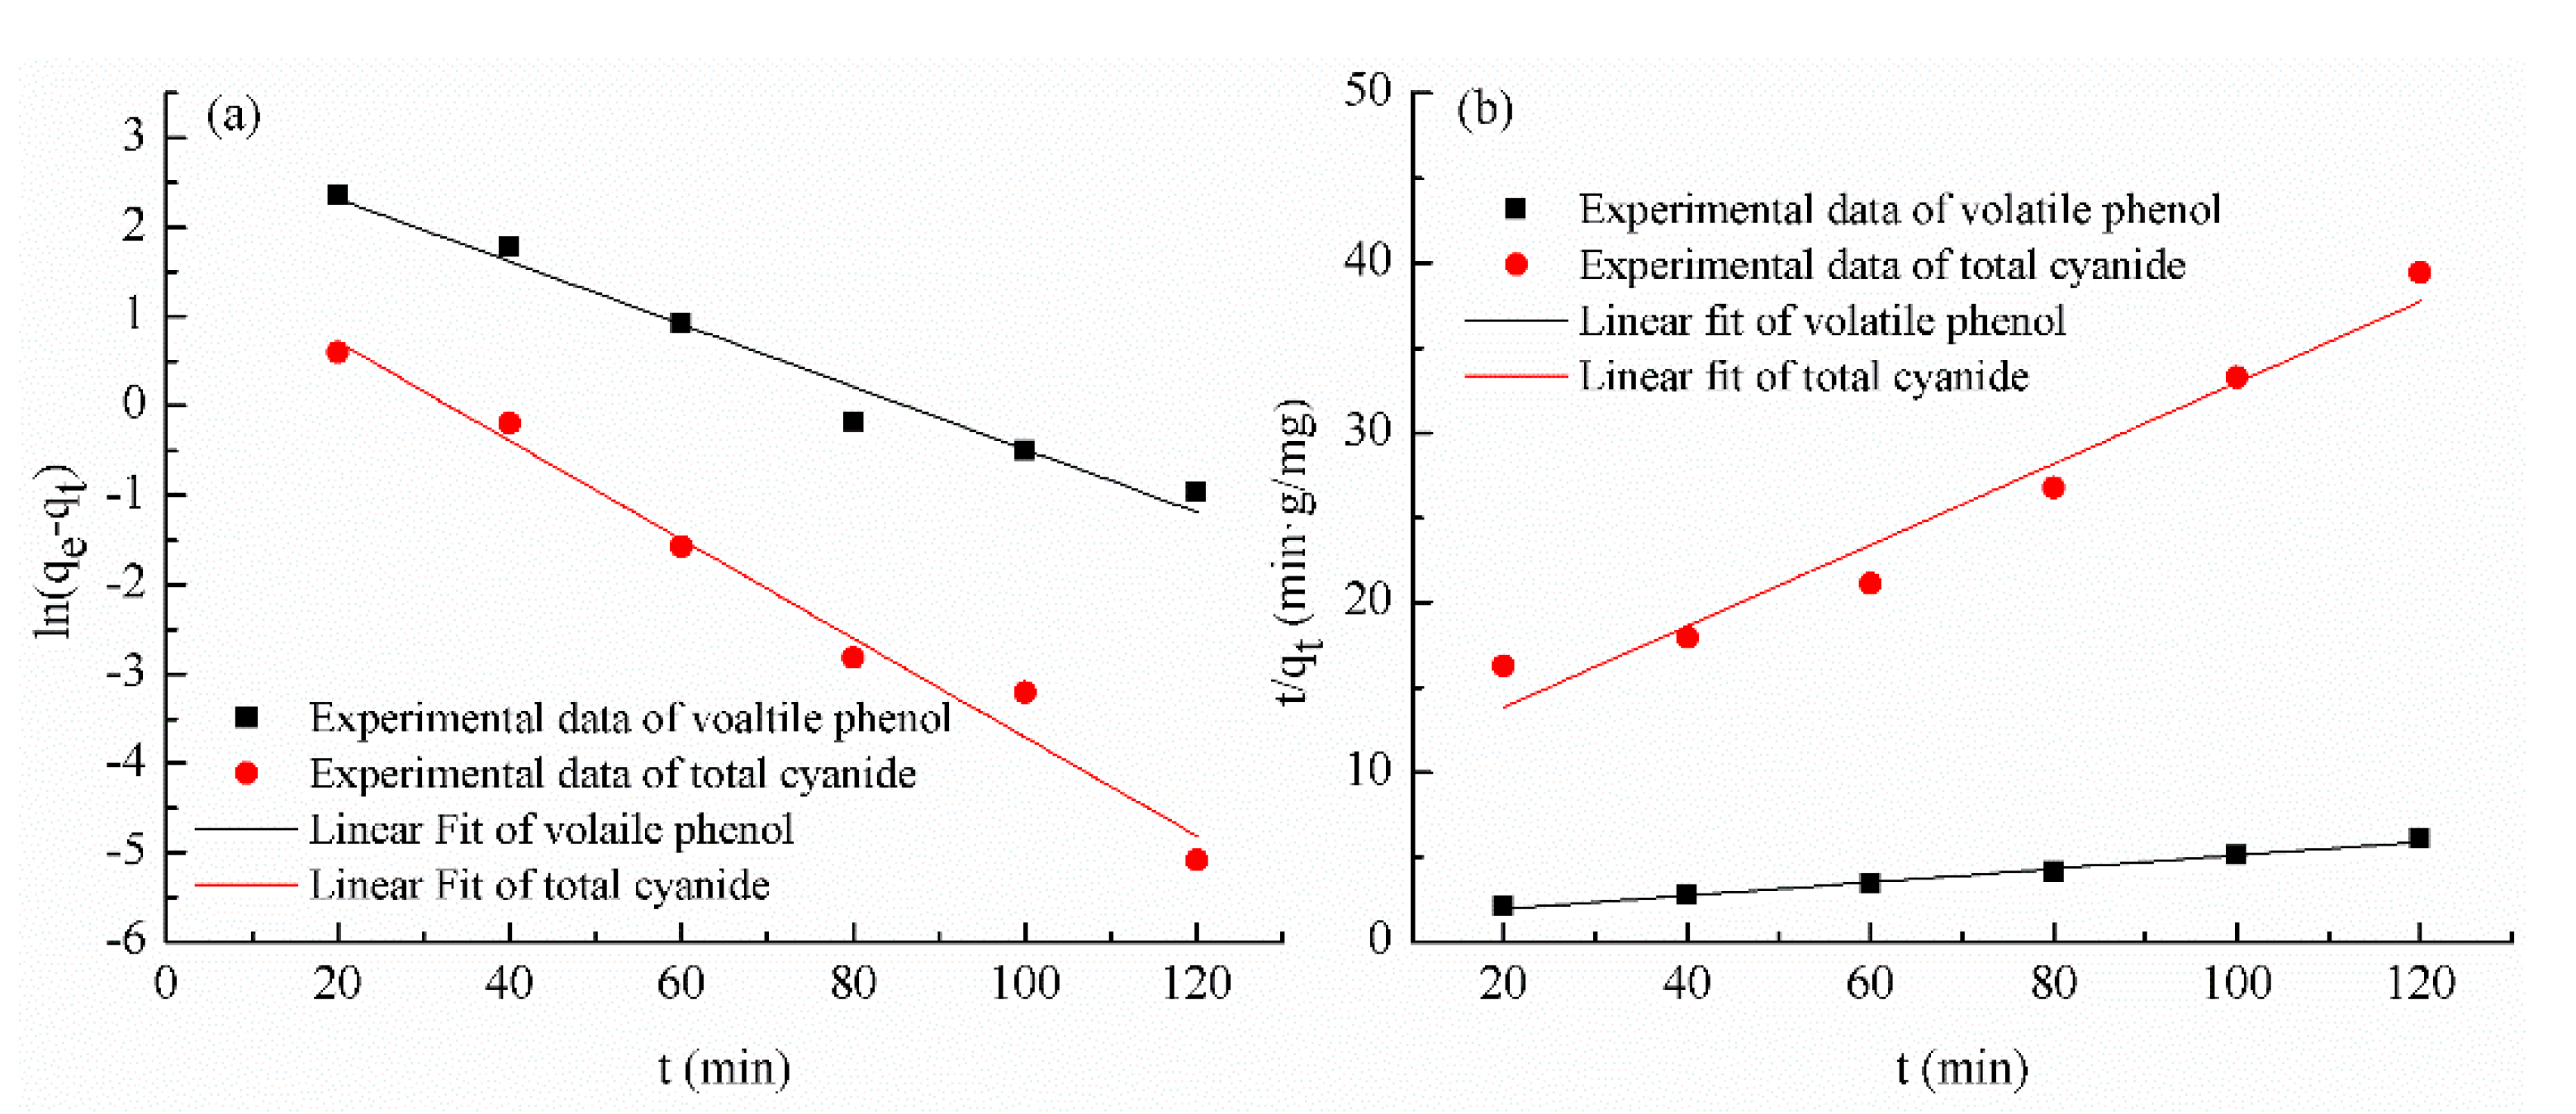
The linear form of the pseudo-first-order and pseudo-second-order kinetic models for volatile phenol and total cyanide on the SBAC is presented in Figure 7 and Table 4. For the volatile phenol adsorption, both pseudo-first-order and pseudo-second-order kinetic models fitted well with experimental data, and the corresponding correlation coefficients () were 0.974 and 0.991, respectively. However, the calculated values () obtained from the pseudo-first-order model (20.46 mg/g) were closer to the experimental value (20.02 mg/g) than the value determined by the pseudo-second-order model (25.38 mg/g). This indicated that the pseudo-first-order equation might be more suitable for describing the mechanism of phenol–SBAC interactions. For the total cyanide adsorption, the R2 of pseudo-first-order was higher than that of pseudo-second-order, but the value determined from the pseudo-second-order model was more consistent with the experimental value. Therefore, it is proposed that the pseudo-second-order kinetic model should be used to describe the adsorption of cyanides onto SBAC, which is in line with a previous study [34].
3.4. Cost Analysis
In this section, the cost of production per kilogram SBAC is roughly calculated based on raw material fees, reagent fees, water fees, and electricity fees. The one-time investment costs, depreciation costs, freight costs, and labor costs were not included. The industrial water and electricity costs, as well as sludge treatment compensation, were calculated according to the standard in Nanjing, China. The calculation results are described in Table 5. It can be seen that the cost per kilogram of SBAC production was about 0.840 USD, which is cheaper than commercial AC (2.0–2.2 USD/kg) [38]. According to gross cost estimate from previous literature, the cost of sludge-based adsorbents (0.1–0.2 USD/kg) is only 5–10% of commercial AC [39]. In this study, the data used for cost analysis are derived from laboratory studies, and the costs of SBAC production are expected to be reduced through large-scale production.
4. Conclusions
When SBAC was applied as absorbent for coking wastewater treatment, volatile phenol and total cyanide were rapidly adsorbed. For the highest removal efficiencies of volatile phenol (69.7%) and total cyanide (80.1%) in the coking wastewater, the optimized SBAC dosage was 8 g/L, the pH was 8.0, and the contact time was 80 min. Due to the addition of BW, a high surface area (289.578 m2/g) with the presence of a rich mesoporous structure might be the main reason for the adsorption of volatile phenol and total cyanide over the SBAC. Simultaneously, the increase of oxygen-containing functional groups (-OH, C=O) on the surface of SBAC might be more conducive to driving the chemisorption process of cyanide. In addition, the kinetic model of pseudo-first-order fitted well to the experimental data of volatile phenol, while the adsorption of total cyanide onto SBAC should be described by the pseudo-second-order kinetic model. The cost analysis based on experimental data indicated that the SBAC was more economical than commercial AC, and its production cost might be further reduced by mass production.
Author Contributions
Conceptualization: Y.L.; validation: Y.H. and H.C.; investigation: Y.H. and H.C.; data curation: H.C.; writing—original draft preparation: Y.L.; writing—review and editing: Y.L. All authors have read and agreed to the published version of the manuscript.
Funding
This work was financially supported by the Nanjing Forestry University Youth Innovation Fund (CX2017025), the National Natural Science Foundation of China (No. 51608272), and the Undergraduate Practical Innovation Training Program Project (2019NFUSPITP0487).
Conflicts of Interest
The authors declare no conflict of interest.
References
- Wei, C.; Wu, H.; Kong, Q.; Wei, J.; Feng, C.; Qiu, G.; Wei, C.; Li, F. Residual chemical oxygen demand (COD) fractionation in bio-treated coking wastewater integrating solution property characterization. J. Environ. Manag. 2019, 246, 324–333. [Google Scholar] [CrossRef]
- Zhang, Y.; Wei, C.; Yan, B. Emission characteristics and associated health risk assessment of volatile organic compounds from a typical coking wastewater treatment plant. Sci. Total Environ. 2019, 693, 133417–133427. [Google Scholar] [CrossRef] [PubMed]
- Martinkova, L.; Chmatal, M. The integration of cyanide hydratase and tyrosinase catalysts enables effective degradation of cyanide and phenol in coking wastewaters. Water Res. 2016, 102, 90–95. [Google Scholar] [CrossRef] [PubMed]
- Razaviarani, V.; Zazo, J.A.; Casas, J.A.; Jaffe, P.R. Coupled fenton-denitrification process for the removal of organic matter and total nitrogen from coke plant wastewater. Chemosphere 2019, 224, 653–657. [Google Scholar] [CrossRef] [PubMed]
- Ren, G.; Zhou, M.; Zhang, Q.; Xu, X.; Li, Y.; Su, P.; Paidar, M.; Bouzek, K. Cost-efficient improvement of coking wastewater biodegradability by multi-stages flow through peroxi-coagulation under low current load. Water Res. 2019, 154, 336–348. [Google Scholar] [CrossRef]
- Sun, G.; Wan, J.; Sun, Y.; Li, H.; Chang, C.; Wang, Y. Enhanced removal of nitrate and refractory organic pollutants from bio-treated coking wastewater using corncobs as carbon sources and biofilm carriers. Chemosphere 2019, 237, 124520. [Google Scholar] [CrossRef] [PubMed]
- Kumar, R.; Pal, P. A novel forward osmosis-nano filtration integrated system for coke-oven wastewater reclamation. Chem. Eng. Res. Des. 2015, 100, 542–553. [Google Scholar] [CrossRef]
- Xie, R.; Wu, M.; Qu, G.; Ning, P.; Cai, Y.; Lv, P. Treatment of coking wastewater by a novel electric assisted micro-electrolysis filter. J. Environ. Sci. China 2018, 66, 165–172. [Google Scholar] [CrossRef]
- Zhou, X.; Hou, Z.; Lv, L.; Song, J.; Yin, Z. Electro-Fenton with peroxi-coagulation as a feasible pre-treatment for high-strength refractory coke plant wastewater: Parameters optimization, removal behavior and kinetics analysis. Chemosphere 2020, 238, 124649. [Google Scholar] [CrossRef]
- Pueyo, N.; Miguel, N.; Ovelleiro, J.L.; Ormad, M.P. Limitations of the removal of cyanide from coking wastewater by ozonation and by the hydrogen peroxide-ozone process. Water Sci. Technol. 2016, 74, 482–490. [Google Scholar] [CrossRef]
- Zhou, H.; Wei, C.; Zhang, F.; Hu, Y.; Wu, H.; Kraslawski, A. A comprehensive evaluation method for sludge pyrolysis and adsorption process in the treatment of coking wastewater. J. Environ. Manag. 2019, 235, 423–431. [Google Scholar] [CrossRef] [PubMed]
- Devi, P.; Saroha, A.K. Utilization of sludge based adsorbents for the removal of various pollutants: A review. Sci. Total Environ. 2017, 578, 16–33. [Google Scholar] [CrossRef] [PubMed]
- Jing, Z.; Peng, Y.; He, R.; Xu, Y.; Yu, T.; Hu, J. Poplar leaves reclamation for porous granules and their application in nitrobenzene removal from aqueous solution. Desalin. Water Treat. 2016, 57, 449–458. [Google Scholar] [CrossRef]
- Wang, Z. Efficient adsorption of dibutyl phthalate from aqueous solution by activated carbon developed from phoenix leaves. Int. J. Environ. Sci. Technol. 2015, 12, 1923–1932. [Google Scholar] [CrossRef] [Green Version]
- Singh, N.; Balomajumder, C. Simultaneous removal of phenol and cyanide from aqueous solutionby adsorption onto surface modified activated carbon prepared fromcoconut shell. J. Water Process Eng. 2016, 9, 233–245. [Google Scholar] [CrossRef]
- Liu, Y.; Kang, X.; Li, X.; Wang, Z.; Jing, Z. Performance and mechanism of sludge dewaterability enhanced by potassium ferrate pretreatment and calcium chloride addition. J. Water Reuse Desalin. 2017, 7, 136–141. [Google Scholar] [CrossRef] [Green Version]
- Liu, G.; Lin, S.; Pile, L.S.; Fang, Z.; Wang, G.G. Effect of potassium permanganate and pyrolysis temperature on the biochar production from rice straw and suitability of biochars for heavy metal (Cd & Pb) immobilizaiton in paper sludge. Fresenius Environ. Bull. 2018, 27, 9008–9018. [Google Scholar]
- Silva, T.L.; Cazetta, A.L.; Souza, P.S.C.; Zhang, T.; Asefa, T.; Almeida, V.C. Mesoporous activated carbon fibers synthesized from denim fabric waste: Efficient adsorbents for removal of textile dye from aqueous solutions. J. Clean. Prod. 2018, 171, 482–490. [Google Scholar] [CrossRef]
- Anisuzzaman, S.M.; Joseph, C.G.; Krishnaiah, D.; Bono, A.; Suali, E.; Abang, S.; Fai, L.M. Removal of chlorinated phenol from aqueous media by guava seed (Psidium guajava) tailored activated carbon. Water Resour. Ind. 2016, 16, 29–36. [Google Scholar] [CrossRef] [Green Version]
- Castro, C.S.; Abreu, A.L.; Silva, C.L.T.; Guerreiro, M.C. Phenol adsorption by activated carbon produced from spent coffee grounds. Water Sci. Technol. 2011, 64, 2059–2065. [Google Scholar] [CrossRef]
- Jin, J.; Wang, M.; Cao, Y.; Wu, S.; Liang, P.; Li, Y.; Zhang, J.; Zhang, J.; Wong, M.H.; Shan, S.; et al. Cumulative effects of bamboo sawdust addition on pyrolysis of sewage sludge: Biochar properties and environmental risk from metals. Bioresour. Technol. 2017, 228, 218–226. [Google Scholar] [CrossRef] [PubMed]
- Tao, X.; Lou, L.; Luo, L.; Cao, R.; Duan, D.; Chen, Y. Effect of bamboo biochar on pentachlorophenol leachability and bioavailability in agricultural soil. Sci. Total Environ. 2012, 414, 727–731. [Google Scholar]
- Al-Wabel, M.I.; Al-Omran, A.; El-Naggar, A.H.; Nadeem, M.; Usman, A.R.A. Pyrolysis temperature induced changes in characteristics and chemical composition of biochar produced from conocarpus wastes. Bioresour. Technol. 2013, 131, 374–379. [Google Scholar] [CrossRef] [PubMed]
- Mu’azu, N.D.; Jarrah, N.; Zubair, M.; Alagha, O. Removal of Phenolic Compounds from Water Using Sewage Sludge-Based Activated Carbon Adsorption: A Review. Int. J. Environ. Res. Public Health 2017, 14, 1094. [Google Scholar] [CrossRef] [PubMed] [Green Version]
- Schneider, P. Adsorption isotherms of microporous-mesoporous solids revisited. Appl. Catal. A Gen. 1995, 129, 157–165. [Google Scholar] [CrossRef]
- Barrett, E.P.; Joyner, L.G.; Halenda, P.P. The determination of pore volume and area distributions in porous substances. J. Am. Chem. Soc. 1951, 73, 373–380. [Google Scholar] [CrossRef]
- Liu, Q.S.; Zheng, T.; Wang, P.; Jiang, J.P.; Li, N. Adsorption isotherm, kinetic and mechanism studies of some substituted phenols on activated carbon fibers. Chem. Eng. J. 2010, 157, 348–356. [Google Scholar] [CrossRef]
- Xi, X.; Guo, X. Preparation of bio-charcoal from sewage sludge and its performance on removal of Cr (VI) from aqueous solutions. J. Mol. Liq. 2013, 183, 26–30. [Google Scholar] [CrossRef]
- APHA. Standard Methods for the Examination of Water and Wastewater, 20th ed.; American Public Health Association: Washington, DC, USA, 2001. [Google Scholar]
- Zhang, D.; Huo, P.; Liu, W. Behavior of phenol adsorption on thermal modified activated carbon. Chin. J. Chem. Eng. 2016, 24, 446–452. [Google Scholar] [CrossRef]
- Salame, I.I.; Bandosz, T.J. Role of surface chemistry in adsorption of phenol on activated carbons. J. Colloid Interface Sci. 2003, 264, 307–312. [Google Scholar] [CrossRef]
- Gokce, Y.; Aktas, Z. Nitric acid modification of activated carbon produced from waste tea and adsorption of methylene blue and phenol. Appl. Surf. Sci. 2014, 313, 352–359. [Google Scholar] [CrossRef]
- Álvarez-Torrellas, S.; Martin-Martinez, M.; Gomes, H.T.; Ovejero, G.; García, J. Enhancement of p-nitrophenol adsorption capacity through N2-thermal-based treatment of activated carbons. Appl. Surf. Sci. 2017, 414, 424–434. [Google Scholar] [CrossRef] [Green Version]
- Agarwal, B.; Balomajumder, C.; Thakur, P.K. Simultaneous co-adsorptive removal of phenol and cyanide from binary solution using granular activated carbon. Chem. Eng. J. 2013, 228, 655–664. [Google Scholar] [CrossRef]
- Feng, J.; Qiao, K.; Pei, L.; Lv, J.; Xie, S. Using activated carbon prepared from Typha orientails Presl to remove phenol from aqueous solutions. Ecol. Eng. 2015, 84, 209–217. [Google Scholar] [CrossRef]
- Lagergren, S. About the theory of so-called adsorption of soluble substances. K. Sven. Vetensk. Handl. 1898, 24, 1–39. [Google Scholar]
- Ho, Y.S.; McKay, G. Pseudo-second order model for sorption processes. Process Biochem. 1999, 34, 451–465. [Google Scholar] [CrossRef]
- Ahmaruzzaman, M. Industrial wastes as low-cost potential adsorbents for the treatment of wastewater laden with heavy metals. Adv. Colloid Interface Sci. 2011, 166, 36–59. [Google Scholar] [CrossRef]
- Xu, G.; Yang, X.; Spinosa, L. Development of sludge-based adsorbents: Preparation, characterization, utilization and its feasibility assessment. J. Environ. Manag. 2015, 151, 221–232. [Google Scholar] [CrossRef]
Figure 1.
N2 adsorption–desorption isotherm of (a) SAC and (b) SBAC.

Figure 2.
SEM images of (a) SAC and (b) SBAC.

Figure 3.
FTIR of SAC and SBAC samples.
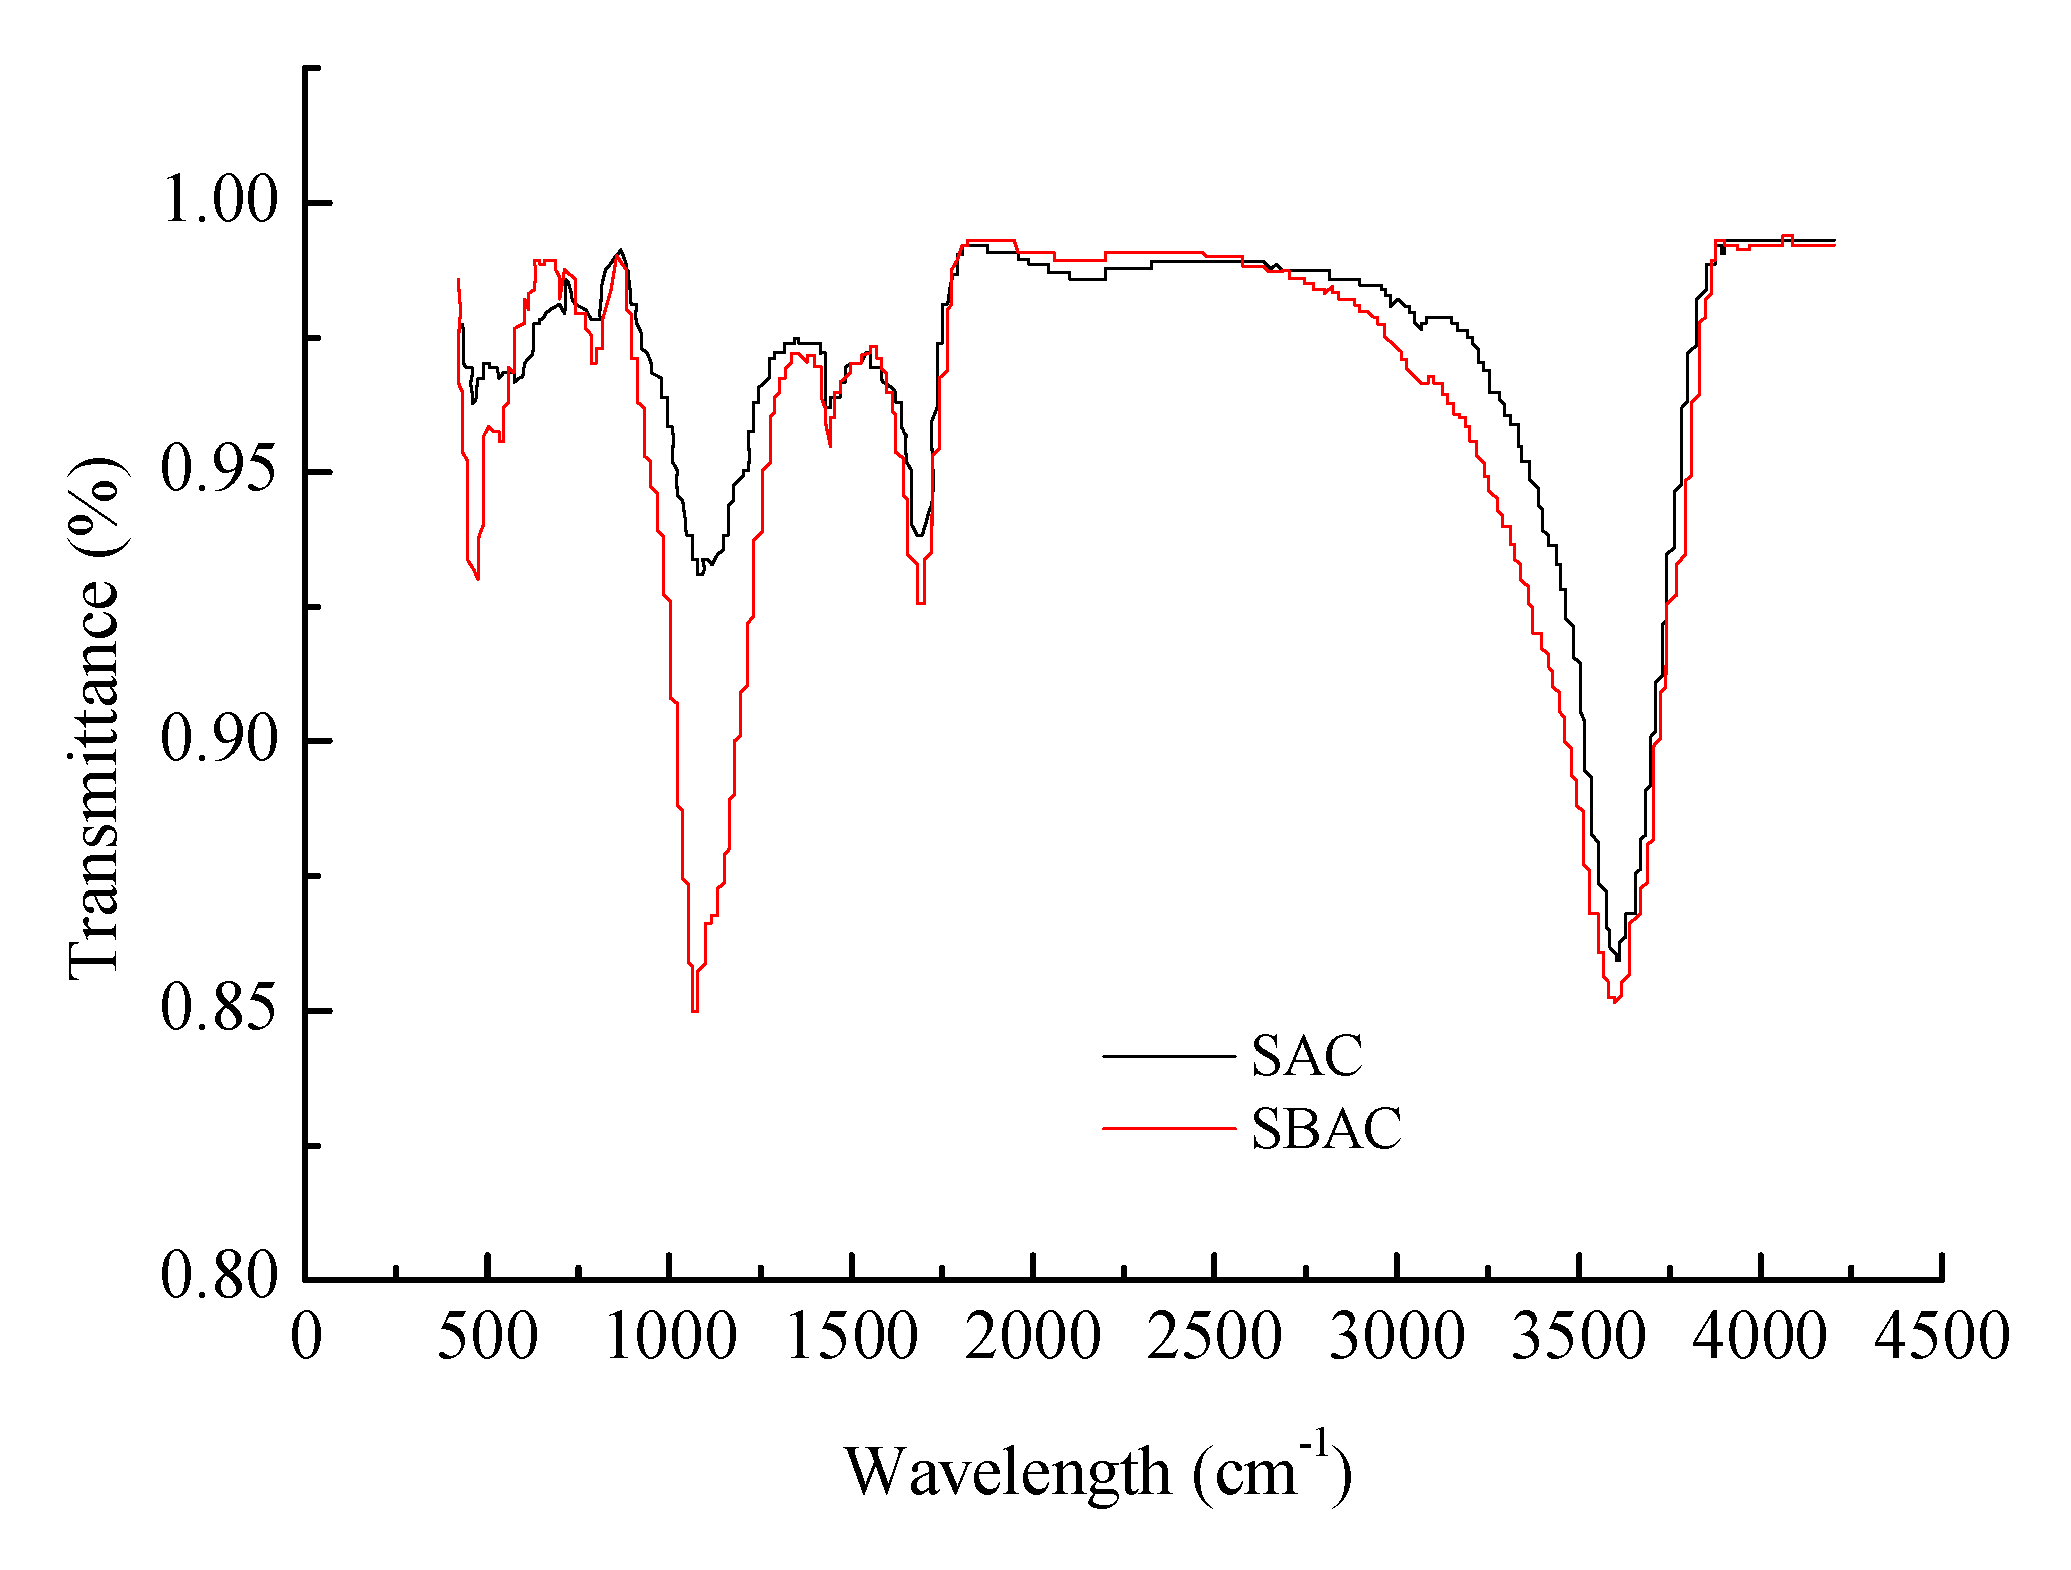
Figure 4.
Effects of initial pH on the removal efficiencies of volatile phenol and total cyanide. Error bars represent the range of data from duplicate experiments.
Figure 4.
Effects of initial pH on the removal efficiencies of volatile phenol and total cyanide. Error bars represent the range of data from duplicate experiments.

Figure 5.
Effects of contact time on the removal efficiencies of volatile phenol and total cyanide. Error bars represent the range of data from duplicate experiments.
Figure 5.
Effects of contact time on the removal efficiencies of volatile phenol and total cyanide. Error bars represent the range of data from duplicate experiments.
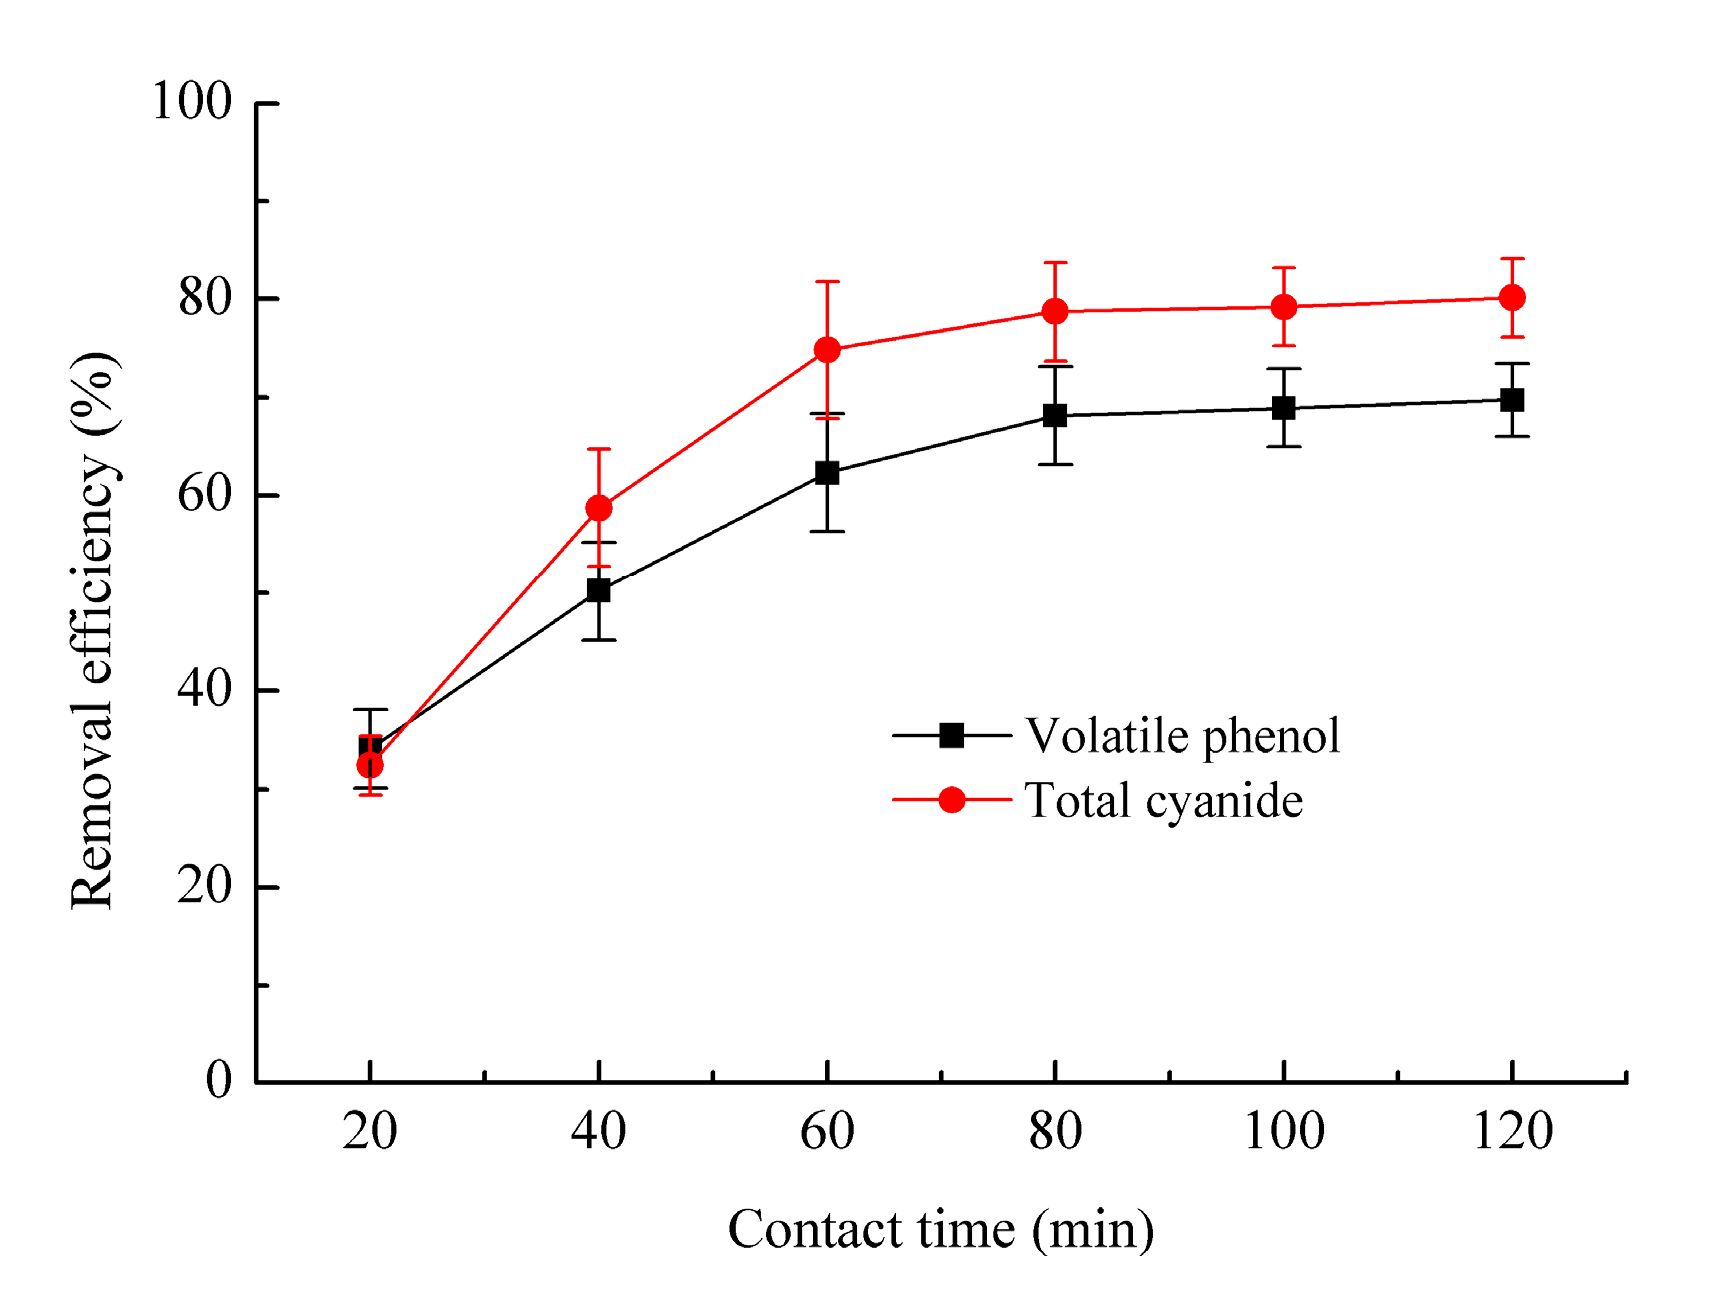
Figure 6.
Effects of SBAC dosages on the removal efficiencies of volatile phenol and total cyanide. Error bars represent the range of data from duplicate experiments.
Figure 6.
Effects of SBAC dosages on the removal efficiencies of volatile phenol and total cyanide. Error bars represent the range of data from duplicate experiments.

Figure 7.
(a) Pseudo-first-order and (b) pseudo-second-order adsorption kinetics for volatile phenol and total cyanide adsorption onto SBAC.
Figure 7.
(a) Pseudo-first-order and (b) pseudo-second-order adsorption kinetics for volatile phenol and total cyanide adsorption onto SBAC.

Table 1.
Characteristics of municipal sludge (MS) and bamboo waste (BW).
| Parameters | Volatile Solids (VS) (dw %) | Ash (dw %) | Water Content (ww %) | C (dw %) | H (dw %) | N (dw %) |
|---|---|---|---|---|---|---|
| MS | 62.01 | 37.99 | 78.86 | 26.5 | 6.24 | 4.08 |
| BW | 98.64 | 1.36 | 9.94 | 48.5 | 3.35 | 0.75 |
dw: dry weight. ww: wet weight.
Table 2.
Characteristics of coking wastewater.
| Parameters | Coking Wastewater |
|---|---|
| Chemical oxygen demand (COD) (mg/L) | 2457.6 ± 125.4 |
| Ammonia nitrogen (mg/L) | 316.3 ± 24.2 |
| Total cyanide (mg/L) | 35.4 ± 1.5 |
| Volatile phenol (mg/L) | 227.5 ± 7.6 |
| Suspended solids (SS) (mg/L) | 76.9 ± 6.5 |
| pH | 8.1 ± 0.8 |
Table 3.
Characteristics of porous structure of SAC and SBAC.
| Samples | SBET (m2/g) | Micropore Surface Area (m2/g) | VT (cm3/g) | Vmic (cm3/g) | Dp (nm) |
|---|---|---|---|---|---|
| SAC | 70.921 | 18.568 | 0.194 | 0.016 | 10.941 |
| SBAC | 289.578 | 70.523 | 0.267 | 0.049 | 3.688 |
Table 4.
Parameters of kinetic modeling of the adsorption of volatile phenol and total cyanide onto SBAC.
Table 4.
Parameters of kinetic modeling of the adsorption of volatile phenol and total cyanide onto SBAC.
| Kinetic Modeling Parameters | Pseudo-First-Order | Pseudo-Second-Order | |||||||
|---|---|---|---|---|---|---|---|---|---|
| Volatile phenol | 0.0351 | 20.46 | 0.9737 | 1.29 | 0.0013 | 25.38 | 0.9912 | 25.64 | 20.02 |
| Total cyanide | 0.0553 | 6.17 | 0.9804 | 89.26 | 0.0063 | 4.18 | 0.9605 | 28.22 | 3.26 |
Table 5.
Cost analysis of SBAC.
| Materials and Energy | Consumption | Unit Cost | Cost (USD) |
|---|---|---|---|
| ZnCl2 (recovery rate of 70%) | 0.315 kg | 1.227 (USD/kg) | 0.387 |
| HCl | 0.169 kg | 45.984 (USD/t) | 0.008 |
| Water | 51.240 L | 0.859 (USD/kg) | 0.044 |
| Electricity | 6.5 kWh | 0.104 (USD/kWh) | 0.676 |
| BW | 0.562 kg | 0.359 (USD/kg) | 0.202 |
| By-product tar | 0.52 kg | 308.955 (USD/t) | −0.306 |
| Sludge treatment compensation | 7.460 kg | 22.992 (USD/t) | −0.171 |
| Total (USD/kg) | 0.840 |
© 2020 by the authors. Licensee MDPI, Basel, Switzerland. This article is an open access article distributed under the terms and conditions of the Creative Commons Attribution (CC BY) license (http://creativecommons.org/licenses/by/4.0/).
Share and Cite
MDPI and ACS Style
Liu, Y.; Cheng, H.; He, Y. Application and Mechanism of Sludge-Based Activated Carbon for Phenol and Cyanide Removal from Bio-Treated Effluent of Coking Wastewater. Processes 2020, 8, 82. https://doi.org/10.3390/pr8010082
AMA Style
Liu Y, Cheng H, He Y. Application and Mechanism of Sludge-Based Activated Carbon for Phenol and Cyanide Removal from Bio-Treated Effluent of Coking Wastewater. Processes. 2020; 8(1):82. https://doi.org/10.3390/pr8010082
Chicago/Turabian StyleLiu, Yali, Han Cheng, and Yueting He. 2020. "Application and Mechanism of Sludge-Based Activated Carbon for Phenol and Cyanide Removal from Bio-Treated Effluent of Coking Wastewater" Processes 8, no. 1: 82. https://doi.org/10.3390/pr8010082
Note that from the first issue of 2016, this journal uses article numbers instead of page numbers. See further details here.