
Removal of Emerging Pollutants in Horizontal Subsurface Flow and Vertical Flow Pilot-Scale Constructed Wetlands

 ,
,
Abstract
:1. Introduction
2. Materials and Methods
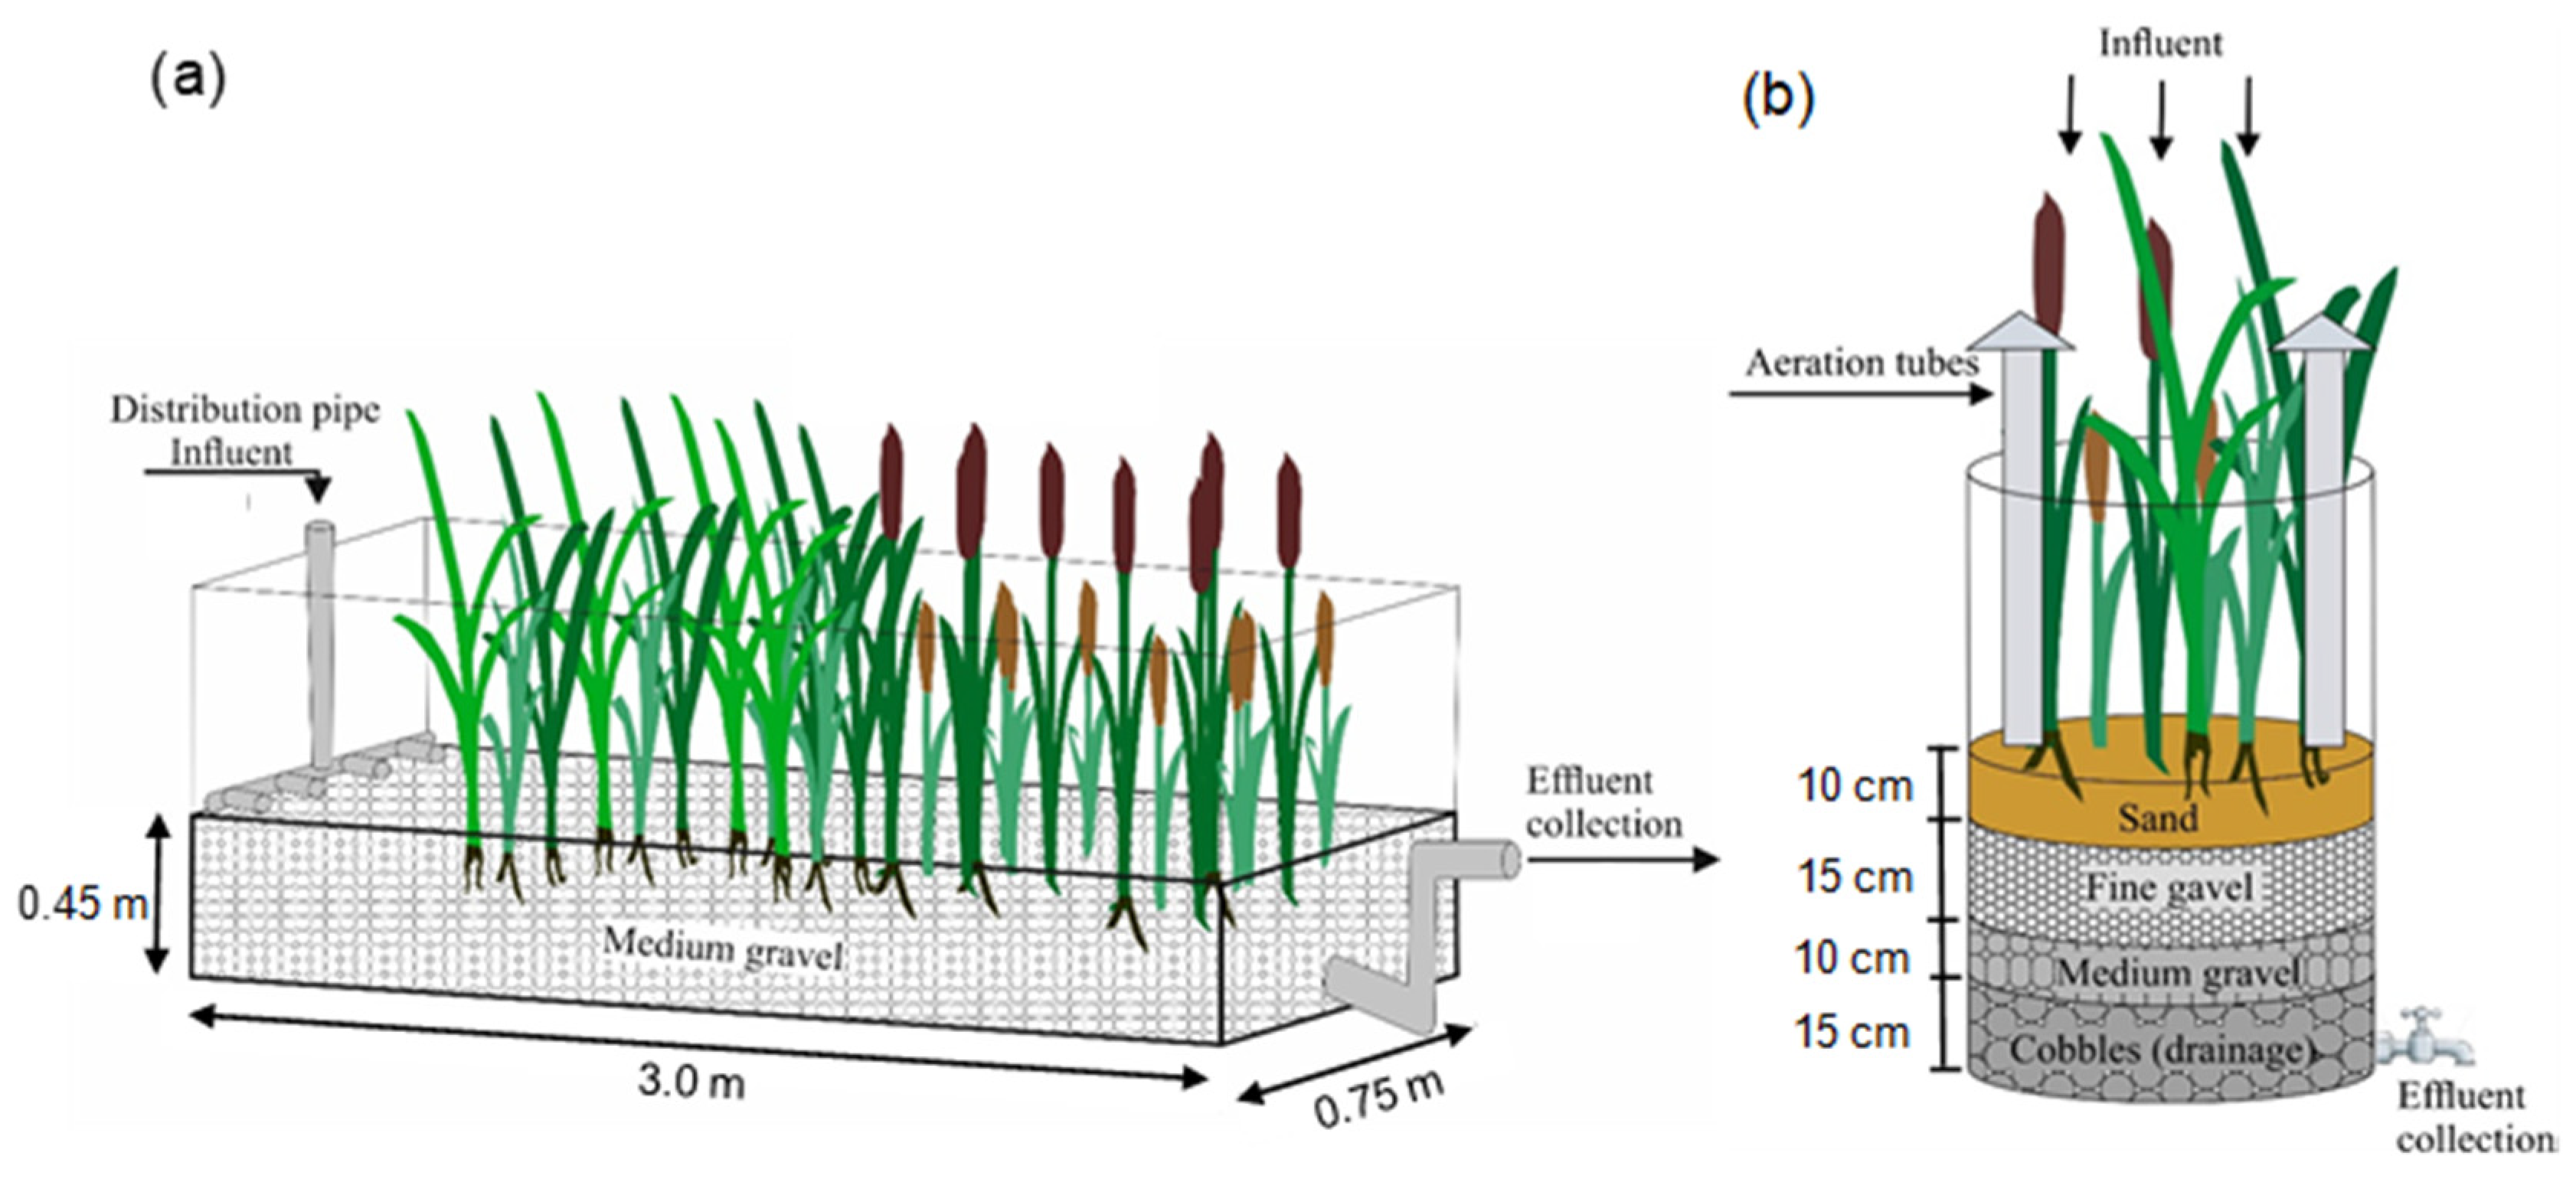
2.1. Wastewater Treatment System Facility Description and Wastewater Quality Monitoring
2.2. Chemicals and LC–MS Analysis
2.3. Statistical Analyses
3. Results and Discussion
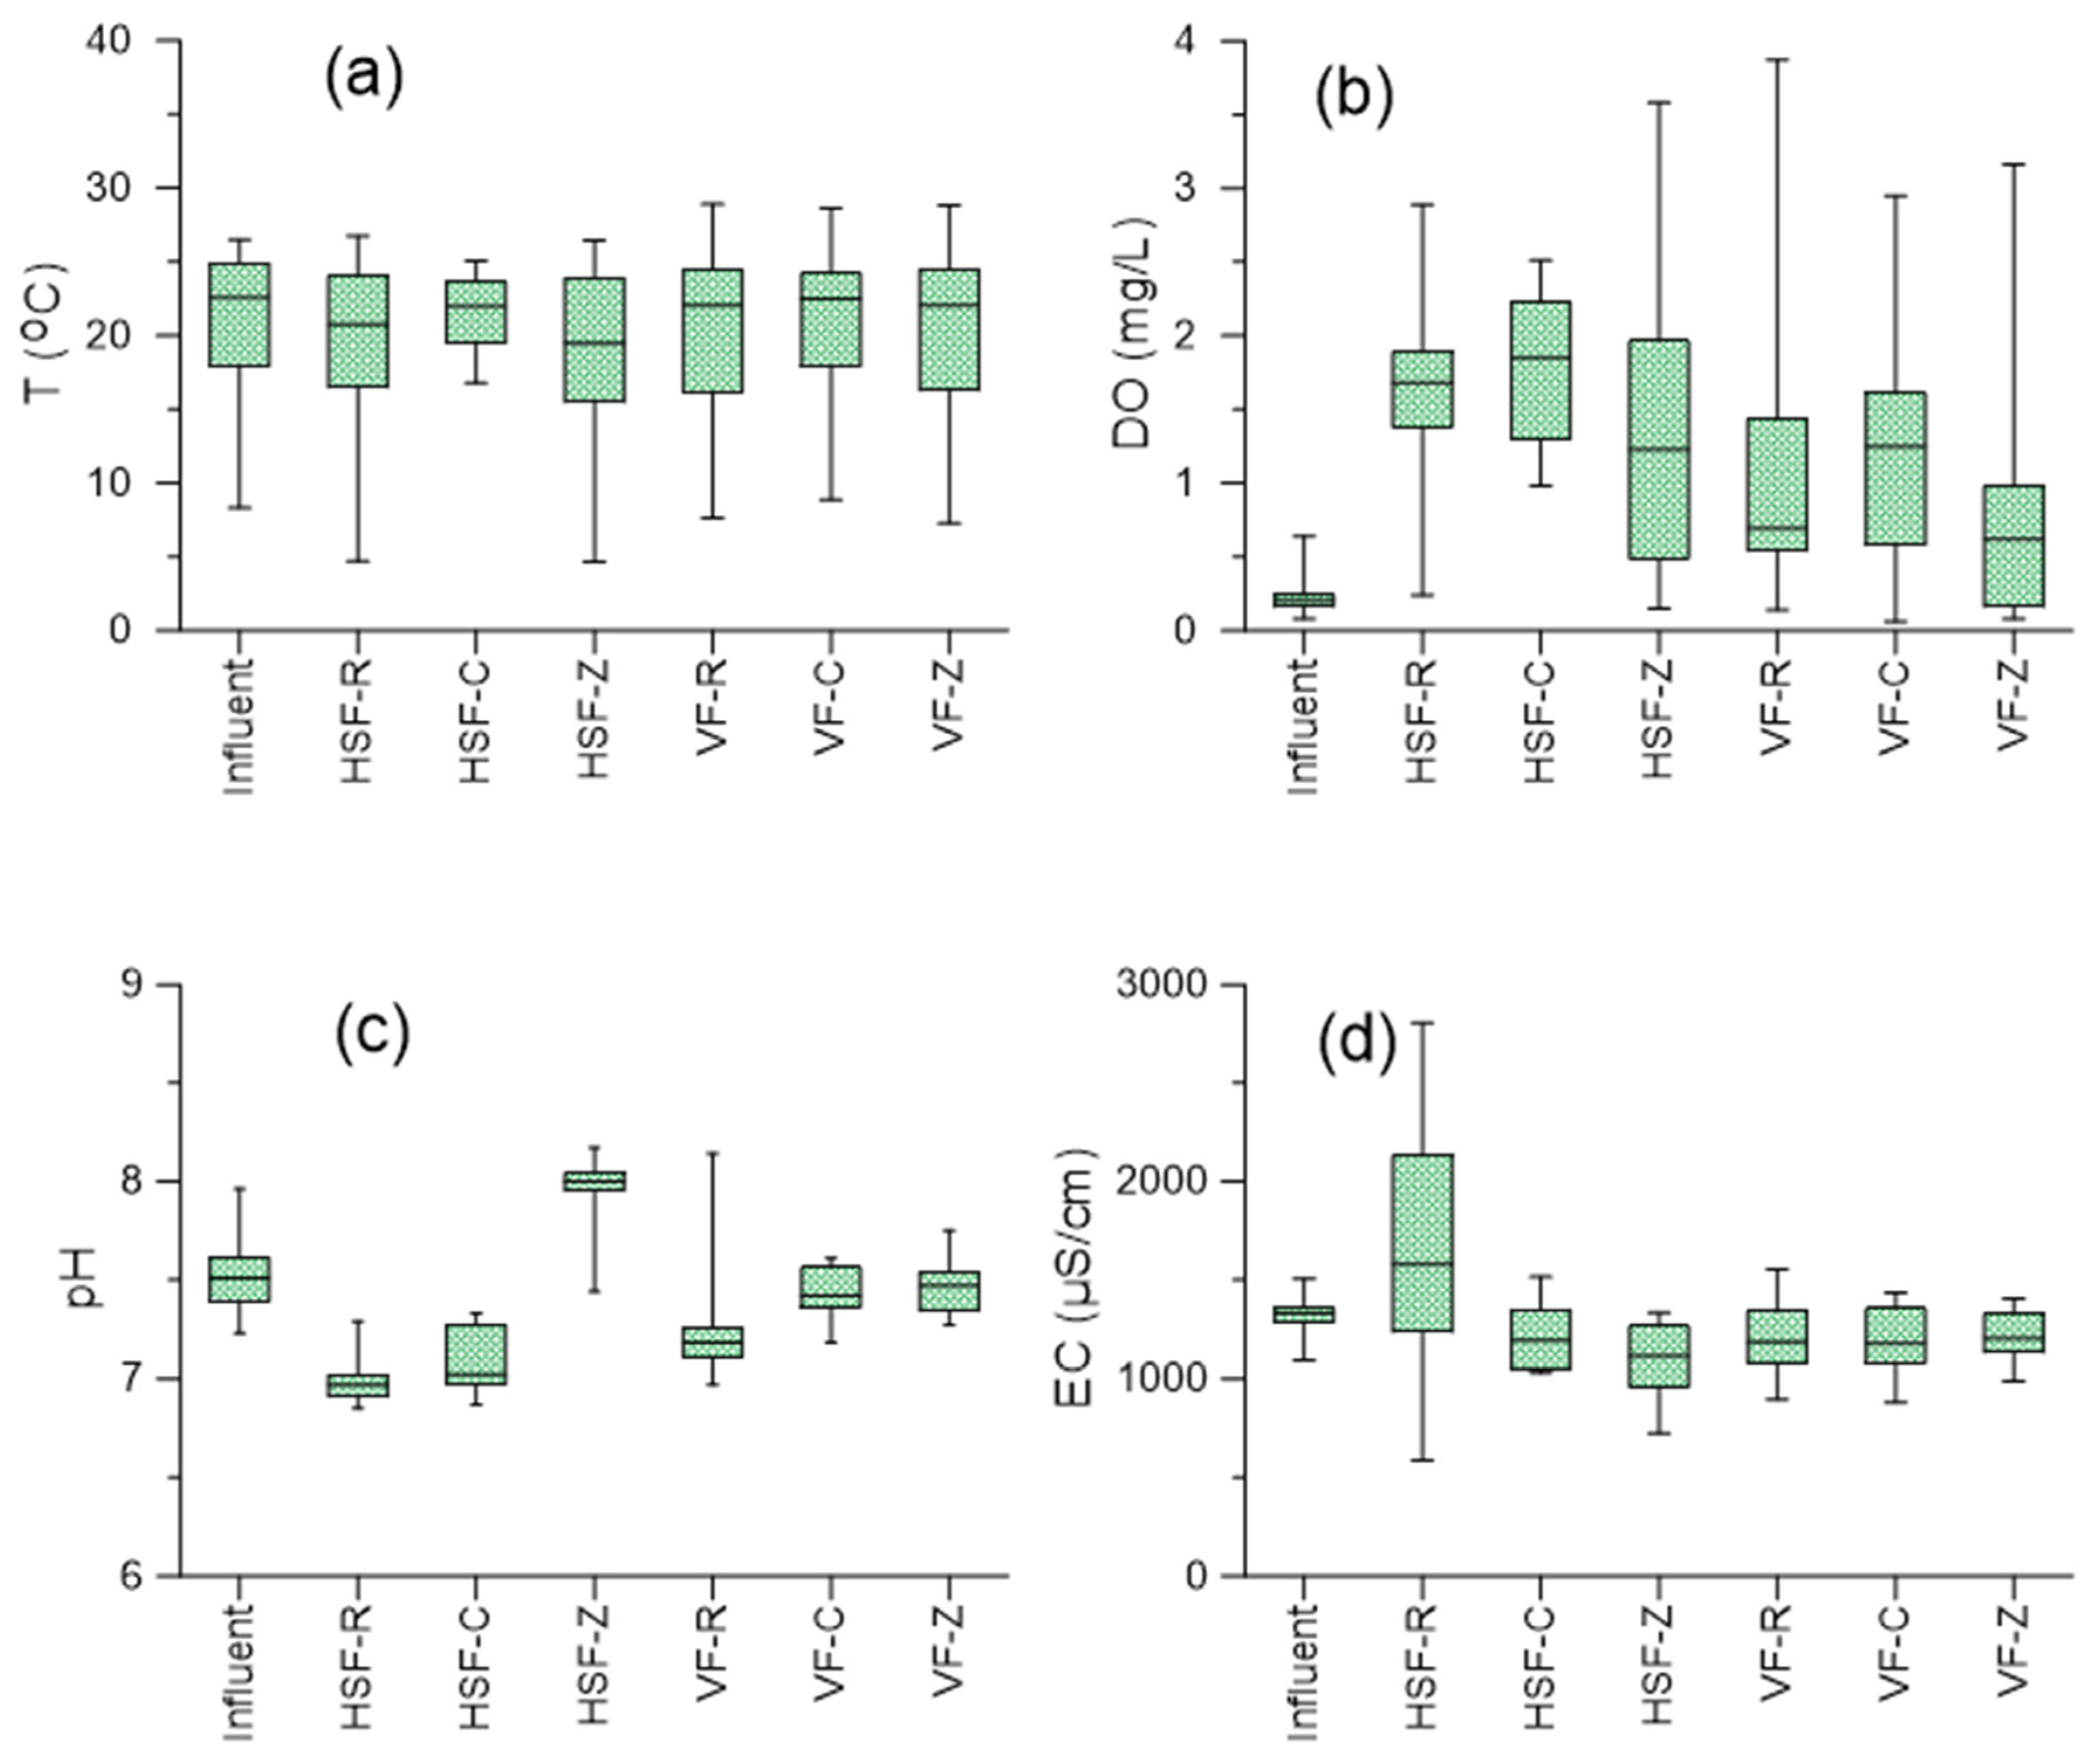
3.1. Physicochemical Parameters in CWs
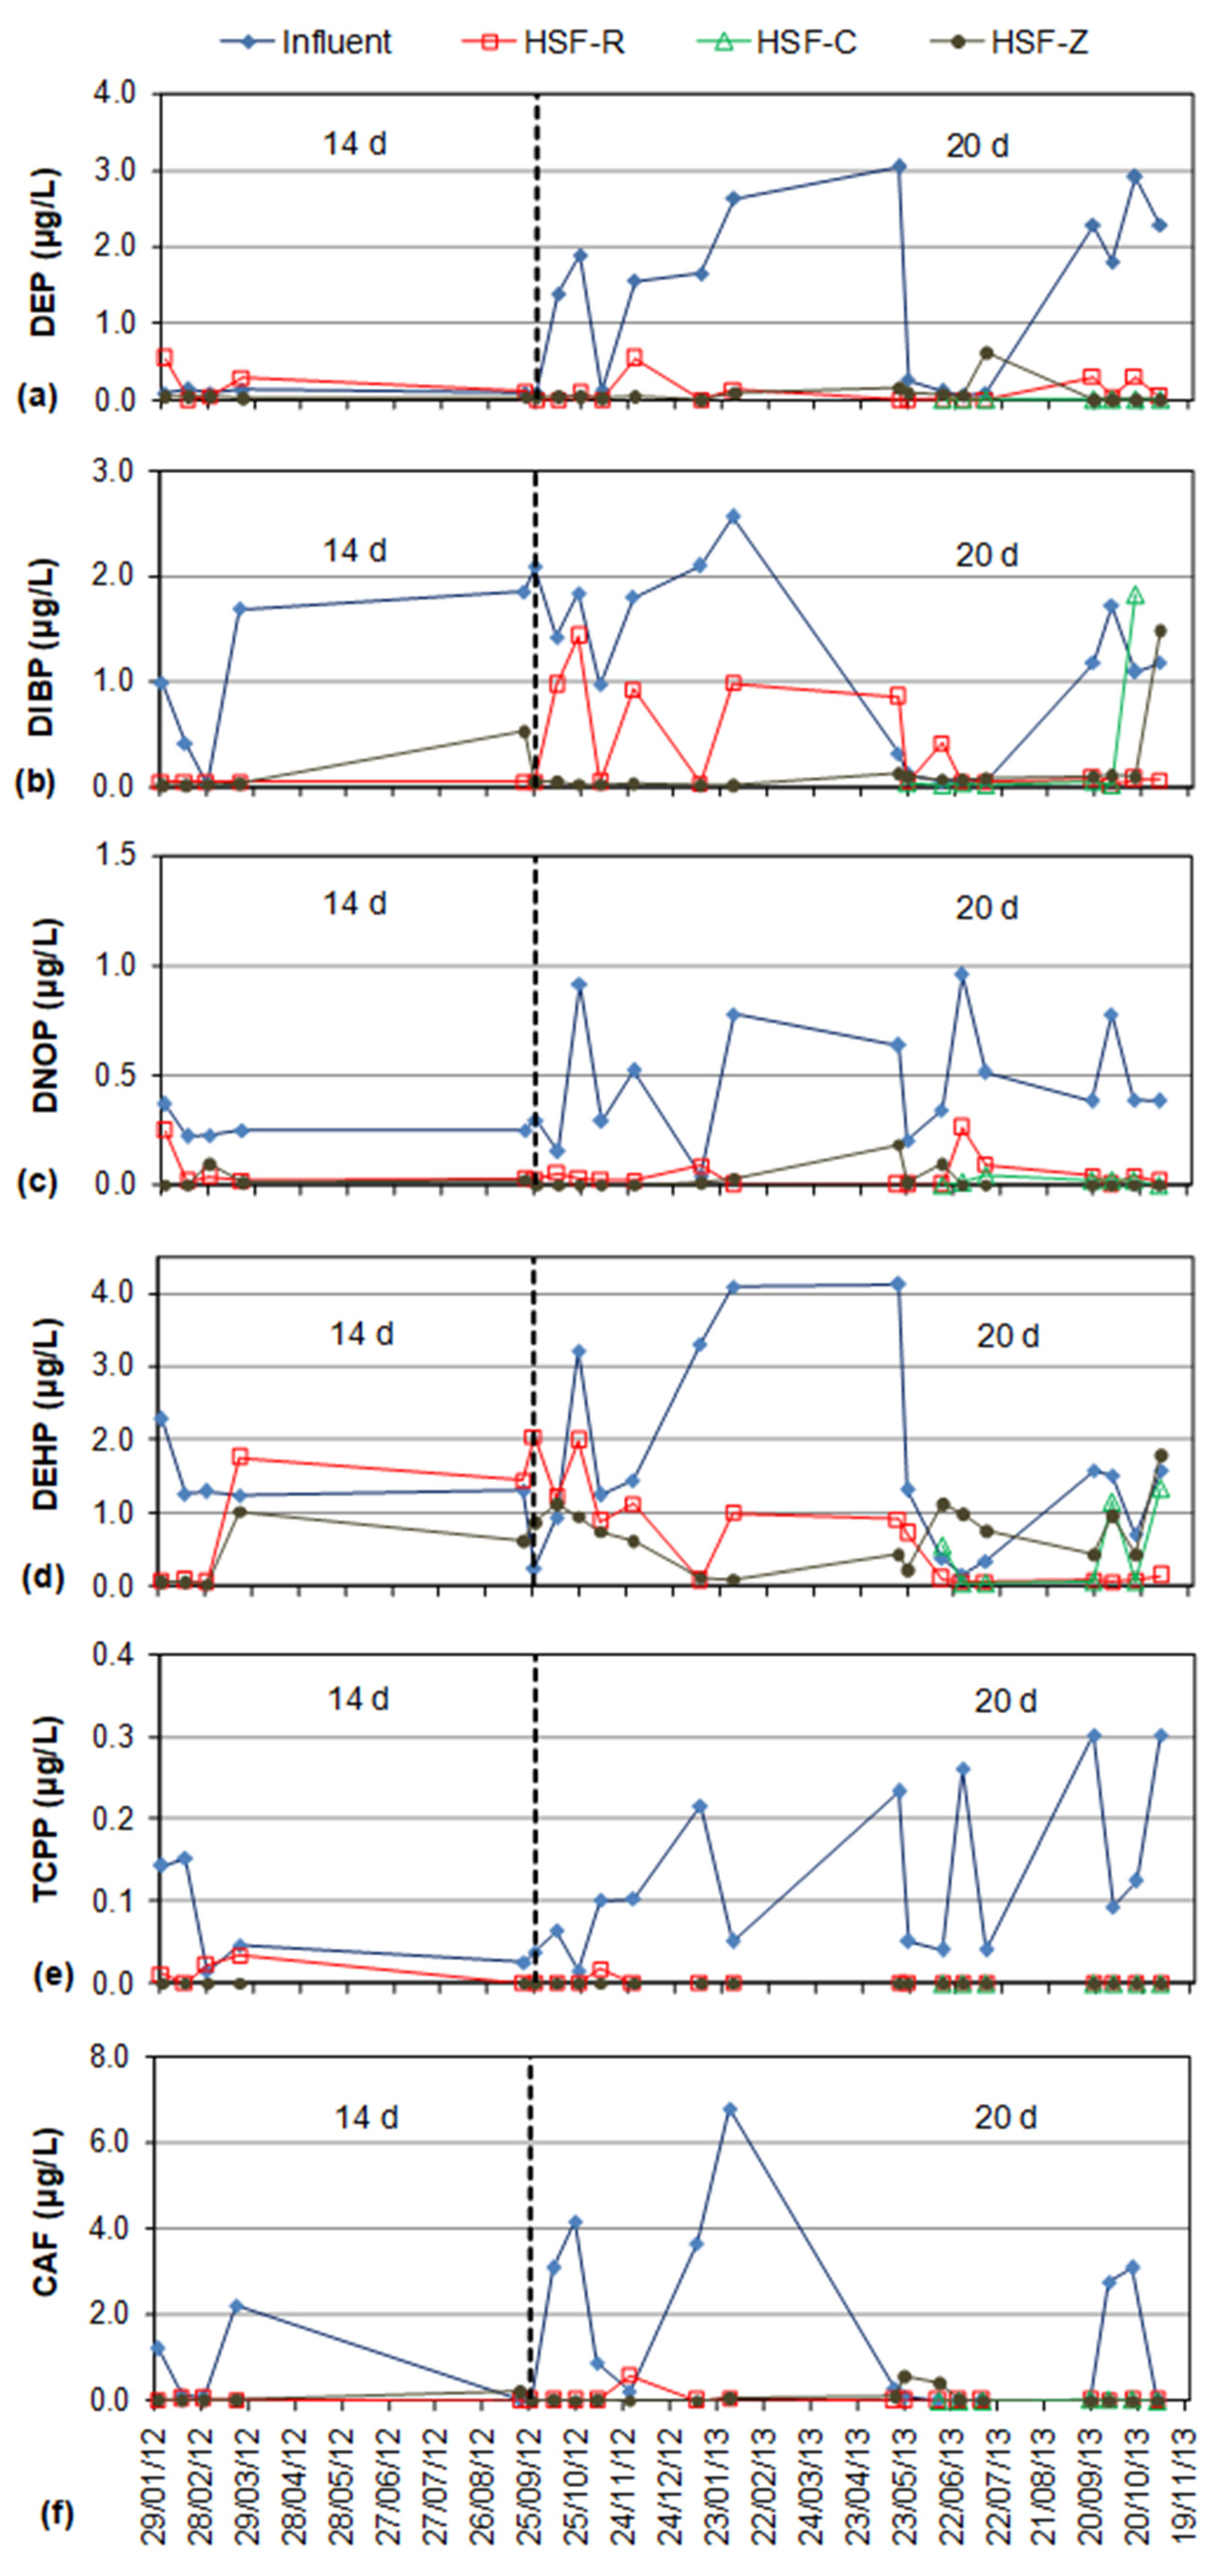
3.2. Performance Statistics of HSF-CW Pilot-Scale Units
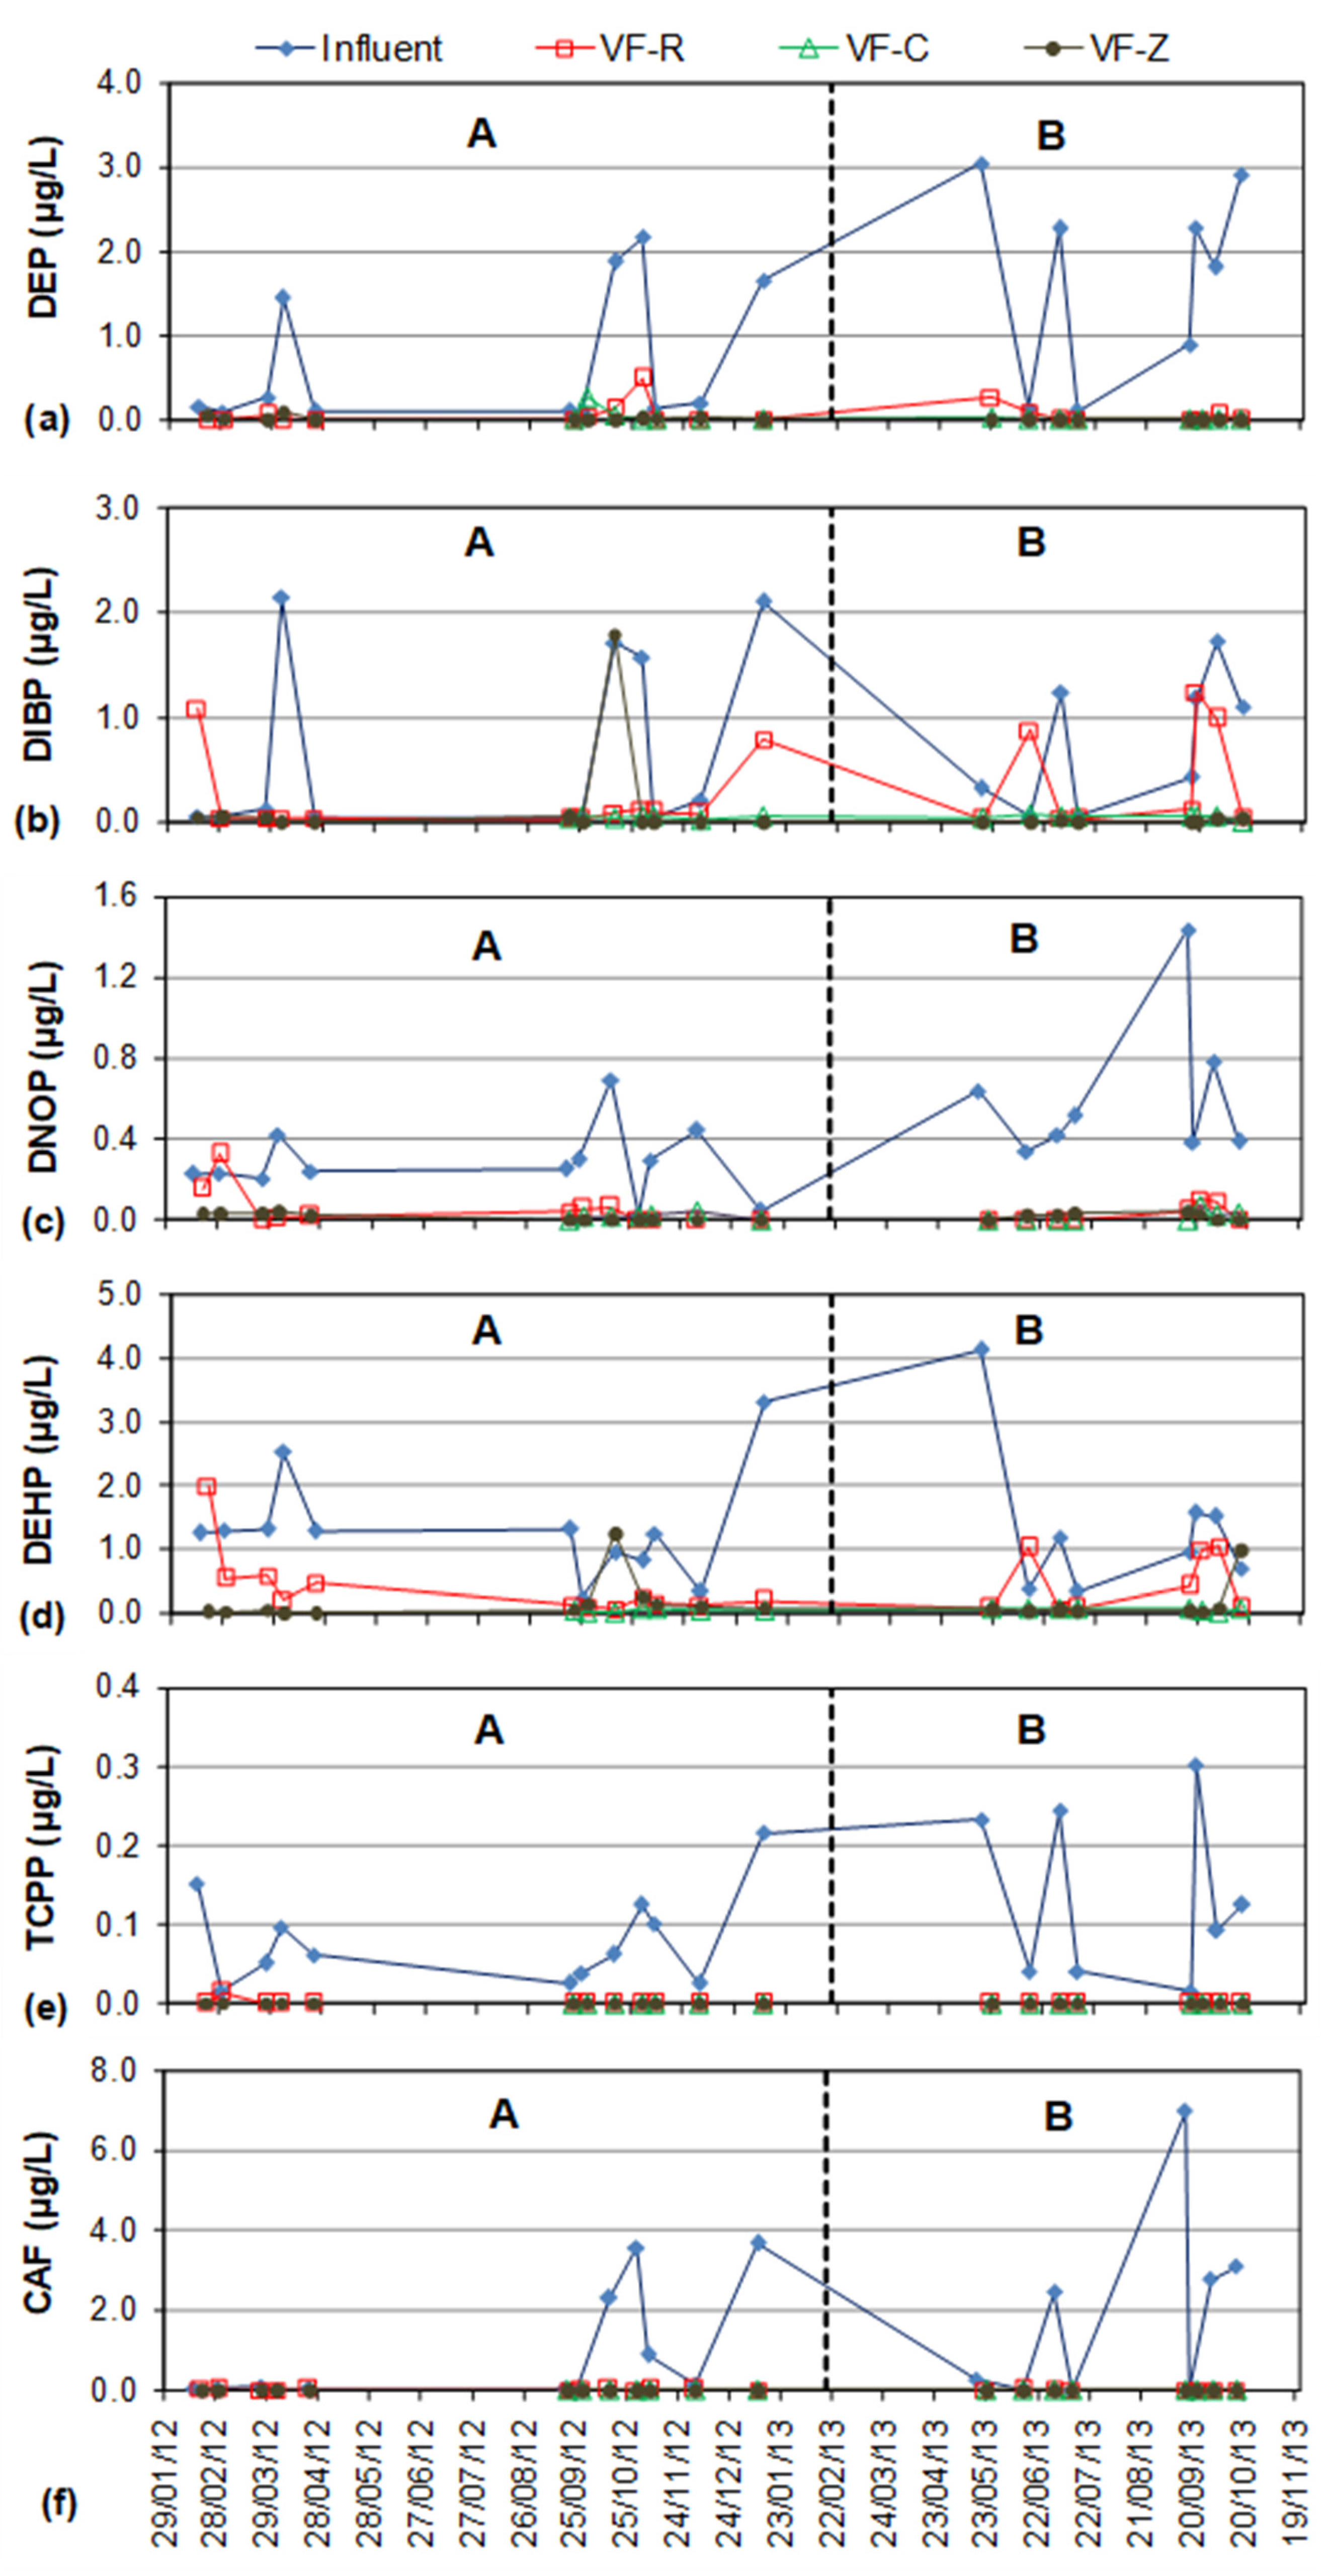
3.3. Performance Statistics of VF-CW Pilot-Scale Units
3.4. CW Configuration Comparison and Possible Treatment Mechanisms
4. Conclusions
Author Contributions
Funding
Institutional Review Board Statement
Informed Consent Statement
Data Availability Statement
Conflicts of Interest
References
- EU. Directive 2013/39/EU of the European Parliament and of the Council of 12 August 2013 Amending Directives 2000/60/EC and 2008/105/EC as Regards Priority Substances in the Field of Water Policy. Official Journal of the European Union. 2013. Available online: https://eur-lex.europa.eu/legal-content/EN/ALL/?uri=CELEX%3A32013L0039 (accessed on 20 July 2021).
- EC. Commission Regulation No 2364/2000 of 25 October 2000 Concerning the Fourth List of Priority Substances as Foreseen under Council Regulation (EEC) No 793/93. 2000. Available online: http://data.europa.eu/eli/reg/2000/2364/oj (accessed on 20 July 2021).
- EC. Regulation (EC) No 1272/2008 of the European Parliament and of the Council of 16 December 2008 on Classification, Labelling and Packaging of Substances and Mixtures, Amending and Repealing Directives 67/548/EEC and 1999/45/EC, and Amending Regulation (EC) No 1907/2006. 2008. Available online: https://eur-lex.europa.eu/LexUriServ/LexUriServ.do?uri=OJ:L:2008:353:0001:1355:en:PDF (accessed on 20 July 2021).
- Li, B.; Liu, R.; Gao, H.; Tan, R.; Zeng, P.; Song, Y. Spatial distribution and ecological risk assessment of phthalic acid esters and phenols in surface sediment from urban rivers in Northeast China. Environ. Pollut. 2016, 219, 409–415. [Google Scholar] [CrossRef] [PubMed]
- Stamatis, N.K.; Konstantinou, I.K. Occurrence and removal of emerging pharmaceutical, personal care compounds and caffeine tracer in municipal sewage treatment plant in Western Greece. J. Environ. Sci. Health Part B 2013, 48, 800–813. [Google Scholar] [CrossRef] [PubMed]
- Xiaoyan, T.; Suyu, W.; Yang, Y.; Ran, T.; Yunv, D.; Dan, A.; Li, L. Removal of six phthalic acid esters (PAEs) from domestic sewage by constructed wetlands. Chem. Eng. J. 2015, 275, 198–205. [Google Scholar] [CrossRef]
- Antonopoulou, M.; Giannakas, A.; Bairamis, F.; Papadaki, M.; Konstantinou, I. Degradation of organophosphorus flame retardant tris(1-chloro-2-propyl) phosphate (TCPP) by visible light N,S-codoped TiO 2 photocatalysts. Chem. Eng. J. 2017, 318, 231–239. [Google Scholar] [CrossRef]
- Sayyad, G.; Price, G.; Sharifi, M.; Khosravi, K. Fate and transport modeling of phthalate esters from biosolid amended soil under corn cultivation. J. Hazard. Mater. 2017, 323, 264–273. [Google Scholar] [CrossRef] [PubMed]
- Birkett, J.A.; Lester, J.N. Endocrine Disruptors in Wastewater and Sludge Treatment Processes; CRC Press LLC: Boca Raton, FL, USA, 2003. [Google Scholar]
- Bui, T.T.; Giovanoulis, G.; Cousins, A.P.; Magnér, J.; Cousins, I.T.; de Wit, C.A. Human exposure, hazard and risk of alterna-tive plasticizers to phthalate esters. Sci. Total Environ. 2016, 541, 451–467. [Google Scholar] [CrossRef]
- Golfinopoulos, S.K.; Nikolaou, A.D.; Thomaidis, N.S.; Kotrikla, A.M.; Vagi, M.C.; Petsas, A.S.; Lekkas, D.F.; Lekkas, T.D. Determination of the priority substances regulated by 2000/60/EC and 2008/105/EC Directives in the surface waters supplying water treatment plants of Athens, Greece. J. Environ. Sci. Health Part A 2016, 52, 378–384. [Google Scholar] [CrossRef]
- Martí, N.; Aguado, D.; Segovia-Martínez, L.; Bouzas, A.; Seco, A. Occurrence of priority pollutants in WWTP effluents and Mediterranean coastal waters of Spain. Mar. Pollut. Bull. 2011, 62, 615–625. [Google Scholar] [CrossRef]
- Gao, D.-W.; Wen, Z.-D. Phthalate esters in the environment: A critical review of their occurrence, biodegradation, and removal during wastewater treatment processes. Sci. Total Environ. 2016, 541, 986–1001. [Google Scholar] [CrossRef]
- Van der Veen, I.; de Boer, J. Phosphorus flame retardants: Properties, production, environmental occurrence, toxicity and analysis. Chemosphere 2012, 88, 1119–1153. [Google Scholar] [CrossRef]
- Regnery, J.; Püttmann, W. Occurrence and fate of organophosphorus flame retardants and plasticizers in urban and remote surface waters in Germany. Water Res. 2010, 44, 4097–4104. [Google Scholar] [CrossRef]
- Schreder, E.D.; La Guardia, M. Flame Retardant Transfers from U.S. Households (Dust and Laundry Wastewater) to the Aquatic Environment. Environ. Sci. Technol. 2014, 48, 11575–11583. [Google Scholar] [CrossRef]
- Antonopoulou, M.; Karagianni, P.; Konstantinou, I. Kinetic and mechanistic study of photocatalytic degradation of flame retardant Tris (1-chloro-2-propyl) phosphate (TCPP). Appl. Catal. B Environ. 2016, 192, 152–160. [Google Scholar] [CrossRef]
- Reemtsma, T.; Quintana, J.B.; Rodil, R.; García-López, M.; Rodríguez, I. Organophosphorus flame retardants and plasticizers in water and air I. Occurrence and fate. TrAC Trends Anal. Chem. 2008, 27, 727–737. [Google Scholar] [CrossRef]
- Marklund, A.; Andersson, A.B.; Haglund, P. Organophosphorus Flame Retardants and Plasticizers in Swedish Sewage Treatment Plants. Environ. Sci. Technol. 2005, 39, 7423–7429. [Google Scholar] [CrossRef]
- EU. Directive 2014/79/EU of 20 June 2014 amending Appendix C of Annex II to Directive 2009/48/EC of the European Parliament and of the Council on the Safety of Toys, as Regards TCEP, TCPP and TDCP Text with EEA Relevance. 2014. Available online: http://data.europa.eu/eli/dir/2014/79/oj (accessed on 20 July 2021).
- Lee, S.; Jeong, W.; Kannan, K.; Moon, H.-B. Occurrence and exposure assessment of organophosphate flame retardants (OPFRs) through the consumption of drinking water in Korea. Water Res. 2016, 103, 182–188. [Google Scholar] [CrossRef] [PubMed]
- Loos, R.; Carvalho, R.; António, D.C.; Comero, S.; Locoro, G.; Tavazzi, S.; Paracchini, B.; Ghiani, M.; Lettieri, T.; Blaha, L.; et al. EU-wide monitoring survey on emerging polar organic contaminants in wastewater treatment plant effluents. Water Res. 2013, 47, 6475–6487. [Google Scholar] [CrossRef] [PubMed]
- Wolschke, H.; Sühring, R.; Xie, Z.; Ebinghaus, R. Organophosphorus flame retardants and plasticizers in the aquatic environment: A case study of the Elbe River, Germany. Environ. Pollut. 2015, 206, 488–493. [Google Scholar] [CrossRef]
- Bollmann, U.E.; Möller, A.; Xie, Z.; Ebinghaus, R.; Einax, J.W. Occurrence and fate of organophosphorus flame retardants and plasticizers in coastal and marine surface waters. Water Res. 2012, 46, 531–538. [Google Scholar] [CrossRef]
- Cristale, J.; Katsoyiannis, A.; Sweetman, A.; Jones, K.C.; Lacorte, S. Occurrence and risk assessment of organophosphorus and brominated flame retardants in the River Aire (UK). Environ. Pollut. 2013, 179, 194–200. [Google Scholar] [CrossRef] [PubMed]
- Blum, K.M.; Andersson, P.L.; Renman, G.; Ahrens, L.; Gros, M.; Wiberg, K.; Haglund, P. Non-target screening and prioritization of potentially persistent, bioaccumulating and toxic domestic wastewater contaminants and their removal in on-site and large-scale sewage treatment plants. Sci. Total Environ. 2017, 575, 265–275. [Google Scholar] [CrossRef] [Green Version]
- Zolfaghari, M.; Drogui, P.; Seyhi, B.; Brar, S.; Buelna, G.; Dubé, R. Occurrence, fate and effects of Di(2-ethylhexyl) phthalate in wastewater treatment plants: A review. Environ. Pollut. 2014, 194, 281–293. [Google Scholar] [CrossRef]
- Zhang, D.Q.; Hua, T.; Gersberg, R.M.; Zhu, J.; Ng, W.J.; Tan, S.K. Fate of caffeine in mesocosms wetland planted with Scirpus validus. Chemosphere 2013, 90, 1568–1572. [Google Scholar] [CrossRef]
- Vymazal, J.; Březinová, T.D.; Koželuh, M.; Kule, L. Occurrence and removal of pharmaceuticals in four full-scale constructed wetlands in the Czech Republic—The first year of monitoring. Ecol. Eng. 2017, 98, 354–364. [Google Scholar] [CrossRef]
- Papageorgiou, M.; Kosma, C.; Lambropoulou, D. Seasonal occurrence, removal, mass loading and environmental risk assessment of 55 pharmaceuticals and personal care products in a municipal wastewater treatment plant in Central Greece. Sci. Total Environ. 2016, 543, 547–569. [Google Scholar] [CrossRef] [PubMed]
- Chen, Y.; Vymazal, J.; Březinová, T.; Koželuh, M.; Kule, L.; Huang, J.; Chen, Z. Occurrence, removal and environmental risk assessment of pharmaceuticals and personal care products in rural wastewater treatment wetlands. Sci. Total Environ. 2016, 566-567, 1660–1669. [Google Scholar] [CrossRef] [PubMed]
- Kosma, C.I.; Lambropoulou, D.A.; Albanis, T.A. Investigation of PPCPs in wastewater treatment plants in Greece: Occurrence, removal and environmental risk assessment. Sci. Total Environ. 2014, 466–467, 421–438. [Google Scholar] [CrossRef]
- Lämmchen, V.; Klasmeier, J.; Hernandez-Leal, L.; Berlekamp, J. Spatial Modelling of Micro-pollutants in a Strongly Regulated Cross-border Lowland Catchment. Environ. Process. 2021, 8, 973–992. [Google Scholar] [CrossRef]
- Tiehm, A.; Schmidt, N.; Stieber, M.; Sacher, F.; Wolf, L.; Hoetzl, H. Biodegradation of Pharmaceutical Compounds and their Occurrence in the Jordan Valley. Water Resour. Manag. 2011, 25, 1195–1203. [Google Scholar] [CrossRef]
- Khan, S.; Knapp, C.W.; Beattie, T.K. Antibiotic Resistant Bacteria Found in Municipal Drinking Water. Environ. Process. 2016, 3, 541–552. [Google Scholar] [CrossRef] [Green Version]
- Fast, S.A.; Gude, V.G.; Truax, D.D.; Martin, J.; Magbanua, B.S. A Critical Evaluation of Advanced Oxidation Processes for Emerging Contaminants Removal. Environ. Process. 2017, 4, 283–302. [Google Scholar] [CrossRef]
- Castañer, C.M.; Bellver-Domingo, Á.; Hernández-Sancho, F. Environmental and Economic Approach to Assess a Horizontal Sub-Surface Flow Wetland in Developing Area. Water Resour. Manag. 2020, 34, 3761–3778. [Google Scholar] [CrossRef]
- Yuan, Z.; Fu, S.; Xu, X.; Wendling, L.A. Mineral Processing Residue Use as Substrate in a Modular Engineered Wetland for Wastewater Treatment. Environ. Process. 2017, 4, 523–547. [Google Scholar] [CrossRef]
- Gkika, D.; Gikas, G.D.; Tsihrintzis, V.A. Construction and operation costs of constructed wetlands treating wastewater. Water Sci. Technol. 2014, 70, 803–810. [Google Scholar] [CrossRef]
- Srđević, Z.; Srđević, B.; Suvočarev, K.; Galamboš, L. Hybrid Constructed Wetland Selection as a Group Decision-Making Problem. Water Resour. Manag. 2019, 34, 295–310. [Google Scholar] [CrossRef]
- Koenig, S.; Trémolières, M. Transfer of Nitrogen and Phosphorus Nutrients in Vegetated Buffer Zones Receiving Treatment Plant Effluent. Environ. Process. 2018, 5, 555–575. [Google Scholar] [CrossRef]
- Angassa, K.; Leta, S.; Mulat, W.; Kloos, H.; Meers, E. Organic Matter and Nutrient Removal Performance of Horizontal Subsurface Flow Constructed Wetlands Planted with Phragmite karka and Vetiveria zizanioide for Treating Municipal Wastewater. Environ. Process. 2018, 5, 115–130. [Google Scholar] [CrossRef]
- Angassa, K.; Leta, S.; Mulat, W.; Kloos, H.; Meers, E. Evaluation of Pilot-Scale Constructed Wetlands with Phragmites karka for Phytoremediation of Municipal Wastewater and Biomass Production in Ethiopia. Environ. Process. 2019, 6, 65–84. [Google Scholar] [CrossRef]
- Kotti, I.P.; Sylaios, G.K.; Tsihrintzis, V.A. Fuzzy Modeling for Nitrogen and Phosphorus Removal Estimation in Free-Water Surface Constructed Wetlands. Environ. Process. 2016, 3, 65–79. [Google Scholar] [CrossRef]
- Papadopoulos, N.; Zalidis, G. The Use of Typha Latifolia L. in Constructed Wetland Microcosms for the Remediation of Herbicide Terbuthylazine. Environ. Process. 2019, 6, 985–1003. [Google Scholar] [CrossRef]
- Ioannidou, V.G.; Pearson, J.M. Hydraulic and Design Parameters in Full-Scale Constructed Wetlands and Treatment Units: Six Case Studies. Environ. Process. 2018, 5, 5–22. [Google Scholar] [CrossRef] [Green Version]
- Alemu, T.; Lemma, E.; Mekonnen, A.; Leta, S. Performance of Pilot Scale Anaerobic-SBR System Integrated with Constructed Wetlands for the Treatment of Tannery Wastewater. Environ. Process. 2016, 3, 815–827. [Google Scholar] [CrossRef]
- Reyes-Contreras, C.; Matamoros, V.; Ruiz, I.; Soto, M.; Bayona, J. Evaluation of PPCPs removal in a combined anaerobic digester-constructed wetland pilot plant treating urban wastewater. Chemosphere 2011, 84, 1200–1207. [Google Scholar] [CrossRef] [PubMed]
- Herrera-Cárdenas, J.; Navarro, A.E.; Torres, E. Effects of porous media, macrophyte type and hydraulic retention time on the removal of organic load and micropollutants in constructed wetlands. J. Environ. Sci. Health Part A 2016, 51, 380–388. [Google Scholar] [CrossRef]
- Noutsopoulos, C.; Charalambous, V.; Koumaki, E. Evaluating the Fate of Emerging Contaminants in Wastewater Treatment Plants through Plant-Wide Mathematical Modelling. Environ. Process. 2020, 7, 1065–1094. [Google Scholar] [CrossRef]
- Matamoros, V.; Salvadó, V. Evaluation of the seasonal performance of a water reclamation pond-constructed wetland system for removing emerging contaminants. Chemosphere 2012, 86, 111–117. [Google Scholar] [CrossRef]
- Li, B.; Liu, L.; Han, L.; Yang, Y. Removal efficiency of polycyclic aromatic hydrocarbons and phthalate esters by surface flow wetland in Shunyi district, Beijing. IOP Conf. Ser. Earth Environ. Sci. 2017, 59, 12041. [Google Scholar] [CrossRef] [Green Version]
- Hassanzadeh, N.; Sari, A.E.; Khodabandeh, S.; Bahramifar, N. Occurrence and distribution of two phthalate esters in the sediments of the Anzali wetlands on the coast of the Caspian Sea (Iran). Mar. Pollut. Bull. 2014, 89, 128–135. [Google Scholar] [CrossRef]
- Sun, J.; Ji, X.; Zhang, R.; Huang, Y.; Liang, Y.; Du, J.; Xie, X.; Li, A. Endocrine disrupting compounds reduction and water quality improvement in reclaimed municipal wastewater: A field-scale study along Jialu River in North China. Chemosphere 2016, 157, 232–240. [Google Scholar] [CrossRef] [PubMed]
- Yang, C.-F.; Wang, C.-C.; Chen, C.-H. Di-n-butyl phthalate removal by strain Deinococcus sp. R5 in batch reactors. Int. Biodeterior. Biodegrad. 2014, 95, 55–60. [Google Scholar] [CrossRef]
- Zhang, D.; Gersberg, R.M.; Ng, W.J.; Tan, S.K. Removal of pharmaceuticals and personal care products in aquatic plant-based systems: A review. Environ. Pollut. 2014, 184, 620–639. [Google Scholar] [CrossRef] [PubMed]
- Wen, Z.-D.; Wu, W.; Ren, N.-Q.; Gao, D.-W. Synergistic effect using vermiculite as media with a bacterial biofilm of Arthrobacter sp. for biodegradation of di-(2-ethylhexyl) phthalate. J. Hazard. Mater. 2016, 304, 118–125. [Google Scholar] [CrossRef]
- Akratos, C.; Tsihrintzis, V.A. Effect of temperature, HRT, vegetation and porous media on removal efficiency of pilot-scale horizontal subsurface flow constructed wetlands. Ecol. Eng. 2007, 29, 173–191. [Google Scholar] [CrossRef]
- Stefanakis, A.I.; Tsihrintzis, V.A. Performance of pilot-scale vertical flow constructed wetlands treating simulated municipal wastewater: Effect of various design parameters. Desalination 2009, 248, 753–770. [Google Scholar] [CrossRef]
- Stefanakis, A.; Tsihrintzis, V.A. Effects of loading, resting period, temperature, porous media, vegetation and aeration on performance of pilot-scale vertical flow constructed wetlands. Chem. Eng. J. 2012, 181–182, 416–430. [Google Scholar] [CrossRef]
- Papaevangelou, V.A.; Gikas, G.D.; Tsihrintzis, V.A. Evaluation of evapotranspiration in small on-site HSF constructed wetlands. J. Environ. Sci. Health Part A 2012, 47, 766–785. [Google Scholar] [CrossRef]
- Papaevangelou, V.; Gikas, G.D.; Tsihrintzis, V.A. Effect of operational and design parameters on performance of pilot-scale horizontal subsurface flow constructed wetlands treating university campus wastewater. Environ. Sci. Pollut. Res. 2016, 23, 19504–19519. [Google Scholar] [CrossRef]
- Papaevangelou, V.; Gikas, G.D.; Tsihrintzis, V.A. Effect of Operational and Design Parameters on Performance of Pilot-Scale Vertical Flow Constructed Wetlands Treating University Campus Wastewater. Water Resour. Manag. 2016, 30, 5875–5899. [Google Scholar] [CrossRef]
- PubChem. National Library of Medicine, National Center for Biotechnology Information. 2021. Available online: https://pubchem.ncbi.nlm.nih.gov/ (accessed on 20 July 2021).
- Papaevangelou, V.A.; Gikas, G.D.; Tsihrintzis, V.A.; Antonopoulou, M.; Konstantinou, I.K. Removal of Endocrine Disrupting Chemicals in HSF and VF pilot-scale constructed wetlands. Chem. Eng. J. 2016, 294, 146–156. [Google Scholar] [CrossRef]
- Kadlec, R.H.; Wallace, S.D. Treatment Wetlands, 2nd ed.; CRC Press: Boca Raton, FL, USA, 2009. [Google Scholar]
- Gikas, G.D.; Vryzas, Z.; Tsihrintzis, V.A. S-metolachlor herbicide removal in pilot-scale horizontal subsurface flow constructed wetlands. Chem. Eng. J. 2018, 339, 108–116. [Google Scholar] [CrossRef]
- Verlicchi, P.; Zambello, E. How efficient are constructed wetlands in removing pharmaceuticals from untreated and treated urban wastewaters? A review. Sci. Total Environ. 2014, 470–471, 1281–1306. [Google Scholar] [CrossRef] [PubMed]
- Zheng, L.; Liu, T.; Xie, E.; Liu, M.; Ding, A.; Zhang, B.-T.; Li, X.; Zhang, D. Partition and Fate of Phthalate Acid Esters (PAEs) in a Full-Scale Horizontal Subsurface Flow Constructed Wetland Treating Polluted River Water. Water 2020, 12, 865. [Google Scholar] [CrossRef] [Green Version]
- Clara, M.; Windhofer, G.; Hartl, W.; Braun, K.; Simon, M.; Gans, O.; Scheffknecht, C.; Chovanec, A. Occurrence of phthalates in surface runoff, untreated and treated wastewater and fate during wastewater treatment. Chemosphere 2010, 78, 1078–1084. [Google Scholar] [CrossRef]
- Diepenheim, G.; Gift, S.C.; Harb, C.; Wallace, M.; Layshock, J. Survey of Phthalate Mitigation and Distribution in Water, Sediment, and Typha in a Fully Operational Constructed Wetland: A Pilot Study. Bull. Environ. Contam. Toxicol. 2020, 105, 205–210. [Google Scholar] [CrossRef]
- Iqbal, M.; Syed, J.H.; Katsoyiannis, A.; Malik, R.N.; Farooqi, A.; Butt, A.; Li, J.; Zhang, G.; Cincinelli, A.; Jones, K.C. Legacy and emerging flame retardants (FRs) in the freshwater ecosystem: A review. Environ. Res. 2017, 152, 26–42. [Google Scholar] [CrossRef] [PubMed]
- Qin, P.; Lu, S.; Liu, X.; Wang, G.; Zhang, Y.; Li, D.; Wan, Z. Removal of tri-(2-chloroisopropyl) phosphate (TCPP) by three types of constructed wetlands. Sci. Total Environ. 2020, 749, 141668. [Google Scholar] [CrossRef] [PubMed]
- Brunsch, A.F.; ter Laak, T.L.; Christoffels, E.; Rijnaarts, H.H.; Langenhoff, A.A. Retention soil filter as post-treatment step to remove micropollutants from sewage treatment plant effluent. Sci. Total Environ. 2018, 637–638, 1098–1107. [Google Scholar] [CrossRef]
- Li, Y.; Zhu, G.; Ng, W.J.; Tan, S.K. A review on removing pharmaceutical contaminants from wastewater by constructed wetlands: Design, performance and mechanism. Sci. Total Environ. 2014, 468–469, 908–932. [Google Scholar] [CrossRef] [PubMed]
- Li, T.; Fan, Y.; Cun, D.; Song, X.; Dai, Y.; Wang, F.; Wu, C.; Liang, W. Treatment performance and microbial response to dibutyl phthalate contaminated wastewater in vertical flow constructed wetland mesocosms. Chemosphere 2020, 246, 125635. [Google Scholar] [CrossRef]
- Matamoros, V.; Arias, C.A.; Brix, H.; Bayona, J.M. Preliminary screening of small-scale domestic wastewater treatment systems for removal of pharmaceutical and personal care products. Water Res. 2009, 43, 55–62. [Google Scholar] [CrossRef] [PubMed]
- Matamoros, V.; Arias, C.A.; Brix, H.; Bayona, J.M. Removal of Pharmaceuticals and Personal Care Products (PPCPs) from Urban Wastewater in a Pilot Vertical Flow Constructed Wetland and a Sand Filter. Environ. Sci. Technol. 2007, 41, 8171–8177. [Google Scholar] [CrossRef] [PubMed]
- Ávila, C.; Nivala, J.; Olsson, L.; Kassa, K.; Headley, T.; Mueller, R.A.; Bayona, J.M.; García, J. Emerging organic contaminants in vertical subsurface flow constructed wetlands: Influence of media size, loading frequency and use of active aeration. Sci. Total Environ. 2014, 494–495, 211–217. [Google Scholar] [CrossRef] [PubMed]
- Witthayaphirom, C.; Chiemchaisri, C.; Chiemchaisri, W.; Ogata, Y.; Ebie, Y.; Ishigaki, T. Organic micro-pollutant removals from landfill leachate in horizontal subsurface flow constructed wetland operated in the tropical climate. J. Water Process. Eng. 2020, 38, 101581. [Google Scholar] [CrossRef]
- Guο, W.; Zhang, H.; Huo, S. Organochlorine pesticides in aquatic hydrophyte tissues and surrounding sediments in Baiyang-dian wetland, China. Ecol. Eng. 2014, 67, 150–155. [Google Scholar] [CrossRef]


| Substance | Formula | Chemical Structure | Molecular Weight (g/mol) | Water Solubility (mg/L) | LogKow |
|---|---|---|---|---|---|
| Phthalate Esters (PAEs) | |||||
| Diethyl phthalate (DEP) | C12H14O4 | 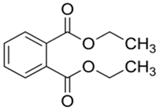 | 222.24 | 1100 | 2.47 |
| Di-isobutyl phthalate (DIBP) | C16H22O4 |  | 278.35 | 6.2 | 4.45 |
| Di-n-octyl phthalate (DNOP) | C24H38O4 | 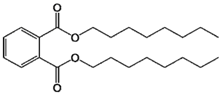 | 390.56 | 0.022 | 8.06 |
| Bis(2-ethylhexyl) phthalate (DEHP) | C24H38O4 |  | 390.56 | 0.27 | 7.50 |
| Flame retardant | |||||
| Tris (1-chloro-2-propyl) phosphate (TCPP) | C9H18Cl3O4P |  | 327.56 | 1600 | 2.59 |
| Tracer (Stimulant) | |||||
| Caffeine (CAF) | C8H10N4O2 | 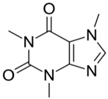 | 194.19 | 22 (g/L) | −0.07 |
| Compound | Ionization Mode | Measured m/z | Δ (ppm) | Rt (min) | LOD (ng/L) | LOQ (ng/L) |
|---|---|---|---|---|---|---|
| Diethyl phthalate (DEP) | positive | 223.0961 | 1.9 | 8.9 | 1.2 | 4.0 |
| Di-isobutyl phthalate (DIBP) | positive | 279.1597 | −2.3 | 11.1 | 2.5 | 8.3 |
| Di-n-octyl phthalate (DNOP) | positive | 391.2833 | 2.5 | 12.3 | 1.8 | 6.0 |
| Bis(2-ethylhexyl) phthalate (DEHP) | positive | 391.2837 | 1.5 | 13.8 | 2.8 | 9.3 |
| Tris (1-chloro-2-propyl) phosphate (TCPP) | positive | 327.0071 | 3.1 | 9.7 | 1 | 3.3 |
| Caffeine (CAF) | positive | 195.0880 | −1.9 | 5.6 | 3 | 10.0 |
| Rt: Retention time; LOD: Limit of detection; LOQ: Limit of quantification | ||||||
| HSF-CW | VF-CW | ||||||||
|---|---|---|---|---|---|---|---|---|---|
| Parameter | Influent | Effluent | Influent | Effluent | |||||
| HSF-R | HSF-C | HSF-Z | VF-R | VF-C | VF-Z | ||||
| DEP (μg/L) | Mean | 1.086 | 0.119 | 0.004 | 0.076 | 1.085 | 0.058 | 0.025 | 0.012 |
| SD | 1.106 | 0.176 | 0.005 | 0.132 | 1.074 | 0.119 | 0.067 | 0.021 | |
| min | 0.066 | BQL(10) | BQL(6) | BQL(5) | 0.091 | BQL(11) | BQL(11) | BQL(14) | |
| max | 3.044 | 0.544 | 0.016 | 0.624 | 3.044 | 0.486 | 0.263 | 0.085 | |
| n | 21 | 21 | 7 | 21 | 20 | 20 | 15 | 20 | |
| DIBP (μg/L) | Mean | 1.121 | 0.299 | 0.288 | 0.147 | 0.710 | 0.289 | 0.048 | 0.106 |
| SD | 0.809 | 0.440 | 0.680 | 0.326 | 0.786 | 0.425 | 0.017 | 0.396 | |
| min | 0.024 | 0.016 | 0.026 | 0.018 | 0.040 | 0.024 | BQL(1) | BQL(12) | |
| max | 2.564 | 1.431 | 1.831 | 1.486 | 2.141 | 1.236 | 0.074 | 1.788 | |
| n | 21 | 21 | 7 | 21 | 20 | 20 | 15 | 20 | |
| DNOP (μg/L) | Mean | 0.425 | 0.051 | 0.017 | 0.024 | 0.412 | 0.045 | 0.016 | 0.015 |
| SD | 0.255 | 0.072 | 0.015 | 0.047 | 0.309 | 0.078 | 0.019 | 0.016 | |
| min | 0.043 | BDL(5) | BDL(2) | BDL(13) | 0.024 | BDL(10) | BDL(7) | BDL(10) | |
| max | 0.958 | 0.261 | 0.045 | 0.185 | 1.434 | 0.323 | 0.065 | 0.043 | |
| n | 21 | 21 | 7 | 21 | 20 | 20 | 15 | 20 | |
| DEHP (μg/L) | Mean | 1.597 | 0.663 | 0.461 | 0.643 | 1.334 | 0.431 | 0.060 | 0.181 |
| SD | 1.173 | 0.705 | 0.562 | 0.460 | 0.981 | 0.493 | 0.022 | 0.328 | |
| min | 0.154 | 0.053 | 0.037 | 0.028 | 0.246 | 0.069 | 0.015 | 0.015 | |
| max | 4.126 | 2.041 | 1.326 | 1.789 | 4.126 | 1.985 | 0.088 | 1.256 | |
| n | 21 | 21 | 7 | 21 | 20 | 20 | 15 | 20 | |
| TCPP (μg/L) | Mean | 0.115 | 0.005 | 0.001 | 0.001 | 0.103 | 0.001 | 0.001 | 0.001 |
| SD | 0.095 | 0.009 | 0.000 | 0.000 | 0.085 | 0.003 | 0.000 | 0.000 | |
| min | 0.015 | BDL(17) | BDL(7) | BDL(21) | 0.015 | BDL(19) | BDL(15) | BDL(20) | |
| max | 0.302 | 0.034 | BDL(7) | BDL(21) | 0.302 | 0.014 | BDL(15) | BDL(20) | |
| n | 21 | 21 | 7 | 21 | 20 | 20 | 15 | 20 | |
| CAF (μg/L) | Mean | 1.372 | 0.042 | 0.010 | 0.076 | 1.319 | 0.014 | 0.011 | 0.006 |
| SD | 1.896 | 0.128 | 0.006 | 0.149 | 1.911 | 0.010 | 0.008 | 0.002 | |
| min | BQL(6) | BQL(14) | BQL(4) | BQL(7) | BQL(5) | BQL(10) | BQL(9) | BQL(18) | |
| max | 6.805 | 0.597 | 0.018 | 0.570 | 6.975 | 0.032 | 0.026 | 0.011 | |
| n | 21 | 21 | 7 | 21 | 20 | 20 | 15 | 20 | |
| BDL = below detection limit: DNOP < 1.8 ng/L, TCPP < 1.0 ng/L BQL = below quantification limit: DEP < 4.0 ng/L, CAF < 10.0 ng/L Values in parenthesis indicate the number of samples that were either BDL or BQL | |||||||||
| HSF Pilot-Scale Units | VF Pilot-Scale Units | ||||||||
|---|---|---|---|---|---|---|---|---|---|
| EPs | Kruskal–Wallis Test | Mann–Whitney U-Test | EPs | Kruskal–Wallis Test | Mann–Whitney U-Test | ||||
| Test Statistic | p | Compared CWs | p | Test Statistic | p | Compared CWs | p | ||
| DEP | 6.470 | 0.039 | HSF-R, HSF-C | 0.679 | DEP | 4.160 | 0.125 | ||
| HSF-R, HSF-Z | 0.328 | DIBP | 9.149 | 0.010 | VF-R, VF-C | 0.294 | |||
| HSF-C, HSF-Z | 0.048 | VF-R, VF-Z | 0.008 | ||||||
| DIBP | 1.335 | 0.513 | VF-C, VF-Z | 0.905 | |||||
| DNOP | 3.428 | 0.180 | DNOP | 0.146 | 0.930 | ||||
| DEHP | 0.380 | 0.827 | DEHP | 13.112 | 0.001 | VF-R, VF-C | 0.010 | ||
| TCPP | 1.675 | 0.433 | VF-R, VF-Z | 0.003 | |||||
| CAF | 0.168 | 0.919 | VF-C, VF-Z | 0.971 | |||||
| TCPP | 0.072 | 0.965 | |||||||
| CAF | 1.627 | 0.443 | |||||||
| HSF Pilot-Scale Units | VF Pilot-Scale Units | ||||||||||||
|---|---|---|---|---|---|---|---|---|---|---|---|---|---|
| EPs | Overall Removal | HRT 14d | HRT 20d | Overall Removal | Feeding Strategy A | Feeding Strategy B | |||||||
| HSF-R | HSF-Z | HSF-R | HSF-C | HSF-Z | VF-R | VF-C | VF-Z | VF-R | VF-C | VF-Z | |||
| DEP | 85.4 | 88.1 | 67.1 | 94.1 | 96.9 | 80.2 | 94.6 | 91.9 | 98.8 | 92.6 | 90.0 | 98.5 | 99.5 |
| DIBP | 76.7 | 90.9 | 87.5 | 63.4 | 71.7 | 75.8 | 81.8 | 63.7 | 80.8 | 86.3 | 74.3 | 93.6 | 96.8 |
| DNOP | 90.9 | 82.5 | 87.6 | 90.4 | 96.7 | 94.8 | 92.9 | 88.3 | 87.2 | 94.4 | 94.7 | 96.3 | 96.5 |
| DEHP | 70.7 | 92.1 | 79.1 | 66.6 | 64.8 | 60.7 | 84.0 | 75.1 | 93.8 | 85.7 | 68.7 | 90.4 | 93.3 |
| TCPP | 98.2 | 94.7 | 98.8 | 97.9 | 99.4 | 99.2 | 99.0 | 99.1 | 99.0 | 98.9 | 99.1 | 99.1 | 99.1 |
| CAF | 95.2 | 86.4 | 93.5 | 99.2 | 99.1 | 95.6 | 91.2 | 76.5 | 86.3 | 92.6 | 99.2 | 98.7 | 99.3 |
| HSF Pilot-Scale Units | VF Pilot-Scale Units | ||||
|---|---|---|---|---|---|
| HRT Comparison: 14d and 20d | Feeding Strategy Comparison: A and B | ||||
| EPs | CW Unit | p | EPs | CW Unit | p |
| DEP | HSF-R | 0.882 | DEP | VF-R | 0.642 |
| HSF-Z | 0.162 | VF-C | 0.459 | ||
| DIBP | HSF-R | 0.052 | VF-Z | 0.012 | |
| HSF-Z | 0.183 | DIBP | VF-R | 0.386 | |
| DNOP | HSF-R | 0.361 | VF-C | 0.855 | |
| HSF-Z | 0.040 | VF-Z | 0.500 | ||
| DEHP | HSF-R | 0.020 | DNOP | VF-R | 0.115 |
| HSF-Z | 0.083 | VF-C | 0.082 | ||
| TCPP | HSF-R | 0.201 | VF-Z | 0.374 | |
| HSF-Z | 0.289 | DEHP | VF-R | 0.751 | |
| CAF | HSF-R | 0.027 | VF-C | 0.634 | |
| HSF-Z | 0.276 | VF-Z | 0.751 | ||
| TCPP | VF-R | 0.454 | |||
| VF-C | 0.379 | ||||
| VF-Z | 0.331 | ||||
| CAF | VF-R | 0.076 | |||
| VF-C | 0.516 | ||||
| VF-Z | 0.119 | ||||
Publisher’s Note: MDPI stays neutral with regard to jurisdictional claims in published maps and institutional affiliations. |
© 2021 by the authors. Licensee MDPI, Basel, Switzerland. This article is an open access article distributed under the terms and conditions of the Creative Commons Attribution (CC BY) license (https://creativecommons.org/licenses/by/4.0/).
Share and Cite
Gikas, G.D.; Papaevangelou, V.A.; Tsihrintzis, V.A.; Antonopoulou, M.; Konstantinou, I.K. Removal of Emerging Pollutants in Horizontal Subsurface Flow and Vertical Flow Pilot-Scale Constructed Wetlands. Processes 2021, 9, 2200. https://doi.org/10.3390/pr9122200
Gikas GD, Papaevangelou VA, Tsihrintzis VA, Antonopoulou M, Konstantinou IK. Removal of Emerging Pollutants in Horizontal Subsurface Flow and Vertical Flow Pilot-Scale Constructed Wetlands. Processes. 2021; 9(12):2200. https://doi.org/10.3390/pr9122200
Chicago/Turabian StyleGikas, Georgios D., Vassiliki A. Papaevangelou, Vassilios A. Tsihrintzis, Maria Antonopoulou, and Ioannis K. Konstantinou. 2021. "Removal of Emerging Pollutants in Horizontal Subsurface Flow and Vertical Flow Pilot-Scale Constructed Wetlands" Processes 9, no. 12: 2200. https://doi.org/10.3390/pr9122200