
General Approach for Inline Electrode Wear Monitoring at Resistance Spot Welding


Institute of Manufacturing Science and Engineering, Chair of Joining Technology and Assembly, Technische Universität Dresden, 01069 Dresden, Germany
*
Author to whom correspondence should be addressed.
Processes 2021, 9(4), 685; https://doi.org/10.3390/pr9040685
Submission received: 25 March 2021
/
Revised: 8 April 2021
/
Accepted: 9 April 2021
/
Published: 13 April 2021
(This article belongs to the Special Issue Process Control and Smart Manufacturing for Industry 4.0)
Abstract
:Electrodes for resistance spot welding inevitably wear out. In order to extend their service life, the tip-dressing process restores their original geometry. So far, however, the point in time for tip-dressing is mainly based on experience and not on process data. Therefore, this study aims to evaluate the in-situ or inline wear during the welding process without using additional sensors, and to base the timing for tip-dressing on continuous process monitoring, extending electrode life even further. Under laboratory conditions, electrode wear is analyzed by topographical measurements deepening the knowledge of the known main wear modes of resistance-spot-welding electrodes, mushrooming and plateau forming, and characterizing an electrode length delta over the number of spot welds. In general, electrode wear results in deformation of the electrode contact area, which influences process parameters and thereby weld quality. The conducted tests show correlation between this deformed contact area and the electrode length delta. The study shows that this electrode length delta is visible in actual process data, and can therefore be used as a criterion to characterize the wear of electrodes. Furthermore, this study gives reason to question commonly used spot-welding quality criteria and suggests different approaches, such as basing spot-welding quality on the possibility of nondestructive testing.
1. Introduction
Resistance spot welding (RSW) is a widely used welding process characterized by short processing times of less than 1 s and a very high degree of automation. In addition, no filler metal material is necessary. These are only a few of the essential characteristics of why RSW is one of the most important joining processes in the thin-sheet-metal processing industry. The field of application ranges from manual spot welding in metalworking shops to highly automated areas such as automotive body-in-white manufacturing. These include daily kitchen utensils, such as kitchen sieves, to white goods, such as washing machines, to complex and safety-relevant applications, such as motor vehicles, where resistance spot welding has been successfully used for over 100 years [1,2]. Since the automotive industry has the highest quality standards of spot welds combined with their high number, roughly between 3000 spot welds for a small passenger car [3,4] up to 9500 for a transporter [5], further explanations mainly deal with this challenging application.
To assess electrode wear, it is necessary to understand the high complexity of different electrode-wear mechanisms; therefore, it is important to explain the fundamentals and main principles of the RSW process. A standard RSW process welds two or three steel alloy sheet metals together. The heating of the material can be described by Joule’s law represented by Equation (1), where heat Q is generated by welding current and total resistance over welding time .
Figure 1 shows the schematic process flow of RSW. An external electrode force is applied to the work pieces via two water-cooled and opposing copper electrodes. In general, the welding process can be divided into three phases. These phases are referred to as squeeze time , weld time , and hold time . During squeeze time, the force build-up takes place up to the preset electrode force , followed by weld time, where welding current flows through the work pieces from one electrode to another, causing them to heat up as a result of resistance heating according to Equation (1). Hold time begins after the welding current is switched off. During this time, the electrode force is still applied while the molten material cools down. The duration of hold time should at least be set until the weld completely solidifies. The solidified structure is called a nugget, and its diameter is one of the most important quality criteria.
Equation (1) shows that welding current has a major effect on heat development. Therefore, the welding process and its result can be significantly influenced by the choice of amperage. Total resistance is the sum of contact resistances and individual material resistances , as shown in Figure 2a.
Figure 2b shows the dynamic behavior of individual resistances , and the resulting resistance between sheet metals must be significantly greater than other contact resistances , so that a spot weld is created between the sheets. However, this is only achieved at the beginning of the welding process, since surface roughness greatly reduces the actual contact area. As a result of the continuous heating of the material, the roughness and contact resistances decrease. At the same time, material resistances increase as they are dependent on work-piece temperatures, and thus significantly contribute to the formation of the welded joint. To reduce contact resistances, electrode force must be increased. This is especially important at the contact areas between electrodes and work pieces in order to avoid increased electrode wear [6]. Electrode force also prevents the melt from running out of the joint plane and locally limits the welding current [6].
The temperature at the electrode–sheet interface depends on contact resistances and . Those depend on the coating system of the sheets and their surface condition (contaminated with dust, oil, etc.), the applied electrode force, and the wear condition of the electrodes. The acting mechanical loads caused by the applied electrode force can be as high as 300 , and temperatures of 500 and above [7,8] are reached at the interfaces. For this reason, electrode tips are also actively cooled from inside with water. In most applications, the electrode material used at RSW for the different steel grades is copper alloy CuCr1Zr [9]. At these temperatures, loss in Young’s modulus E is around 20% [10], and in compressive strength of about 30% [11]. Thus, electrodes are subject to major wear due to high thermal and mechanical loads. For CuCr1Zr, many investigations describing the wear mechanisms exist. These include diffusion processes that cause both an increase in the alloy layer and a brazing of electrodes to the sheet metal, which may lead to a partial break-out of this layer from the electrodes. These factors define the resulting wear mechanism. So far, wear mechanisms for the mentioned application can be divided into two major wear modes. Mode 1 is known as mushrooming, whereas Mode 2 can be described as trimming [12] or plateau formation. Both modes are shown in Figure 3.
The wear mechanism by mushrooming is well-known [11,13,14,15,16,17,18,19,20], as it has been around since RSW has been used. Briefly explained, due to thermomechanical stress on the electrode tips, radial material flow can be observed, as shown in Figure 3a. This acts together with a loss of material from the electrode tip surface to cause a decrease in electrodes length [11,19,20,21]. Material loss is repetitive by effects of the local melting, peeling, or breaking out of the brittle alloy layer, called pitting [15,22,23]. Analytical models describing and predicting mushrooming are presented in [21,24,25]. For trimming or plateau forming as the electrode wear mechanism, much less research can be found. One of the first publications on this was by Chang et al. [12], describing trimming. Here, electrode length decreases due to the increasing number of spot welds. The mechanism of plateau formation was deeply investigated in [11,19,20], where an increase in electrode length was shown. This wear mode occurs especially on applications with advanced high-strength steels (AHSS) such as hot-formed 22MnB5 with an aluminum–silicon coating (AlSi). Klages [19] proved that the plateau is not created by the formation of an alloy layer, but by a consecutive deformation process of the electrode during welding. The wear mechanism is shown in Figure 3b. A higher temperature development in the center of the electrode contact surface locally decreases the strength of the electrode material. The surrounding material retains its strength. By displacing the material softened by the heating in the region of the nugget, the electrode material flows towards the direction of the nugget, and the plateau is formed.
Regardless of wear mode, thermal and mechanical stresses lead to diffusion processes and deformations of the electrode contact surface. The result is increased and even accelerated electrode wear and a reduction in process stability. Process instabilities fluctuate the nugget diameter and lead to insufficient weld quality. Since the nugget diameter is one of the most important quality criteria, process capability and monitoring must ensure a high-quality spot weld at any time. To maintain a stable process, electrodes are cyclically dressed. During dressing, the diffusion layer at the contact area of the electrodes is removed, and the original physical properties of the contact area are restored. Timing and volume to be removed are based on experience. This experience can be gained through experiments to determine the electrode life. According to ISO 8166 [26] or SEP-1220-2 [27], the life is reached when
of a test sheet, where is the weld diameter after destructive testing (DT), and t is the thickness of the thinner sheet metal. Since experiments are carried out under laboratory-like conditions, the timing of the tip dressing at production is chosen long before the life-cycle limit of the electrodes is reached. This usually results in an excessive amount of the material being removed. To address the right timing for tip dressing, continuous process monitoring is necessary. This can be performed during or after the welding process. Monitoring or quality assessment after welding always brings a delay and additional process steps. For quality assessment by DT and nondestructive testing (NDT), using manual ultrasonic testing, was established [28]. Both variants are labor-intensive and expensive. Hence, the in-situ or inline process monitoring of electrode wear is preferred. On the basis of derived results from extensive studies on electrode wear, this paper presents a methodology to assess the wear mechanism by different measuring concepts. Investigations include data analysis of the RSW process and three-dimensional topographical measurements of the electrodes. To present the high industrial potential of the elaborated results, possible solutions using only already industrial integrated measurements are shown.
2. Materials and Methods
2.1. Material Combinations
The used material combinations (MC) are shown in Table 1. MC01 and MC02 were selected in such a way that both electrode-wear mechanisms were represented as well as possible. MC01 consisted of two 2 mm thick galvanized HX340LAD steels. It is a microalloyed steel with high yield strength that is mainly used for cold-formed parts of a car body [29]. MC02 consisted of two hot-stamped steels, 22MnB5 + AlSi. Due to the combination of deformation and hardening abilities, those steels are used for load-bearing bodies and safety-relevant parts in the automotive industry [30].
2.2. Experiment Setup
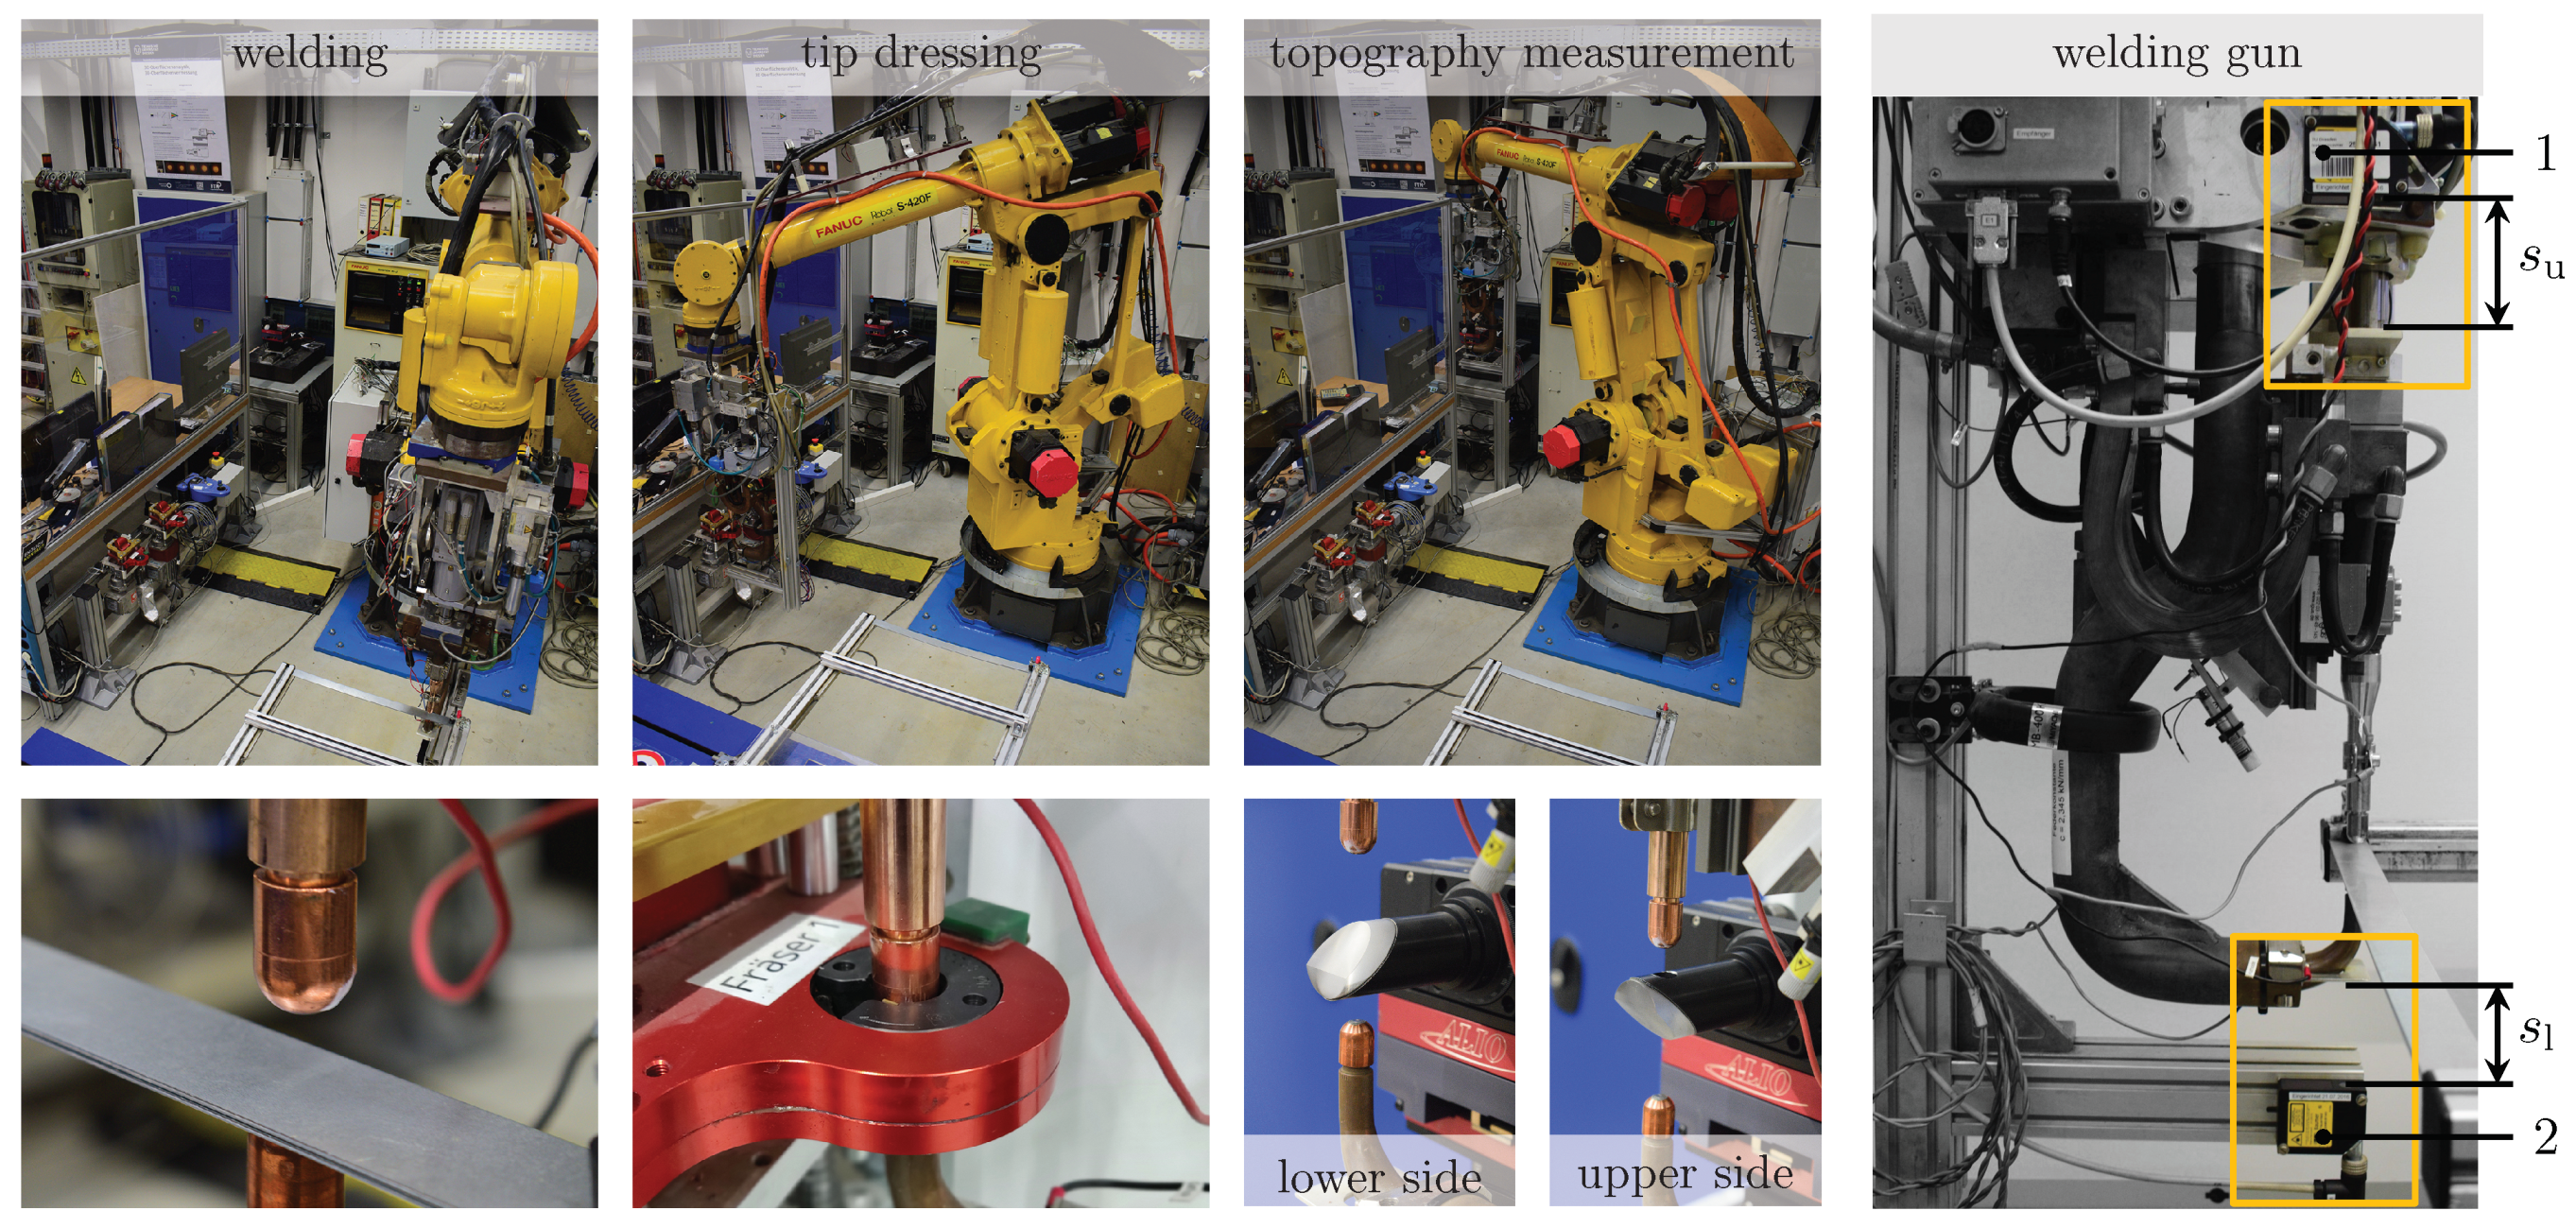
The experiment setup was a configuration of three individual modules interacting with each other. The first module was the welding gun installed on a six axis industrial robot (Figure 4), the second module was the tip dresser, and the third was a chromatic confocal microscope. The robot could move the welding gun to the tip dresser and directly into the measuring range of the microscope. The latter made it possible to measure the 3-dimensional (3D, x–y plane, height z) topographies of both electrodes while being installed on the welding gun. For this purpose, the microscope was equipped with a special rotating measuring head. This unique experiment setup allowed for the continuous wear assessment of the electrodes. Figure 4 shows the robot in all three positions for welding, tip-dressing, and topographical measurements.
2.3. Test Procedure
The test procedure and sequence are shown in Figure 5. Before each test set (TS), electrodes were initially dressed, followed by 3D topographical measurements. Afterwards, test sheets and wear sheets were alternately welded. Test sheets were used to assess wear by determining weld diameters from the second to the penultimate spot weld by means of a destructive chisel test according to ISO 10447 [31]. After each test sheet, topographical measurements of both electrodes and both surfaces of the last spot weld of a test sheet were carried out. Wear sheets served to generate wear on the electrodes, and no weld diameters were determined. This procedure was repeated until number of spot welds equaled number of predefined spot welds . is based on results of previous lifetime investigations carried out in [11]. Geometric dimensions and the number of spot welds of the sheets can be seen in Table 2. Process data were recorded for both types of sheet metal.
2.3.1. Welding Preferences
The welding equipment consisted of a servoelectric C-type welding gun with stiffness of . The welding current was provided and controlled by a medium-frequency inverter of using constant current control. The different number of spot welds of the TS between MC01 and MC02 resulted from the different geometrical dimensions and properties of the sheet metals. The target spot-weld diameter at the start of each test was chosen to be , where t is the thickness of the thinner sheet metal of the corresponding faying surface, determined by weldability lobes according to SEP 1220-2:2011 [27]. The chosen welding parameters are listed in Table 2. The process data for each individual weld were measured with a frequency of 100 . The measured process data and starting conditions were kept constant for each MC:
- , , , ;
- for MC02 prepulse time and pause time ;
- cooling-water flow rate and temperature range ;
- welding currents (main pulse) and for MC02 prepulse welding current .
The following process data were acquired in a time-resolved manner:
- welding current ;
- welding voltage ;
- electrode force ;
- upper-electrode displacement ;
- lower-electrode displacement ;
- cooling-water flow rate (general monitoring);
- cooling-water temperature (general monitoring).
2.3.2. Tip Dressing
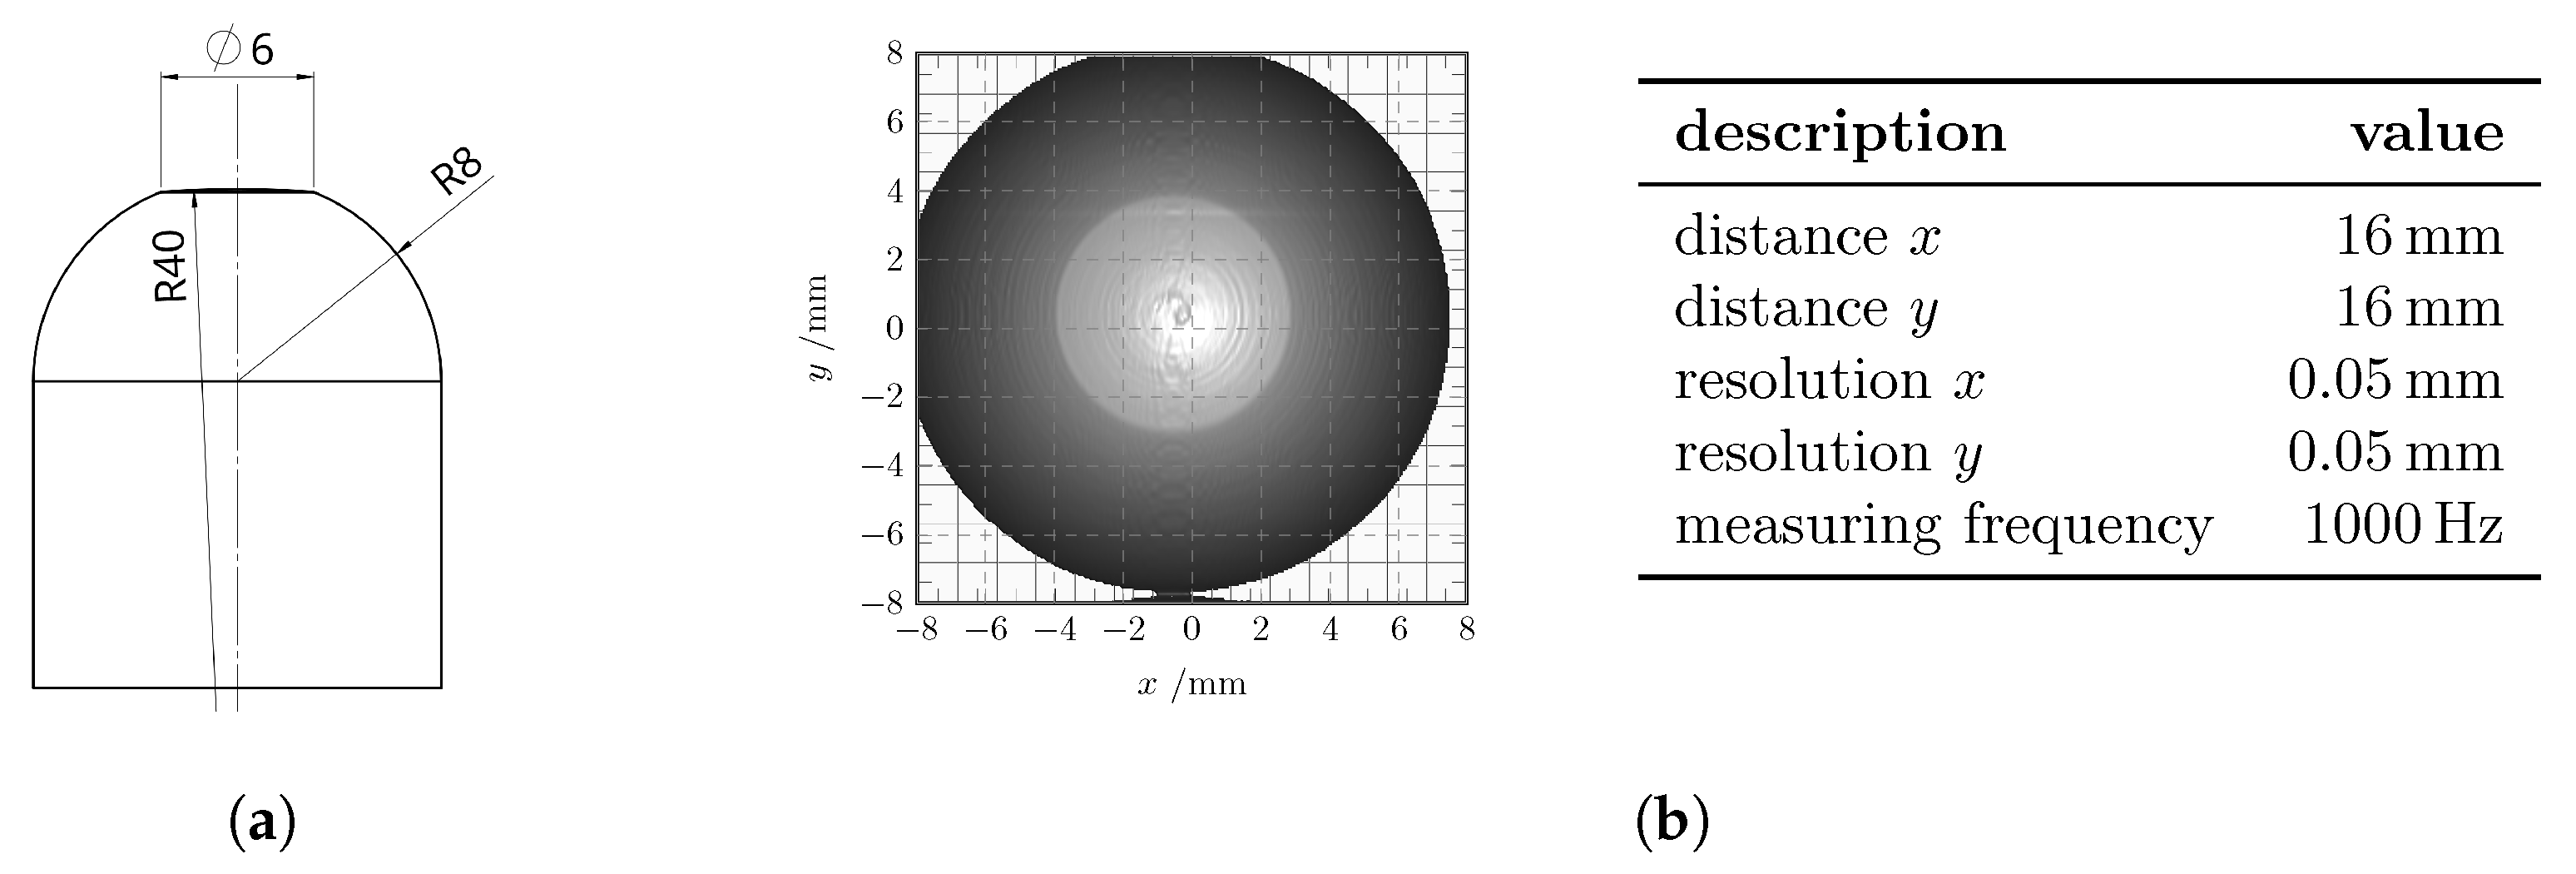
For the initial electrode geometry preparation, a tip dresser with a rated speed of 390 was used. The tip dresser realized an initial electrode geometry according to DIN EN ISO 5821 F1-16-20-40-6 for all experiments, as shown in Figure 6a.
2.4. Assessing Electrode Wear
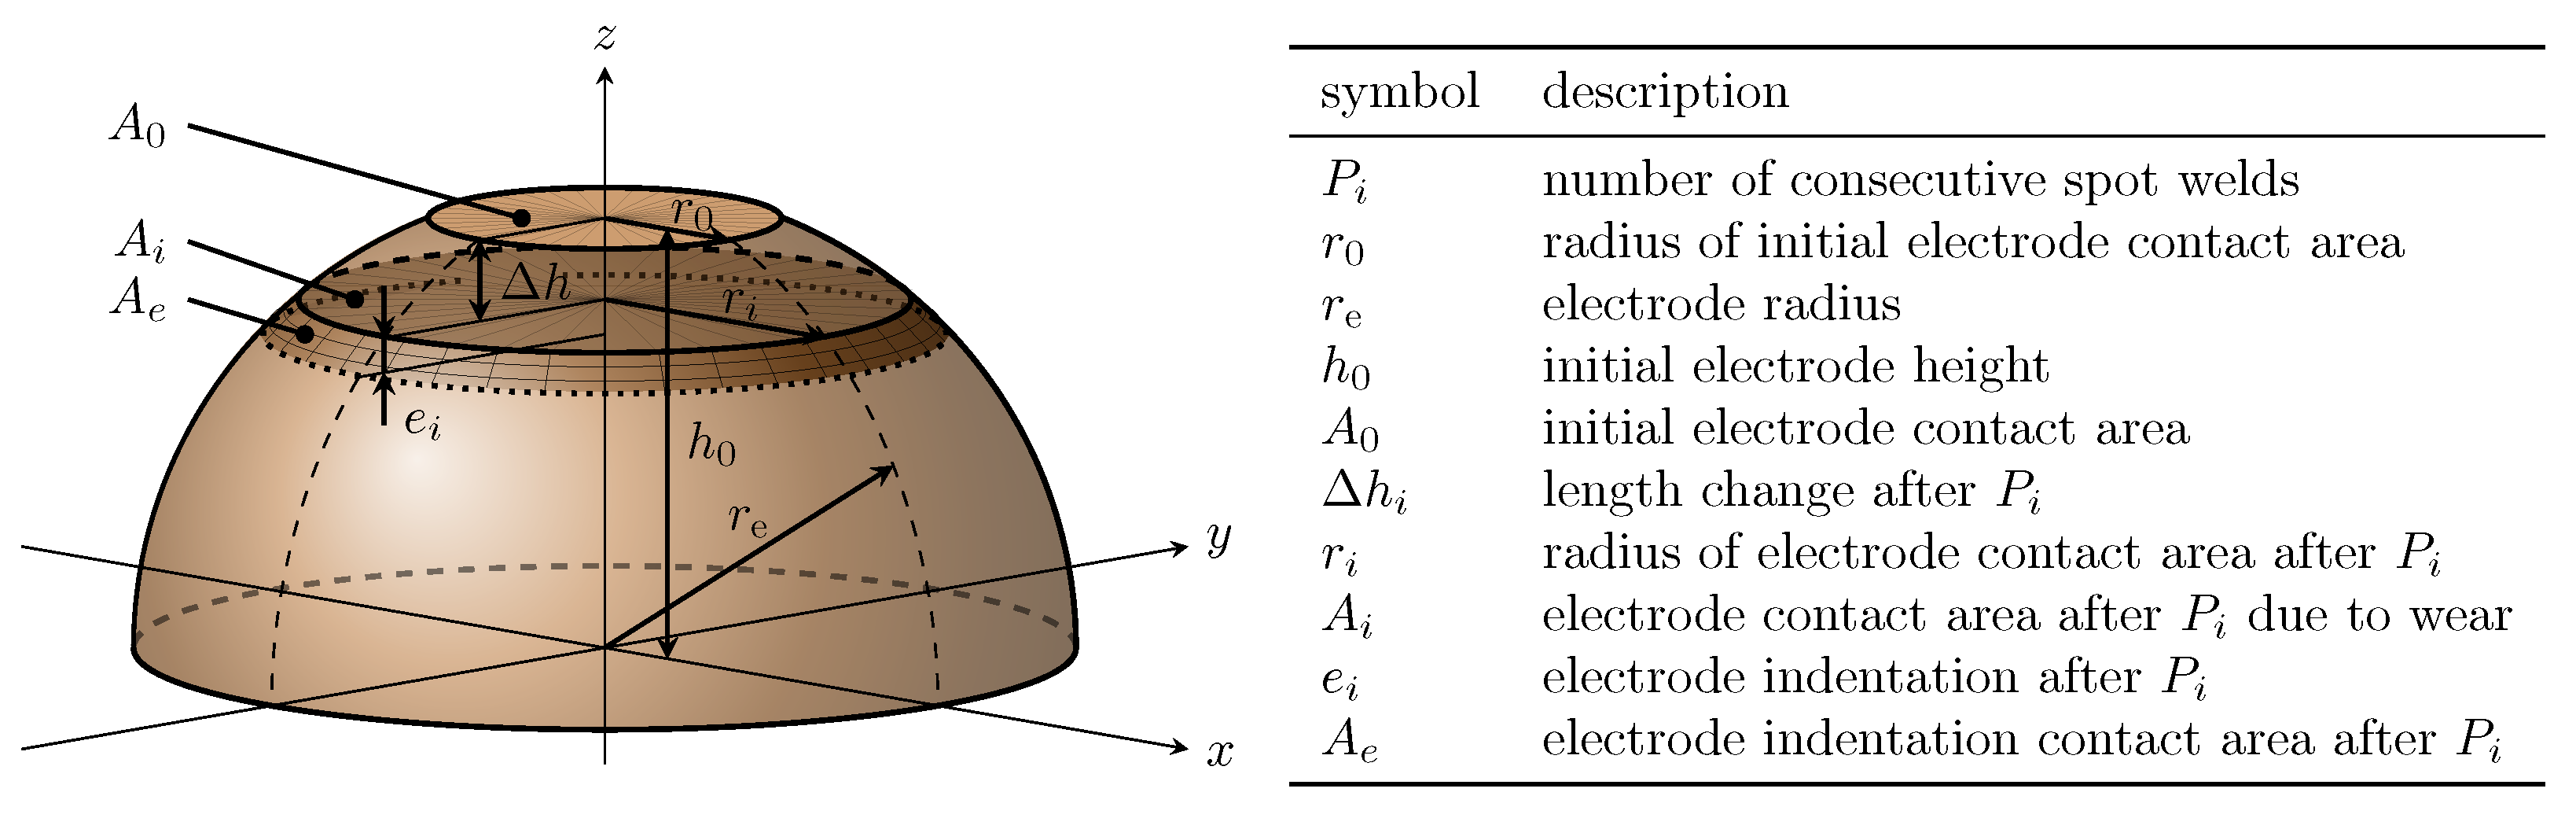
The main geometric parameters to describe and assess electrode wear are shown in Figure 7. For simplicity, the spherical radius of the contact area was neglected. Parameters were also selected by Zhang et al. [32], who measured axial wear or length change by the servo gun movement. In this paper, movement of the upper and of the lower electrode was measured by laser-triangulation sensors attached to the welding gun for each electrode. In addition, was determined by 3D topographical measurements. To distinguish between the two measurement concepts for , the following nomenclature was chosen:
- : determined using 3D topographical measurements.
- : measured by laser triangulation during process.
For further calculations, reference was made to the following equations, which resulted from the geometrical parameters of Figure 7:
2.4.1. Determining by 3D Topographical Measurements
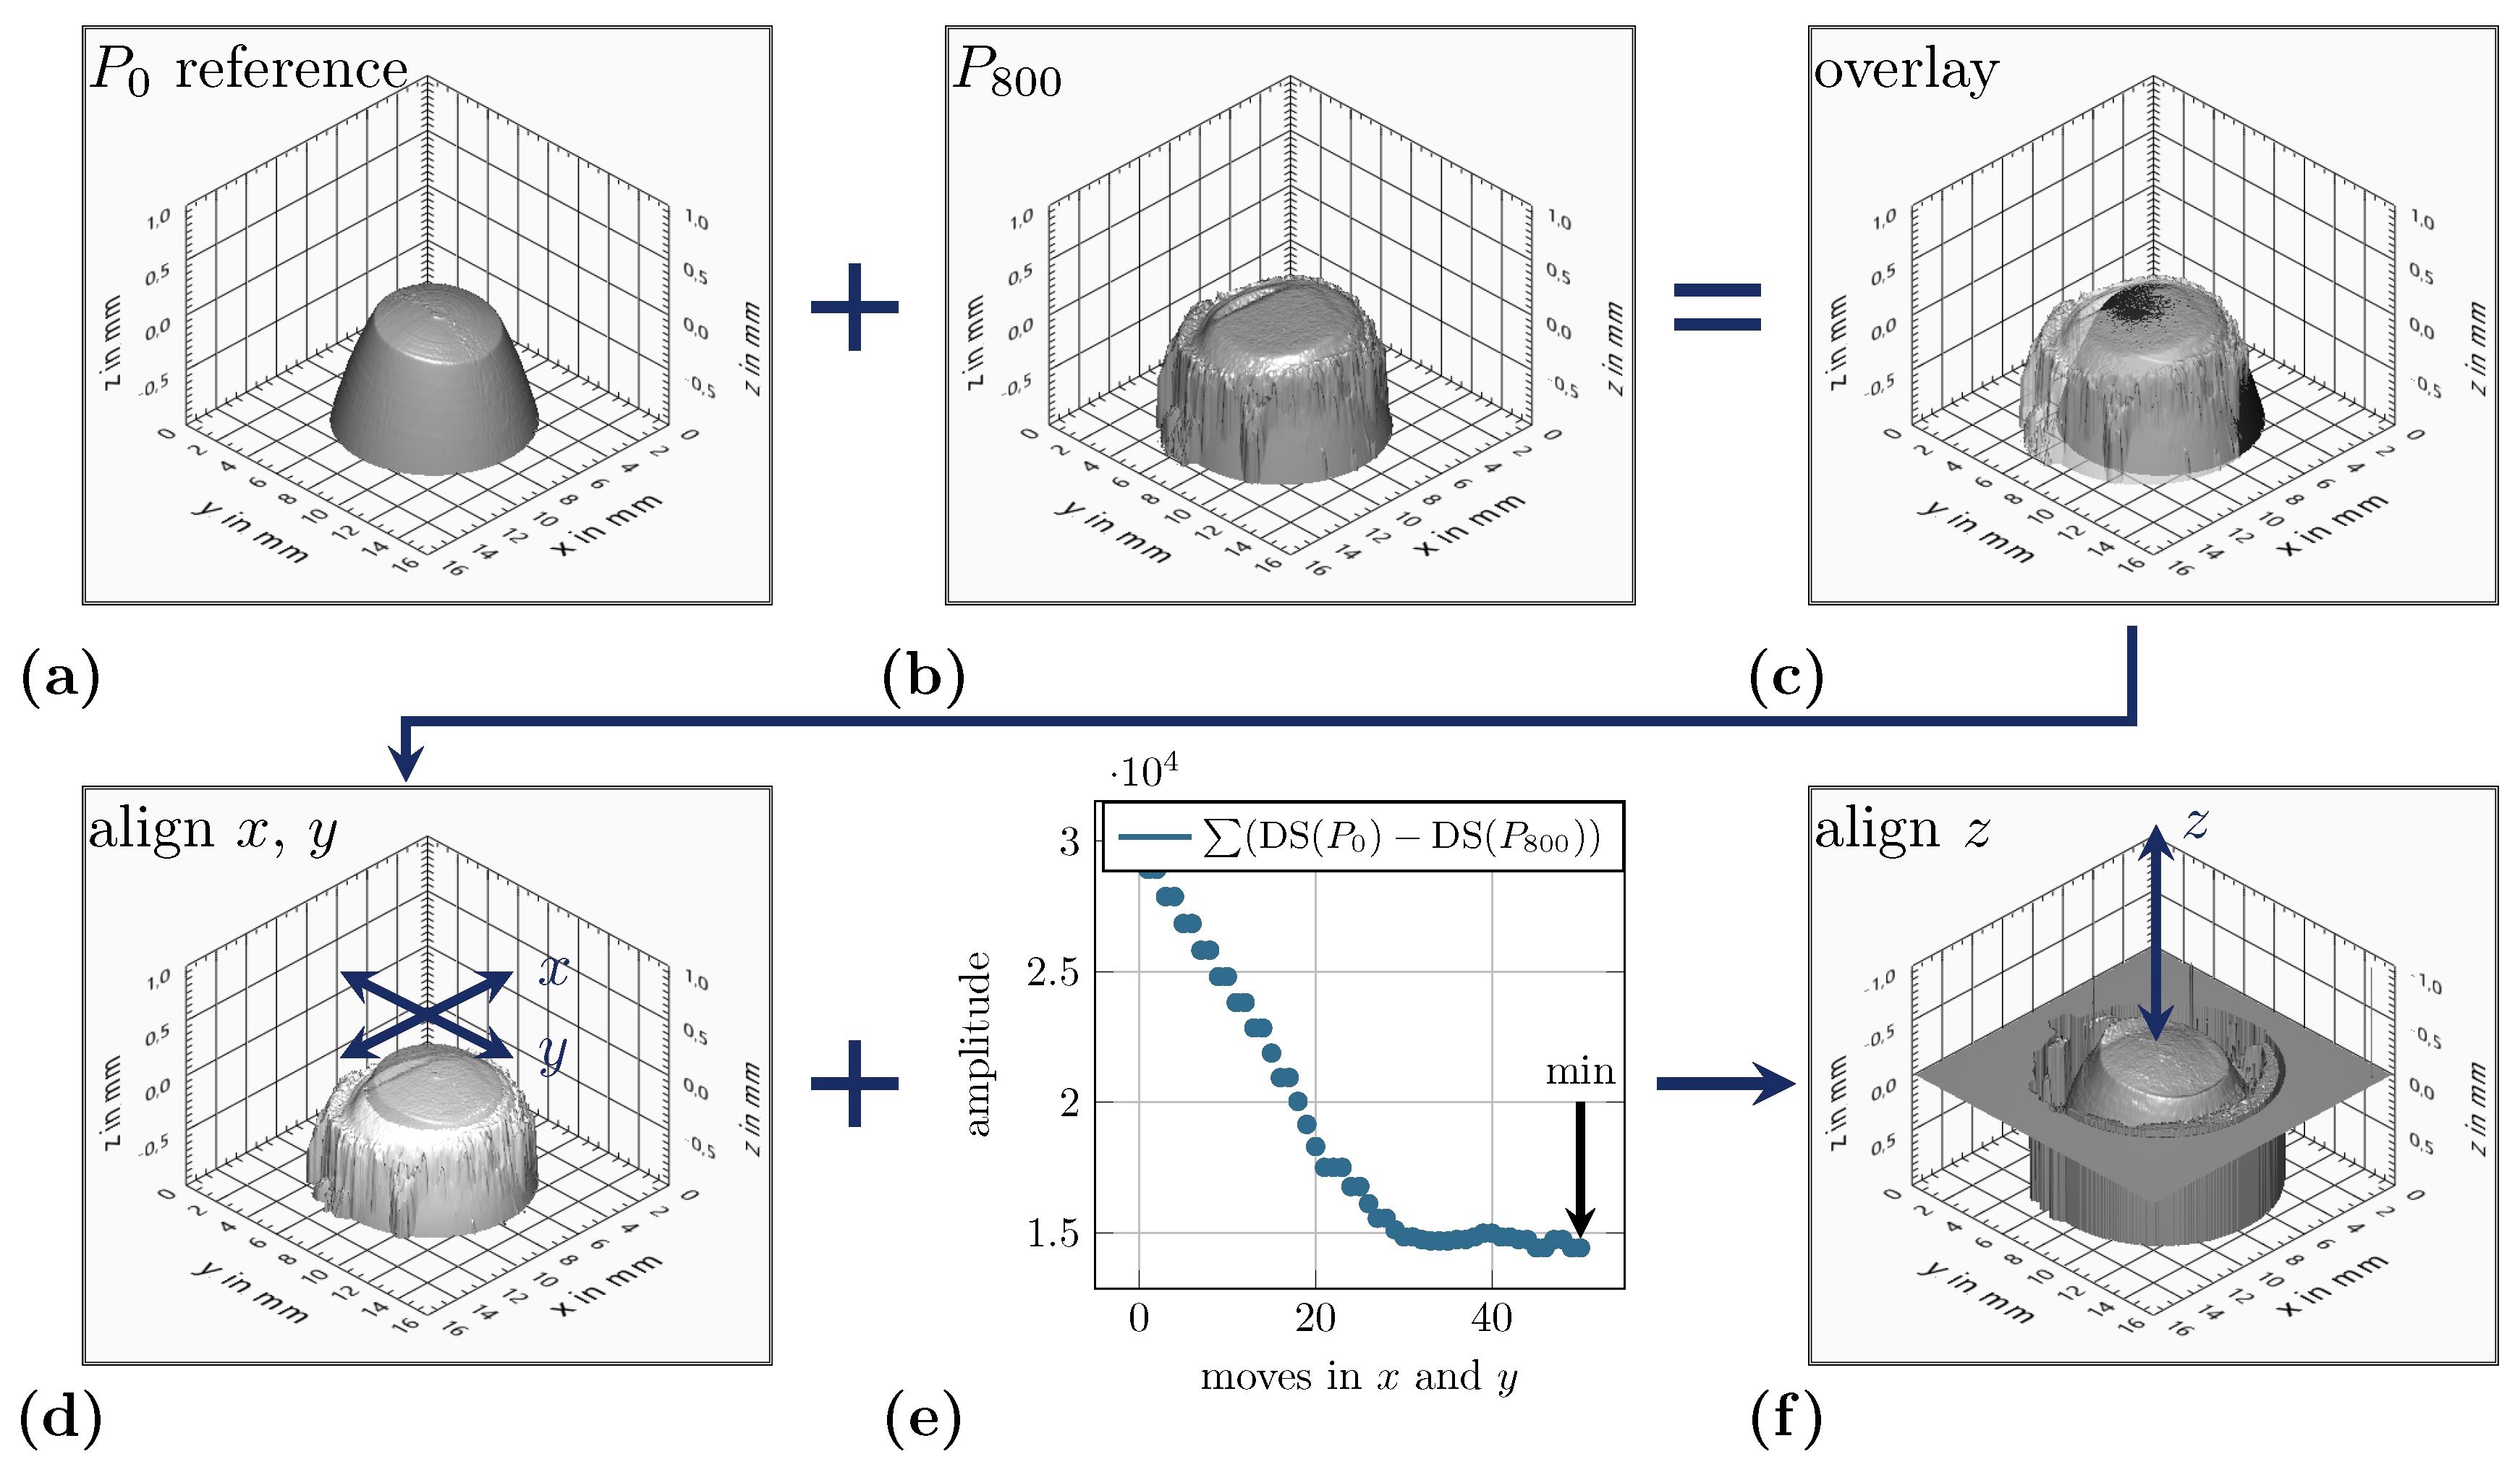
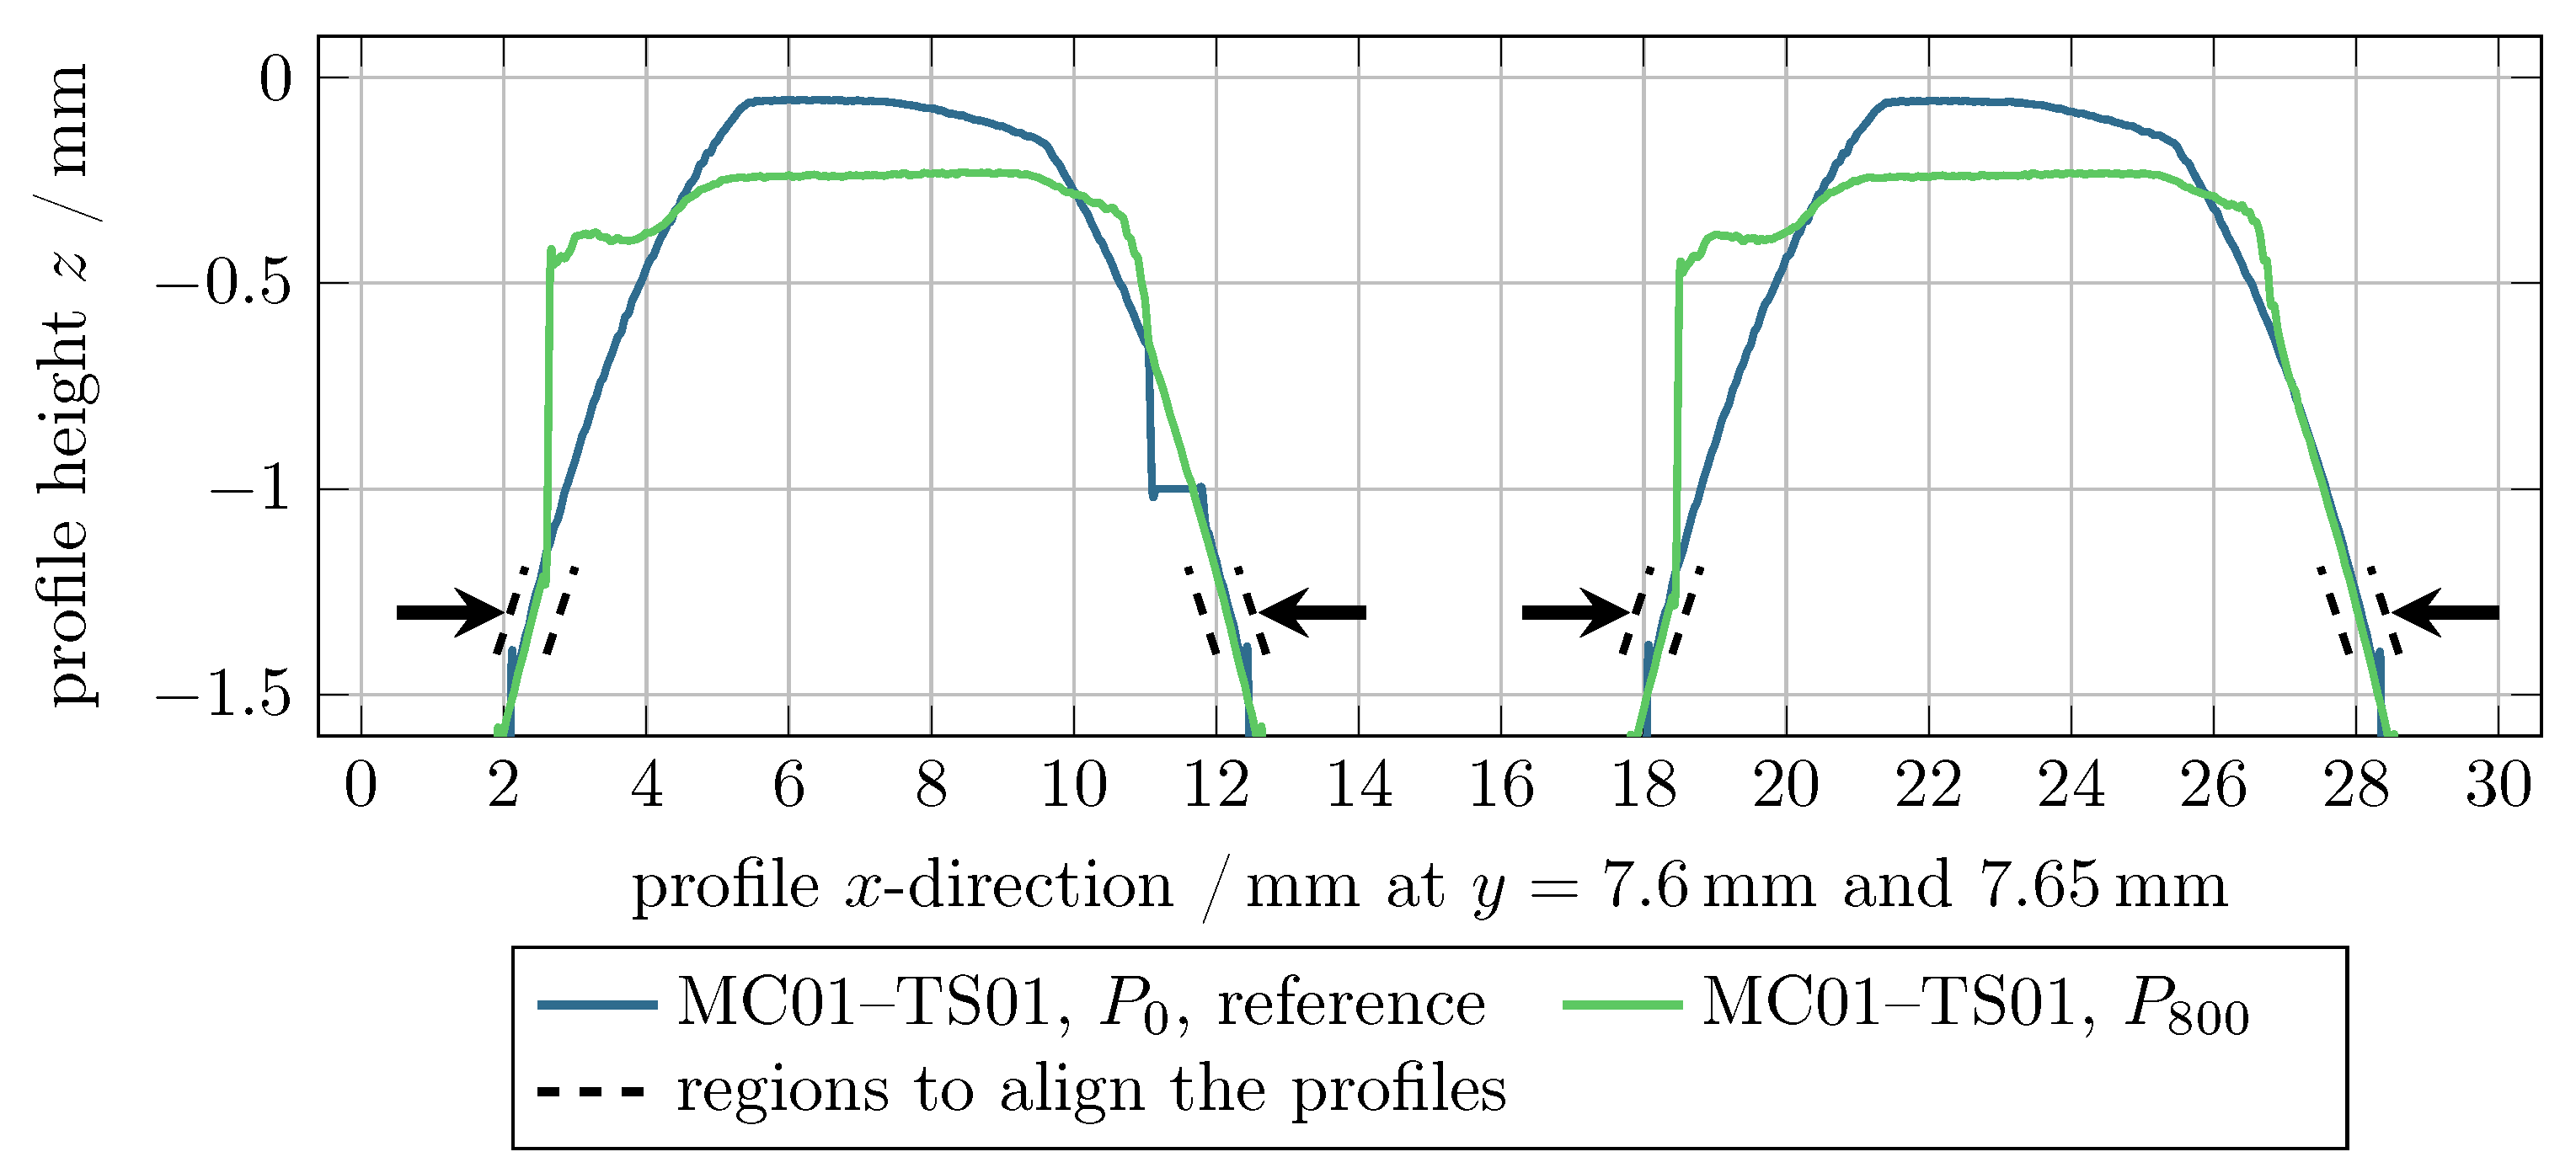
Surface-topography measurements of the electrodes were carried out with the chromatic confocal microscope mentioned in Section 2.2. These high-resolution measurements included both electrodes while they were installed on the welding gun and delivered continuous documentation of electrode wear. The first measurements on both electrodes were carried out right after tip dressing and continuously after each test sheet (8, 200, 400, ⋯, 1200) for MC01. Due to the expected high electrode wear of MC02, measurements were carried out after 12, 38, 64, 90, and 102 welds in the beginning. Then, every further measurement was conducted after each test sheet, as for MC01. The last spot weld of every test sheet was also measured on both sides. The combination of these measurements with the recorded electrode displacement during welding was used to estimate the contact areas between electrode and sheet metal at the respective welding end, and to characterize the wear in more detail. An example measurement after tip dressing and measurement parameters is summarized in Figure 6b. To assess from the topographical measurement, each data set (DSDS) had to be aligned to a reference DS as shown in Figure 8. This is necessary because the positioning accuracy of the robot lays in the range of . The corresponding DS of was always used as a reference. The DSs were first aligned by moving them in the x–y plane and searching for the minimal difference between the two DSs (Figure 8e). To align in the z direction, profile sections were used as demonstrated in Figure 9. The DS was shifted in the z direction until uninfluenced regions had been aligned one above the other, which applied to the flanks of the electrodes (marked as dashed lines in Figure 9). was then the difference of the highest point of DS of minus DS of .
2.4.2. Determining during Welding Process
The total difference in electrode displacement was calculated by Equation (7), and for each electrode by Equation (8). However, the assumption of these equations could only be made if the wear of the upper and lower electrodes was nearly symmetrical. Symmetric wear applies for symmetric MC and the same electrode geometries on both sides, which could be proven by metallographic examinations in [11], and applied for the chosen MC of this paper. Change in length over the number of spot welds could then be calculated by Equation (9) as in [32]. was negative for decreasing and positive for increasing electrode length. The model in Figure 7 can mainly be used for mushrooming wear mode. The model and its geometric parameters cannot be easily adapted to plateau formation, since the deformation mechanisms are much more complex. Here, topographical measurements help to explain the wear mechanism in more detail.
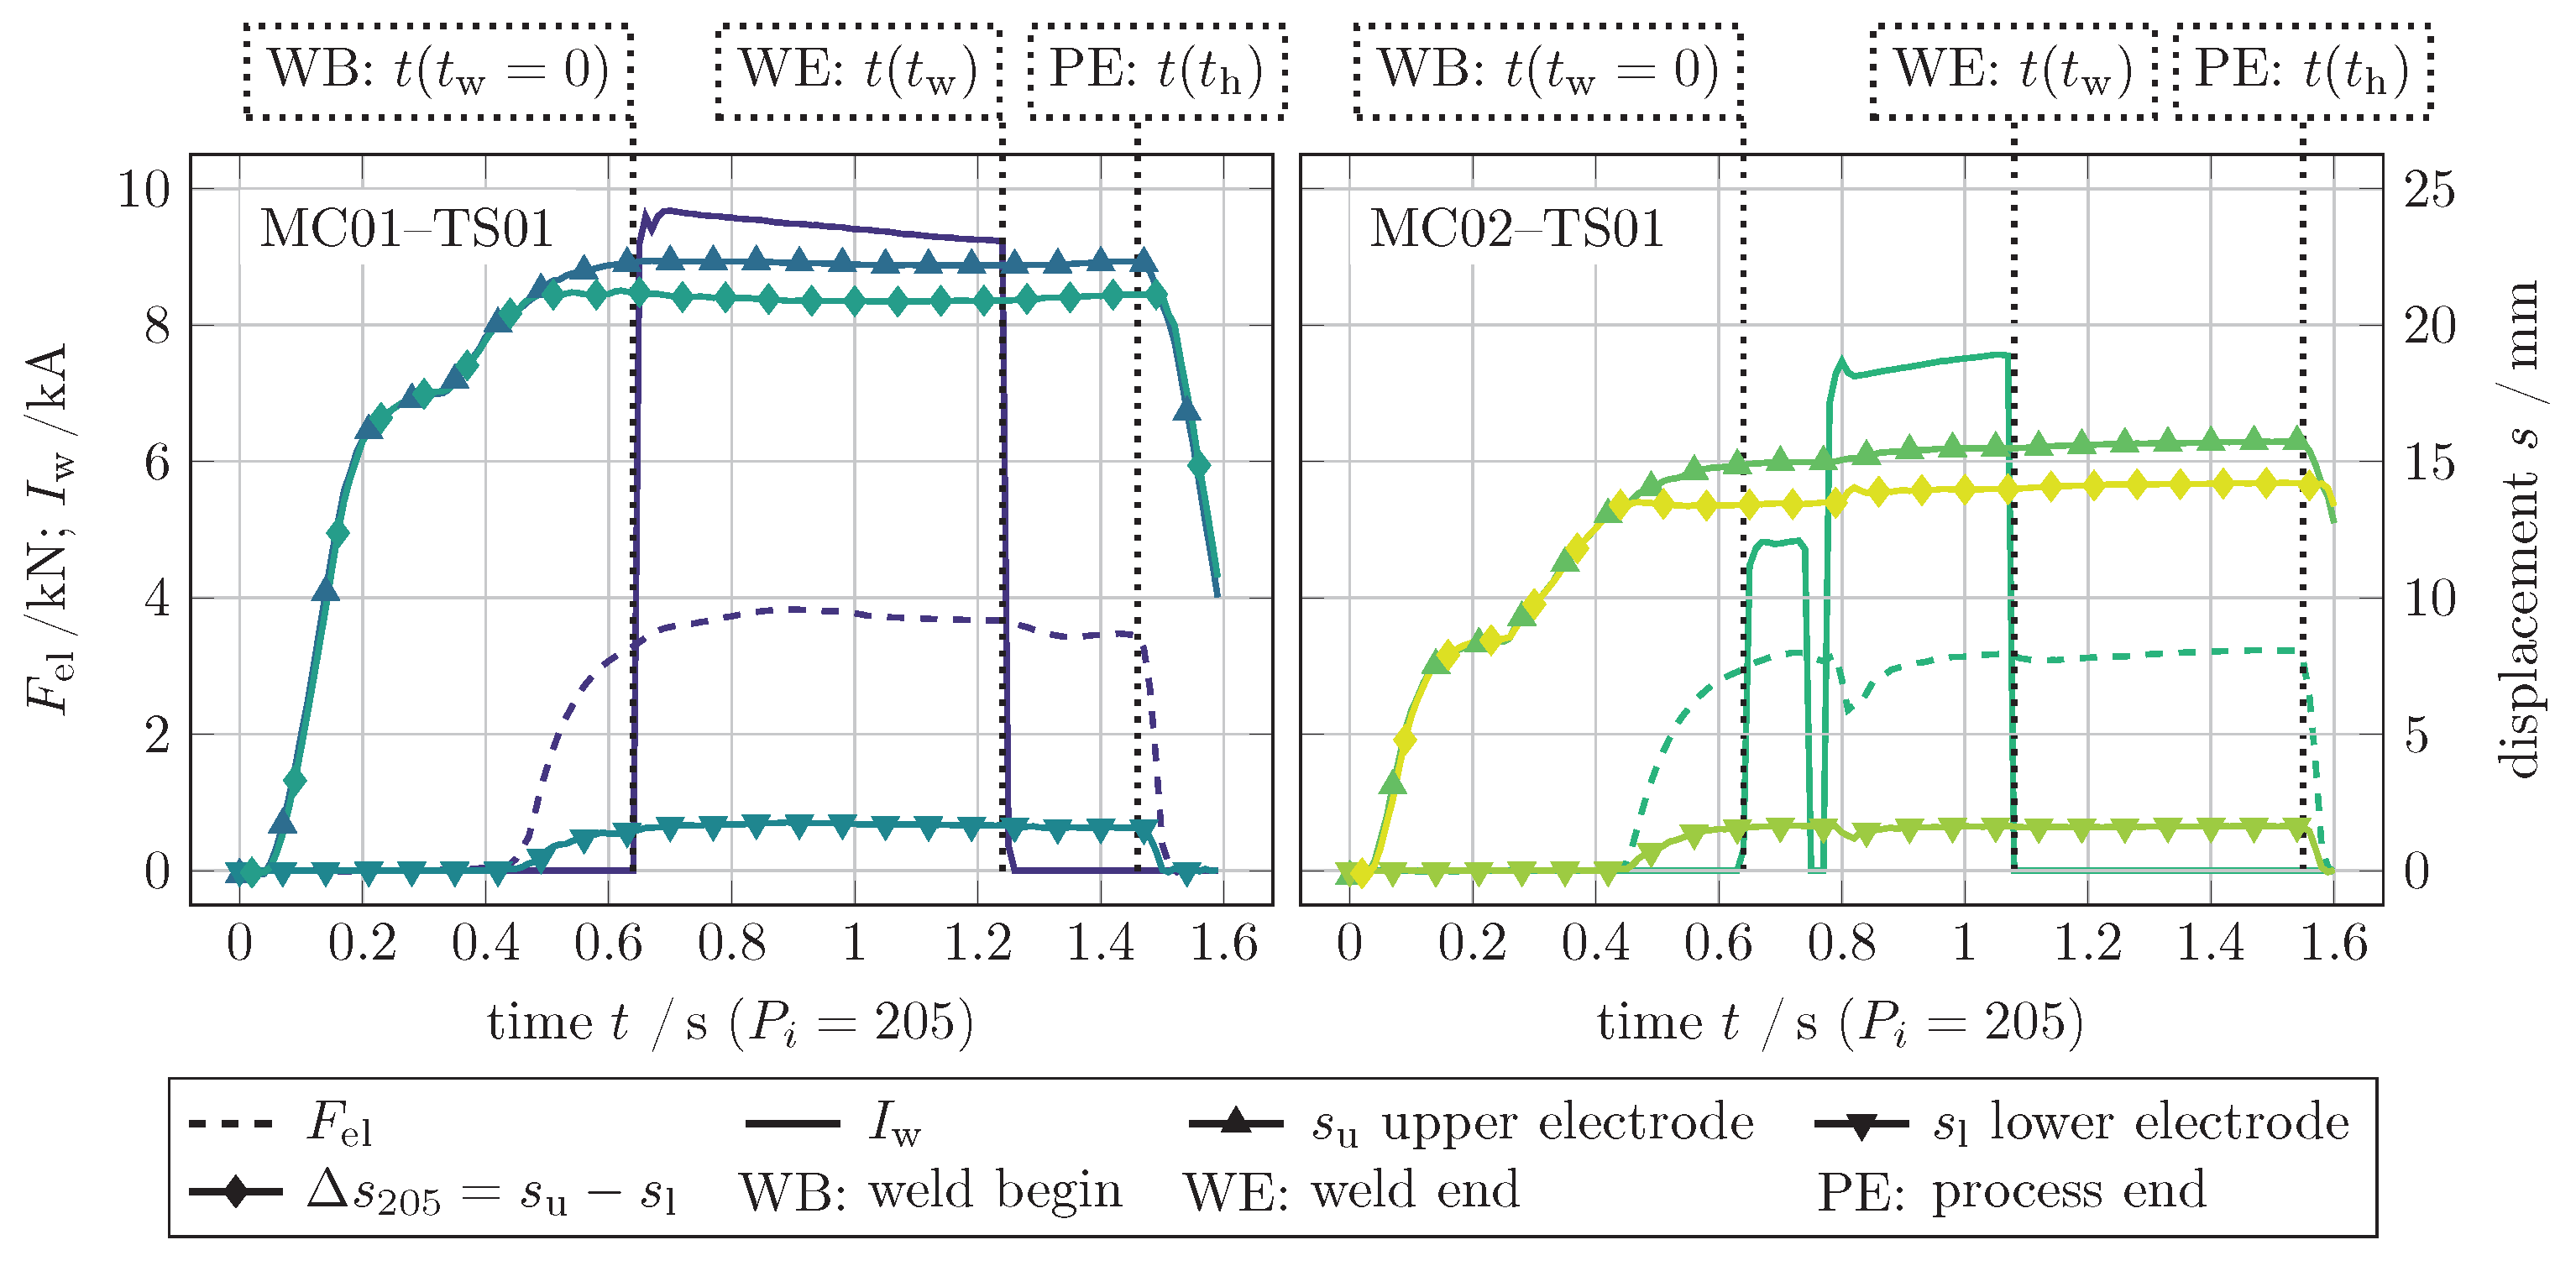
To evaluate the condition of the electrodes, displacement measurements were determined at certain timing positions in the process as shown in Figure 10: weld begin (WB), weld end (WE), and process end (PE). These positions show the following characteristics:
- WB:
- beginning of welding, no nugget, no heat in components, negligible electrode indentation e;
- WE:
- end of welding, molten nugget, components at max heat, max thermal expansion;
- PE:
- end of process, solidified nugget, max electrode indentation .
Figure 10 also demonstrates the course of measured process data , , , , and the resulting . The parameter course of MC01–TS01 showed no evidence of problems during welding. In comparison to that, MC02–TS01 was a good example for the appearance of an expulsion. At around an increase in and a huge drop in and could be observed. These are typical phenomena for expulsions during welding.
3. Results
3.1. Welding Results
Measured weld diameters after DT over the number of spot welds decreased slightly for both MC (Figure 11). While of MC01 showed little variation with a small range, strongly fluctuated at the beginning and from around 400 spot welds of MC02. Looking at the occurrence of weld expulsions, MC01 and MC02 showed huge differences. Whereas nearly no expulsions occurred in MC01, they appear in almost every weld of MC02 at the sheet interface.
3.2. Results of 3D Topographical Measurements
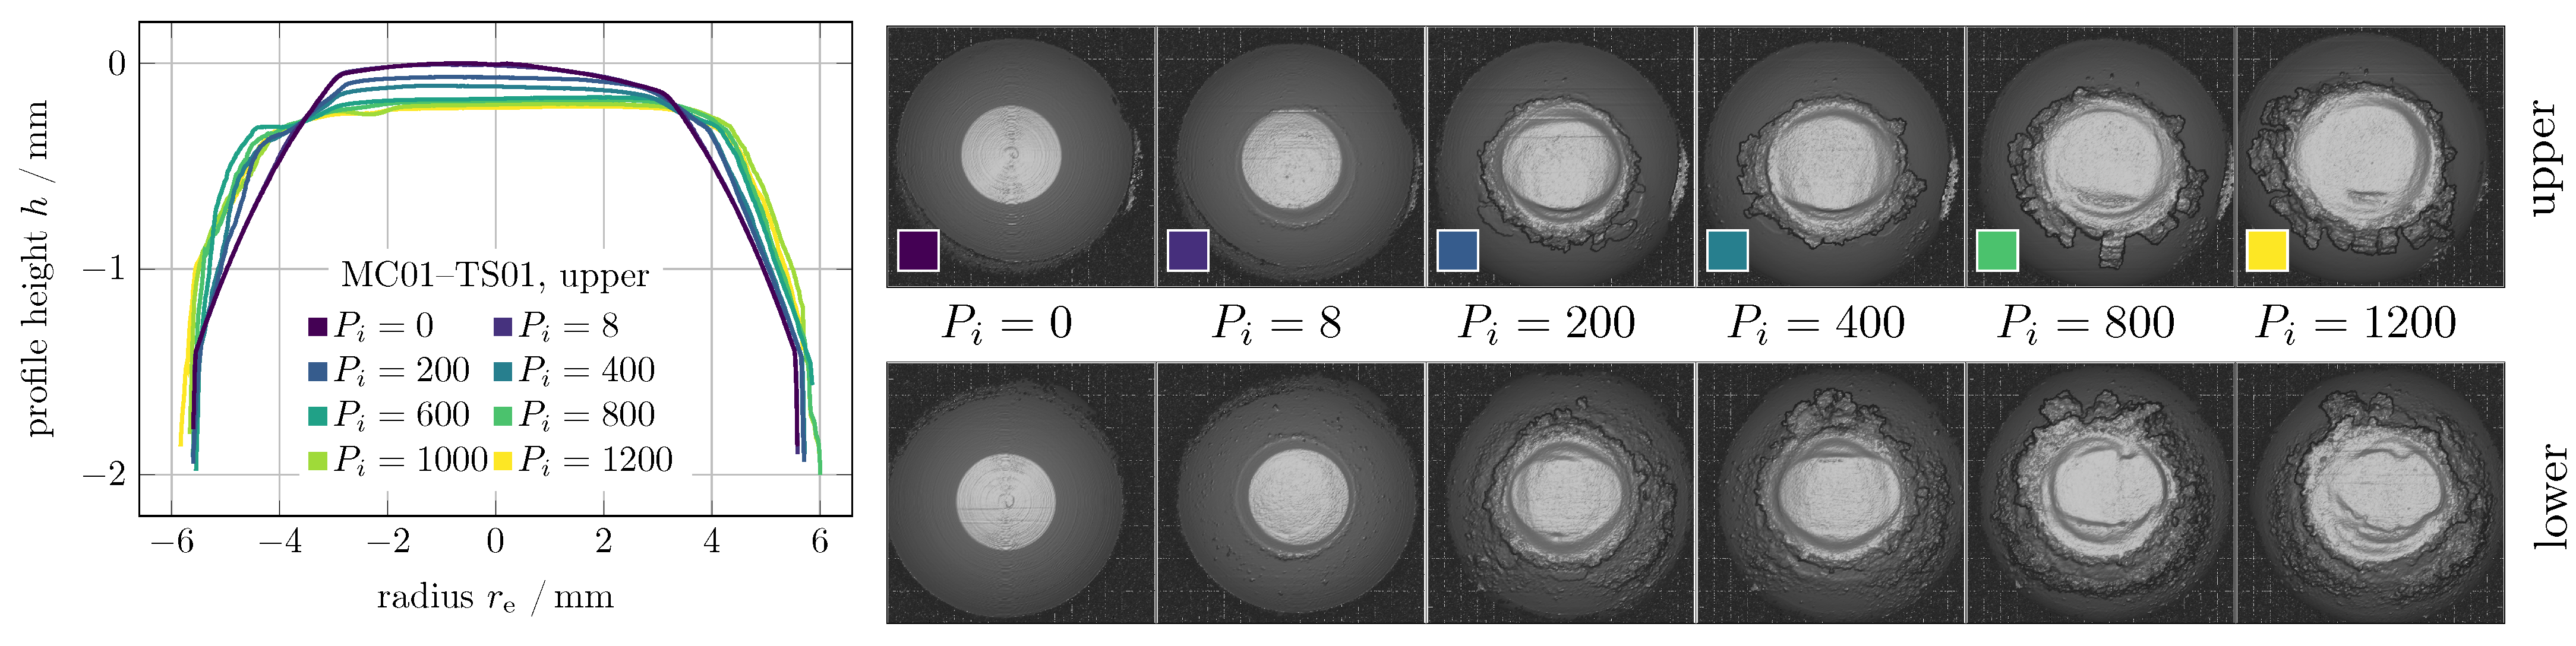
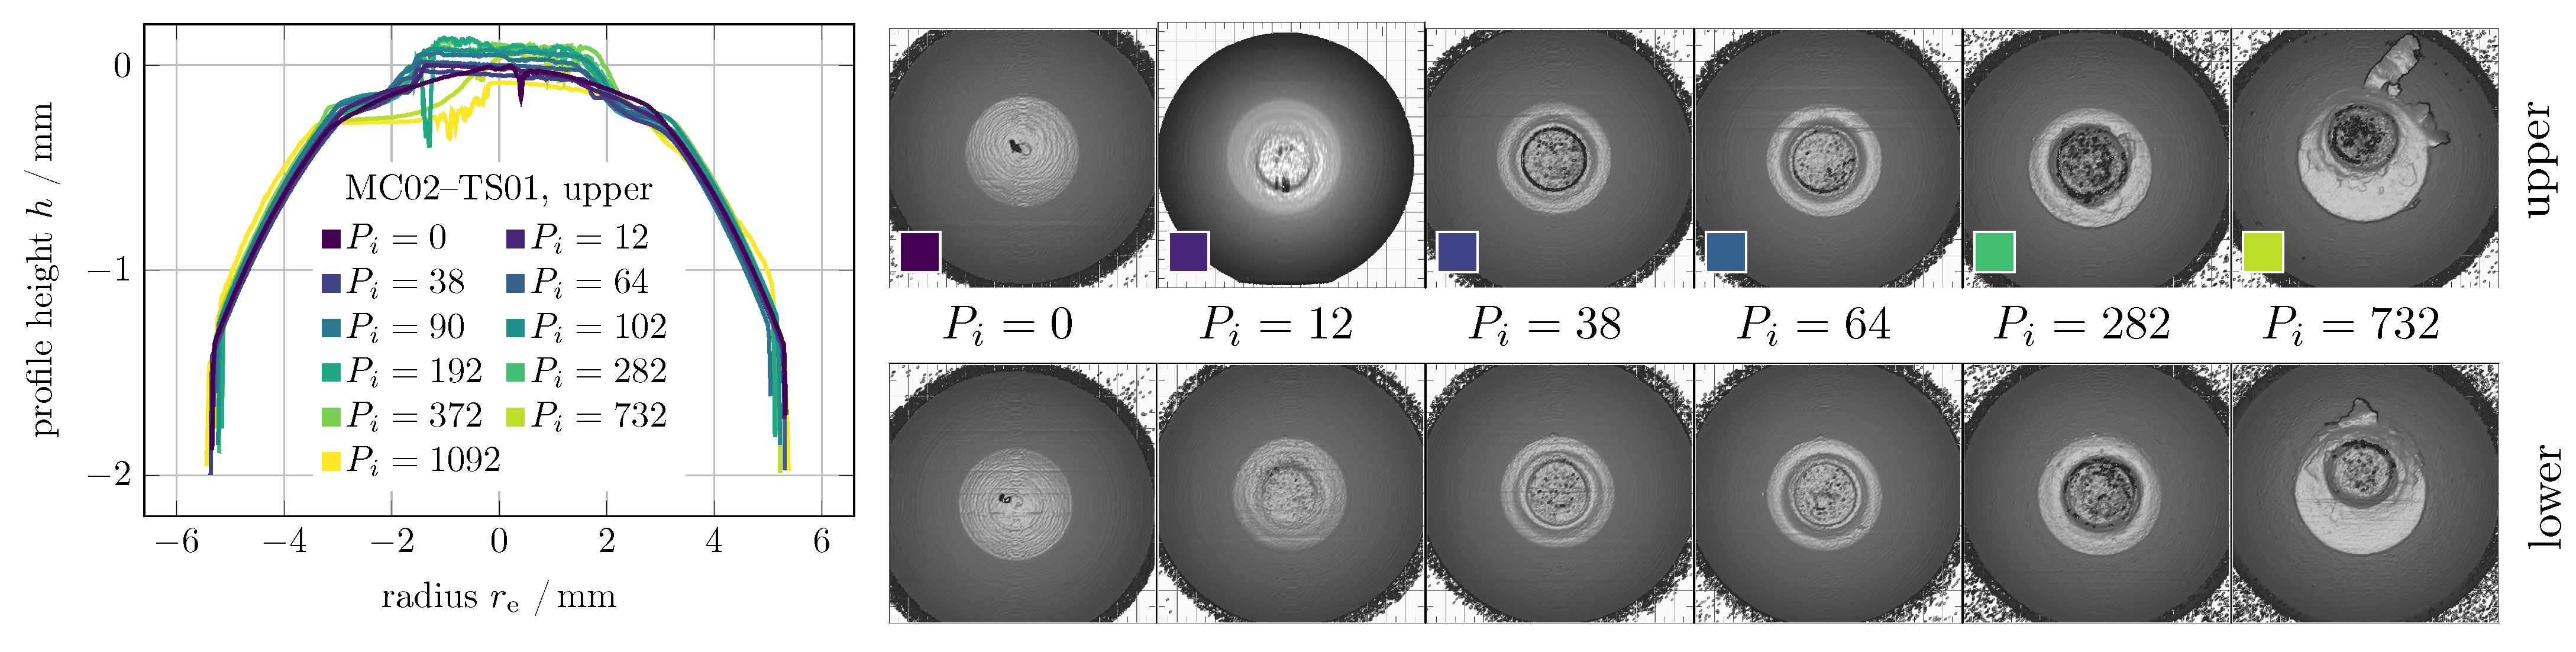
Figure 12 and Figure 13 show profile sections and selected 3D topographical measurements of the electrodes of the respective TS01 at different stages. In both figures, the images of show the electrodes right after tip dressing. The wear caused by the progressive change in the contact surface can clearly be seen with the increasing number of spot welds. In MC01, an enlargement of the electrode contact area can be seen in the radial direction. According to [32,33], the radial widening of electrodes leads to axial wear due to the law of constant volume. Crater formation can also be observed on the surfaces, especially at the upper electrode at and . Local melting or breaking out of the brittle alloy layer, which is known as pitting [34], forms these craters. Coating materials with a low melting temperature such as zinc () can penetrate these craters and come into contact with the electrode material again. Mechanical stresses and the weld current flow are concentrated in the edge area of the crater, which can lead to accelerated material removal and crater growth. Besides this, the top view of the electrodes also shows a slight plateau. This is not comparable to the wear mode of plateau formation. In fact, this can be called trimming as the length of the electrode decreases [12]. In MC02, the distinctive plateau formation occurred after just a few welds. With a higher numbers of welds, the plateau increasingly moves out of the center of the electrode in the direction of the opening of the welding gun, which might be because of the elastic bending of the welding gun. Comparing the two figures, the 3D topographical measurements revealed a clear difference between the two wear modes. Mushrooming can be observed at MC01 (Figure 12) and plateau forming at MC02 (Figure 13). Both figures show symmetrical wear of the upper and lower electrodes, as assumed before. The flanks of the profile sections were not aligned one above the other as described in Section 2.4.1 in both figures. This is due to the calculation of the profile sections. Each section is the mean course of 36 individual profile sections rotating around the center of electrode with angular spacing of .
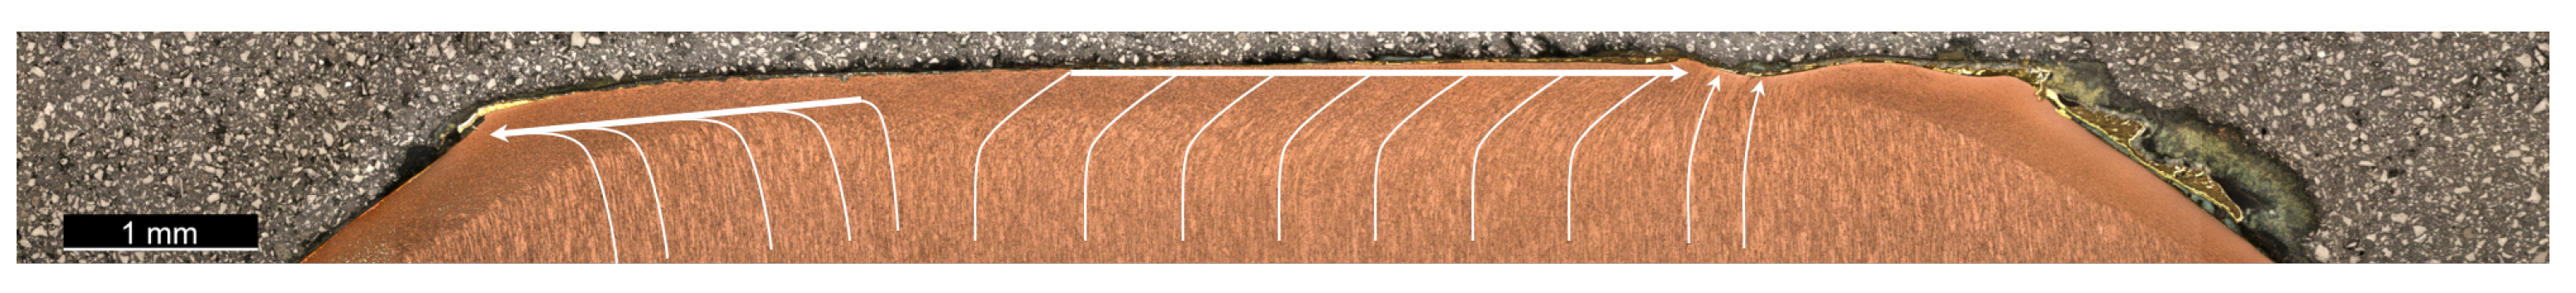
The radial flow and loss of material from the electrode surface caused the electrodes to decrease in length. Figure 14 shows a cross-section of the anode of MC01–TS01 after 1200 spot welds. The etched structure shows material flow in the radial direction near the electrode surface. Furthermore, material deposits can be seen at the edge of the electrode. Loss of material is caused by the formation and destruction of alloy layers [15].
Axial flow that forms a plateau is shown in Figure 15, where a shift of the plateau out of the center occurred. Measuring plateau diameter and height proved that the plateau formation was happening after just a few spot welds, as shown in Figure 16 and already indicated in Figure 13. Plateau diameter was determined in the top view of the measurements by the mean value of longest diameter and perpendicular to it (Equation (10)). The plateaus show no numerical eccentricity. This allows the area of the plateau to be calculated by the conventional formula for calculating the area of a circle without any further restrictions (Equation (11)). is determined via profile sections of the electrodes. It should be noted that is immediately constant, whereas is gradually increasing. There are no significant differences between anode and cathode at MC02–TS01 and slight differences a MC02–TS02.
3.3. Assessing by 3D Topographical Measurements
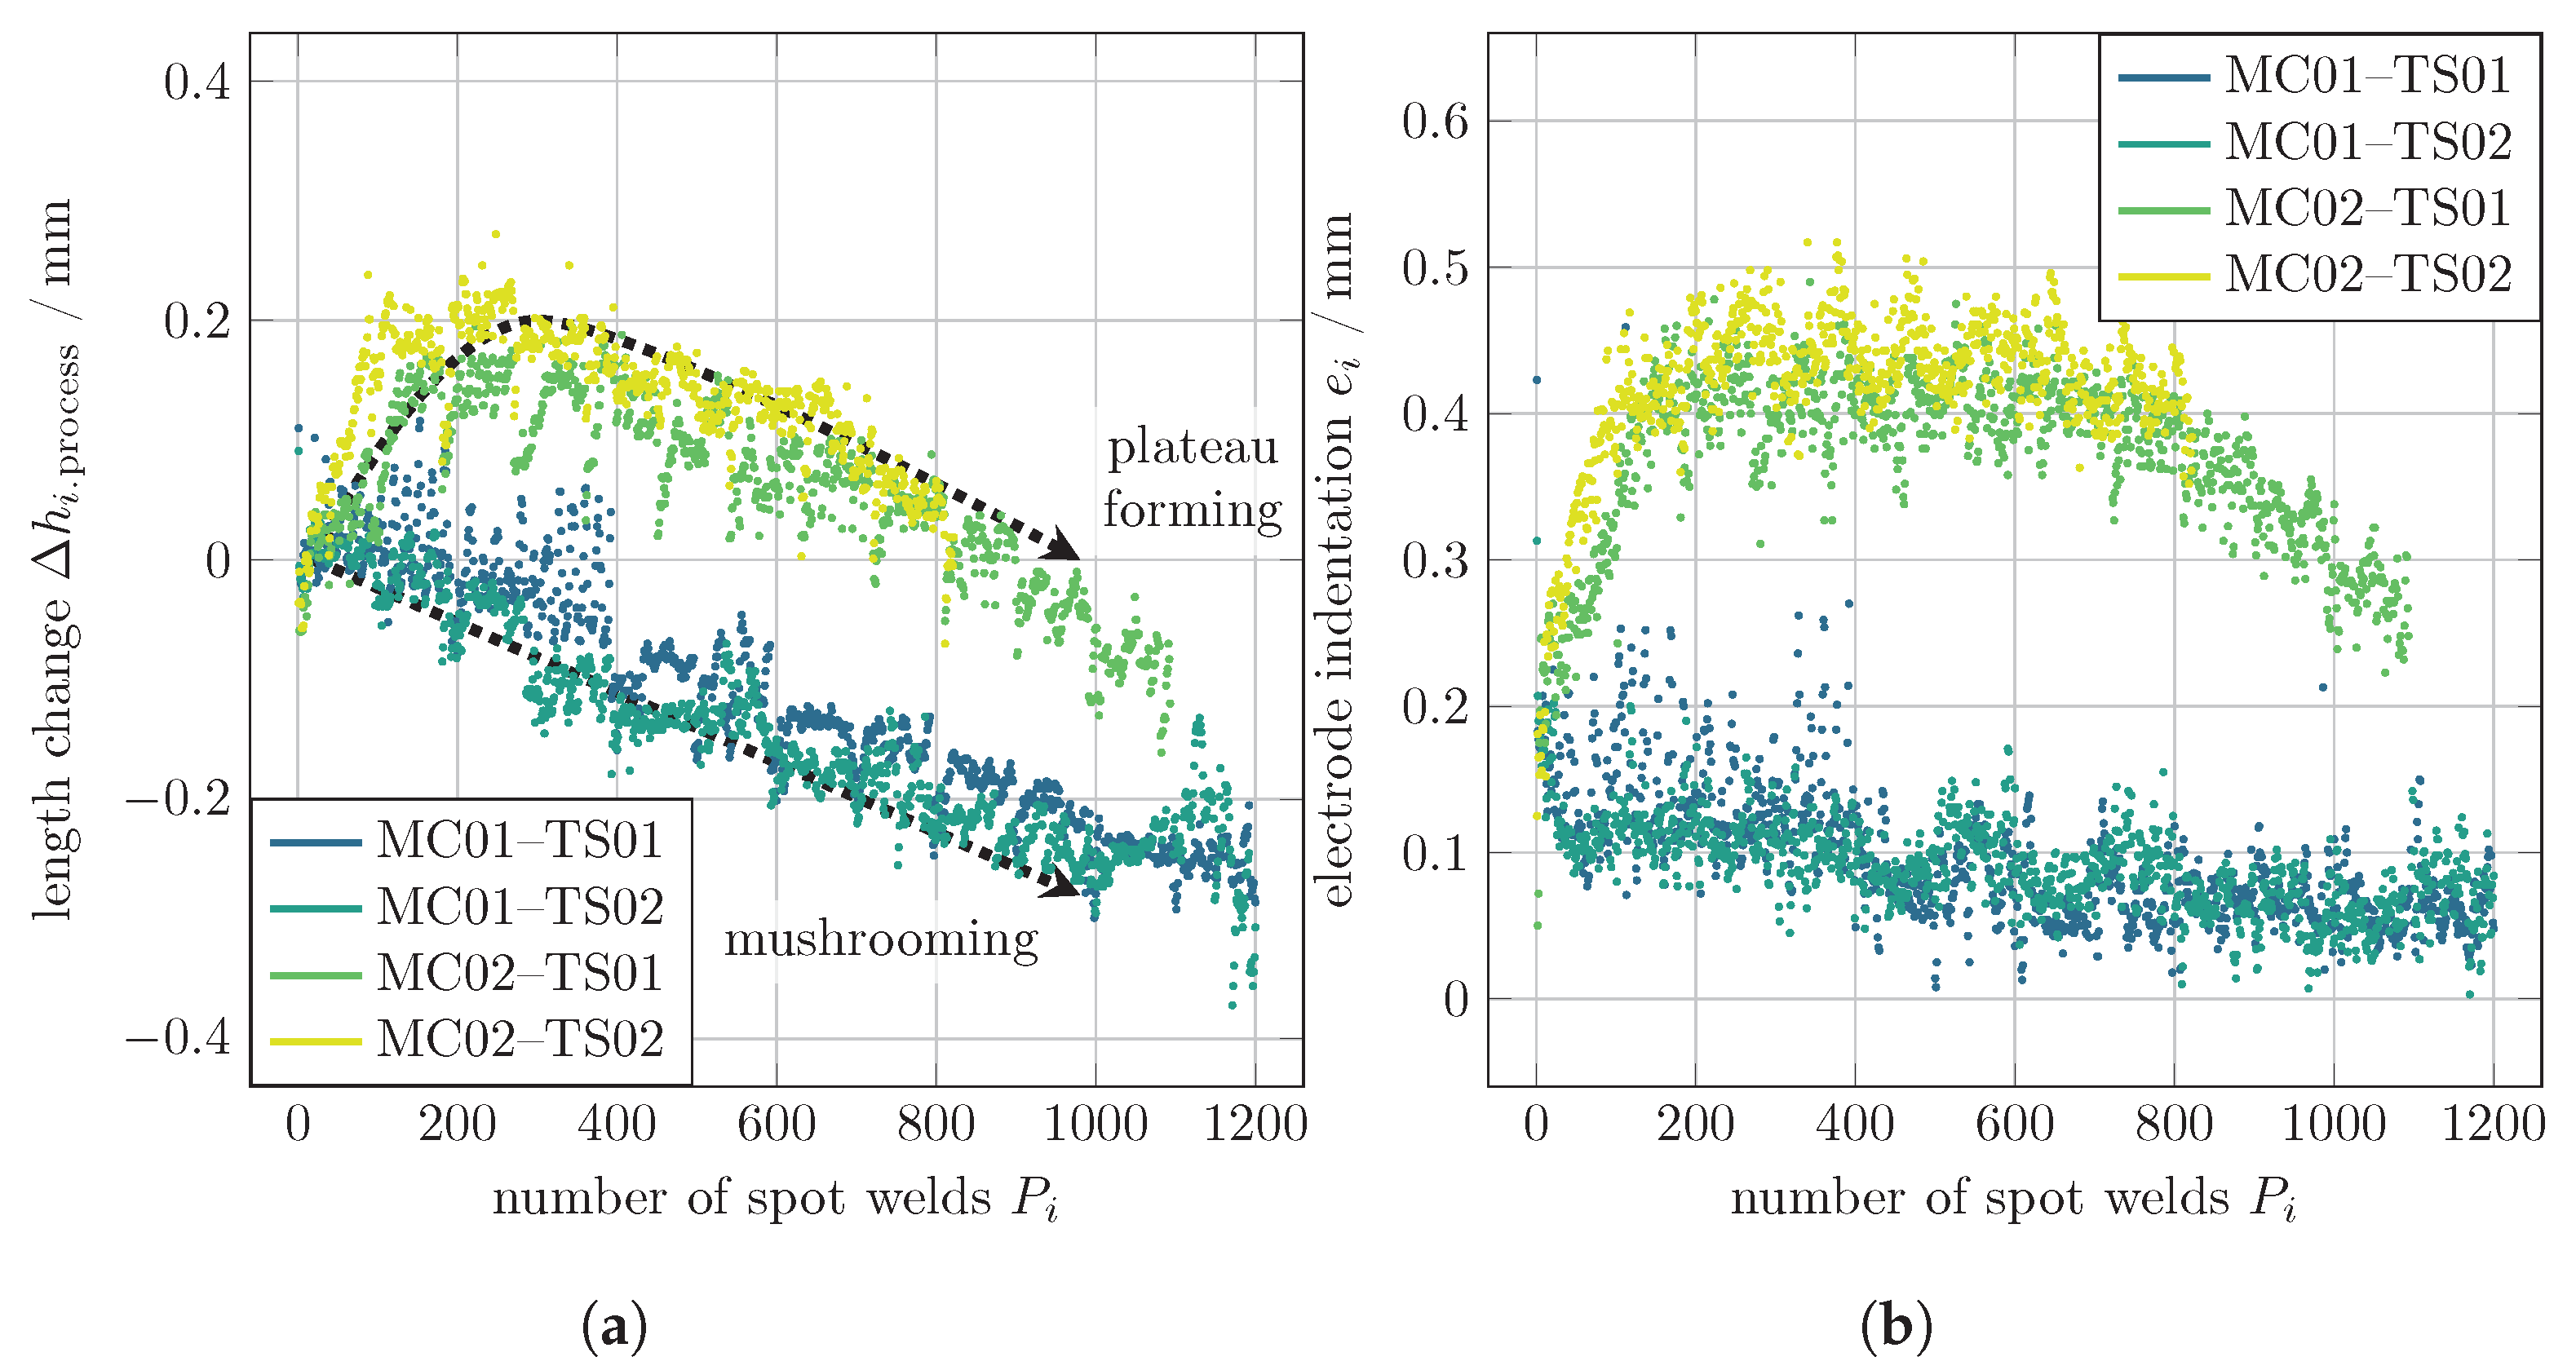
The results of determining electrode changes in length over the number of spot welds can be seen in Figure 17. As results show, decreased right from the beginning for MC01 with the wear mode of mushrooming, whereas for MC02, the length of the electrodes increased, caused by plateau forming; after about 300 spot welds, it began to slightly decrease. Constant after just a few welds led to persistently high and constant current density J through plateau area . In addition, the alloy layer forming on the electrodes caused poorer heat dissipation via the electrodes, resulting in more process heat remaining in the sheets, thereby leading to nuggets becoming thicker [19]. Analyzing MC02’s in regard to and , two different phenomena were identified. First, and approached each other at a roughly 4 diameter and were smaller than the initial diameter of the electrode contact surface. The softening of the region close to the electrode surface of the work pieces enabled axial material flow under the pressure of , which accelerated plateau formation but did not allow for to grow. The formation of a plateau led to deep electrode indentations e. With the second phenomenon, an explanation for the variation in (MC02) can be drawn by comparing the development of (MC02) in Figure 11 with the course of (MC02). As long as increased, (MC02) was stable. The progressive wear resulting in a decrease in starting at around 300 spot welds led to unstable (MC02). Interestingly, the decrease in appeared with the same gradients in both MC.
3.4. Assessing during Welding Process
The change in length of the electrodes during the welding process could be determined by evaluating electrode position at WB (Figure 18a). Data fluctuations could occur due to adhering weld spatter or other impurities on the electrode working surfaces. However, tendencies could clearly be identified. The electrode contact area at WB and PE could be calculated from these data by Equations (13) and (14). However, the area at WE could not be exactly determined. At PE, the contact area of the electrode was supplemented by the outer surface that resulted from electrode indentation , which was calculated by Equation (12) and is shown in Figure 18b. Both diagrams of Figure 18 show a clear distinction between the two wear modes, whereby and showed the same behavior within their modes. Figure 19 shows the changes in electrode contact areas between WB and PE. Again, there were huge differences between MC01 and MC02 due to the different wear modes. For MC01, the was negative and decreased leading to steady enlargement of the contact areas. With the increasing number of spot welds, the contact areas of WB and PE approached each other resulting in a smaller (Equation (15)). This can be explained by the reduced surface pressure, which was confirmed by the decrease in electrode indentation depths (Figure 18b). As described in Section 2.4.2, the model of Figure 7 could only be used for mushrooming; thus, and could not be calculated using and for plateau forming. Here, contact areas were derived by using 3D topographical measurements in combination with measured from the 3D topographical measurement of the test sheets. In the beginning, the gradient of was positive and turned negative after about . Due to plateau forming, rose and corresponded with (Figure 16). The same applied to , which resulted from and , respectively. The difference between contact areas at WB and PE was much larger than that in MC01. While was related to plateau formation, showed a slight increase almost with the same gradient as that of MC01. increased in the same manner.
4. Discussion
The stability of the weld diameters over the number of welds corresponded with the wear modes. Contact area increased steadily for MC01 and was stable for MC02 after just a few spot welds. A stable of MC02 may indicate good process reliability. This does not apply for plateau forming as the wear mode, since was much smaller with of , resulting in much higher current densities J, triggering expulsions and deep electrode indentations. The frequent expulsions of MC02 accelerated plateau formation since material from the weld disappeared, and electrodes were pressed deeper into the sheet. Those deep electrode indentations exceeded the limit value of , where t is the thickness of the respective sheet metal according to ISO 14373 [35] after just a few spot welds, leading to insufficient quality. Furthermore, the lack of a corresponding calculation model for predicting the plateau-formation process can lead to unforeseen problems in the welding process. Mushrooming, in contrast, leads to a lower J, reducing the risk of expulsions. In fact, in the early stages of mushrooming, the weld process is stabilized, and electrodes are conditioned. Nevertheless, with an increase in welds, electrodes are worn out, caused by different interlocking effects as listed in Table 3. The only way to avoid expulsions is to reduce J. However, this also has a negative effect on nugget diameter. All other effects result in risks of process instabilities and expulsions. In reference to a stable nugget or weld diameter over the number of spot welds, other factors should be considered to define a worn-out electrode. Those factors might be the surface condition after spot welding, ensuring the ability for ultrasonic NDT with adequate electrode indentations.
The results for MC01 in Figure 17 and Figure 18a are in accordance with the experimental tests in Rogeon et al. [36], where after 300 spot welds using zinc-coated steels similar to the steel used for MC01. In Lu et al. [21], the diameters of the electrode contact areas were measured with a result of a 32% larger diameter at the end of the electrode life. For MC01, an increase of 18% for the diameter and 42% for the contact area could be determined after only 1200 spot welds. Using the simplified model for estimating electrode face diameter for spherical shaped electrodes of Lu et al. [21] to predict the diameter development with
the value K could be determined with
using the following weld parameters
Even though Lu et al. used many more spot welds to determine their model, this prediction is in good agreement with the experiment data of MC01, as Figure 20 shows, since K was also in the same range as in [21].
The occurrence of wear mode can be attributed to the interaction of at least two factors, material strength and the dimension of the softened volume within the sheets. The softened material always has lower strength than that of the electrodes. The interaction of these two factors influences how electrodes are pressed into the material. If the sheets soften with a lateral expansion that is greater than the electrode contact surface, and the strength of the sheets is less than that of the electrodes, the electrodes can penetrate the material with the entire contact surface, and mushrooming occurs. In the case that the lateral expansion of the softened material is smaller than the electrode contact area, and the nonsoftened sheet material has higher strength than that of the electrodes, a plateau is formed. This assumption is in accordance with Klages [19]. However, no detailed investigations into borderline cases have yet been researched or carried out.
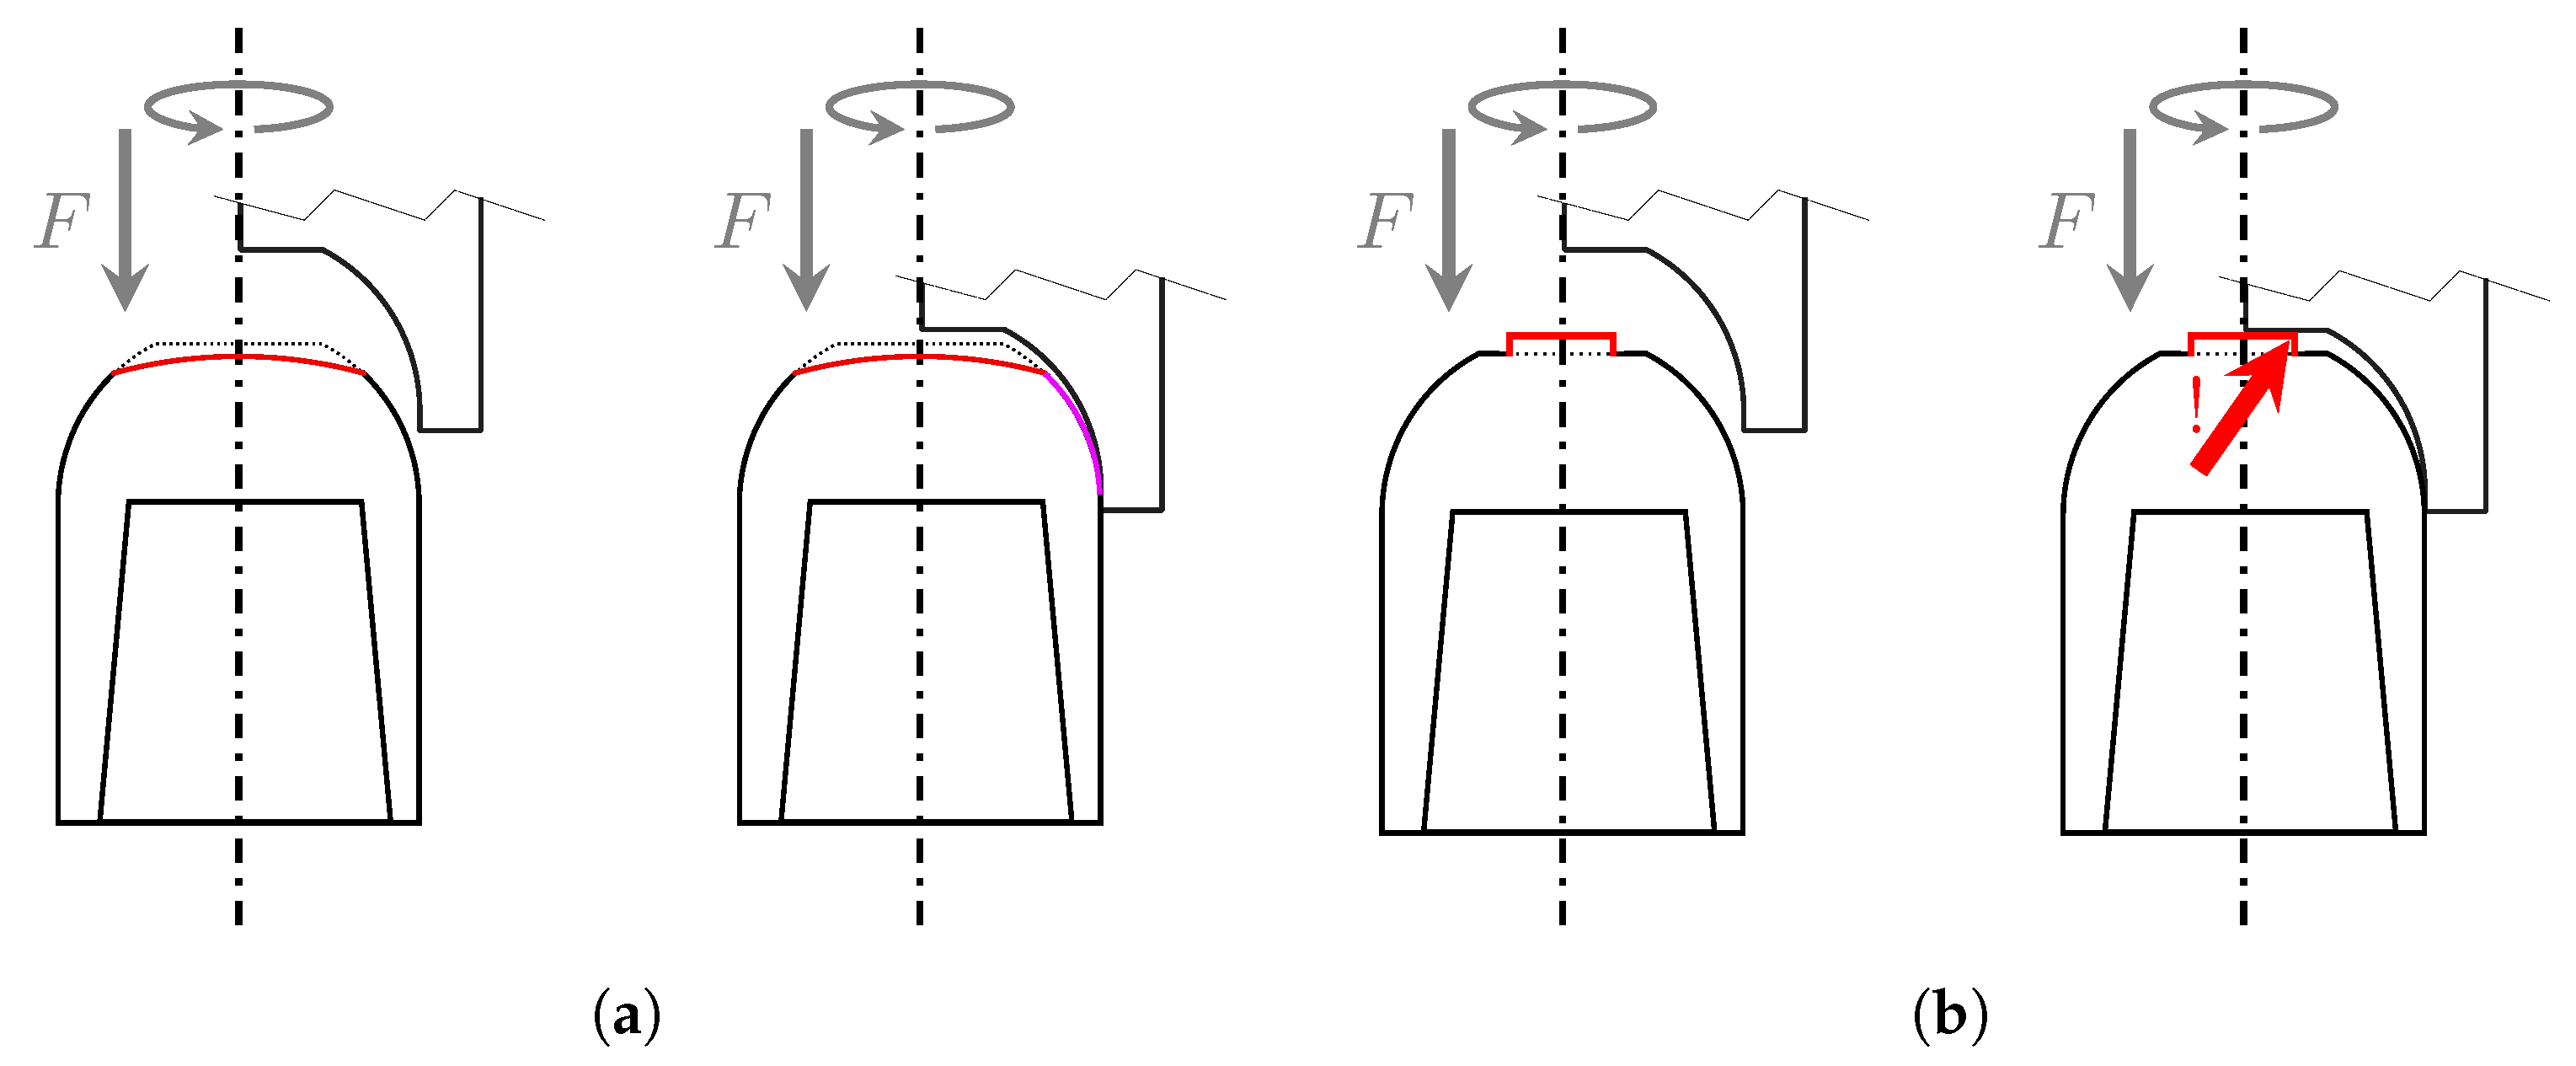
In fact, electrode wear cannot be avoided. Therefore, the question must be asked of which of the two wear modes is preferable, if it is possible to choose the process parameters in relation to one wear mode. The above discussion of the results clearly shows that the risk of process instabilities in plateau formation is higher compared to mushrooming. Looking at the tip-dressing process, the sharp edge of the plateau leads to high and sudden loads due to a punctual initial contact on the dressing tool; at mushrooming, the tool is gradually loaded and over a larger area (Figure 21). Therefore, from the point of view of tip dressing, a mushroomed electrode loads the tool more gently.
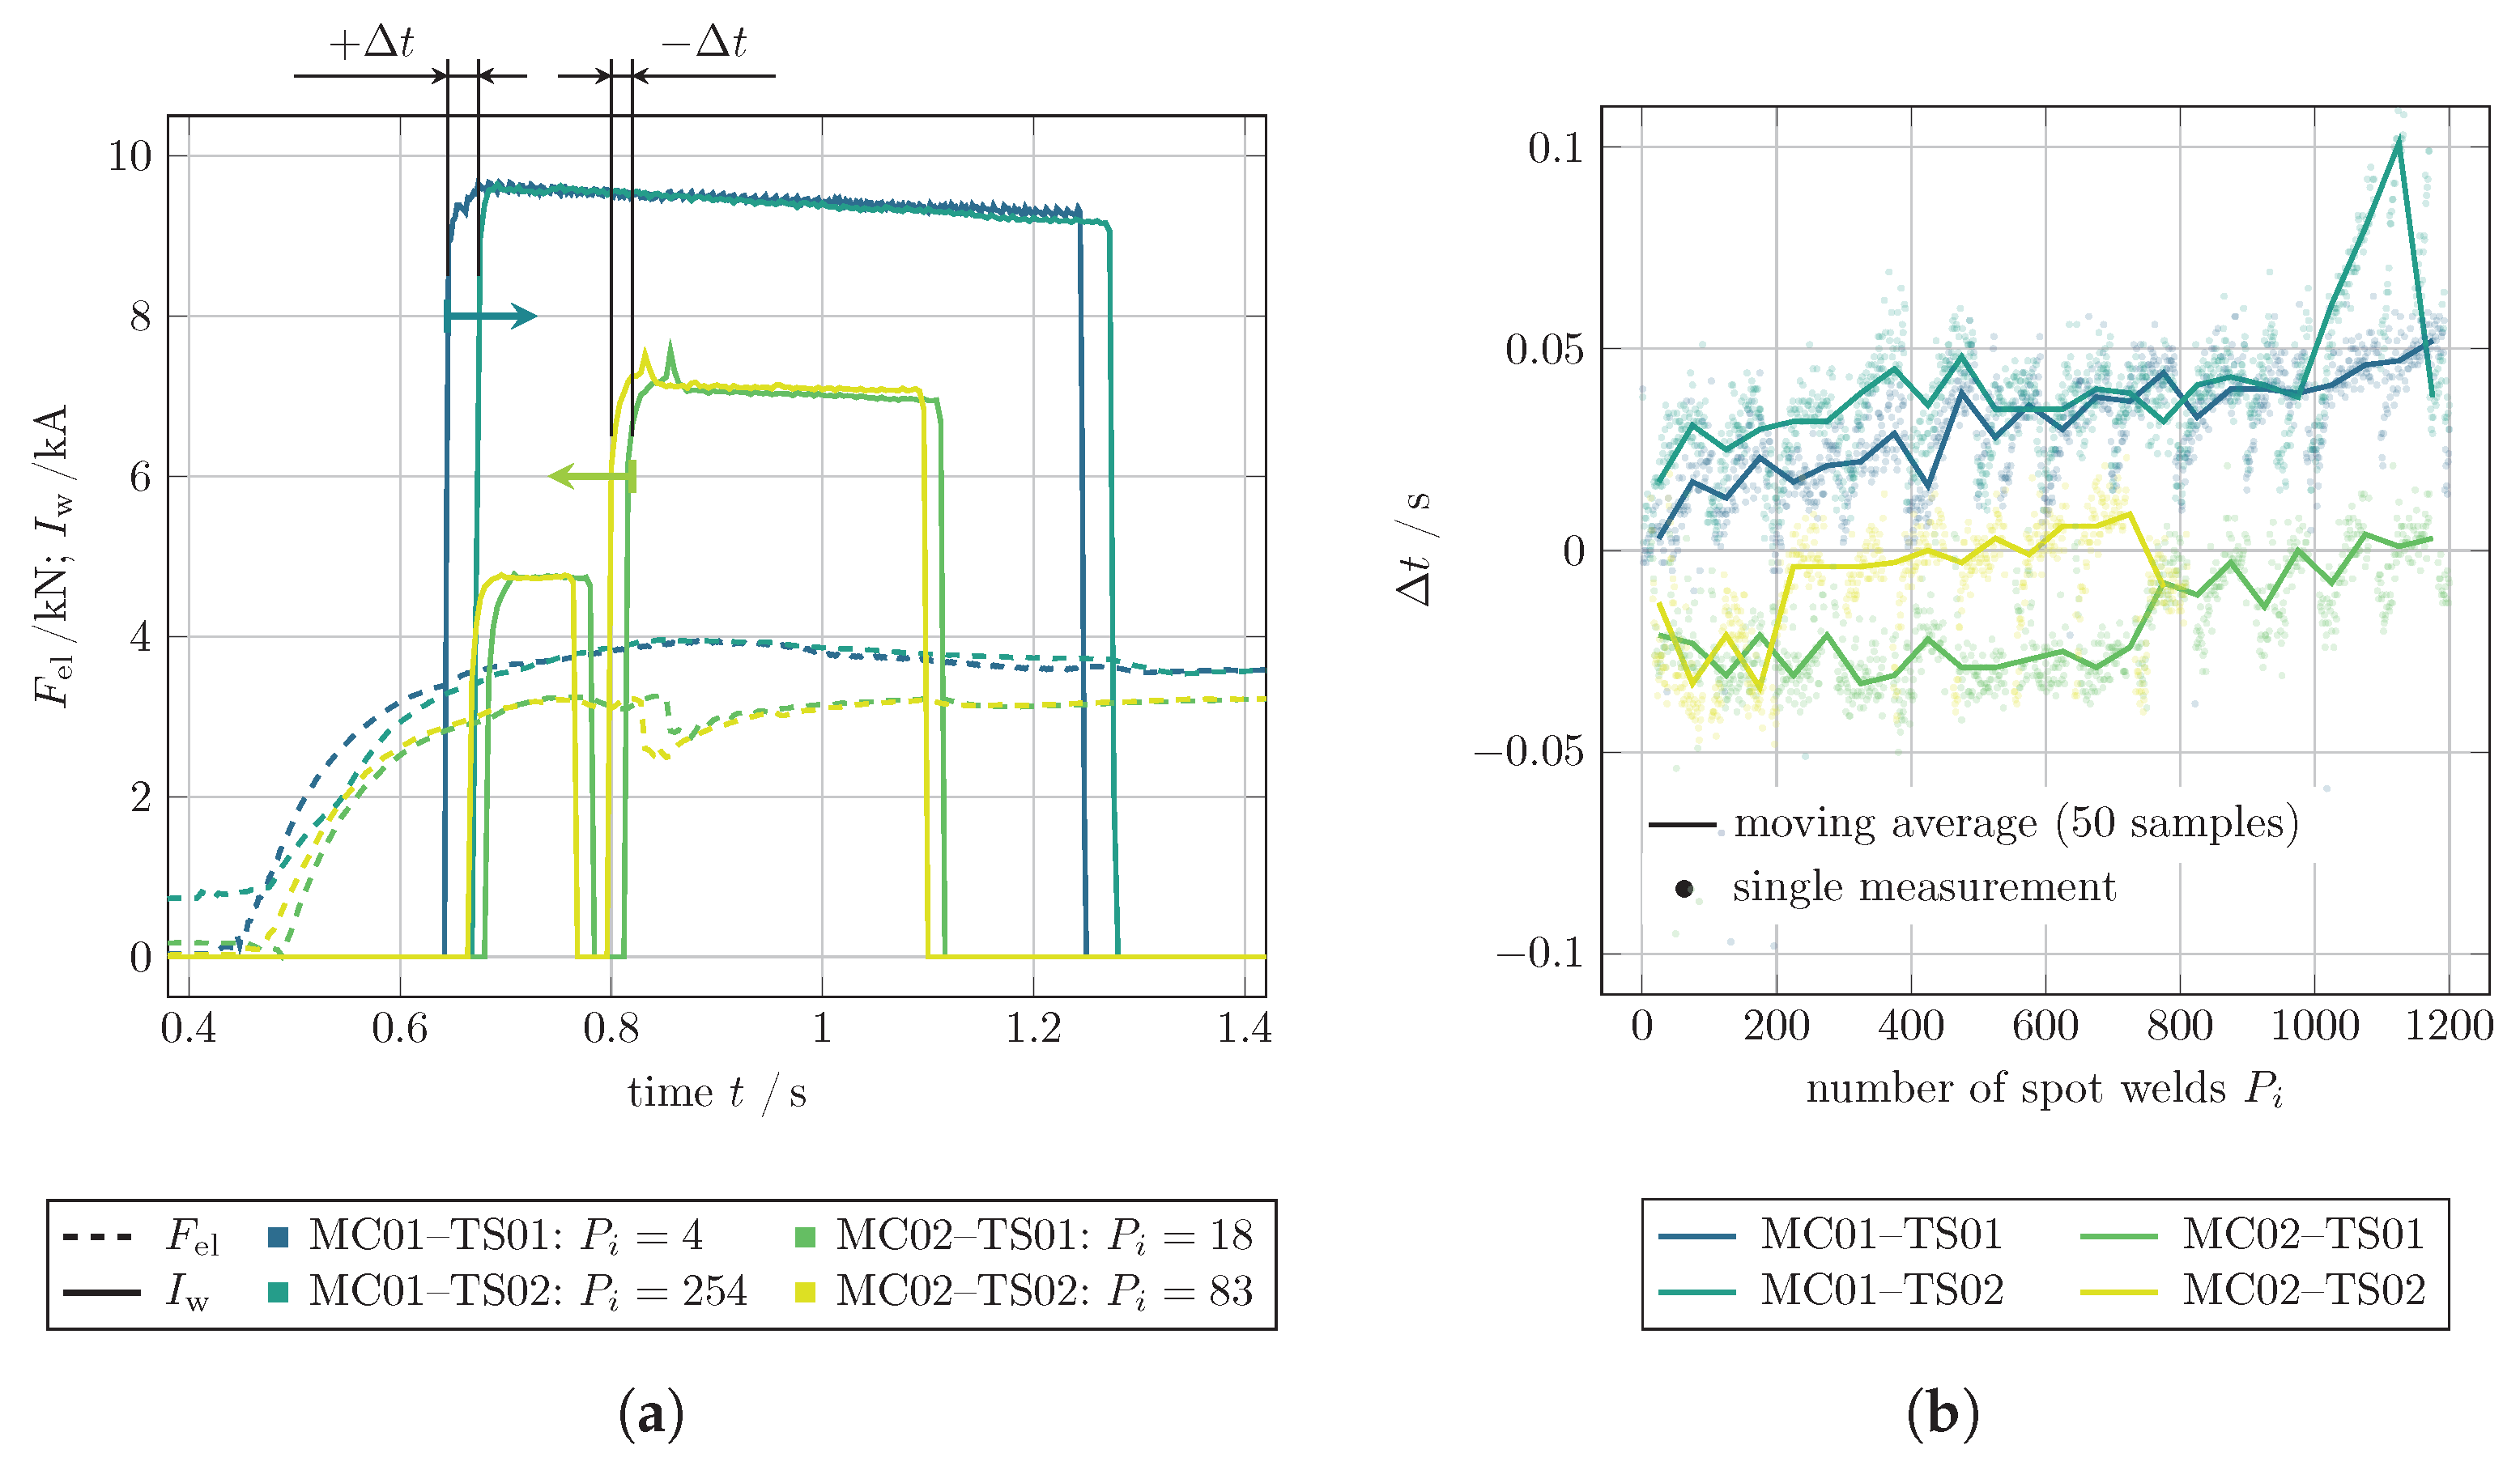
To recognize the acting wear mode, results of the experimental study show that, for evaluating , the two wear modes of mushrooming and plateau forming can be distinguished by this. by measuring the electrode displacement over the number of spot welds was equal to of the high-resolution 3D topographical measurements with higher precision. This allows for wear to be assessed by evaluating the change in length . This can be performed with displacement sensors, as in this study. However, since the common industrial environment where RSW is mainly used is very rough and tough, additional sensors are not always suitable. They must have a high level of electromagnetic compatibility and should be mechanically protected. For this reason, a solution with existing system technologies is needed. A possible option is to evaluate time between the start of the welding gun movement and WB. Most industrial RSW systems are triggered from outside starting the weld process, as shown in Figure 1. Since the welding process is known to the system in most applications, the thickness of the sheets to be welded and distance of the open position of the electrodes and the sheets are also known. With the assumption of a constant speed at which the welding gun closes, this information can be used to determine over the number of spot welds by evaluating the shift of . For plateau formation, should therefore become smaller since electrode lengths increase resulting in a shorter . Consequently, increases for mushrooming. These effects are shown in Figure 22a in detail and Figure 22b over the number of spot welds. Evaluating every single weld is not expedient. It is better to use statistical tools such as moving averages to see the trend of to monitor electrode wear and its mode. This approach can be integrated into existing systems.
5. Conclusions
Electrode wear is an undesirable progressive mechanical and metallurgical change to electrode tips with negative effects on the process. This paper presented the two wear modes of mushrooming and plateau formation, and their effect on the welding process. The effects of the two wear modes act together, resulting in a turning point where electrodes are worn out. It is critical to identify this turning. Thus, the industry avoids reaching this point by tip dressing much earlier. Monitoring electrode length change over the number of spot welds can help to address this problem. This is not a problem in a laboratory. A welding system can be equipped with all kinds of sensors and technologies to monitor the RSW process. In its common application areas, such as automotive body-in-white manufacturing, the use of these additional sensors is not possible with reasonable effort. The rough and tough environment, low cycle times, and other influences of other processes result in huge challenges for most sensors to deliver trustworthy data. Signal noise is not easy to avoid compared with the needed effort. Therefore, a solution for inline electrode wear monitoring was presented on the basis of scientific investigations and evaluations. Furthermore, the possibility of completely avoiding additional sensors was shown by evaluating the time between initial electrode movement and weld begin.
The investigations and results of this paper can be the basis for numerical simulations to reduce the complexity of mechanical environments. Real data and their statistical analysis from experiments can help to support the mechanical environment of such simulation models.
For a higher degree of result generalization, further research should be extended to other steel alloys, in particular to examine borderline and transition cases of the two wear modes. When measuring electrode movements, attention should be paid to an improved signal-to-noise ratio.
Author Contributions
Conceptualization, C.M. and D.K.; methodology, C.M.; software, C.M.; validation, C.M. and D.K.; formal analysis, C.M.; investigation, C.M.; resources, C.M. and D.K.; data curation, C.M.; writing—original-draft preparation, C.M.; writing—review and editing, C.M., D.K., S.H. and J.Z.; visualization, C.M.; supervision, U.F.; project administration, J.Z.; funding acquisition, S.H. and J.Z. All authors have read and agreed to the published version of the manuscript.
Funding
This research was funded by the Deutsche Forschungsgemeinschaft (DFG, German Research Foundation) within the project “Basic investigations for the in-situ simulation of resistance spot welding processes” under grant numbers FU 307/15-1 resp. IH 124/17-1, project no.: 389519796. Open Access Funding by the Publication Fund of the TU Dresden.
Data Availability Statement
Data can be requested from the corresponding author.
Conflicts of Interest
The authors declare no conflict of interest.
Abbreviations
The following abbreviations are used in this manuscript:
| RSW | Resistance spot welding |
| HAZ | Heat affected zone |
| AHSS | Advanced high strength steels |
| AlSi | Aluminium-silicon coating |
| MC | Material combinations |
| DT | Destructive testing |
| NDT | Nondestructive testing |
| TS | test set |
| DS | Data set |
| WB | Weld begin |
| WE | Weld end |
| PE | Process end |
Nomenclature
| Initial electrode contact area () | Number of predefined spot welds | ||
| Electrode indentation contact area after () | Contact pressure at weld begin () | ||
| Electrode contact area after due to wear ( ) | Q | Heat () | |
| Contact area at process end () | Total resistance () | ||
| Contact area at weld begin () | Individual resistance () | ||
| Contact area at process begin () | Radius of initial electrode contact area () | ||
| Area change () | Electrode radius () | ||
| Plateau area () | Radius of electrode contact area after () | ||
| Diameter of initial electrode contact area () | Difference in electrode displacement () | ||
| Electrode contact diameter after () | Displacement lower electrode () | ||
| Plateau diameter () | Displacement upper electrode () |
| Nugget diameter () | Distance of electrodes in opened position () | ||
| Weld diameter () | t | Time (s), sheet thickness (mm) ) | |
| E | Young’s modulus () | Upper sheet (mm) () | |
| e | Electrode indentation () | Lower sheet (mm) () | |
| Electrode indentation after () | Hold time () | ||
| Limit of electrode indentation () | Pause time () | ||
| f | Frequency () | Squeeze time () | |
| Electrode force () | Weld time () | ||
| Initial electrode height () | Prepulse time () | ||
| Plateau height () | Cooling water temperature () | ||
| Length change () | Minimal temperature () | ||
| Length change after () | Maximal temperature () | ||
| by laser triangulation during process () | Process start time () | ||
| by 3D topographical measurements () | Change in process start time () | ||
| Welding current () | Welding voltage () | ||
| Prepulse welding current () | Flow rate () | ||
| J | Current density () | x | Dimension in x () |
| K | Constant by Lu et al. [21] () | y | Dimension in y () |
| k | Stiffness factor () | z | Height, dimension in z () |
| Individual electrode displacement () | Angle () | ||
| Number of spot welds |
References
- TWI Ltd. What Is Spot Welding? TWI Ltd.: Cambridge, UK, 2020. [Google Scholar]
- Chen, J.; Feng, Z. IR-based spot weld NDT in automotive applications. In Proceedings of the SPIE Sensing Technology + Applications, Baltimore, WA, USA, 20–25 April 2015. [Google Scholar] [CrossRef]
- Raab, H.H. Handbuch Industrieroboter: Bauweise · Programmierung Anwendung · Wirtschaftlichkeit, 2., Neubearbeitete und Erweiterte Auflage ed.; Vieweg + Teubner Verlag: Wiesbaden, Germany, 1986. [Google Scholar] [CrossRef]
- Altnau, D. (Anzahl Schweißpunkte pro Karosserie Dresden, Leipzig). Personal communication, 26 March 2020. [Google Scholar]
- Deniz, C.; Cakir, M. In-line stereo-camera assisted robotic spot welding quality control system. Ind. Robot. Int. J. 2018, 45, 54–63. [Google Scholar] [CrossRef]
- Deutscher Verband für Schweißen und Verwandte Verfahren e.V. Merkblatt DVS 2902-4:2001-10: Widerstandspunktschweißen von Stählen bis 3 mm Einzeldicke Grundlagen, Vorbereitung und Durchführung; DVS Media: Düsseldorf, Germany, 2001. [Google Scholar]
- Cho, H.S.; Cho, Y.J. A study of the thermal behavior in resistance spot welds. Weld. J. 1989, 68, 236–244. [Google Scholar]
- Raoelison, R.N.; Fuentes, A.; Pouvreau, C.; Rogeon, P.; Carré, P.; Dechalotte, F. Modeling and numerical simulation of the resistance spot welding of zinc coated steel sheets using rounded tip electrode: Analysis of required conditions. Appl. Math. Model. 2014, 38, 2505–2521. [Google Scholar] [CrossRef]
- Institut für Materialprüfung, Werkstoffkunde und Festigkeitslehre; SLV München. Standmengenerhöhung beim Widerstandsschweißen durch Elektrodenfräsen: Schlussbericht IGF-Nr. 13.134 N/DVS-Nr. 4.031; IMWF Universität Stuttgart: Stuttgart, Germany; SLV München: München, Germany, 2004. [Google Scholar]
- Koal, J.; Baumgarten, M.; Heilmann, S.; Zschetzsche, J.; Füssel, U. Performing an Indirect Coupled Numerical Simulation for Capacitor Discharge Welding of Aluminium Components. Processes 2020, 8, 1330. [Google Scholar] [CrossRef]
- Füssel, U.; Jüttner, S.; Mathiszik, C.; Sherepenko, O.; Köberlin, D.; Zschetzsche, J. Lebensdauererhöhung von Widerstandspunktschweißelektroden durch Einsatz verschleißabhängiger Fräsintervalle und Dispersionsgehärteter Kupferwerkstoffe: Schlussbericht IGF-Nr. 18.456 BR/DVS-Nr. 04.062; Technische Universität Dresden, Professur Fügetechnik und Montage and Otto-von-Guericke-Universität Magdeburg, Institut für Werkstoff- und Fügetechnik: Dresden, Germany, 2018. [Google Scholar]
- Chang, H.S.; Cho, Y.J.; Choi, S.G.; Cho, H.S. A Proportional-Integral Controller for Resistance Spot Welding Using Nugget Expansion. J. Dyn. Syst. Meas. Control 1989, 111, 332–336. [Google Scholar] [CrossRef]
- Marek, U. Beitrag zur Klärung der Legierungsschichtbildungs- und Verschleißvorgänge an Widerstandspunktschweißelektroden beim Schweißen Feuerverzinkter Stahlbleche: Zugl.: Aachen, Techn. Hochsch., Diss., 1995. In Aachener Berichte Fügetechnik, als ms. gedr ed.; Shaker: Aachen, Germany, 1996; Volume 96. [Google Scholar]
- Holliday, R.; Parker, J.D.; Williams, N.T. Relative contribution of electrode tip growth mechanisms in spot welding zinc coated steels. Weld. World/Le Soudage Dans Monde 1996, 4, 186–193. [Google Scholar]
- Matsuda, H.; Matsuda, Y.; Kabasawa, M. Study of electrode wear mechanism in consecutive spot welding: Spot weldability of Zn-Ni electrogalvanised steel sheet and organic-silicate composite steel sheet (1st Report). Weld. Int. 1997, 11, 860–867. [Google Scholar] [CrossRef]
- Williams, N.T.; Parker, J.D. Review of resistance spot welding of steel sheets Part 2 Factors influencing electrode life. Int. Mater. Rev. 2004, 49, 77–108. [Google Scholar] [CrossRef]
- Deutscher Verband für Schweißen und verwandte Verfahren e.V. Merkblatt DVS 2920:2000-02: Widerstandspunkt-, Buckel- und Rollennahtschweißen von Stahlblechen bis 3 mm mit metallischen Überzügen; DVS Media: Düsseldorf, Germany, February 2000. [Google Scholar]
- Galler, M.; Vallant, R. The influence of Zinc coatings on the electrode wear during resistance spot welding of sheet steel. In Verarbeitungs- und Gebrauchseigenschaften von Werkstoffen—Heute und Morgen; Mayr, P., Ed.; Verl. der TU Graz: Graz, Austria, 2008; pp. 117–119. [Google Scholar]
- Klages, E.C. Beurteilung der Beanspruchung von Elektrodenkappen Beim Widerstandspunktschweißen von höher—und höchstfestem Stahl. Ph.D. Thesis, Logos Verlag Berlin GmbH, Hannover, Germany, 2014. [Google Scholar]
- Großmann, C. Nutzung vorhandener Standmengenpotentiale, Verschleißverringerung durch Angepasste Elektrodenwerkstoffe und Elektrodenverschleißdiagnose beim Widerstandspunktschweißen. Ph.D. Thesis, Technische Universität Dresden, Dresden, Germany, 2019. [Google Scholar]
- Lu, F.; Dong, P. Model for estimating electrode face diameter during resistance spot welding. Sci. Technol. Weld. Join. 1999, 4, 285–289. [Google Scholar] [CrossRef]
- Dong, P.; Victor Li, M.; Kimchi, M. Finite element analysis of electrode wear mechanisms: Face extrusion and pitting effects. Sci. Technol. Weld. Join. 1998, 3, 59–64. [Google Scholar] [CrossRef]
- Kondo, M.; Konishi, T.; Nomura, K.; Kokawa, H. Degradation mechanism of electrode tip during alternate resistance spot welding of zinc coated and uncoated steel sheets. Sci. Technol. Weld. Join. 2010, 15, 76–80. [Google Scholar] [CrossRef]
- Li, W. Modeling and On-Line Estimation of Electrode Wear in Resistance Spot Welding. J. Manuf. Sci. Eng. 2005, 127, 709–717. [Google Scholar] [CrossRef]
- Zhang, J.; Zhang, P.X.; Xu, X.J. A Model for Predicting the Wear Degree of Electrode Tip. Appl. Mech. Mater. 2014, 574, 292–297. [Google Scholar] [CrossRef]
- DIN Deutsches Institut für Normung, e.V. DIN EN ISO 8166:2003-09: Verfahren für das Bewerten der Standmenge von Punktschweißelektroden bei Konstanter Maschinen-Einstellung; DIN Deutsches Institut für Normung e.V.: Berlin, Germany, 2003. [Google Scholar]
- Stahlinstitut VDEh. Prüf- und Dokumentationsrichtlinie für die Fügeeignung von Feinblechen aus Stahl—Teil 2: Widerstandspunktschweißen; Stahlinstitut VDEh: Düsseldorf, Germany, 2011. [Google Scholar]
- Deutscher Verband für Schweißen und verwandte Verfahren e.V. Merkblatt DVS 2916-5:2017-09: Prüfen von Widerstandspressschweißverbindungen: Zerstörungsfreie Prüfung; DVS Media: Düsseldorf, Germany, 2017. [Google Scholar]
- Voestalpine Stahl GmbH. Micro-Alloyed Steels: High-Strength Steels with Yield Strengths up to 550 MPa: Data Sheet Micro-Alloyed Steels; Voestalpine Stahl GmbH: Linz, Austria, 2020. [Google Scholar]
- Salzgitter Flachstahl GmbH. 22MnB5 Borlegierte Vergütungsstähle; Salzgitter Flachstahl GmbH: Salzgitter, Germany, 2014. [Google Scholar]
- Deutsches Institut für Normung. DIN EN ISO 10447:2015-05: Widerstandsschweißen—Prüfung von Schweißverbindungen—Schäl- und Meißelprüfung von Widerstandspunkt- und Buckelschweißverbindunge; Deutsches Institut für Normung: Berlin, Germany, 2015. [Google Scholar] [CrossRef]
- Zhang, X.Q.; Chen, G.L.; Zhang, Y.S. Characteristics of electrode wear in resistance spot welding dual-phase steels. Mater. Des. 2008, 29, 279–283. [Google Scholar] [CrossRef]
- Zhang, X.Q.; Chen, G.L.; Zhang, Y.S. On-line evaluation of electrode wear by servo gun in resistance spot welding. Int. J. Adv. Manuf. Technol. 2008, 36, 681–688. [Google Scholar] [CrossRef]
- Wang, S.C.; Wei, P.S. Modeling Dynamic Electrical Resistance during Resistance Spot Welding. J. Heat Transf. 2001, 123, 576–585. [Google Scholar] [CrossRef]
- Deutsches Institut für Normung. DIN EN ISO 14373:2015-06: Widerstandsschweißen—Verfahren zum Punktschweißen von Niedriglegierten Stählen mit oder ohne Metallischem Überzug; Deutsches Institut für Normung: Berlin, Germany, 2015. [Google Scholar] [CrossRef]
- Rogeon, P.; Carre, P.; Costa, J.; Sibilia, G.; Saindrenan, G. Characterization of electrical contact conditions in spot welding assemblies. J. Mater. Process. Technol. 2008, 195, 117–124. [Google Scholar] [CrossRef]
Figure 1.
Course of applied electrode force and welding current over time t of a common resistance-spot-welding (RSW) process with three main stages: squeeze time , weld time , and hold time (schematic).
Figure 1.
Course of applied electrode force and welding current over time t of a common resistance-spot-welding (RSW) process with three main stages: squeeze time , weld time , and hold time (schematic).

Figure 2.
(a) Contact resistances and individual material resistances at RSW; (b) dynamic behavior of resistances during typical spot-welding process with resulting total resistance (schematic, standardized).
Figure 2.
(a) Contact resistances and individual material resistances at RSW; (b) dynamic behavior of resistances during typical spot-welding process with resulting total resistance (schematic, standardized).

Figure 3.
Typical modes of electrode wear and their mechanisms indicated by arrows at RSW of coated steel alloys: (a) mushrooming due to radial material flow and (b) plateau formation due to axial material flow.
Figure 3.
Typical modes of electrode wear and their mechanisms indicated by arrows at RSW of coated steel alloys: (a) mushrooming due to radial material flow and (b) plateau formation due to axial material flow.

Figure 4.
Experiment area for RSW for steel alloys at Technische Universität Dresden with welding gun positioned at all three modules for investigations in welding, tip-dressing, and topographical-measurement positions of upper and lower electrodes, and detailed view of welding gun with highlighted laser-triangulation sensors (1, 2) for measuring the displacement of upper electrode and lower electrode .

Figure 5.
Test sequence of step tests with number of welded spot welds , number of spot weld to be welded for appropriate MC, and weld diameter .
Figure 5.
Test sequence of step tests with number of welded spot welds , number of spot weld to be welded for appropriate MC, and weld diameter .

Figure 6.
(a) Geometry parameters for used electrodes according to DIN EN ISO 5821 F1-16-20-40-6; (b) chromatic confocal microscope measurement after initial electrode tip dressing with parameters for topographical measurements.
Figure 6.
(a) Geometry parameters for used electrodes according to DIN EN ISO 5821 F1-16-20-40-6; (b) chromatic confocal microscope measurement after initial electrode tip dressing with parameters for topographical measurements.

Figure 7.
Geometric parameters of electrode tip.

Figure 8.
Procedure to align data sets (DSs) of 3D topographical measurements for comparison and determining on example of MC01–TS01 and as 3D projection. (a) Plot of reference DS of ; (b) plot of DS to align; (c) overlay of both DSs; (d,e) aligned DS in x–y plane by determining minimal difference between two DSs; (f) aligned in z direction.

Figure 9.
Exemplary comparison of selected profiles derived from topographical measurements of MC01–TS01 and with marked regions to align profiles.
Figure 9.
Exemplary comparison of selected profiles derived from topographical measurements of MC01–TS01 and with marked regions to align profiles.

Figure 10.
Exemplary process parameters of spot-weld of MC01–TS01 and MC02–TS01 with marked timing positions weld begin (WB), weld end (WE), and process end (PE) for further evaluations.
Figure 10.
Exemplary process parameters of spot-weld of MC01–TS01 and MC02–TS01 with marked timing positions weld begin (WB), weld end (WE), and process end (PE) for further evaluations.

Figure 11.
Development of weld diameter of MC01 and MC02 determined by destructive chisel test according to ISO 10447.
Figure 11.
Development of weld diameter of MC01 and MC02 determined by destructive chisel test according to ISO 10447.

Figure 12.
Wear mode of mushrooming visualized by topographical measurements of upper (anode) and lower (cathode) electrodes of MC01–TS01 by profile sections and top view on 3D topographical measurements.
Figure 12.
Wear mode of mushrooming visualized by topographical measurements of upper (anode) and lower (cathode) electrodes of MC01–TS01 by profile sections and top view on 3D topographical measurements.

Figure 13.
Wear mode of plateau forming visualized by topographical measurements of the upper (anode) and lower (cathode) electrodes of MC02–TS01 by profile sections and top view on 3D topographical measurements.
Figure 13.
Wear mode of plateau forming visualized by topographical measurements of the upper (anode) and lower (cathode) electrodes of MC02–TS01 by profile sections and top view on 3D topographical measurements.

Figure 14.
Mushrooming due to radial material flow indicated by white arrows of upper electrode of MC01–TS01 after 1200 spot welds in cross-section.
Figure 14.
Mushrooming due to radial material flow indicated by white arrows of upper electrode of MC01–TS01 after 1200 spot welds in cross-section.

Figure 15.
Plateau forming due to axial material flow of lower electrode of MC02–TS02 after 822 spot welds in cross-section [11].
Figure 15.
Plateau forming due to axial material flow of lower electrode of MC02–TS02 after 822 spot welds in cross-section [11].

Figure 16.
Plateau-forming development over number of spot welds due to axial material flow.

Figure 17.
Different behavior in length change of upper and lower electrodes from MC01 and MC02 as a result of two different wear modes, mushrooming and plateau forming.
Figure 17.
Different behavior in length change of upper and lower electrodes from MC01 and MC02 as a result of two different wear modes, mushrooming and plateau forming.

Figure 18.
(a) Different behaviors in length change of upper or lower electrodes form MC01 and MC02 as a result of two different wear modes, mushrooming and plateau forming. (b) Calculated electrode indentation from displacement measurements.
Figure 18.
(a) Different behaviors in length change of upper or lower electrodes form MC01 and MC02 as a result of two different wear modes, mushrooming and plateau forming. (b) Calculated electrode indentation from displacement measurements.

Figure 19.
Comparison of contact areas and of electrodes from MC01 (left) and MC02 (right) as a result of two different wear modes, mushrooming and plateau forming.
Figure 19.
Comparison of contact areas and of electrodes from MC01 (left) and MC02 (right) as a result of two different wear modes, mushrooming and plateau forming.

Figure 20.
Comparison of of MC01 with prediction model of Lu et al.

Figure 21.
Tip dressing of worn electrodes: (a) mushrooming; (b) plateau forming.

Figure 22.
(a) as shift of WB due to electrode length change in detail and (b) over number of spot welds.
Figure 22.
(a) as shift of WB due to electrode length change in detail and (b) over number of spot welds.


Table 1.
Material combinations (MC) for experimental investigations.
| Description | MC01 | MC02 |
|---|---|---|
| Upper sheet, | HX340LAD + Z100 | 22MnB5 + AS150 |
| Anode () | () | ( ) |
| Lower sheet, | HX340LAD + Z100 | 22MnB5 + AS150 |
| Cathode () | ( ) | ( ) |
| Coating | zinc, 100 | AlSi 150 |
Table 2.
Test setup for welding experiments.
| Description | MC01 | MC02 |
|---|---|---|
| Spot welds per TS () | TS01, TS02: 1200 | TS01: 1092, TS02: 822 |
| Electrode material | CuCr1Zr | |
| Electrode geometry | DIN EN ISO 5821 F1-16-20-40-6 | |
| Geometry of test sheets in mm () | 30 × 500 (8) | 30 × 400 (12) |
| Geometry of wear sheets in mm () | 500 × 360 (192) | 400 × 180 (78) |
| Spot distance, edge distance in mm | 30, 15 | 30, 15 |
| in | ||
| , , , , in | 400, 0, 0, 600, 400 | 400, 100, 30, 300, 400 |
| , in | 0, | , |
| in , in | , 20–25 | , 20–25 |
Table 3.
Interlocking effects of mushrooming at resistance spot welding (RSW).
| Effect Description | Result | Risk of Expulsion |
|---|---|---|
| Increased number of welds | Alloy layer thickness ↑ | ↑ |
| Increase in alloy layer | Material resistance , ↑ | ↑ |
| Increase in contact area | Current density J ↓ | ↓ |
| Pressure ↓ | ↑ | |
| Decrease in pressure | Contact resistance ↑ | ↑ |
| Increased material resistance , | Nugget diameter ↑ | ↑ |
| Increased contact resistance | Nugget diameter ↑ | ↑ |
| Increased contact resistance , | Nugget diameter ↓ | ↑ |
| Decreased current density J | Nugget diameter ↓ | ↓ |
Publisher’s Note: MDPI stays neutral with regard to jurisdictional claims in published maps and institutional affiliations. |
© 2021 by the authors. Licensee MDPI, Basel, Switzerland. This article is an open access article distributed under the terms and conditions of the Creative Commons Attribution (CC BY) license (https://creativecommons.org/licenses/by/4.0/).
Share and Cite
MDPI and ACS Style
Mathiszik, C.; Köberlin, D.; Heilmann, S.; Zschetzsche, J.; Füssel, U. General Approach for Inline Electrode Wear Monitoring at Resistance Spot Welding. Processes 2021, 9, 685. https://doi.org/10.3390/pr9040685
AMA Style
Mathiszik C, Köberlin D, Heilmann S, Zschetzsche J, Füssel U. General Approach for Inline Electrode Wear Monitoring at Resistance Spot Welding. Processes. 2021; 9(4):685. https://doi.org/10.3390/pr9040685
Chicago/Turabian StyleMathiszik, Christian, David Köberlin, Stefan Heilmann, Jörg Zschetzsche, and Uwe Füssel. 2021. "General Approach for Inline Electrode Wear Monitoring at Resistance Spot Welding" Processes 9, no. 4: 685. https://doi.org/10.3390/pr9040685
Note that from the first issue of 2016, this journal uses article numbers instead of page numbers. See further details here.