Article

Determination of the Relationship between the Granulometry and Release of Polyphenols Using LC-UV, and Their Antioxidant Activity of the Pulp Powder of the Moroccan Argan Tree, “Argania spinosa L.”

1
Industrial and Surface Engineering Laboratory, Faculty of Science and Technics, University Sultan Moulay Slimane, Beni Mellal 23000, Morocco
2
Laboratory of Material Sciences and Process Optimization, Faculty of Science Semlalia, University Cadi Ayyad, Marrakech 40000, Morocco
3
IRCOS Laboratory, QI Al-Massar, Marrakesh 40000, Morocco
4
Department of Pharmacy, University of Grenoble Alpes, INSERM, LRB, 38000 Grenoble, France
*
Authors to whom correspondence should be addressed.
Separations 2023, 10(10), 542; https://doi.org/10.3390/separations10100542
Submission received: 29 August 2023 / Revised: 22 September 2023 / Accepted: 28 September 2023 / Published: 16 October 2023
(This article belongs to the Special Issue Novel Applications of Separation Technology)

Abstract

:
The bioavailability of cosmetic, pharmaceutical, nutraceutical, and food preparations depends, among other factors, on the galenic form and the control of the granulometric structure of powders. The present study aimed to evaluate the effect of argan pulp powder particle size on functional, physicochemical properties, and antioxidant bioactivity. The particle size study revealed a unimodal particle volume distribution, explaining the regular particle shape. The results relating to functional properties indicated that the critical fraction was in the range of 50–125 µm. However, the study of the particles in each class, evaluated via SEM, showed that the morphology of the pulp powder was strongly dependent on the degree of grinding. The classes in the range of 50–125 µm had the highest polyphenol content, while those of <25 µm had the highest flavonoid content (893.33 mg GAE/100 g DW and 128.67 mg CE/100 g DW, respectively). Molecular analysis via LC and GC-MS showed that particle size had a significant effect on the release of bioactive molecules. ABTS, DPPH, and TAC tests showed that the fraction, ‘‘50–125 µm’’, had the highest antioxidant activity. However, the FRAP test showed highest antioxidant activity for particles of <25 µm. The analysis of the bioactive compounds of the argan pulp powder confirmed a differential distribution, depending on the size of the particles.

1. Introduction

The bioavailability of nutrients or active molecules found in cosmetic, pharmaceutical, nutraceutical, and in food preparations depends on the dosage [1] and the size of particles surrounding the bioactive molecules [2,3]. Particle size has a significant influence on food digestibility in the gastrointestinal tract [4], and the functional, physicochemical, and therapeutic properties, notably the antioxidant activity of plant powders [5]. The antioxidant potential of plant-derived structures (mainly phenolic compounds) is important in terms of their ability to neutralize the forms of free radicals formed during pathological processes [6]. The literature shows the added value of anti-free radical power of plant molecules in multiple fields such as the development of new packaging materials [7], as methods of preservation of active ingredients, and as defense mechanism against chemical pollutants [8,9].
Typically, grinding, sieving, and blending are among the operations that directly influence the particle size of powders, which in turn affects the distribution of macronutrients and functional components on the particle surface [4,5,6,7,8,9,10]. In addition, grinding and sieving can stimulate certain functional properties, notably water and oil retention capacity as well as enzyme release [11,12]. Lazaridou et al. showed that particle size and autoclaving can modify both the rheology of a paste and the organoleptic quality of a powder [13]. Thus, a preparation in the field of cosmetics and pharmaceuticals, based on particle size selection, could contribute to a robust structure and stability.
The argan tree (Argania spinosa L. Skeels), a member of the Sapotaceae family, is endemic to southwest Morocco. Argan seeds, which contain the kernels used to prepare the famous edible argan oil, are covered with a particularly thick, milky pulp. Argan oil is produced exclusively in Morocco and has long been sold exclusively on the Moroccan market. Today, thanks to astonishing improvements in its preparation [14], its high nutritional value and its general beneficial effect on human health [15], argan oil can be found in all industrialized countries. As the pulp of the argan tree is a source of feed for livestock and other animals, its agricultural impact is significant. Chemical analysis of argan pulp has already shown the presence of saponins [16]. Its lipid extract has also been analyzed [14]. Analysis of the phenolic fraction of argan pulp revealed the presence of sixteen identified compounds, mainly flavonoids [17].
In this work, we have adopted an innovation in green scientific research by using the rules of zero water and zero fossil energy, less conventional energy and zero waste. In fact, argan pulp has not yet been used in the food and pharmaceutical field despite its abundance as an industrial waste (about 40% of the total fresh/dry fruit) and its richness in bioactive molecules [18]. The aim of this study is to monitor the effect of particle size on the release of bioactive compounds, using liquid and gas chromatography methods, on their free radical scavenging power and on the functional and physicochemical properties of argan pulp powder, “Argania spinosa L.”, as an approach to enhance the value of Moroccan terroir products in the food and pharmaceutical industries.

2. Materials and Methods

2.1. Reagents and Standards

All reagents and standards were of analytical grade. 2,2-diphenyl picrylhydrazyl (DPPH), ABTS (2,20-azino-bis(3-ethylbenzothiazoline-6-sulfonic acid)), butylated hy-droxytoluene (BHT), Trolox (6-hydroxy-2,5,7,8-tetramethylchro man-2-carboxylic acid), ammonium molybdate, sodium phosphate, sulfuric acid, gallic acid, iron III chloride (FeCl3), potassium ferricyanide K3Fe(CN)6), and Folin–Ciocalteu reagents were pur-chased from Sigma-Aldrich (St. Louis, MO, USA). All the other chemicals and solvents used were of analytical grade.

2.2. Plant Material

Byproducts from the “Argania spinosa L.” industry were used as a study matrix. The argan fruit husk (argan) was collected from the production line of Laboratoires IRCOS, based in Marrakech, Morocco (http://ircoslaboratoires.com, (accessed on 20 October 2021)). The dry byproducts (pulp) were rinsed with cold water and dried in a convection oven (standard Ecocell, Strasbourg, France) at 60 °C for 48 h. The dry waste (1 kg) was ground using a knife mill (model Monbroy/2000 W, Jinhua, China, speed 25,000 r/min, running time 2 min with an interval of 5 min). The ground material was left at room temperature for 10 min. The powder was then sieved using a vibrating sieve shaker (Cisa/BA200N, Barcelona, Spain) at vibration amplitude of 1.50 ± 0.01 mm for 10 min. The pulp powder was sieved to obtain five particle size fractions: (d ≤ 25 µm; 50 µm ≥ d > 25 µm; 125 µm ≥ d > 50 µm; 300 µm ≥ d > 125 µm; d > 300 µm) [19]. Fractionated samples were packed in airtight bags and stored at 4 °C.

2.3. Methods

2.3.1. Particle Size Distribution

Particle size distribution was determined on the basis of the powder retained on each sieve. The raw powder mass was 600 g. Three replicates were carried out.
F G = M i M T × 100
where FG is size of fraction, Mi is mass of fraction I, MT is total mass of flour.

2.3.2. Determination of Sieve Powder Morphology

The microstructure of the powder fractions was examined using a scanning electron microscope (SEM) (TESCAN VEGA 3, Brno-Kohoutovice, Czech Republic). Samples were sputtered with carbon before being scanned. An acceleration potential of 20 kV was used to acquire the micrographic images. Measurements were carried out in triplicate.

2.3.3. Total Polyphenol Content, Total Flavonoid Content

Estimation of total polyphenol content (TPC) for each particle size fraction was determined using the Folin–Ciocalteu method employed by El adnany. E. M et al. [19]. TPC was determined from a test sample of 2 g of argan pulp powder, in the presence of an 80% methanolic solution in water. TPC was determined from the previously plotted calibration curve. Results are expressed in mg GAE/g DM.
Similarly, the estimation of total flavonoid content (TFC) content for each particle size fraction was determined according to the method used by Mourjane. A et al. [20]. The TFC was determined on the basis of the calibration curve previously plotted. Results are expressed in mg CE/g DM.

2.3.4. Molecular Analysis via LC-UV

Detection and quantification of phenolic acids, phenols, and flavonoids in each particle size class were carried out using the high-performance liquid chromatography method, according to the protocol used by Mourjane. A et al. [20]. Seventeen phenolic compounds were used as standards.
Briefly, 0.1% aqueous formic acid solution (A) and methanol solution (B) were used as eluents for linear gradient separation from 5 to 95% in B for 36 min. The flow rate was 1 mL/min. Chromatograms of standards were prepared from a concentration of 1 g/L. Results are expressed in mg per 100 g MS.

2.3.5. GC-MS Analysis

Qualitative analysis of the lipid fraction of each particle size class was carried out at the CAC-FSSM analysis center (Faculté des Sciences Semlalia-Marrakech) according to Mourjane. A et al. [21]. Then, 1 µL of sample was injected in split mode with a split ratio of 1/50 at 250 °C. The carrier gas is pure helium set at a flow rate of (1 mL/min) under 5 kPa pressure. The temperature is set at 280 °C. The injector temperature was programmed in a range from 70 to 250 °C at 5 °C/min, then in 15 min steps to 250 °C. The molecules are bombarded by a 70 eV electron beam. Molecular fragments are detected via a broad-spectrum quadrupole detector. The identification of these fragments and their chemical structure is carried out using a molecular database.

2.3.6. Antioxidant Activity

The anti-free radical activity, for all sieved fractions was verified in vitro using four methods: The DPPH free-radical-scavenging method, according to the protocol described by Abdel-Hameed et al. [22]; the FRAP ferric to ferrous (Fe2+) reduction method, according to the protocol described by Boutakiout et al. [23]; the ABTS·+ test, performed according to the method reported by Nabil et al. [5]; and the molybdenum (MoVI) to molybdenum (MoV) reduction test and formation of a green phosphate/MoV complex, according to the protocol described by Lfitat, A et al. [24].

2.3.7. Determination of Pigments: Chlorophylls, Carotenoids, and Pheophytins

Pigment was quantified by measuring the following elements: chlorophyll a and b, pheophytins, and carotenoids using UV-vis spectroscopy, according to the method described by Hynstova et al. [25]. These pigments were calculated using the equations below.
Chlorophyll a =11.24 × A662 − 2.04 × A645 g/mL.
Chlorophyll b = 20.13 × A645 − 4.19 × A662 g/mL.
Total carotenoids = (1000 × A470−1.90 × Cha − 63.14 × Chb)/214 g/mL.
Total pheophytins = (321.3 × A653) − (208.4 × A654) g/mL.
Results were reported in mg/g on a dry weight basis. Where, A662, A645, A470, A652, A654 means the lecture of the Absorbance at 662, 645, 470, 652, 654 nm, respectively; Cha means chlorophyll a; Chb means chlorophyll b.

2.3.8. Functional and Physicochemical Properties

The functional and physicochemical properties of each argan pulp particle size fraction were determined by analyzing the following parameters: apparent density (g/cm3) determined according to the method described by Cheng, Y.F et al. [26]; powder swelling capacity (SC), water absorption capacity (WAC) and oil absorption capacity (OAC) according to the protocols described by Baljeet, S. Y et al. [27]; foaming capacity (FC) and foam stability (FS) were determined according to the protocols described by Odoemelam, S.A et al. [28]; Minimum Gel Concentration (MGC) according to the protocol used by Adebowale, Y.A [29]; water solubility index (WSI) was determined according to the method of Mourjane, A et al. [20]. Moisture percentage and ash percentage were calculated as mass difference according to AOAC [30]; pH, soluble solids (Brix) and titratable acidity were evaluated according to Astello-García, M.G [31].

2.4. Statistical Analysis

The results were statistically processed via ANOVA analysis, Tukey test at 5% significance, and Pearson correlation. XLSTAT software (Version 2016, France) was used for principal component analysis (PCA).

3. Results and Discussion

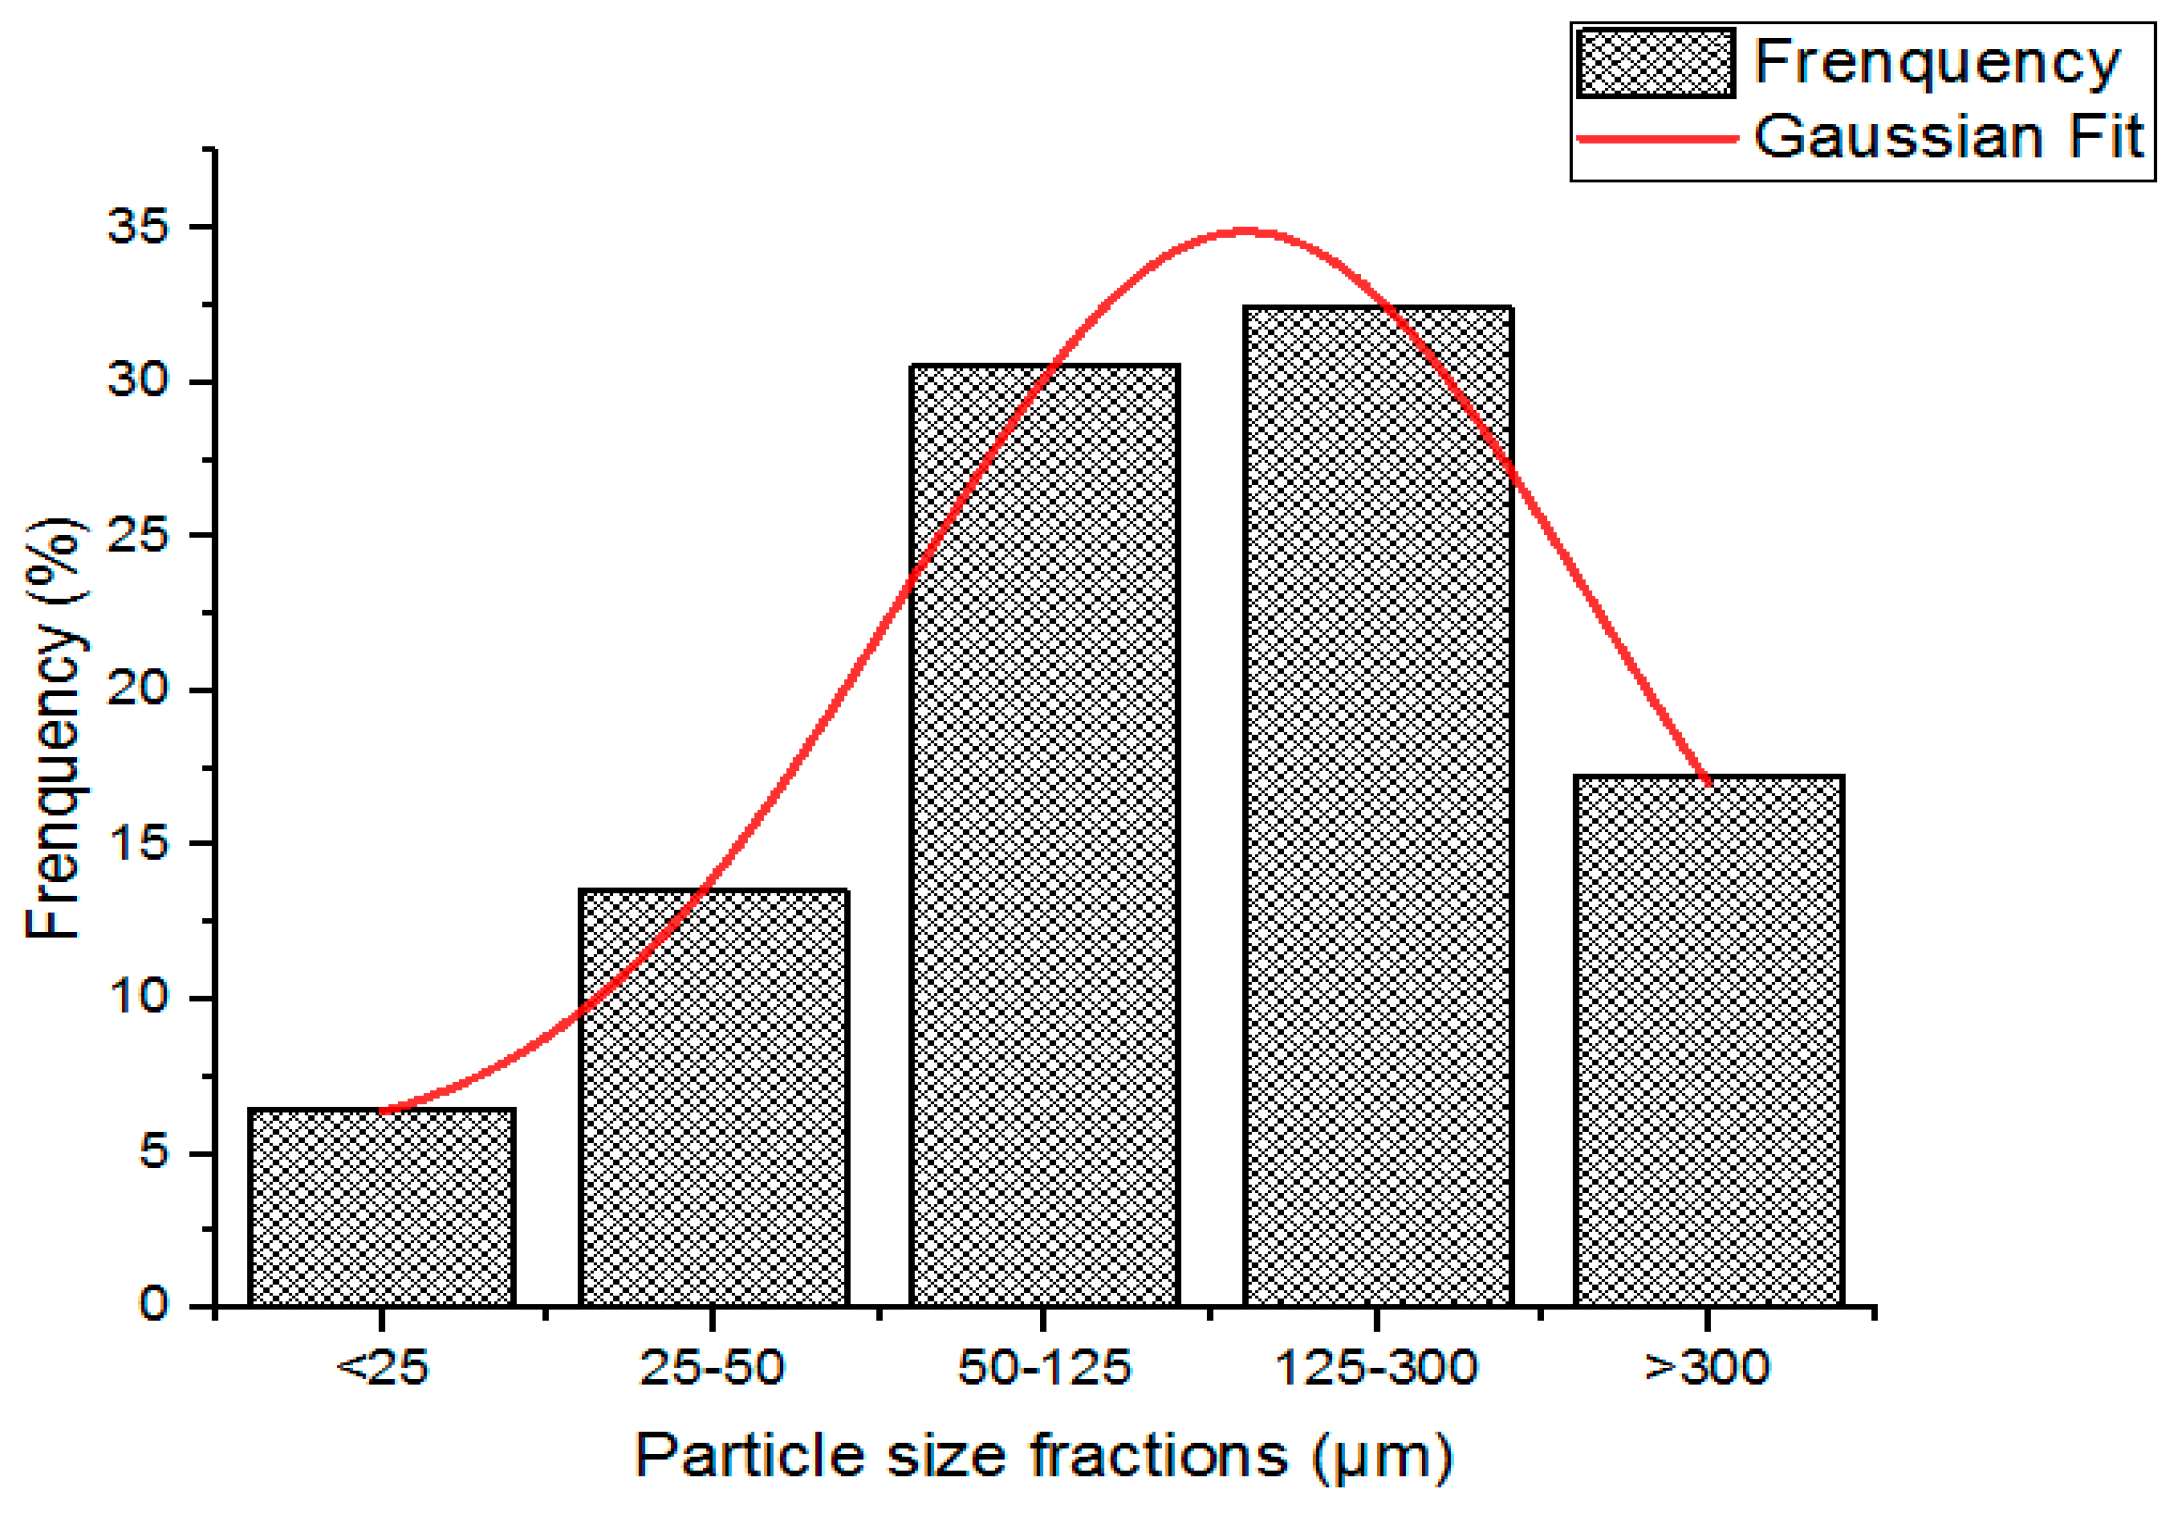
3.1. Particle Size Study

Figure 1 shows the particle size distribution curve for the five fractions. The repeatability of the pulp powder is in the form of a unimodal distribution. The mode represents the most common size range in the distribution. In this study, the mode corresponds to a fraction size of 125 to 300 µm. The particle size separation of the pulp powder indicated that the highest percentage by weight of particles was 32.41% for fractions 125 to 300, followed by fractions 50 to 125 at 30.59%. These larger particles correspond to unseparated or partially separated powder particles, which originate from the part of the pulp that is difficult to grind (e.g., fibers). In addition, the separation process produced the lowest weight ratio of fine particles <25 µm at 6.45%. This result reveals that grinding significantly reduces the particle size of the pulp powder and that the smallest particles were suspended granules (<25 μm). It is important to bear in mind that the high mass percentage may be due to grinding conditions that limit powder alteration and subsequent damage to bioactive compounds. However, if these size classes offer high contents of bioactive compounds with high antioxidant activity, this may justify their production of high-value-added food products and nutrients.

3.2. Particle Morphology (SEM Analysis)

Microscopic study of the morphology of the sieved powder is shown in Figure 2. The morphology of the sieved powder showed that certain size classes were formed by the agglomeration of small particles, indicating the binding effect due to the presence of starch and pectin. As can be seen in Figure 2A,C, the shape of these macromolecules was spherical with irregular fragments and an agglomerated structure due to mucilage as described by León Martinez et al. [32]. The particles resulting from the screening have dense structures with a granular surface and tend to decrease with particle size, which explains the effect on functional properties that will be discussed later.
Previous reports have confirmed that particle shape is affected by grinding methods. Yu et al. [33] showed that the wet milling method reduces the extent of damage to buckwheat flour particles compared with the dry milling method. Furthermore, Tong et al. [34] reported that the semi-dry method at 30% moisture can protect the integrity of starch granules by reducing the degree of damage caused to rice flour. On the other hand, the 50–25 and 25 µm microcompartments showed an easily recognizable porous structure (Figure 2C) due to mechanical grinding that completely broke the pulp fibers. Scanning electron microscopy analyses showed that the particle size of the cladode powder could be effectively reduced after grinding, and granular damage was observed in the argan pulp flour due to the grinding process, resulting in the fragmentation of large starch particles into smaller fragments.

3.3. Total Polyphenol Content and Total Flavonoid Content

The results obtained for the total phenolic and flavonoid content of the sieved powders are presented in Figure 3. The maximum of total polyphenols was recorded for the particle size classes of 50–125 µm with an estimated 893.33 mg GAE/100 g DW. However, the maximum for flavonoids was recorded for the <25 µm particle size class with 128.67 mg CE/100 g DW. Figure 3a shows the positive and negative correlations between polyphenol content and particle size distribution. For the first phase, the smaller the particle size, the higher the polyphenol content, up to an optimum limit between 50 and 125 µm, which is coherent. The greater the contact surface between the granules and the solvent towards the smaller size, the greater the diffusion and the better the extraction. Beyond this range, a drop in phenolic concentration is observed. This is paradoxical because there is both a physical and a chemical aspect. Polyphenols are oxidizable and thermodegradable [20]. In fact, oxygen and temperature are elements that can lead to the chemical and physical degradation of polyphenols (chemical and physical oxidation), as larger surfaces favor polyphenol degradation. The present results are in full agreement with previous work reported by Chen et al. [35] for okra powder.

3.4. Molecular Analysis by HPLC

LC was used to monitor the effect of particle separation after grinding on certain phenolic compounds. The results are shown in Table 1. Four phenolic acids (protocatechuic acid, ferulic acid, chlorogenic acid, and sinapic acid), one phenolic aldehyde (vanillin), three flavonoid aglycones (catechin, quercetin, and kaempferol), and one flavonoid glycoside (rutin) were detected. The results show that screening has a significant effect on the release of biologically active substances (phenolic compounds), both qualitatively and quantitatively. The total concentration of phenolic compounds ranged from 290.70 to 1904 mg/100 g DM.
Changes in protocatechuic acid concentration were proportional to decreasing particle size (from 4.44 ± 0.78 to 278.90 ± 2.07 mg/100 g MS, respectively). The other phenolic compounds behaved differently when particle size was below 300 μm. The concentration of rutin, catechin, quercetin, epicatechin, and chlorogenic acid was the highest (522.58 ± 1.10; 259.11 ± 1.21; 56.97 ± 0.27; 601.65 ± 1.21 and 350.99 ± 1.11 mg/100 g DM, respectively) for particle sizes between 300 μm and 125 µm. The rutin then decreased with lower particle size. However, the maximum kaempferol concentration for particle size was below 25 µm. These results could be due to the release of quercetin from quercetin-3-O-rutinoside (rutin) and its decomposition into protocatechuic acid under the influence of grinding temperature [36]. Indeed, it has been shown that quercetin-3-O-rutinoside can be degraded to quercetin at 70 °C. The latter, under the action of grinding temperature and in the presence of oxygen, readily oxidizes to phenolic carboxylic acid and other phenolic compounds [36]. It has been observed that epicatechin and catechin can undergo rapid hydrolysis at 70 °C and complete degradation at 100 °C. Depending on their structure, flavonoids are more or less sensitive to temperature. Glycosylated flavonoids are more resistant to heat treatment than Single flavonoids [37]. Degradation depends on the strength and chemical structure of each phenol, which explains why rutin is more resistant than epicatechin and catechin. However, vanillin is highly sensitive to oxidation and thermodegradation [20], which explains its absence in garnulometry below 300 µm.
The quantification of ferulic acid in all sieved fractions was low, hence their absence in granula of <25 μm. This can be explained by its conversion to vanillin or caffeic acid via the demethylation reaction [38,39]. All granulometric fractions are very rich in flavonoids. Moreover, the majority of phenolic acids (caffeic, salicylic, vanillic, and p-coumaric acid) were not identified. This observation is consistent with the results reported by Stavchansky et al. [40].

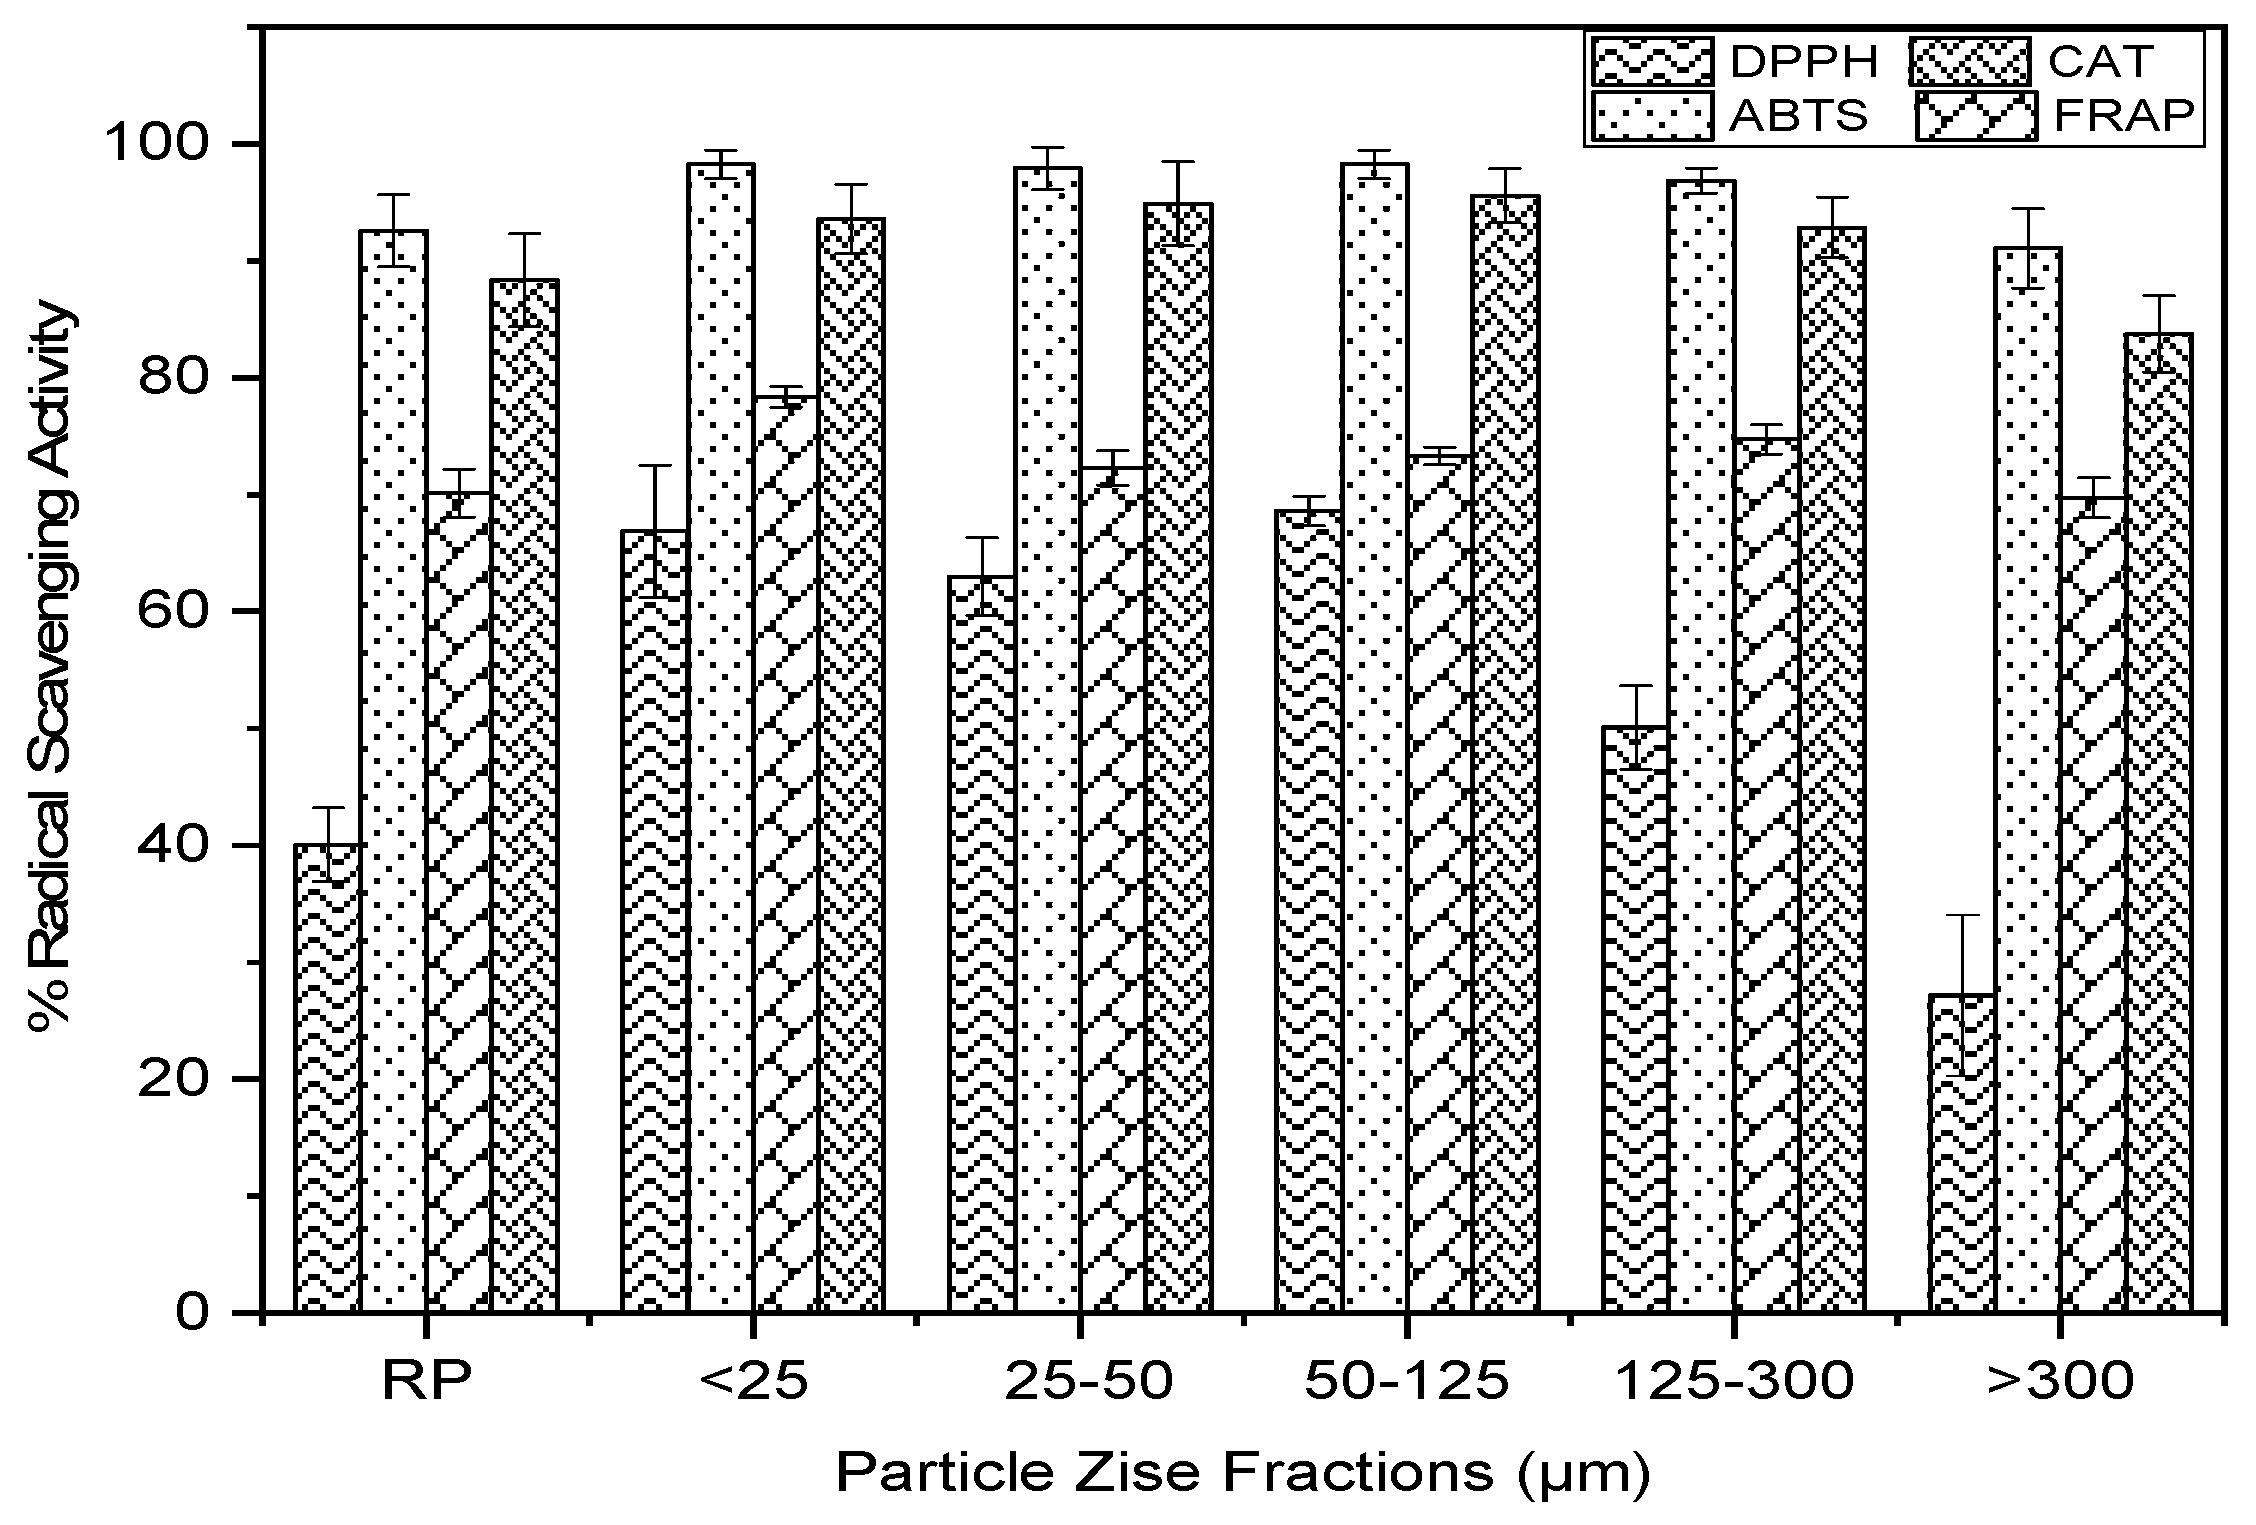
3.5. Antioxidant Activity

The effect of particle size on antioxidant activity was determined using four methods: DPPH, FRAP, ABTS, and TAC (Figure 4). ABTS and TAC produced similar results, while FRAP and DPPH showed lower values. The maximum antioxidant activity estimated via molybdate reductase was recorded for two categories: 95.57% and 94.89% for 50–125 μm and 25–50 μm, respectively. The ABTS test showed that antioxidant activity for all particle size classes is very high and not significant (p < 0.05) as a function of particle size, ranging from 98.24 ±1.21% to 91.06 ±3.38%. This allows us to conclude that antioxidant activity is linked to the quality of the bioactives and not to their quantity. The different levels of antioxidant activity obtained may reflect a relative difference in the ability of antioxidant compounds present in the extracts to scavenge aqueous peroxyl radicals and reduce ABTS radicals, DPPH free radicals, ferric iron, and molybdate reduction.
In the case of large particles, molecule diffusion is very low due to the lack of contact surface between the powder and the solvent, leading to high-quality phenolic molecules with little degradation. On the other hand, the smaller the particle size, the better the diffusion, but above a certain limit, there will be physicochemical alterations in the quality of the molecules. This explains the reduced antioxidant activity of small particles. Consequently, the thermal effect resulting from the grinding and screening processes can have a negative effect on the content of bioactive compounds and the antioxidant activity, as observed with the granulometric classes (<25 μm).
The correlation of antioxidant activity obtained via the DPPH assay with TAC and the ABTS assay with TAC was positively high (r = 0.95 and r = 0.98, respectively). A low correlation of the FRAP test was observed with all other activity tests. A strong correlation was observed between antioxidant activity estimated via three tests and phenolic compound content (r = 0.68, 0.71 and 0.81 for DPPH, ABTS, and TAC, respectively). This proves that phenolic compounds and flavonoids are the main contributors to the antioxidant power of argan pulp powder, especially for the average fraction of 50–125 μm. A similar trend was observed for unripe banana powder extracts [11].

3.6. GC-MS Analysis

Volatile compounds in crushed and sieved argan pulp were analyzed as a quality indicator and their compositions were studied via GC-MS (Table 2). The results show a slight difference in oil composition across the granulometric classes. The new sterols, alpha-amirin and oleane-12-en-3-ol acetate, predominated in all particle size classes, compared with the other compositions. Other unidentified components were detected in significant quantities, corresponding to retention times of 56.91 and 57.70 min. The percentages of α-amyrin acetate and oleane-12-en-3-ol were highest at intermediate particle sizes (<300 and >50 μm). The mixture of α-amyrin acetate and olean-12-n-3-ol has been reported to have a potential effect on hyperglycemia and hypolipidemia [41]. Particle size separation showed that the lipid composition was slightly affected, indicating that sieving has no negative impact on the chemical composition of the pulp. Therefore, depending on the needs of the industrial market, the above results will be very useful.

3.7. Pigment Determination

The relationship between the particle size and the concentrations of chlorophyll a and b, pheophytin and carotenoids is illustrated in Figure 5. The results show that the variation in chlorophyll a, chlorophyll b, and phyophytin content with different particle size classes was almost negligible, whereas the abundance of pheophytin was very high compared with other pigments. This could be due to the mechanical degradation of chlorophyll b to pheophytin, which often occurs with heat treatment [42]. Due to its chemical composition, chlorophyll contains a large proportion of plant nitrogen, which directly determines the possibility of photosynthesis. It should be noted that the presence of chlorophyll and phenols in cladodes is due to low enzymatic activity, leading to a high nutritional value [43]. In addition, a recent report has shown that chlorophyll has a complementary protective effect against UV radiation [44]. Chlorophyll and pheophytin have strong DPPH radical-scavenging and beta-carotene-bleaching effects, due to the presence of the central magnesium atom, which converts the electron donor capacity in the conjugated porphyrin system [45].

3.8. Physicochemical Properties

Table 3 shows the physicochemical and functional properties of sieved samples. The water content of powders is one of the factors that can directly or indirectly affect the physical and chemical properties and shelf life of foods [46]. All fractions were in appropriate storage conditions in terms of water content (6.76–5.31%) and were significantly different from each other (p > 0.05). Our results are consistent with those of Becker et al. [47], who reported that the heating effect of grinding was more pronounced for smaller particles and led to lower water content. Reducing the pulp powder size from 300 to 25 μm showed that screening significantly affected the nutritional profile, in particular, the content of ash and soluble solids (6.19–4.22%) and (9.33–4.97° Brix), respectively. However, particle size separation also affected pH values (4.52–3.85) and titratable acidity. In this context, it was reported by Savlak et al. [11] that for immature banana flour (700–212 μM), the pH was not affected by sieving. Furthermore, Becker et al. [48] reported that sieving had a significant impact on flour quality, chemical composition, and other nutrients such as proteins, fats, and carbohydrates, particularly for small particles.

3.9. Functional Properties

The functional properties studied for the five fractions are presented in Table 3. Water holding capacity is an essential functional property in the development, cohesion, and maintenance of food product viscosity. The water absorption capacity (WAC) increased significantly (p < 0.05) with particle size and ranged from 14.17 to 26.18%. These results are in agreement with those of the fractionation of cladode powder (Opuntia fi-cus-indica) studied by Nabil et al. [13] and those of leaf powder (Vaccinium bracteatum Thunb) studied by Jiang et al. [49]. The variation of WAC with fraction size is attributed to the number of hydration positions, pH, the presence of lipids and carbohydrates such as fibers that favor interactions with water through hydrogen bonding [46]. Pearson’s test showed that WAC was negatively correlated with gelation concentration (LGC), swelling capacity (SC), and soluble solids (r = −0.92, r = −0.74, r = −0.60), respectively. This may be due to the presence of polysaccharide chains that associate perfectly with water. The swelling and water retention capacities also depend on the composition and structure of the powder. For okra powder and quinoa flour, the WAC showed an opposite trend depending on particle size, while the SC was similar to the present results [4,5,6,7,8,9,10,11,12,13,14,15,16,17,18,19,20,21,22,23,24,25,26,27,28,29,30,31,32,33,34,35]. The water solubility index (WSI) varied from 47.63 to 33.52% depending on particle size, this can be explained by the sensitivity to temperature or emulsion formed, especially for finer particles, which limits the separation of particles adequately after centrifugation and the leaching of water-soluble components [50]. The high oil absorption capacity makes the flours suitable for improving taste and mouthfeel when used in food preparations. A significant variation (p < 0.05) was observed for oil retention as a function of fraction size. Thus, the correlation matrix showed that oil absorption capacity was positively correlated with WAC and SC (r = 0.90 and r = 0.71, respectively), and negatively correlated with the other properties. The bulk density varied proportionally with particle size from 0.31 to 0.62 g/cm3. This indicates a low porosity of the powder with low auto-oxidation. With regard to weight, it can be an advantage for preventing spoilage and in packaging, and it can be beneficial for filling tablets or capsules [51,52].
Furthermore, Ndife et al. [53] are of the opinion that the bulk density of flours is affected by moisture content. Significant positive correlations were found between bulk density and swelling capacity (r = 0.89) and between bulk density and Brix (r = 0.88), which can be explained by the presence of small particles in a large mass, which leads to increased swelling that also allows the release of a large amount of soluble sugar. Overall, the effect of milling is an important parameter that could create a large contact surface, providing a combination of physical and chemical mechanisms that act on the functional properties of the particles. In addition, grinding and sieving conditions (mechanical force and intensity) can lead to a significant change in fractional compositions, fibrils, soluble proteins, carbohydrates, lipids, and other substances [33]. The foaming capacity of flour decreased significantly (p < 0.05), corresponding to the increase in sieved particle size. The class > 300 µm presented the lowest foaming capacity (13.67%) compared to the other particle size classes. The low foaming capacity could be due to insufficient electrostatic repulsions and excessive interactions between protein molecules [50].
Despite the high foaming capacity, the stability of the foam remains lower. Overall, we observed that foam stability varied significantly (p < 0.05), from 18.23% to 7.00% with increasing particle size. Foaming capacity and foam stability are important parameters for assessing the potential of flours to act as whipping agents in whipped products. Particles with high foam stability may find wide application in various bakery and confectionery products.

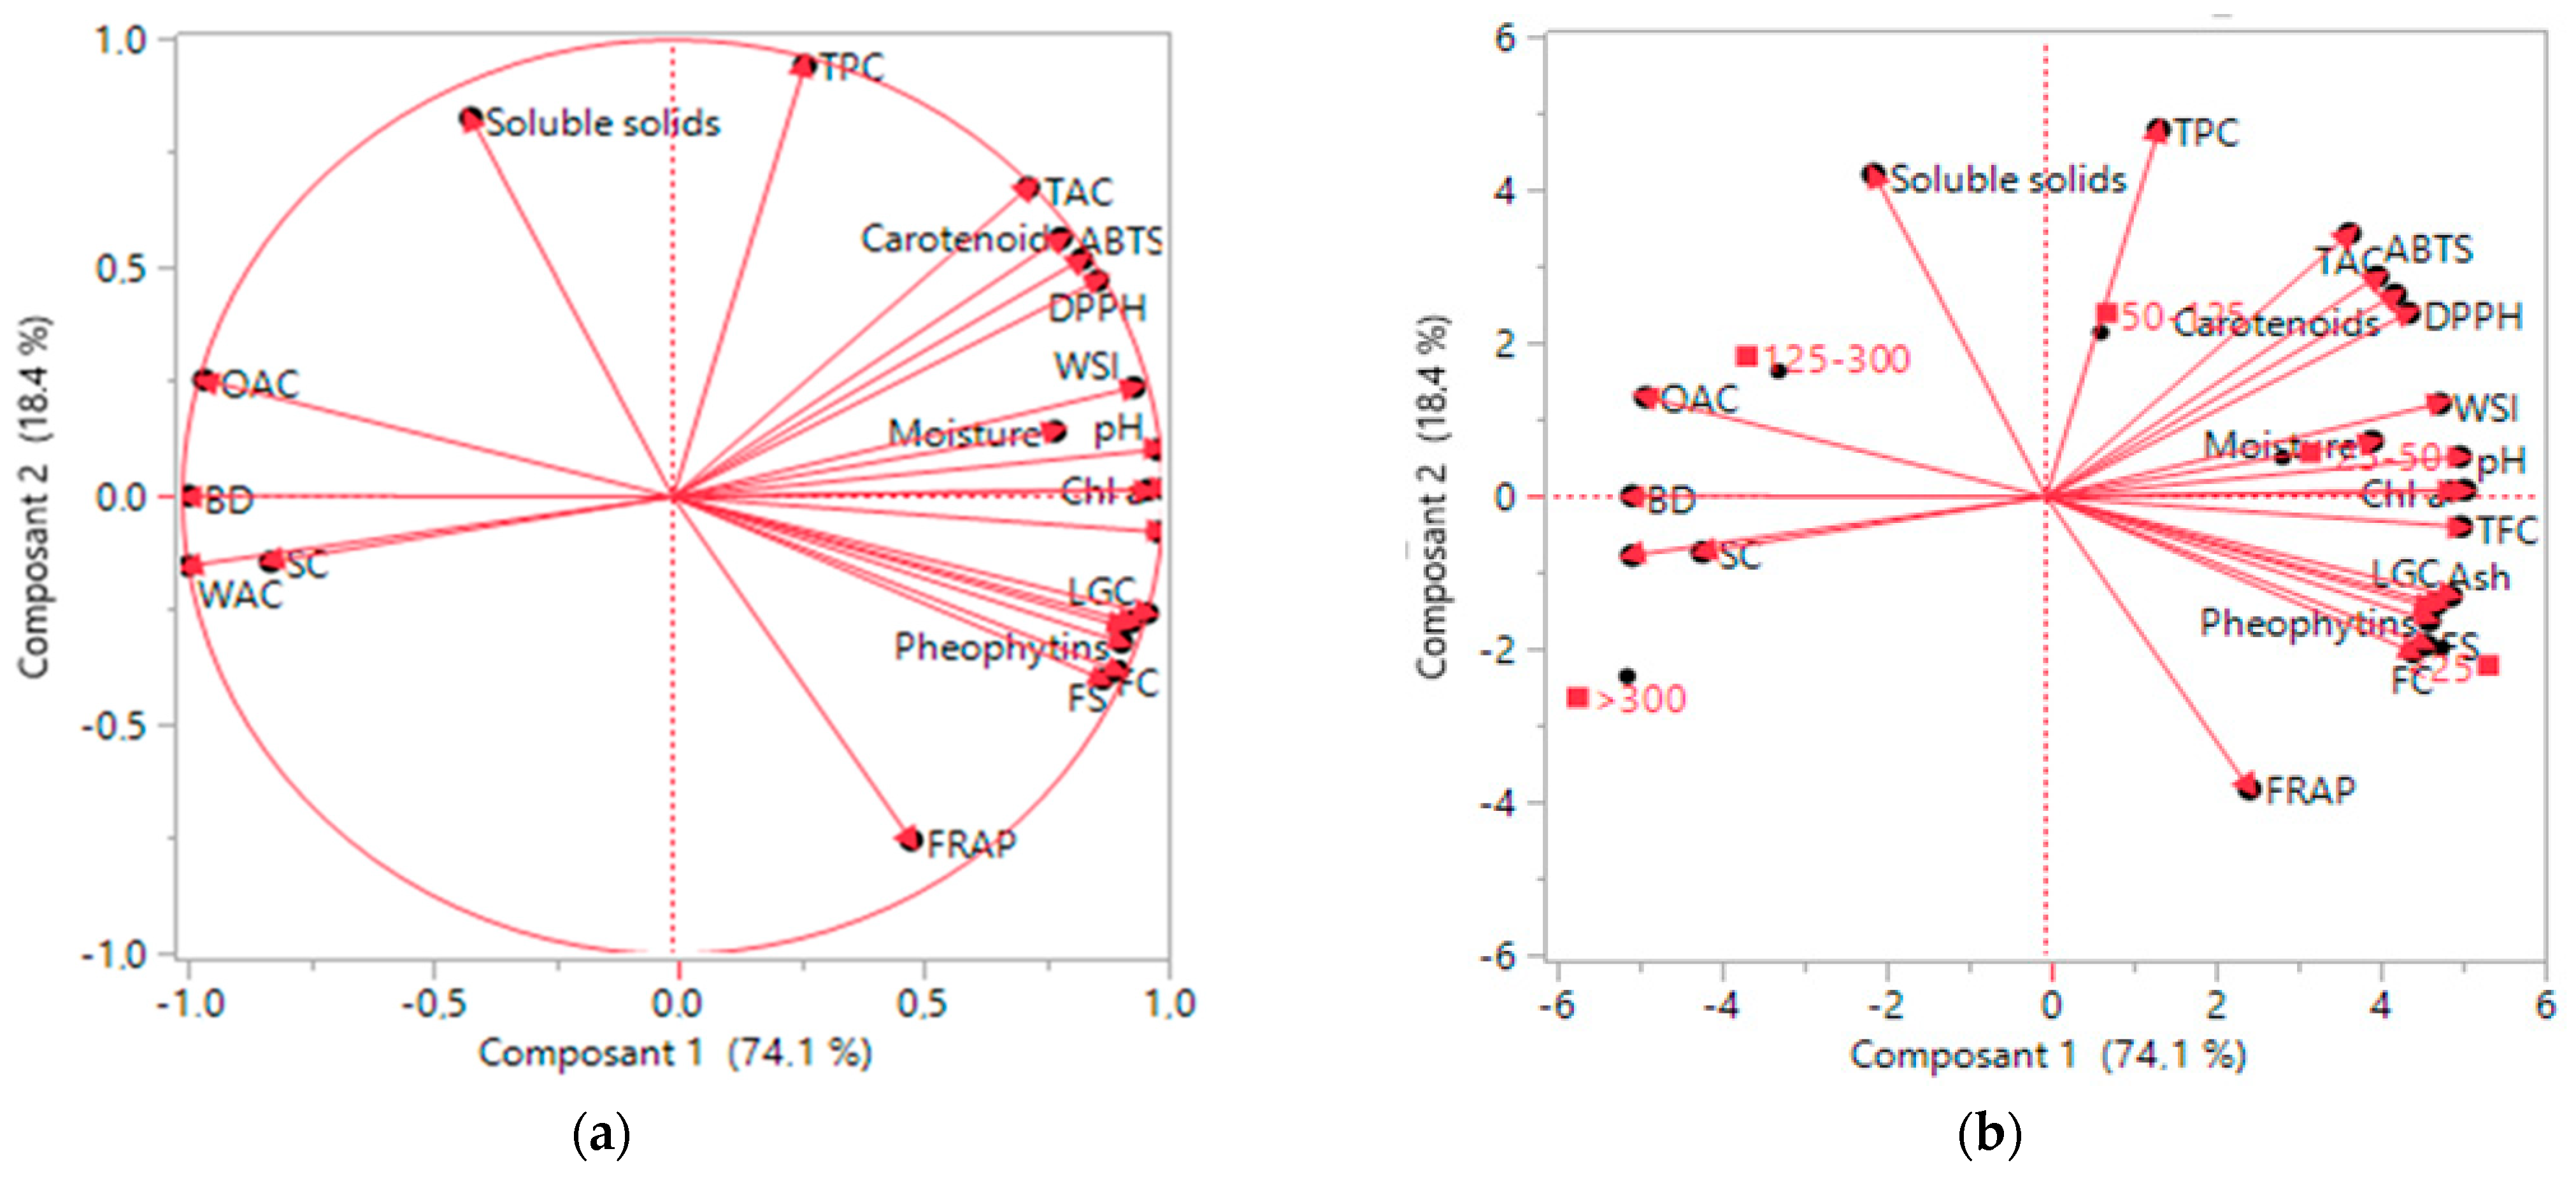
3.10. Principal Component Analysis (PCA)

PCA was used to determine the variation and trends in particle size for all the parameters studied. The effect of fractionation on functional and physicochemical properties and the content of bioactive and therapeutic compounds was observed in all five particle size classes obtained. Chemical parameters showed a wide variation between the different sieved powders. Figure 6 shows the distribution of the parameters studied and the relationships between them. A positive relationship was observed between total flavonoids, certain functional properties (WSI, LGC, FC and FS), pigments and antioxidant properties, and between functional properties (SC, WAC, OAC), BD and substances. While a negative correlation appeared and was expressed with the symmetry symbol for variables on both sides of the y-axis. The distribution of particle sizes (see Figure 6b), as a function of parameter evolution, revealed significant variation between all fractions.
The data clearly revealed four confined groups: small size fractions of <25 μm were associated with gel, ash, flavonoids, and chlorophyll degradation products as well as the FRAP antioxidant assay. Consequently, particle size fractions “25–50 μm and 50–125 μm” were correlated with antioxidant activity (DPPH, ABTS) and total phenolics and characterized by their water solubility index and carotenoid content. However, coarse particles between 125 and 300 μm were associated with soluble solids and a capacity as an emerging functional property.
It is worth noting that a particle size from 25 to 125 μm is strongly correlated with antioxidant and functional properties. This proves the added value of these particle size classes in the pharmaceutical and food industries. In addition, powders with smaller particles are more attractive as functional ingredients due to their antioxidant potential, richness in bioactive compounds, crystallization potential, and lightness.

4. Conclusions

The screening led to a differential distribution of the chemical composition and bioactive compounds of Moroccan argan fruit pulp powder, “Argania spinosa L.”, as a function of particle size. This study showed that particle size had a significant impact on the functional and physicochemical properties of the powder. Pulp particles ranging in size from 50 to 125 μm, offer high antioxidant potential and bioactive content. These results demonstrate the value of the screening process for improving the biochemical properties of argan pulp powder, and will help the food and pharmaceutical industries to develop products with an appropriate particle size ratio and optimal functional and nutritional applications.
Further research should be carried out on quality standards and applications, as there are few reports on this subject, as well as studies on in vivo models to assess the health effects of bioactive compounds from argan kernel powder.

Author Contributions

Conceptualization, H.H. and M.M.; methodology, E.M.E.A., M.O., A.M. and K.B.; validation, E.M.E.A., M.O., H.H. and M.M.; writing original draft preparation, A.M., E.M.E.A., M.O., H.H. and M.M.; writing review and editing, A.M., H.H., A.B. and M.M.; visualization, supervision, H.H., A.B. and M.M.; project administration, H.H. and M.M. All authors have read and agreed to the published version of the manuscript.

Funding

This study was supported by the Centre National de la Recherche Scientifique et Technique (CNRST) and the Moroccan Ministry of Higher Education, Scientific Research and Vocational Training.

Institutional Review Board Statement

Not applicable.

Informed Consent Statement

Not applicable.

Data Availability Statement

The data used to support the findings of this study are available from the corresponding author upon request.

Acknowledgments

The authors would like to thank the Centre National de la Recherche Scientifique et Technique (CNRST) and the Moroccan Ministry of Higher Education, Scientific Research and Vocational Training, for their financial support for the project, “Valorisation Scientifique et Industrielle des Produits Marocains”, PPR-BR2BINOV-Mahrouz -FS-UCA-Marrakech, Programme de Recherche Prioritaire. The authors would like to thank “Laboratoires IRCOS” and the “Cité de l’Innovation “de Marrakech for their collaboration on this project.

Conflicts of Interest

The authors declare no conflict of interest.

References

  1. Ashford, M. Bioavailability—Physicochemical and Dosage Form Factors. In Aulton’s Pharmaceutics; Elsevier Ltd.: Edinburgh, UK, 2013; pp. 314–333. [Google Scholar]
  2. Kumar, R.; Thakur, A.K.; Chaudhari, P.; Banerjee, N. Particle Size Reduction Techniques of Pharmaceutical Compounds for the Enhancement of Their Dissolution Rate and Bioavailability. J. Pharm. Innov. 2022, 17, 333–352. [Google Scholar] [CrossRef]
  3. Chaumeil, J. Micronization: A Method of Improving the Bioavailability of Poorly Soluble Drugs. Methods Find. Exp. Clin. Pharmacol. 1998, 20, 211–215. [Google Scholar] [CrossRef]
  4. Ahmed, J.; Thomas, L.; Arfat, Y.A. Functional, Rheological, Microstructural and Antioxidant Properties of Quinoa Flour in Dispersions as Influenced by Particle Size. Food Res. Int. 2019, 116, 302–311. [Google Scholar] [CrossRef]
  5. Nabil, B.; Ouaabou, R.; Ouhammou, M.; Saadouni, L.; Mahrouz, M. Impact of Particle Size on Functional, Physicochemical Properties and Antioxidant Activity of Cladode Powder (Opuntia ficus-indica). J. Food Sci. Technol. 2020, 57, 943–954. [Google Scholar] [CrossRef]
  6. Rosiak, N.; Cielecka-Piontek, J.; Skibiński, R.; Lewandowska, K.; Bednarski, W.; Zalewski, P. Antioxidant Potential of Resveratrol as the Result of Radiation Exposition. Antioxidants 2022, 11, 2097. [Google Scholar] [CrossRef]
  7. Teleky, B.-E.; Mitrea, L.; Plamada, D.; Nemes, S.A.; Călinoiu, L.-F.; Pascuta, M.S.; Varvara, R.-A.; Szabo, K.; Vajda, P.; Szekely, C.; et al. Development of Pectin and Poly(Vinyl Alcohol)-Based Active Packaging Enriched with Itaconic Acid and Apple Pomace-Derived Antioxidants. Antioxidants 2022, 11, 1729. [Google Scholar] [CrossRef]
  8. Phupaboon, S.; Matra, M.; Prommachart, R.; Totakul, P.; Supapong, C.; Wanapat, M. Extraction, Characterization, and Chitosan Microencapsulation of Bioactive Compounds from Cannabis sativa L., Cannabis indica L., and Mitragyna speiosa K. Antioxidants 2022, 11, 2103. [Google Scholar] [CrossRef]
  9. Sobiecka, E.; Mroczkowska, M.; Olejnik, T.P. The Influence of Chlorpyrifos on the Nonenzymatic Antioxidants Content in Macrophytes Leaves. Antioxidants 2022, 11, 684. [Google Scholar] [CrossRef]
  10. Rodriguez, I.F.; Pérez, M.J.; Cattaneo, F.; Zampini, I.C.; Cuello, A.S.; Mercado, M.I.; Ponessa, G.; Isla, M.I. Morphological, Histological, Chemical and Functional Characterization of Prosopis alba Flours of Different Particle Sizes. Food Chem. 2019, 274, 583–591. [Google Scholar] [CrossRef]
  11. Savlak, N.; Türker, B.; Yeşilkanat, N. Effects of Particle Size Distribution on Some Physical, Chemical and Functional Properties of Unripe Banana Flour. Food Chem. 2016, 213, 180–186. [Google Scholar] [CrossRef]
  12. Goh, H.P.; Heng, P.W.S.; Liew, C.V. Comparative Evaluation of Powder Flow Parameters with Reference to Particle Size and Shape. Int. J. Pharm. 2018, 547, 133–141. [Google Scholar] [CrossRef] [PubMed]
  13. Lazaridou, A.; Marinopoulou, A.; Biliaderis, C.G. Impact of Flour Particle Size and Hydrothermal Treatment on Dough Rheology and Quality of Barley Rusks. Food Hydrocoll. 2019, 87, 561–569. [Google Scholar] [CrossRef]
  14. Charrouf, Z.; Guillaume, D. Secondary Metabolites from Argania spinosa (L.) Skeels. Phytochem. Rev. 2002, 1, 345–354. [Google Scholar] [CrossRef]
  15. Charrouf, Z.; Guillaume, D. Ethnoeconomical, Ethnomedical, and Phytochemical Study of Argania spinosa (L.) Skeels. J. Ethnopharmacol. 1999, 67, 7–14. [Google Scholar] [CrossRef] [PubMed]
  16. Hilali, M.; Charrouf, Z.; Aziz Soulhi, A.E.; Hachimi, L.; Guillaume, D. Influence of Origin and Extraction Method on Argan Oil Physico-Chemical Characteristics and Composition. J. Agric. Food Chem. 2005, 53, 2081–2087. [Google Scholar] [CrossRef]
  17. Charrouf, Z.; Hilali, M.; Jauregui, O.; Soufiaoui, M.; Guillaume, D. Separation and Characterization of Phenolic Compounds in Argan Fruit Pulp Using Liquid Chromatography–Negative Electrospray Ionization Tandem Mass Spectroscopy. Food Chem. 2007, 100, 1398–1401. [Google Scholar] [CrossRef]
  18. Charrouf, V. Valorisation de l’arganier: Résultats et perspectives. In Proceedings of the 5e Colloque Produits Naturels d’origine Végétale, Quebec, QC, Canada, 7–9 August 2001; University of Quebec: Quebec, QC, Canada, 2002; pp. 261–270. [Google Scholar]
  19. El Adnany, E.M.; Elhadiri, N.; Mourjane, A.; Ouhammou, M.; Hidar, N.; Jaouad, A.; Bitar, K.; Mahrouz, M. Impact and Optimization of the Conditions of Extraction of Phenolic Compounds and Antioxidant Activity of Olive Leaves (Moroccan picholine) Using Response Surface Methodology. Separations 2023, 10, 326. [Google Scholar]
  20. Mourjane, A.; Hanine, H.; El Adnany, E.M.; Ouhammou, M.; Hidar, N.; Nabil, B.; Boumendjel, A.; Bitar, K.; Mahrouz, M. Energetic Bio-Activation of Some Organic Molecules and Their Antioxidant Activity in the Pulp of the Moroccan Argan Tree «Argania spinosa L.». Molecules 2022, 27, 3329. [Google Scholar] [CrossRef]
  21. Tranchant, J. Chromatographie en Phase Gazeuse, 3rd ed.; Masson: Paris, France, 1982. [Google Scholar]
  22. Abdel-Hameed, E.-S.S.; Nagaty, M.A.; Salman, M.S.; Bazaid, S.A. Phytochemicals, Nutritionals and Antioxidant Properties of Two Prickly Pear Cactus Cultivars (Opuntia ficus indica Mill.) Growing in Taif, KSA. Food Chem. 2014, 160, 31–38. [Google Scholar] [CrossRef]
  23. Boutakiout, A.; Elothmani, D.; Hanine, H.; Mahrouz, M.; Le Meurlay, D.; Hmid, I.; Ennahli, S. Effects of Different Harvesting Seasons on Antioxidant Activity and Phenolic Content of Prickly Pear Cladode Juice. J. Saudi Soc. Agric. Sci. 2018, 17, 471–480. [Google Scholar] [CrossRef]
  24. Lfitat, A.; Zejli, H.; Bousraf, F.Z.; Bousselham, A.; El Atki, Y.; Gourch, A.; Lyoussi, B.; Abdellaoui, A. Comparative Assessment of Total Phenolics Content and in Vitro Antioxidant Capacity Variations of Macerated Leaf Extracts of Olea europaea L. and Argania spinosa (L.) Skeels. Mater. Today Proc. 2021, 45, 7271–7277. [Google Scholar] [CrossRef]
  25. Hynstova, V.; Sterbova, D.; Klejdus, B.; Hedbavny, J.; Huska, D.; Adam, V. Separation, Identification and Quantification of Carotenoids and Chlorophylls in Dietary Supplements Containing Chlorella vulgaris and Spirulina platensis Using High Performance Thin Layer Chromatography. J. Pharm. Biomed. Anal. 2018, 148, 108–118. [Google Scholar] [CrossRef]
  26. Cheng, Y.F.; Bhat, R. Functional, Physicochemical and Sensory Properties of Novel Cookies Produced by Utilizing Underutilized Jering (Pithecellobium jiringa Jack.) Legume Flour. Food Biosci. 2016, 14, 54–61. [Google Scholar] [CrossRef]
  27. Baljeet, S.Y.; Yadav, R.; Yadav, R. Studies on Functional Properties and Incorporation of Buckwheat Flour for Biscuit Making. Int. Food Res. J. 2010, 17, 1067–1076. [Google Scholar]
  28. Odoemelam, S.A. Functional Properties of Raw and Heat Processed Jackfruit (Artocarpus heterophyllus) Flour. Pak. J. Nutr. 2005, 4, 366–370. [Google Scholar] [CrossRef]
  29. Adebowale, Y.A.; Adeyemi, I.A.; Oshodi, A.A. Functional and Physicochemical Properties of Flours of Six Mucuna Species. Afr. J. Biotechnol. 2005, 4, 1461–1468. [Google Scholar]
  30. Association of Official Analytical Chemists. AOAC Official Methods of Analysis, 18th ed.; Association of Official Analytical Chemists: Gaithersburg, MD, USA, 2007. [Google Scholar]
  31. Astello-García, M.G.; Cervantes, I.; Nair, V.; Santos-Díaz, M.d.S.; Reyes-Agüero, A.; Guéraud, F.; Negre-Salvayre, A.; Rossignol, M.; Cisneros-Zevallos, L.; Barba de la Rosa, A.P. Chemical Composition and Phenolic Compounds Profile of Cladodes from Opuntia spp. Cultivars with Different Domestication Gradient. J. Food Compos. Anal. 2015, 43, 119–130. [Google Scholar] [CrossRef]
  32. León-Martínez, F.M.; Méndez-Lagunas, L.L.; Rodríguez-Ramírez, J. Spray Drying of Nopal Mucilage (Opuntia ficus-indica): Effects on Powder Properties and Characterization. Carbohydr. Polym. 2010, 81, 864–870. [Google Scholar] [CrossRef]
  33. Yu, D.; Chen, J.; Ma, J.; Sun, H.; Yuan, Y.; Ju, Q.; Teng, Y.; Yang, M.; Li, W.; Fujita, K.; et al. Effects of Different Milling Methods on Physicochemical Properties of Common Buckwheat Flour. Lebensm.-Wiss. Technol. 2018, 92, 220–226. [Google Scholar] [CrossRef]
  34. Tong, L.-T.; Gao, X.; Lin, L.; Liu, Y.; Zhong, K.; Liu, L.; Zhou, X.; Wang, L.; Zhou, S. Effects of Semidry Flour Milling on the Quality Attributes of Rice Flour and Rice Noodles in China. J. Cereal Sci. 2015, 62, 45–49. [Google Scholar] [CrossRef]
  35. Chen, Y.; Zhang, B.-C.; Sun, H.-J.; Zhang, J.-G.; Sun, Y.-H.; Wei, Z.-J. Physicochemical Properties and Adsorption of Cholesterol by Okra (Abelmoschus esculentus) Powder. Food Funct. 2015, 6, 3728–3736. [Google Scholar] [CrossRef] [PubMed]
  36. Chaaban, H.; Ioannou, I.; Chebil, L.; Slimane, M.; Gérardin, C.; Paris, C.; Charbonnel, C.; Chekir, L.; Ghoul, M. Effect of heat processing on thermal stability and antioxidant activity of six flavonoids. J. Food Process Preserv. 2017, 41, e13203. [Google Scholar]
  37. Razboršek, M.I.; Ivanovi’c, M.; Kolar, M. Validated stability-indicating GC-MS method for characterization of forced degradation products of trans-caffeic acid and trans-ferulic acid. Molecules 2021, 26, 2475. [Google Scholar]
  38. Zhao, C.; Liu, Y.; Lai, S.; Cao, H.; Guan, Y.; San Cheang, W.; Liu, B.; Zhao, K.; Miao, S.; Rivière, C.; et al. Effects of domestic cooking process on the chemical and biological properties of dietary phytochemicals. Trends Food Sci. Technol. 2019, 85, 55–66. [Google Scholar]
  39. Stavchansky, S.; Gowan, W.G. Evaluation of the Bioavailability of a Solid Dispersion of Phenytoin in Polyethylene Glycol 6000 and a Commercial Phenytoin Sodium Capsule in the Dog. J. Pharm. Sci. 1984, 73, 733–736. [Google Scholar] [CrossRef]
  40. Santos, F.A.; Frota, J.; Arruda, B.; Melo, T.; Castro Brito, G.; Chaves, M.; Rao, V. Antihyperglycemic and hypolipidemic effects of α,β-amyrin, a triterpenoid mixture from Protium heptaphyllum in the mouse. Lipids Health Dis. 2012, 11, 98. [Google Scholar]
  41. Ramírez-Moreno, E.; Córdoba-Díaz, D.; de Cortes Sánchez-Mata, M.; Díez-Marqués, C.; Goñi, I. Effect of Boiling on Nutritional, Antioxidant and Physicochemical Characteristics in Cladodes (Opuntia ficus indica). LWT-Food Sci. Technol. 2013, 51, 296–302. [Google Scholar] [CrossRef]
  42. Khales, A.; Baaziz, M. Quantitative and Qualitative Aspects of Peroxidases Extracted from Cladodes of Opuntia ficus indica. Sci. Hortic. 2005, 103, 209–218. [Google Scholar] [CrossRef]
  43. Qiu, Y.-K.; Chen, Y.-J.; Pei, Y.-P.; Hisashi, M.; Masayuki, Y. New constituents from the fresh stems of Opuntia dillenii. J. Chin. Pharm. Sci. 2003, 12, 1–5. [Google Scholar]
  44. Kang, Y.-R.; Park, J.; Jung, S.K.; Chang, Y.H. Synthesis, Characterization, and Functional Properties of Chlorophylls, Pheophytins, and Zn-Pheophytins. Food Chem. 2018, 245, 943–950. [Google Scholar] [CrossRef]
  45. Mathlouthi, M. Water Content, Water Activity, Water Structure and the Stability of Foodstuffs. Water Determ. Food-Chall. Anal. 2001, 12, 409–417. [Google Scholar] [CrossRef]
  46. Becker, L.; Zaiter, A.; Petit, J.; Zimmer, D.; Karam, M.-C.; Baudelaire, E.; Scher, J.; Dicko, A. Improvement of Antioxidant Activity and Polyphenol Content of Hypericum perforatum and Achillea millefolium Powders Using Successive Grinding and Sieving. Ind. Crops Prod. 2016, 87, 116–123. [Google Scholar] [CrossRef]
  47. Becker, L.; Zaiter, A.; Petit, J.; Karam, M.-C.; Sudol, M.; Baudelaire, E.; Scher, J.; Dicko, A. How Do Grinding and Sieving Impact on Physicochemical Properties, Polyphenol Content, and Antioxidant Activity of Hieracium pilosella L. Powders? J. Funct. Foods 2017, 35, 666–672. [Google Scholar] [CrossRef]
  48. Cassia, R.; Azevedo, P.; Pereira, G.; Araújo, M. Development and Validation of Dissolution Test for Captopril in Capsules by HPLC. Rev. Bras. Ciênc. Farm. 2008, 44, 261–269. [Google Scholar]
  49. Appiah, F.; Patrick, K.; Sebe, A.T.; Asibuo, J. Physicochemical and Functional Properties of Seeds of Three Local Cowpea (Vigna unguilata L. Walp) Cultivars in Ghana. Acta Hortic. 2011, 911, 437–446. [Google Scholar] [CrossRef]
  50. Jiang, L.; Xu, Q.-X.; Qiao, M.; Ma, F.-F.; Thakur, K.; Wei, Z.-J. Effect of Superfine Grinding on Properties of Vaccinium bracteatum Thunb Leaves Powder. Food Sci. Biotechnol. 2017, 26, 1571–1578. [Google Scholar] [CrossRef] [PubMed]
  51. Ahmed, J. Effect of Particle Size and Temperature on Rheology and Creep Behavior of Barley β-d-Glucan Concentrate Dough. Carbohydr. Polym. 2014, 111, 89–100. [Google Scholar] [CrossRef]
  52. Costa, F.O.; Pais, A.A.C.C.; Sousa, J.J.S. Analysis of Formulation Effects in the Dissolution of Ibuprofen Pellets. Int. J. Pharm. 2004, 270, 9–19. [Google Scholar] [CrossRef]
  53. Ndife, J.; Kida, F.; Fagbemi, S. Production and Quality Assessment of Enriched Cookies from Whole Wheat and Full Fat Soya. Eur. J. Food Sci. Technol. 2014, 2, 19–28. [Google Scholar]
Figure 1. Particle size distribution of argan pulp powder. Values are mean ± standard deviation (n = 3).
Separations 10 00542 g001
Figure 2. Scanning electron microscopy (SEM) images of different particle size classes. (A) >300 µm, (B) >125; ≤300 µm, (C) >50; ≤125 µm, (D) >25; ≤50 µm, (E) ≤25 µm.
Separations 10 00542 g002
Figure 3. (a) The impact of granulometry on the total polyphenol content (TPC). (b) The impact of granulometry on the total flavonoid content (TFC).
Separations 10 00542 g003
Figure 4. Antioxidant activity as determined via the ABTS, DPPH, TAC, and FRAP assays from different size fractions.
Separations 10 00542 g004
Figure 5. Content of chlorophyl a, chlorphyl b, pheophytins, and carotenoids function of the particles size of argan pulp powder.
Separations 10 00542 g005
Figure 6. Principal component analysis. (a) The distribution of the studied parameters and the relationships between them; (b) the distribution of the particles size with the studied parameters.
Separations 10 00542 g006
Table 1. Content of individual polyphenolic compounds of argan powder size classes determined via LC-DAD (mg/100 g DW).
Particle Size (µm)>300300–125125–5050–25≤25
Protocatechuic acid4.44 ± 0.7815.57 ± 0.7236.37 ± 0.82108.87 ± 0.86278.90 ± 2.07
Caffeic acideNDNDNDNDND
Ferulic acid6.31 ± 0.4934.58 ± 0.2238.36 ± 0.3243.96 ± 0.22ND
HesperidinNDNDNDNDND
Salicylic acidNDNDNDNDND
Vanillic acidNDNDNDNDND
Catechin56.92 ± 1.03259.11 ± 1.21221.02 ± 0.91170.82 ± 1.02122.59 ± 1.24
Chorogenic acid64.90 ± 0.92350.99 ± 1.11300.98 ± 1.17199.12 ± 0.86125.70 ± 1.28
Epicathechin0.65 ± 0.28601.65 ± 1.21432.19 ± 1.33291.05 ± 1.36109.59 ± 1.06
Vanillin6.98 ± 0.59NDNDNDND
p-Coumaric acidNDNDNDNDND
Sinapic acidND NDND32.86 ± 0.7543.76 ± 0.55
NaringinNDNDNDNDND
Rutin88.36 ± 0.92522.58 ± 1.10369.78 ± 1.02288.96 ± 1.16211.78 ± 1.44
QuercetinND56.97 ± 0.2746.77 ± 0.4328.99 ± 0.6317.77 ± 0.31
Kaempferol62.12 ± 1.2263.07 ± 0.0999.27 ± 0.29179.55 ± 0.89304.39 ± 1.81
Totale 290.701904.52 1544.141344.181290.71
Values are presented as means ± standard deviation (SD) of three replicates. ND: not detected.
Table 2. Identification of volatile compounds in particle size classes.
CompoundRT (min)Mol. Formula>300<300; >125<125;
>50
<50;
>25
<25
Cis-p-mentha-1(7),8-dien-2-ol (%)7.82C10H16ONDND0.36 ± 0.010.39 ± 0.010.36 ± 0.01
Retinal (%)11.20C20H28O0.01 ± 0.000.02 ± 0.000.09 ± 0.000.01 ± 0.000.02 ± 0.00
Lycophyll (%)22.77C40H56O20.010.010.020.040.04
Androstatriene, 3-hydroxy-17-oxo (%)46.26C19H24O20.02 ± 0.00NDND0.02 ± 0.000.02 ± 0.00
Carotene, 3,4-didehydro-1,2-dihydro-1 m Ethoxy (%)14.54C41H58O0.03 ± 0.000.03 ± 0.000.02 ± 0.000.04 ± 0.000.04 ± 0.00
Olean-12-en-3-ol, acetate (%)49.82C32H52O21.55 ± 0.033.1 ± 0.124.32 ± 0.111.16 ± 0.051.18 ± 0.02
Amyrin (%)49.78C30H50O0.18 ± 0.010.2 ± 0.030.21 ± 0.010.08 ± 0.000.04 ± 0.00
2-Hydroxychalcone (%)34.13C15H12O2ND0.03 ± 0.000.01 ± 0.000.02 ± 0.000.02 ± 0.00
Ethyl iso-allocholate (%)21.88C26H44O50.02 ± 0.000.01 ± 0.000.05 ± 0.000.03 ± 0.000.02 ± 0.00
Spirost-8-en-11-one, 3-hydroxy (%)51.78C27H40O40.01 ± 0.000.04 ± 0.000.03 ± 0.000.06 ± 0.000.03± 0.00
Betulin (%)28.91C30H50O20.03 ± 0.000.01 ± 0.000.06 ± 0.000.06 ± 0.000.04 ± 0.00
Lupeol (%)45.97C30H50O0.01 ± 0.000.01 ± 0.000.01 ± 0.000.01 ± 0.00 0.01 ± 0.00
Octamethyl-docosahydropicene-3,13-diol (%)46.13C30H52O20.07 ± 0.000.01 ± 0.00ND0.02± 0.000.06 ± 0.00
Betulinaldehyde (%)46.28C30H48O20.01 ± 0.000.03 ± 0.00 0.03 ± 0.000.08 ± 0.000.04 ± 0.00
Carbenoxolone (%)46.32C34H50O7ND0.07 ± 0.00NDND0.07 ± 0.00
Astaxanthin (%)14.05C31H50O3ND0.02 ± 0.000.05 ± 0.000.04 ± 0.000.01 ± 0.00
Urs-12-en-28-oic acid, 3-hydroxy-, methyl ester (%)46.24C30H50O20.05 ± 0.000.03 ± 0.000.07 ± 0.000.06 ± 0.00ND
Values are presented as means ± standard deviation (SD) of three replicates. ND: not detected.
Table 3. Physicochemical properties and functional properties of five particle size classes of argan pulp powder.
Size Fractions (µm)<2525–5050–125125–300>300
Moisture (%)6.41 ± 0.576.57 ± 0.126.76 ± 0.095.31 ± 0.075.68 ± 0.40
Ash (%)6.19 ± 0.275.63 ± 0.114.63 ± 0.264.44 ± 0.454.22 ± 0.30
pH4.52 ± 0.034.39 ± 0.064.34 ± 0.043.99 ± 0.053.85 ± 0.08
Titrable acidity (% citric acide)3.66 ± 0.053.71 ± 0.073.45 ± 0.073.13 ± 0.073.09 ± 0.03
soluble solide (°Brix)4.23 ± 0.065.93 ± 0.067.07 ± 0.069.33 ± 0.064.97 ± 0.12
WAC (%)14.17 ± 0.2915.99 ± 0.7117.65 ± 0.3822.43 ± 0.4026.18 ± 0.17
OAC (%)8.22 ± 0.1910.11 ± 0.1114.19 ± 0.3216.26 ± 0.2316.43 ± 0.38
SC (mL)14.77 ± 0.2514.50 ± 0.5014.33 ± 0.5816.67 ± 0.5816.17 ± 0.29
LGC (%)20.00 ± 0.0018.00 ± 0.0016.00 ± 0.0014.00 ± 0.0014.00 ± 0.00
BD (g/cm3)0.31 ± 0.020.34 ± 0.010.42 ± 0.010.60 ± 0.010.62 ± 0.01
WSI (g/100 g)47.63 ± 0.3743.61 ± 0.4244.12 ± 0.7539.84 ± 0.6933.52 ± 0.47
FC (%)39.83 ± 0.7629.00 ± 1.0015.33 ± 1.1515.18 ± 1.2913.67 ± 0.28
FS (%)18.23 ± 0.2514.10 ± 0.368.33 ± 0.586.88 ± 0.347.00 ± 0.24
Values are averages ± standard deviation (n = 3). WAC: water absorption capacity, OAC: oil absorption capacity, SC: swelling capacity, BD: bulk density, LGC: minimum gelling concentration, WSI: water solubility index, FC: foaming capacity, FS: foaming stability.
Disclaimer/Publisher’s Note: The statements, opinions and data contained in all publications are solely those of the individual author(s) and contributor(s) and not of MDPI and/or the editor(s). MDPI and/or the editor(s) disclaim responsibility for any injury to people or property resulting from any ideas, methods, instructions or products referred to in the content.

