


Determination of Lysergic Acid Diethylamide and 2-Oxo-3-Hydroxy-LSD in Blood: Validation and Comparison of Two Liquid Chromatography–Tandem Mass Spectrometry Methods
 , ,
, ,
Abstract
:1. Introduction
2. Materials and Methods
2.1. Chemicals and Reagents
2.2. Sample Treatments
2.2.1. Method #1: PP
2.2.2. Method #2: LLE
2.3. LC-MS/MS
2.3.1. Method #1
2.3.2. Method #2
2.4. Validation Parameters
2.4.1. Interferences Studies
2.4.2. Limit of Detection (LOD) and Lower Limit of Quantification (LLOQ)
2.4.3. Calibration Model
2.4.4. Bias and Precision
2.4.5. Recovery Rate (RR), Matrix Effect (ME) and Carry-Over
3. Results
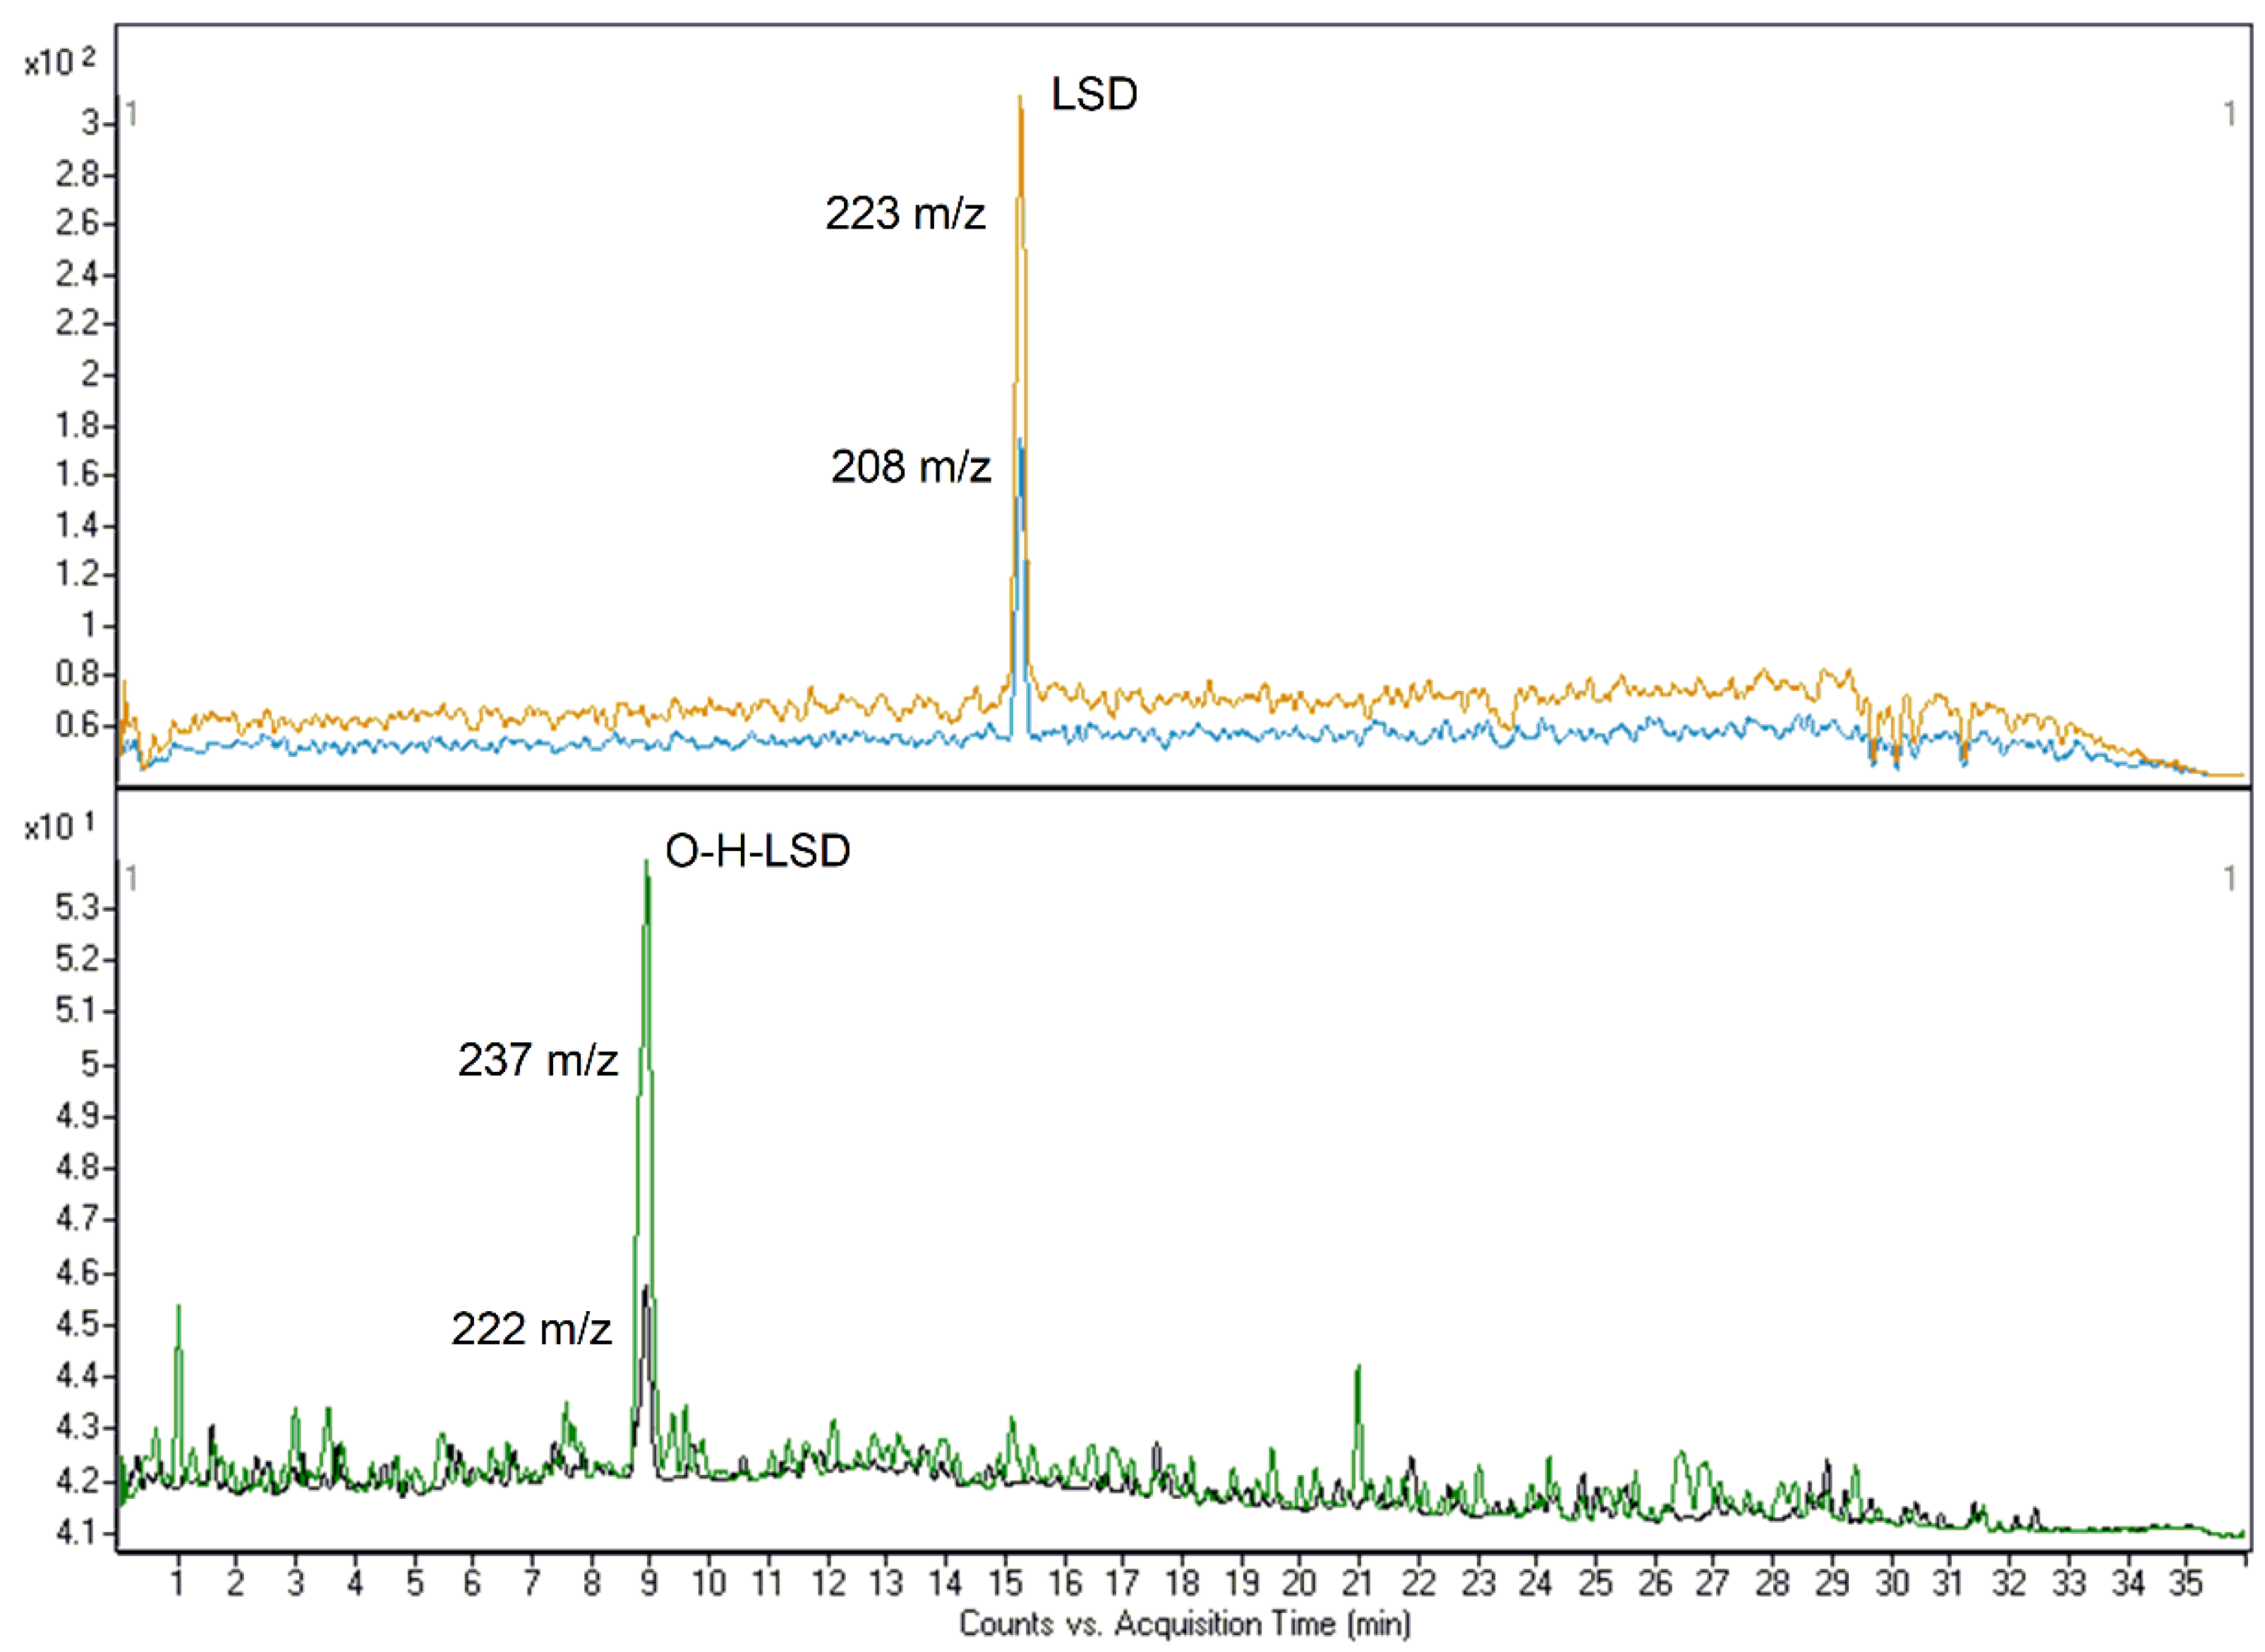
3.1. MRM Transitions and Chromatographic Separation
3.1.1. Method #1
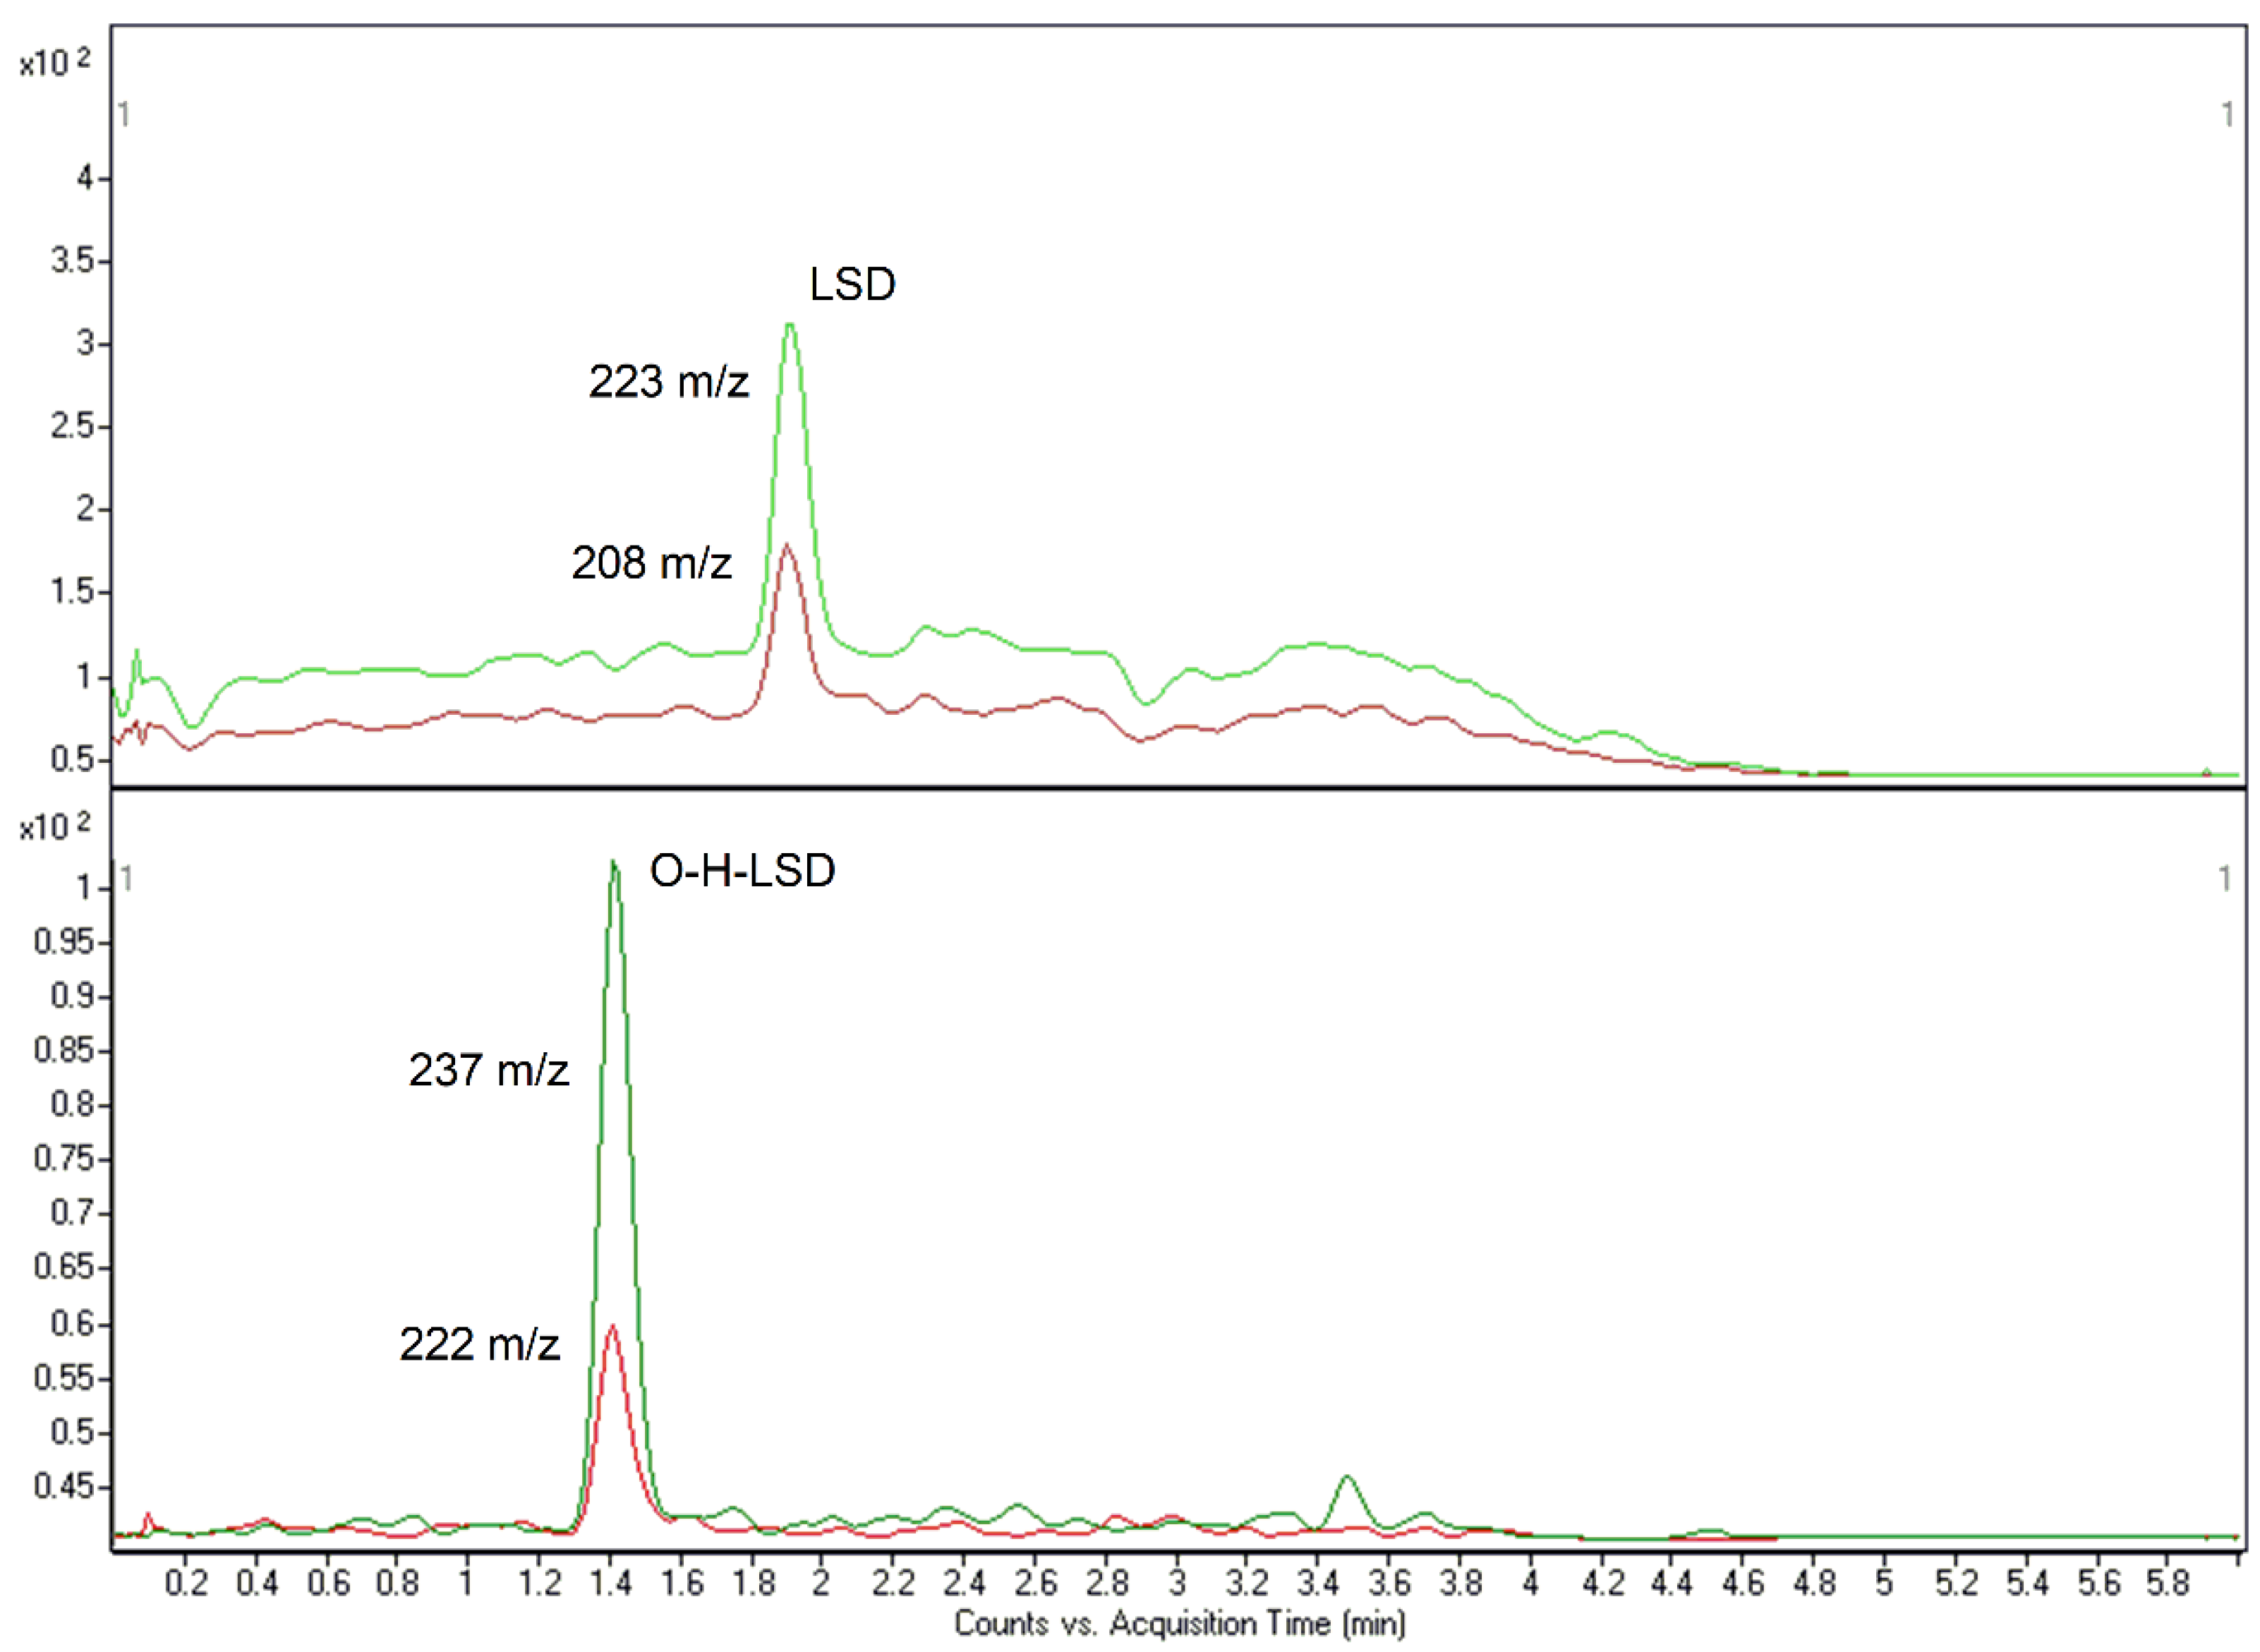
3.1.2. Method #2
3.2. Optimization of Sample Treatments
3.3. Methods Validation
4. Discussion
4.1. Method #1
4.2. Method #2
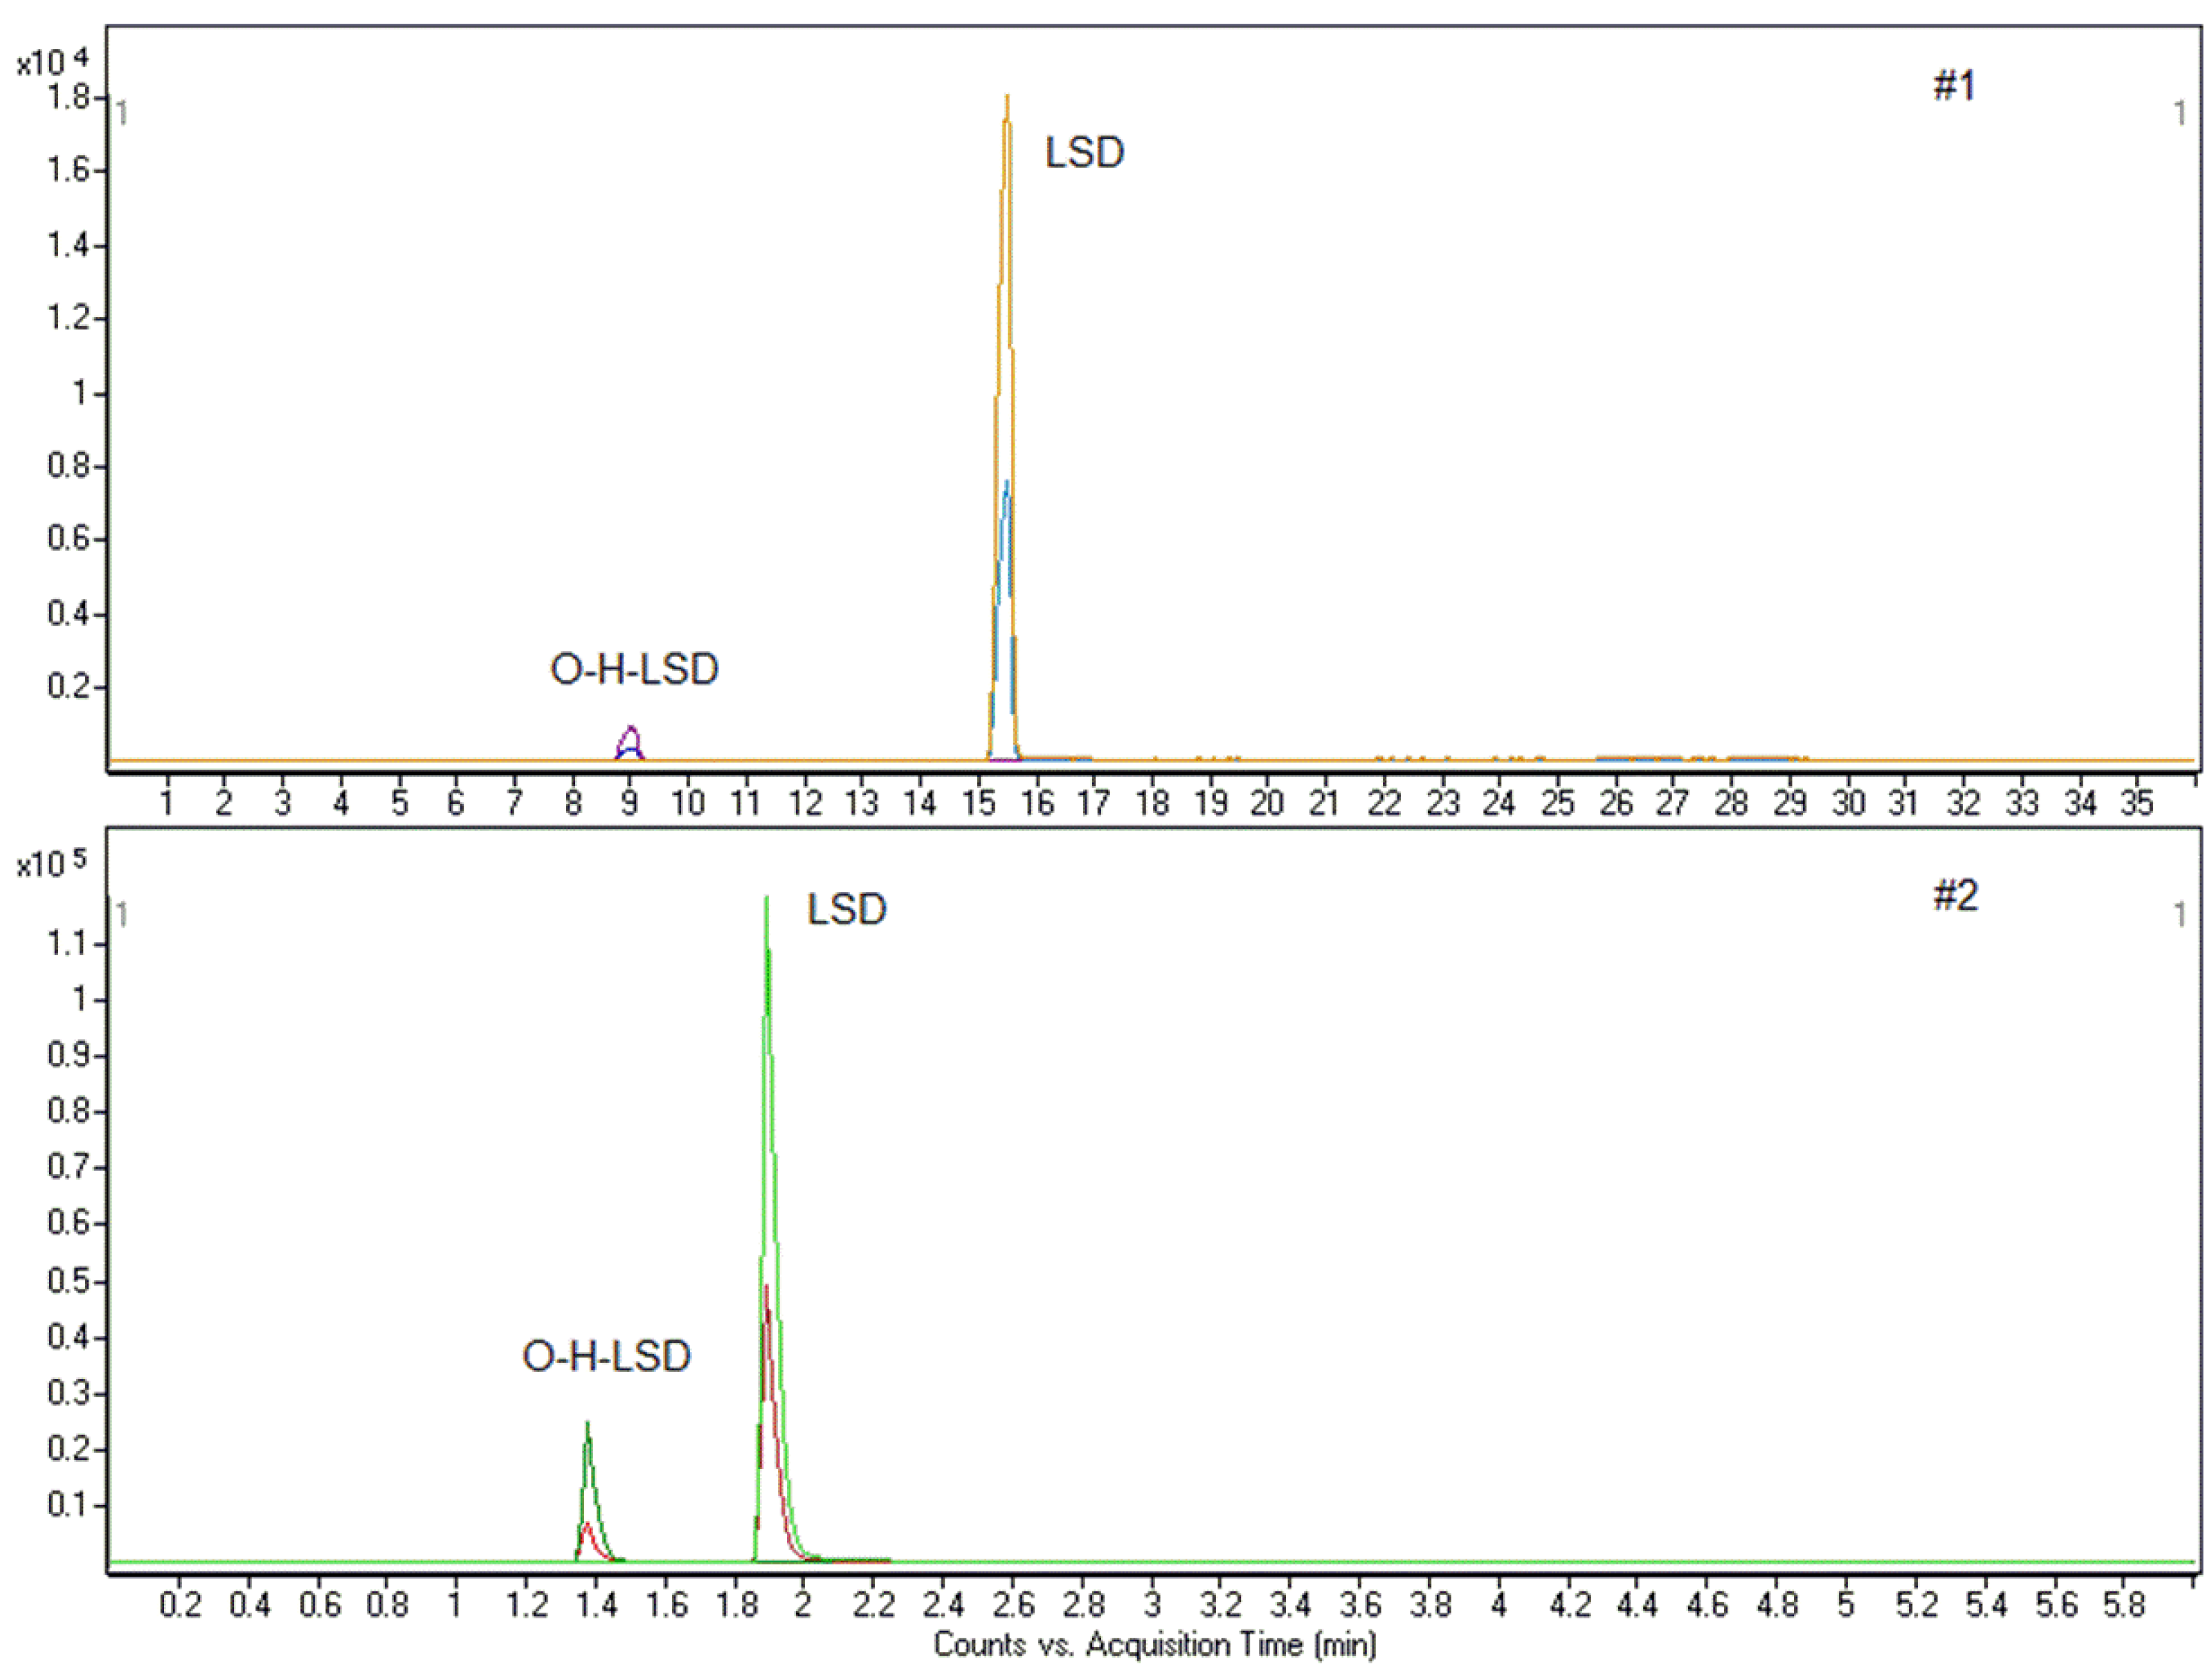
5. Application to Real Samples
5.1. Case 1
5.2. Case 2
6. Conclusions
Author Contributions
Funding
Data Availability Statement
Conflicts of Interest
References
- Jastrzębski, M.K.; Kaczor, A.A.; Wróbel, T.M. Methods of Lysergic Acid Synthesis-The Key Ergot Alkaloid. Molecules 2022, 27, 7322. [Google Scholar] [CrossRef]
- Schmid, Y.; Enzler, F.; Gasser, P.; Grouzmann, E.; Preller, K.H.; Vollenweider, F.X.; Brenneisen, R.; Müller, F.; Borgwardt, S.; Liechti, M.E. Acute Effects of Lysergic Acid Diethylamide in Healthy Subjects. Biol. Psychiatry 2015, 78, 544–553. [Google Scholar] [CrossRef]
- Dolder, P.C.; Liechti, M.E.; Rentsch, K.M. Development and Validation of a Rapid Turboflow LC-MS/MS Method for the Quantification of LSD and 2-Oxo-3-Hydroxy LSD in Serum and Urine Samples of Emergency Toxicological Cases. Anal. Bioanal. Chem. 2014, 407, 1577–1584. [Google Scholar] [CrossRef]
- Dolder, P.C.; Schmid, Y.; Haschke, M.; Rentsch, K.M.; Liechti, M.E. Pharmacokinetics and Concentration-Effect Relationship of Oral LSD in Humans. Int. J. Neuropsychopharmacol. 2015, 19, pyv072. [Google Scholar] [CrossRef]
- Hintzen, A.; Passie, T. Pharmacology of LSD: A Critical Review; Oxford University Press: Oxford, UK, 2010. [Google Scholar]
- Upshall, D.G.; Wailling, D.G. The Determination of LSD in Human Plasma Following Oral Administration. Clin. Chim. Acta 1972, 36, 67–73. [Google Scholar] [CrossRef]
- Libânio Osório Marta, R.F. Metabolism of Lysergic Acid Diethylamide (LSD): An Update. Drug Metab. Rev. 2019, 51, 378–387. [Google Scholar] [CrossRef]
- Boyd, E.S.; Rothlin, E.; Bonner, J.F.; Slater, I.H.; Hodge, H.C. Preliminary Studies of the Metabolism of Lysergic Acid Diethylamide Using Radioactive Carbon-Marked Molecules. J. Nerv. Ment. Dis. 1955, 122, 470–471. [Google Scholar] [CrossRef]
- Axelrod, J.; Brady, R.O.; Witkop, B.; Evarts, E.V. The Distribution and Metabolism of Lysergic Acid Diethylamide. Ann. N. Y. Acad. Sci. 1957, 66, 435–444. [Google Scholar] [CrossRef]
- Siddik, Z.H.; Barnes, R.D.; Dring, L.G.; Smith, R.L.; Williams, R.T. The Metabolism of Lysergic Acid DI[14C]Ethylamide ([14C]LSD) in the Isolated Perfused Rat Liver. Biochem. Pharmacol. 1979, 28, 3081–3091. [Google Scholar] [CrossRef]
- Aghajanian, G.K.; L Bing, O.H. Persistence of Lysergic Acid Diethylamide in the Plasma of Human Subjects. Clin. Pharmacol. Ther. 1964, 5, 611–614. [Google Scholar] [CrossRef]
- Schiff, P.L. Ergot and Its Alkaloids. Am. J. Pharm. Educ. 2006, 70, 98. [Google Scholar] [CrossRef] [PubMed]
- Reiff, C.M.; Richman, E.E.; Nemeroff, C.B.; Carpenter, L.L.; Widge, A.S.; Rodriguez, C.I.; Kalin, N.H.; McDonald, W.M. Psychedelics and Psychedelic-Assisted Psychotherapy. Am. J. Psychiatry 2020, 177, 391–410. [Google Scholar] [CrossRef] [PubMed]
- Mertens, L.J.; Preller, K.H. Classical Psychedelics as Therapeutics in Psychiatry—Current Clinical Evidence and Potential Therapeutic Mechanisms in Substance Use and Mood Disorders. Pharmacopsychiatry 2021, 54, 176–190. [Google Scholar] [CrossRef] [PubMed]
- De Gregorio, D.; Aguilar-Valles, A.; Preller, K.H.; Heifets, B.D.; Hibicke, M.; Mitchell, J.; Gobbi, G. Hallucinogens in Mental Health: Preclinical and Clinical Studies on LSD, Psilocybin, MDMA, and Ketamine. J. Neurosci. 2021, 41, 891–900. [Google Scholar] [CrossRef] [PubMed]
- De Gregorio, D.; Inserra, A.; Enns, J.P.; Markopoulos, A.; Pileggi, M.; El Rahimy, Y.; Lopez-Canul, M.; Comai, S.; Gobbi, G. Repeated Lysergic Acid Diethylamide (LSD) Reverses Stress-Induced Anxiety-like Behavior, Cortical Synaptogenesis Deficits and Serotonergic Neurotransmission Decline. Neuropsychopharmacology 2022, 47, 1188–1198. [Google Scholar] [CrossRef]
- Markopoulos, A.; Inserra, A.; De Gregorio, D.; Gobbi, G. Evaluating the Potential Use of Serotonergic Psychedelics in Autism Spectrum Disorder. Front. Pharmacol. 2022, 12, 749068. [Google Scholar] [CrossRef]
- Doyon, W.M.; Dong, Y.; Ostroumov, A.; Thomas, A.M.; Zhang, T.A.; Dani, J.A. Nicotine Decreases Ethanol-Induced Dopamine Signaling and Increases Self-Administration via Stress Hormones. Neuron 2013, 79, 530–540. [Google Scholar] [CrossRef]
- Dyck, E. ‘Hitting Highs at Rock Bottom’: LSD Treatment for Alcoholism, 1950–1970. Soc. Hist. Med. 2006, 19, 313–329. [Google Scholar] [CrossRef]
- Dolder, P.C.; Schmid, Y.; Steuer, A.E.; Kraemer, T.; Rentsch, K.M.; Hammann, F.; Liechti, M.E. Pharmacokinetics and Pharmacodynamics of Lysergic Acid Diethylamide in Healthy Subjects. Clin. Pharmacokinet. 2017, 56, 1219–1230. [Google Scholar] [CrossRef]
- Verstraete, A.G.; Van De Velde, E.J. 2-Oxo-3-Hydroxy-LSD: An Important LSD Metabolite? Acta Clin. Belg. 1999, 53 (Suppl. 1), 94–96. [Google Scholar]
- Loeffler, L.J.; Pierce, J. V Radioimmunoassay for Lysergide (LSD) in Illicit Drugs and Biological Fluids. J. Pharm. Sci. 1973, 62, 1817–1820. [Google Scholar] [CrossRef] [PubMed]
- Grobosch, T.; Lemm-Ahlers, U. Immunoassay Screening of Lysergic Acid Diethylamide (LSD) and Its Confirmation by HPLC and Fluorescence Detection Following LSD ImmunElute Extraction. J. Anal. Toxicol. 2002, 26, 181–186. [Google Scholar] [CrossRef] [PubMed]
- Frost, M.; Köhler, H.; Blaschke, G. Determination of LSD in Blood by Capillary Electrophoresis with Laser-Induced Fluorescence Detection. J. Chromatogr. B Biomed. Sci. Appl. 1997, 693, 313–319. [Google Scholar] [CrossRef]
- Steuer, A.E.; Poetzsch, M.; Stock, L.; Eisenbeiss, L.; Schmid, Y.; Liechti, M.E.; Kraemer, T. Development and Validation of an Ultra-Fast and Sensitive Microflow Liquid Chromatography-Tandem Mass Spectrometry (MFLC-MS/MS) Method for Quantification of LSD and Its Metabolites in Plasma and Application to a Controlled LSD Administration Study in Humans. Drug Test Anal. 2017, 9, 788–797. [Google Scholar] [CrossRef]
- Nelson, C.C.; Foltz, R.L. Determination of Lysergic Acid Diethylamide (LSD), Iso-LSD, and N-Demethyl-LSD in Body Fluids by Gas Chromatography/Tandem Mass Spectrometry. Anal. Chem. 1992, 64, 1578–1585. [Google Scholar] [CrossRef] [PubMed]
- Papac, D.I.; Foltz, R.L. Measurement of Lysergic Acid Diethylamide (LSD) in Human Plasma by Gas Chromatography/Negative Ion Chemical Ionization Mass Spectrometry. J. Anal. Toxicol. 1990, 14, 189–190. [Google Scholar] [CrossRef]
- Reuschel, S.A.; Percey, S.E.; Liu, S.; Eades, D.M.; Foltz, R.L. Quantitative Determination of LSD and a Major Metabolite, 2-Oxo-3-Hydroxy-LSD, in Human Urine by Solid-Phase Extraction and Gas Chromatography-Tandem Mass Spectrometry. J. Anal. Toxicol. 1999, 23, 306–312. [Google Scholar] [CrossRef]
- Favretto, D.; Frison, G.; Maietti, S.; Ferrara, S.D. LC-ESI-MS/MS on an Ion Trap for the Determination of LSD, Iso-LSD, nor-LSD and 2-Oxo-3-Hydroxy-LSD in Blood, Urine and Vitreous Humor. Int. J. Legal Med. 2007, 121, 259–265. [Google Scholar] [CrossRef]
- Grumann, C.; Henkel, K.; Stratford, A.; Hermanns-Clausen, M.; Passie, T.; Brandt, S.D.; Auwärter, V. Validation of an LC-MS/MS Method for the Quantitative Analysis of 1P-LSD and Its Tentative Metabolite LSD in Fortified Urine and Serum Samples Including Stability Tests for 1P-LSD under Different Storage Conditions. J. Pharm. Biomed. Anal. 2019, 174, 270–276. [Google Scholar] [CrossRef]
- Martin, R.; Schürenkamp, J.; Gasse, A.; Pfeiffer, H.; Köhler, H. Determination of Psilocin, Bufotenine, LSD and Its Metabolites in Serum, Plasma and Urine by SPE-LC-MS/MS. Int. J. Legal Med. 2013, 127, 593–601. [Google Scholar] [CrossRef]
- Johansen, S.S.; Jensen, J.L. Liquid Chromatography–Tandem Mass Spectrometry Determination of LSD, ISO-LSD, and the Main Metabolite 2-Oxo-3-Hydroxy-LSD in Forensic Samples and Application in a Forensic Case. J. Chromatogr. B 2005, 825, 21–28. [Google Scholar] [CrossRef] [PubMed]
- Canezin, J.; Cailleux, A.; Turcant, A.; Le Bouil, A.; Harry, P.; Allain, P. Determination of LSD and Its Metabolites in Human Biological Fluids by High-Performance Liquid Chromatography with Electrospray Tandem Mass Spectrometry. J. Chromatogr. B Biomed. Sci. Appl. 2001, 765, 15–27. [Google Scholar] [CrossRef] [PubMed]
- Jang, M.; Kim, J.; Han, I.; Yang, W. Simultaneous Determination of LSD and 2-Oxo-3-Hydroxy LSD in Hair and Urine by LC-MS/MS and Its Application to Forensic Cases. J. Pharm. Biomed. Anal. 2015, 115, 138–143. [Google Scholar] [CrossRef] [PubMed]
- Dolder, P.C.; Liechti, M.E.; Rentsch, K.M. Development and Validation of an LC-MS/Ms Method to Quantify Lysergic Acid Diethylamide (LSD), Iso-LSD, 2-Oxo-3-Hydroxy-LSD, and nor-LSD and Identify Novel Metabolites in Plasma Samples in a Controlled Clinical Trial. J. Clin. Lab. Anal. 2018, 32, e22265. [Google Scholar] [CrossRef]
- Caspar, A.T.; Kollas, A.B.; Maurer, H.H.; Meyer, M.R. Development of a Quantitative Approach in Blood Plasma for Low-Dosed Hallucinogens and Opioids Using LC-High Resolution Mass Spectrometry. Talanta 2018, 176, 635–645. [Google Scholar] [CrossRef]
- Vaiano, F.; Bertol, E.; Mineo, M.; Pietrosemoli, L.; Rubicondo, J.; Supuran, C.T.; Carta, F. Development of a New Lc-Ms/Ms Screening Method for Detection of 120 Nps and 43 Drugs in Blood. Separations 2021, 8, 221. [Google Scholar] [CrossRef]
- Rubicondo, J.; Scuffi, L.; Pietrosemoli, L.; Mineo, M.; Terranova, F.; Bartucca, M.; Trignano, C.; Bertol, E.; Vaiano, F. A New Multi-Analyte LC-MS-MS Screening Method for the Detection of 120 NPSs and 49 Drugs in Hair. J. Anal. Toxicol. 2023, 46, e262–e273. [Google Scholar] [CrossRef]
- ANSI/ASB STANDARD 036; Standard Board Standard Practices for Method Validation in Forensic Toxicology. Academy Standards Board: Colorado Springs, CO, USA, 2019.
- Libong, D.; Bouchonnet, S.; Ricordel, I. A Selective and Sensitive Method for Quantitation of Lysergic Acid Diethylamide (LSD) in Whole Blood by Gas Chromatography-Ion Trap Tandem Mass Spectrometry. J. Anal. Toxicol. 2003, 27, 24–29. [Google Scholar] [CrossRef]
- Bertol, E.; Di Milia, M.G.; Fioravanti, A.; Mari, F.; Palumbo, D.; Pascali, J.P.; Vaiano, F. Proactive Drugs in DFSA Cases: Toxicological Findings in an Eight-Years Study. Forensic Sci. Int. 2018, 291, 207–215. [Google Scholar] [CrossRef]
- Bertol, E.; Pascali, J.P.; Palumbo, D.; Catalani, V.; Di Milia, M.G.; Fioravanti, A.; Mari, F.; Vaiano, F. 3-MeO-PCP Intoxication in Two Young Men: First in Vivo Detection in Italy. Forensic Sci. Int. 2017, 274, 7–12. [Google Scholar] [CrossRef]

| Compound | [M + H]+ | MRM Transitions (m/z) | Fragmentor (V) | CE (V) | RT (min) #1 | RT (min) #2 |
|---|---|---|---|---|---|---|
| LSD | 324 | 223, 208 | 113 | 25, 33 | 15.270 | 1.897 |
| O-H-LSD | 356 | 237, 222 | 98 | 25, 35 | 8.810 | 1.379 |
| LSD-D3 | 327 | 226, 208 | 118 | 25, 33 | 15.270 | 1.894 |
| Compound | LOD (ng/mL) | LOQ (ng/mL) | R2 | Accuracy (%) | Precision (%) | ME (%) | RR (%) | ||||
|---|---|---|---|---|---|---|---|---|---|---|---|
| QC1 * | QC2 | QC3 | QC1 | QC2 | QC3 | ||||||
| LSD | 0.01 | 0.0375 | 0.9918 | 2.5 | −9.2 | −3.3 | 5.4 | 3.9 | 1.7 | 9.5 | 85.5 |
| O-H-LSD | 0.005 | 0.0187 | 0.9995 | 19.1 | 17.7 | −5.8 | 3.1 | 1.6 | 0.9 | 156.1 | 31.5 |
| Compound | LOD (ng/mL) | LOQ (ng/mL) | R2 | Accuracy (%) | Precision (%) | ME (%) | RR (%) | ||||
|---|---|---|---|---|---|---|---|---|---|---|---|
| QC1 * | QC2 | QC3 | QC1 | QC2 | QC3 | ||||||
| LSD | 0.005 | 0.025 | 0.9914 | −10.1 | −12.7 | −3.4 | 17.9 | 7.1 | 1.2 | 9.7 | 83.5 |
| O-H-LSD | 0.0025 | 0.0125 | 0.9997 | 8.7 | 5.5 | −15.5 | 17.7 | 5.5 | 0.8 | 18.5 | 93.1 |
| Sample Treatments | Sample Volume | Number of Compound | LOQ (LSD) ng/mL | LOD (LSD) ng/mL | |
|---|---|---|---|---|---|
| Method #1 | PP | 200 µL | 165 | 0.0375 | 0.01 |
| Caspar et al. [36] | LLE | 1 mL | 21 | 0.25 | 0.1 |
| Sample Treatments | Sample Volume | Chromatographic Run (min) | LOQ ng/mL | LOD ng/mL | |
|---|---|---|---|---|---|
| Method #2 | LLE | 200 µL | 6 + 1.5 post-time | 0.025 LSD 0.0125 O-H-LSD | 0.005 LSD 0.0025 O-H-LSD |
| Favretto et al. [29] | LLE | 2 mL | 12 | 0.02 LSD 0.4 O-H-LSD | 0.01 LSD 0.2 O-H-LSD |
| Canezin et al. [33] | LLE | 1 mL | 8 | 0.02 LSD 0.02 O-H-LSD | - - |
| Dolder et al. [35] | PP | 100 µL | 11 + 4 post-time | 0.05 LSD 0.1 O-H-LSD | 0.01 LSD 0.01 O-H-LSD |
| Libong et al. [40] | SPE | 2 mL | 20 | 0.02 LSD | 0.1 LSD |
Disclaimer/Publisher’s Note: The statements, opinions and data contained in all publications are solely those of the individual author(s) and contributor(s) and not of MDPI and/or the editor(s). MDPI and/or the editor(s) disclaim responsibility for any injury to people or property resulting from any ideas, methods, instructions or products referred to in the content. |
© 2023 by the authors. Licensee MDPI, Basel, Switzerland. This article is an open access article distributed under the terms and conditions of the Creative Commons Attribution (CC BY) license (https://creativecommons.org/licenses/by/4.0/).
Share and Cite
Dimitrova, A.; Di Milia, M.G.; Rensi, R.; Grassi, S.; Gualco, B.; Vaiano, F. Determination of Lysergic Acid Diethylamide and 2-Oxo-3-Hydroxy-LSD in Blood: Validation and Comparison of Two Liquid Chromatography–Tandem Mass Spectrometry Methods. Separations 2023, 10, 502. https://doi.org/10.3390/separations10090502
Dimitrova A, Di Milia MG, Rensi R, Grassi S, Gualco B, Vaiano F. Determination of Lysergic Acid Diethylamide and 2-Oxo-3-Hydroxy-LSD in Blood: Validation and Comparison of Two Liquid Chromatography–Tandem Mass Spectrometry Methods. Separations. 2023; 10(9):502. https://doi.org/10.3390/separations10090502
Chicago/Turabian StyleDimitrova, Alexandra, Maria Grazia Di Milia, Regina Rensi, Simone Grassi, Barbara Gualco, and Fabio Vaiano. 2023. "Determination of Lysergic Acid Diethylamide and 2-Oxo-3-Hydroxy-LSD in Blood: Validation and Comparison of Two Liquid Chromatography–Tandem Mass Spectrometry Methods" Separations 10, no. 9: 502. https://doi.org/10.3390/separations10090502