
Preparation and NH4+ Adsorption Performance of Ultrafine Lignite-Based Porous Materials


School of Mining Engineering, Taiyuan University of Technology, Taiyuan 030024, China
*
Authors to whom correspondence should be addressed.
Separations 2024, 11(2), 40; https://doi.org/10.3390/separations11020040
Submission received: 9 January 2024
/
Revised: 23 January 2024
/
Accepted: 24 January 2024
/
Published: 27 January 2024
(This article belongs to the Special Issue Separation and Extraction Technology in Mineral Processing)
Abstract
:This study aimed to increase the ammonium nitrogen adsorption capacity of lignite using ultrafine grinding, aiming to reduce eutrophication in water bodies. Ammonium sulfate (NH4)2SO4 was employed as a stand-in for ammonium nitrogen in water solutions. The lignite sample for adsorption was processed with varying milling times. Adsorption efficacy was assessed primarily through isothermal adsorption tests and other techniques. Additionally, the study delved into the adsorption mechanisms. The results demonstrate that lignite ground for 50 min follows monolayer adsorption, characterized by minimal pore size and reduced diffusion rates, thereby extending the time to reach equilibrium and maximizing adsorption. BET and SEM analyses show that coal powder is effectively ground by zirconia balls in a vertical stirring mill, diminishing its particle size and forming new micropores. Concurrently, larger native pores are transformed into mesopores and micropores, providing numerous sites for NH4+ adsorption. XPS and FTIR analyses indicate an increase in exposed carbonaceous surfaces and oxygen-containing functional groups in ultrafine lignite. Ammonium ions replace hydrogen in carboxyl groups to form COONH4, and hydrogen bonds may form between NH4+ and C-O groups. Additionally, the electrostatic attraction between NH4+ and the coal surface further enhances adsorption. It can be concluded that the physical grinding process increases the specific surface area and creates more active adsorption sites, which in turn, boosts NH4+ adsorption capacity. The maximum equilibrium adsorption capacity is as high as 550 mg/g. This study suggests that ultrafine lignite is a promising material for treating ammonia-nitrogen wastewater.
1. Introduction
Ammonia nitrogen is widely found in water bodies, mainly originating from discharges of domestic sewage, industrial effluents, and agricultural and livestock waste emissions [1]. The introduction of ammonia nitrogen into stagnant or slow-flowing water bodies can trigger rapid algae growth and proliferation of harmful microorganisms, leading to eutrophication [2,3]. Traditional treatments for ammonia nitrogen in wastewater include biological methods, breakpoint chlorination, photocatalysis, electrochemical methods, membrane separation, and adsorption [4,5,6,7,8,9]. Adsorption has become a preferred method for treating wastewater with low concentrations of ammonia nitrogen because it is cost-effective, stable, and widely available and does not produce secondary pollution [10]. Developing efficient, economical, and stable adsorbent materials is crucial for the effective adsorption treatment of ammonia nitrogen in wastewater.
Activated carbon is commonly used in treating ammonia-nitrogen wastewater because of its extensive pore structure and large surface area [11]. However, its high production and regeneration costs restrict its widespread use [12]. As a result, numerous low-cost adsorbents have been introduced recently. For example, natural zeolites, known for their expansive surface area and superior ion exchange properties [13,14], demonstrate effective selective adsorption for ammonia nitrogen. Biochar, an efficient carbon-based adsorbent, removes ammonia nitrogen from wastewater mainly through electrostatic adsorption, cation exchange, and chemical adsorption processes [15]. Kaolinite, an adsorbent made up of metal oxides including alumina and silica [16], is a readily available mineral with significant adsorption capacity and ion exchange strength [17]. However, these materials need intricate pretreatment, come with high recovery expenses, and have a limited capacity for ammonia-nitrogen adsorption. Therefore, it is essential to develop an adsorbent that is cost-effective and has a high removal efficiency for ammonia nitrogen.
Lignite, owing to its well-developed porous structure, possesses a relatively high specific surface area and exhibits a non-uniform pore size distribution [18,19]. It is characterized by a significant content of humic and fulvic acids, along with an abundance of oxygen-containing functional groups that serve as binding sites [20,21]. These superior properties endow lignite with excellent adsorptive capacity, establishing it as a natural adsorbent material. Additionally, lignite is globally abundant [22] and cost-effective. The utilization of lignite as a low-grade resource has been explored in various application studies, including the adsorption of nitrogen oxides, carbon dioxide [23,24], copper [25], and quinoline [26], as well as nitrogen accommodation in agricultural environments [27,28,29,30,31]. Lignite, compared to other types of coal, exhibits a softer coal quality. Furthermore, ultrafine pulverization modification of lignite, as opposed to activation methods such as high-temperature treatment or chemical modification, not only has the potential to save costs but can also reduce wear and tear on machinery. However, at present, there are few scholars who have conducted research on the modification of ultrafine lignite powder, and there is a lack of studies on the use of ultrafine lignite powder for the treatment of ammonia nitrogen wastewater.
Therefore, in this study, lignite from Inner Mongolia was selected as the raw material and pulverized into ultrafine coal powder of varying particle sizes using a vertical stirring mill. The nitrogen adsorption kinetics and thermodynamics of this material were investigated through laboratory-simulated studies. Additionally, the effect of different solution pH conditions on the nitrogen adsorption capacity of lignite particles with different sizes was examined. The adsorption mechanism for NH4+ was explored using equation fitting, Fourier-transform infrared spectroscopy (FTIR), X-ray photoelectron spectroscopy (XPS), Brunauer–Emmett–Teller (BET) analysis, and scanning electron microscopy (SEM). The objective was to investigate the efficiency of the removal of ammoniacal nitrogen from water using ultrafine lignite coal powder.
2. Materials and Methods
2.1. Materials
The lignite utilized in the experiments was sourced from Hohhot, Inner Mongolia. The results of its industrial and elemental analyses are presented in Table 1. The lignite was ground into particles smaller than 0.5 mm and dried at 20–25 °C with a relative humidity of 40–50% for 48 h to remove free moisture. The dried lignite was then sieved through an 80-mesh screen; a portion of the undersized product was set aside as the un-milled test sample, while the remaining material was subjected to wet grinding in a vertical stirring mill.
2.2. Grinding and Adsorption Experiments
The material was subjected to wet grinding in a vertical stirring mill for durations of 30 and 50 min. Zirconia balls were used as the grinding media with a 1:1:1 mass ratio of large, medium, and small balls, and the rotation speed was uniformly maintained at 500 rpm to produce two ultrafine samples of different particle sizes. Both milled samples were vacuum-dried at 75 ± 5 °C and stored in airtight conditions.
In this experiment, ammonium sulfate (NH4)2SO4 was utilized as the ammoniacal nitrogen reserve solution. The adsorption of (NH4)2SO4 on lignite was investigated in terms of concentration, time, and pH, with each set of conditions being replicated three times. For varying initial concentrations, 0.3 g of adsorbent was added to centrifuge tubes containing 15 mL of (NH4)2SO4 solution with concentrations ranging from 0.1 to 8.02 mol/L (pH = 7). The tubes were then placed in a constant-temperature shaker set to an amplitude of 180 rpm, a temperature of 25 °C, and an adsorption time of 240 min. The mixtures were centrifuged at 3500 rpm for 30 min to facilitate separation, after which the supernatant was analyzed. The concentration of NH4+ in the supernatant solution after adsorption was measured in accordance with the Chinese National Standard HJ535-2009 [32]. NH4+ was first treated with Nessler’s reagent for color development, followed by measurement using a UV-Vis spectrophotometer (UV-5500, Shanghai, China) at a wavelength of 420 nm [33]. The adsorption capacity for NH4+ of the three different lignite samples was studied with an initial solution concentration of 4.22 mol/L and an adsorption period ranging from 0 to 480 min. The pH of the simulated ammoniacal wastewater was adjusted using 0.1 mol/L HCl or NaOH to study the effect of different pH levels (3 to 8) on the adsorption capacity for NH4+.
2.3. Adsorption Modeling
2.3.1. Isotherm
The adsorption isotherms of NH4+ were analyzed using the Langmuir and Freundlich isothermal adsorption models. The calculations were carried out employing Equations (1) and (2) [34]:
Langmuir isothermal adsorption model,
Freundlich isothermal adsorption model,
The parameter Kl is a constant in the Langmuir model, while Kf is a constant associated with the Freundlich model. The term qm denotes the maximum monolayer adsorption capacity, mg/g; Ce represents the concentration of the adsorbate in solution at equilibrium, mg/L; n is a Freundlich isotherm constant; and the value of 1/n is utilized to assess the difficulty of the adsorption process. Typically, a 1/n value greater than 2 indicates that adsorption is relatively difficult, whereas an n value equal to 1 suggests a linear adsorption behavior. A 1/n value between 0.1 and 1 signifies that adsorption occurs readily.
2.3.2. Kinetics
The pseudo-first-order and pseudo-second-order kinetic models are commonly employed to analyze the adsorption kinetic parameters. Calculations were conducted using Equations (3) and (4) [35]:
Pseudo-first-order dynamic model,
Pseudo-second-order dynamic model,
The parameter t represents the adsorption time, min; qt denotes the amount of adsorbate adsorbed at time t, mg/g; qe is the equilibrium adsorption capacity, mg/g; and k1 and k2 represent the rate constants for adsorption, g/(mg·min).
2.4. Material Characterization
2.4.1. Particle Size Analysis
The particle size distribution curves of three coal samples were determined using a Malvern Mastersizer 3000 laser particle size analyzer (Malvern Instruments Ltd., Malvern, UK).
2.4.2. BET Analysis
The specific surface area, total pore volume, and the volumes of micropores and mesopores of the different samples were characterized using a Micromeritics ASAP 2460 automatic surface area and porosimetry analyzer (Micromeritics Instrument Corporation, Norcross, GA, USA), employing nitrogen (N2) adsorption at 77.15 K and carbon dioxide (CO2) adsorption at 273.15 K.
2.4.3. SEM Analysis
Scanning electron microscopy (SEM) images of the samples were captured with a TESCAN AMBER X microscope (Tescan Co., Ltd., Shanghai, China). All samples were dried, dispersed onto conductive adhesive, and then mounted on the sample stage. Observations and imaging were conducted under a working voltage of 5 kV and a working distance of 6 mm.
2.4.4. Zeta Analysis
Zeta potential measurements of the samples at different pH levels were performed using a Malvern Zetasizer Nano ZS90 (Malvern Instruments Ltd., Malvern, UK).
2.4.5. FTIR Analysis
Fourier-transform infrared (FTIR) spectroscopy, utilizing a NICOLET IS50 spectrometer (Thermo Fisher Scientific Inc., Dreieich, Germany), was employed to analyze lignite coal samples pre- and post-grinding, as well as to elucidate the adsorption mechanism of NH4+. The processed samples were blended with spectrally pure KBr at a ratio of 1:100 and subsequently compacted into pellets. Infrared spectra of these pellets were then obtained in transmission mode. The spectral range for the FTIR scans extended from 4000 to 400 cm−1, with a resolution of 2 cm−1. This methodology facilitated a comprehensive examination of the molecular interactions and structural modifications occurring within the lignite matrix due to grinding and NH4+ adsorption.
2.4.6. XPS Analysis
X-ray photoelectron spectroscopy (XPS) experiments were conducted with a Thermo Scientific K-Alpha spectrometer (Thermo Fisher Scientific Inc, Dreieich, Germany). The experimental protocol included both survey and high-resolution scans, specifically targeting C 1s and N 1s peaks. An adequate quantity of the sample was pelletized and adhered to the sample holder before being placed into the sample chamber of the XPS instrument. Measurements were initiated once the chamber pressure was reduced to below 2.0 × 10⁻⁷ mbar. The sample was then transferred to the analysis chamber. Survey scans were performed with a pass energy of 150 eV and a step size of 1 eV; high-resolution scans were executed at a pass energy of 50 eV with a step size of 0.1 eV, and these narrow scans were repeated for a minimum of five cycles to accumulate signals. Charge compensation for binding energy calibration was achieved using carbon contamination present on the sample surface.
3. Results and Discussion
3.1. Material Analysis
3.1.1. Particle Size Analysis
To investigate NH4+ adsorption by ultrafine modified lignite, this study utilized a vertical stirring ball mill to prepare ultrafine lignite, as detailed in Section 2.1. The particle size distribution for both primary coarse lignite and milled ultrafine lignite was analyzed using a laser particle size analyzer, and the results are presented in Figure 1.
As can be seen in Figure 1, the native lignite had an average particle diameter of 117.731 μm. After 30 min of milling, this diameter was reduced to 9.570 μm, and after 50 min, it was further reduced to 4.844 μm. Milling for 30 and 50 min produced ultrafine lignite, with the latter duration resulting in the smallest average particle diameter. Future research will explore the adsorption capabilities and mechanisms of NH4+ in the three different lignite samples.
3.1.2. BET Analysis
The nitrogen adsorption/desorption isotherms for lignite milled for varying times are displayed in Figure 2. According to the Brunauer–Deming–Deming–Teller classification [36], all samples showed Type II adsorption isotherms with clear hysteresis loops. Hysteresis loops emerging above a relative pressure (P/P0) of 0.5 generally signal capillary condensation in pores. The H3-type hysteresis loops in all samples indicated a complex pore structure in the lignite, including slit-like pores, platelet-like fissures, and wedge-shaped voids [37]. The vague hysteresis loops in pre- and post-milled lignite suggested that many pores were semi-open with limited connectivity [38]. Additionally, it was observed from the results shown in Figure 2 that finer lignite particles corresponded to higher nitrogen adsorption capacity.
Assessing microporosity is crucial for evaluating adsorption capacity. In this study, CO2 adsorption was used to determine the effect of milling time on lignite’s micropore volume distribution and specific surface area. As shown in Figure 3 and Figure 4, the CO2 adsorption curves for all samples showed similar patterns with three peaks, indicating micropore sizes between 0.35 and 1.1 nm. The data suggest that smaller lignite particles adsorb more CO2, accompanied by a shift in micropore sizes. For example, micropore peaks after 50 min of milling are at 0.472, 0.59, and 0.804 nm; after 30 min, at 0.507, 0.577, and 0.821 nm; and for primary lignite, at 0.542, 0.699, and 0.804 nm. Longer milling times have been associated with a gradual decrease in micropore size.
The specific surface area and pore characteristics of three lignite samples were calculated based on nitrogen adsorption, as indicated in Table 2. With the increase in milling time, the BET specific surface area of lignite showed an increasing trend. Specifically, the BET specific surface area of the primary lignite was 2.6624 m2/g, and it increased to 6.1744 m2/g after 30 min of milling and reached the maximum of 8.1589 m2/g after 50 min. During the initial milling phase (0–30 min), the BET specific surface area increased by 3.512 m2/g. In contrast, the latter phase (30–50 min) saw a more modest increase of 1.9845 m2/g. This indicates that a significant development of new pores occurred in the early stages of milling, accompanied by a rapid destruction of the original large pores, leading to a substantial increase in specific surface area. However, the increase in the specific surface area slowed down in the later stages of milling, with fewer pore structure changes, which was consistent with the particle size reduction observed. The total pore volume and mesopore volume displayed similar trends. Table 2 lists the specific surface areas and micropore volumes derived from CO2 adsorption data. The pore volumes increased with milling time: Lignite-50 min showed a pore volume of 0.0216 cm3/g, Lignite-30 min showed 0.0186 cm3/g, and Lignite-0 min showed 0.0104 cm3/g. This implied that finer particles contained more and smaller micropores. This was primarily due to the continuous collisions between ceramic balls and coal powder in the vertical stirring mill, which not only reduced the size of the coal powder but also led to the development of new micropores. Moreover, the original large pores in the coal powder underwent severe collapse and were progressively transformed into mesopores and micropores. Furthermore, as particle size gradually decreased, the particles of coal powder exhibited a trend towards more dense agglomeration due to increased cohesive forces. This agglomeration destroyed the original large pores and formed aggregates with new pores (mesopores and micropores) in between, leading to a gradual reduction in the content of large pores and a progressive increase in the content of mesopores and micropores [37]. This further contributed to a rapid increase in the specific surface area of the coal powder after milling. The aforementioned results indicated that upon milling, the particle size of lignite decreased, micropores further developed, and the specific surface area enlarged accordingly. This provided a greater number of adsorption sites for NH4+, suggesting substantial potential for the adsorption of NH4+ within the lignite structure.
3.1.3. SEM Analysis
SEM was employed to analyze the microstructure of lignite samples with different milling times, including their pre- and post-adsorption states. As shown in Figure 5, there was a clear trend of reduced particle size distribution corresponding to increased milling duration. Milling caused friction-induced surface pore collapse and the formation of narrow slit-like, flaky, and wedge-shaped pores, thereby enlarging the specific surface area of lignite. The SEM images revealed that primary lignite possessed a relatively smooth surface with large slit-like pores. As milling time increased, the lignite surface became more pitted and porous, with an increase in mesopores and micropores. A comparison of Figure 5b,c reveals that lignite milled for 30 min showed more slit-like pores and mesopores, whereas lignite milled for 50 min displayed numerous micropores. This aligned with the pore size distribution findings, indicating that milled lignite offered increased NH4+ adsorption sites, especially after 50 min of milling.
3.2. Adsorption Experiment
3.2.1. Isothermal Adsorption Experiments
The adsorption characteristics of lignite samples milled for varying durations were analyzed in the presence of different initial concentrations of NH4+. It was observed that as the concentration of NH4+ increased, the unit amount of NH4+ adsorption by lignite after reaching equilibrium also increased. Notably, when the initial concentration of the NH4+ solution was less than 0.54 mol/L, there was a pronounced upward trend in the adsorption capacity of lignite with an increase in concentration. However, as the initial concentration of the NH4+ solution exceeded 0.54 mol/L, the ascent in lignite’s adsorption capacity curve began to slow down. This suggested that there was a concentration threshold at which the adsorption sites of lignite became increasingly saturated, leading to a diminishing rate of adsorption with a further increase in NH4+ concentration. Upon reaching an initial concentration greater than 4 mol/L, the adsorption curves for both primary lignite and lignite milled for 30 min eventually plateaued, indicating that the adsorption capacity approached saturation. For lignite milled for 50 min, the adsorption capacity neared its maximum value only after the NH4+ initial concentration surpassed 6.6 mol/L. Ultimately, the adsorption capacity of primary lignite was approximately 151.5 mg/g, while lignite milled for 30 min exhibited an adsorption capacity of 219 mg/g. The lignite sample milled for 50 min demonstrated a significantly higher adsorption capacity of 550 mg/g, indicating that it had the greatest NH4+ adsorption capacity. Moreover, it reached adsorption equilibrium at an initial concentration of 6.6 mol/L. This result suggested that increased milling time enhanced the ability of lignite to adsorb NH4+, which is likely due to an increase in surface area and active sites available for ion exchange.
Both Langmuir and Freundlich adsorption isotherm models were applied to fit the experimental data to investigate the adsorption behavior of NH4+ on three different lignite materials. As can be seen in Table 3 and Figure 6, following the regression analysis, the Langmuir isotherm provided the best fit, with correlation coefficients R2 reaching 0.958, 0.992, and 0.975, respectively. In comparison, the correlation coefficients for the Freundlich model were only 0.904, 0.942, and 0.954. Therefore, NH4+ adsorption on the tested lignite materials was more accurately represented by the Langmuir isotherm, implying that the adsorption occurred on a surface with uniformly distributed adsorption sites and that each adsorbate molecule had equal access to all sites. This indicated that both the raw and milled lignite followed a monolayer adsorption process for NH4+, with no interaction between the adsorbed species on the lignite surface and one adsorbate occupying a single adsorption site [39]. According to the Langmuir fitting results, the theoretical maximum adsorption capacity of primary lignite for NH4+ was 203.795 mg/g, while that of lignite milled for 30 min reached 250.072 mg/g. The lignite milled for 50 min exhibited the highest theoretical adsorption capacity of up to 860.503 mg/g, which was 4.22 times and 3.44 times the capacity of raw lignite and lignite milled for 30 min, respectively. The Freundlich model fitting parameter value of 1/n is an indicator of the heterogeneity of the adsorbent surface. Fitting parameters in the range of 0 < 1/n < 1 suggested that adsorption of NH4+ on both raw and milled lignite was likely to occur readily.
3.2.2. Adsorption Kinetics Experiments
The influence of varying adsorption durations on the adsorption of NH4+ was analyzed. As depicted in Figure 7, both the primary lignite and lignite milled for 30 min reached adsorption equilibrium within 180 min, with the adsorption capacity surpassing 95% of the level at 240 min. The lignite milled for 50 min neared equilibrium at about 240 min, achieving over 95% of its adsorption capacity by 360 min. Moreover, upon reaching equilibrium, the lignite milled for 50 min exhibited the greatest adsorption capacity, while the primary lignite had the least. The variation in adsorption rates can be ascribed to the differences in the physicochemical properties of lignite due to the milling duration. The adsorption of NH4+ by all lignite samples exhibited a rapid increase in the initial rate, followed by a deceleration as adsorption approached saturation.
The fitting parameters and curves for the pseudo-first-order and pseudo-second-order models are presented in Table 4 and Figure 7, respectively. For a good fitting, performance is commonly characterized by R2 or Adj. R2 larger than 0.80 [40,41,42]. The fitting parameter R-squared values were all greater than 0.9, indicating that both the pseudo-first-order and pseudo-second-order kinetic equations can adequately describe the NH4+ adsorption process for lignite of different particle sizes. However, overall, the pseudo-second-order model exhibits a greater degree of fit than the pseudo-first-order model. R2(0.985~0.993) > R2(0.975~0.991). Furthermore, the equilibrium adsorption capacities derived from the pseudo-second-order kinetic model were closer to the experimentally measured values, suggesting that this model had a higher degree of correlation. Based on the parameters of the pseudo-second-order kinetic model, specifically the rate constant k2, lignite milled for 30 min exhibited the fastest adsorption rate for NH4+. Conversely, lignite milled for 50 min showed a slower adsorption rate, yet it achieved the greatest adsorption capacity. According to BET analysis, lignite milled for 30 min possessed a smaller specific surface area and fewer pore structures compared to that milled for 50 min, which also possessed a lesser volume of micropores. Consequently, while the adsorption rate was faster for the lignite milled for 30 min, its total adsorption capacity was less than that of the lignite milled for 50 min. The increase in milling time to 50 min resulted in a larger specific surface area, a significant increase in pore structures, and a substantial increase in micropore volume. For porous adsorbents, smaller pore sizes are correlated with slower diffusion rates into the pores, which extends the time to reach adsorption equilibrium. Thus, the lignite milled for 50 min not only had a larger adsorption capacity than the other samples but also exhibited a slower adsorption rate, leading to a longer time to achieve adsorption equilibrium.
3.2.3. Influence of pH on Adsorption and Zeta Potential
The solution pH is a critical factor influencing the speciation of NH4+ and the surface potential of lignite; hence, an analysis was conducted on the adsorption of NH4+ on the surface of lignite at different pH values, with initial pH values of 5.04, 4.72, and 4.63. According to Figure 8, the adsorption capacity of three types of lignite for NH4+ showed an increasing trend when the pH value ranged from 3.0 to 7.0, with a decrease observed at pH 8. This behavior can be explained by the reduced electronegativity of the lignite surface in acidic conditions, which led to a decreased number of active sites available for NH4+ adsorption. Concurrently, H+ ions competed with NH4+ for adsorption sites on the lignite surface, thereby inhibiting NH4+ adsorption. As the pH increased, the negative charge on the lignite surface increased due to the enhanced ionization of -OH and -COOH groups. With a concurrent reduction in the H+ concentration of the solution, the competition for adsorption sites weakened, thus favoring the adsorption of NH4+ onto lignite. In an alkaline environment, the interaction between NH4+ and OH− in the solution resulted in the formation of NH3·H2O [43], which may interfere with the actual adsorption of NH4+ onto lignite, leading to an apparent increase in adsorption. Additionally, under alkaline conditions, the organic matter within lignite may decompose, resulting in a decreased adsorption capacity. As illustrated in Figure 8, at a pH of 3, the adsorption capacity of lignite for NH4+ was at its lowest, with values of 33.5 mg/g, 50.5 mg/g, and 67.5 mg/g, respectively. With an increase in pH, the adsorption capacity for NH4+ rapidly increased, reaching a maximum at pH 7.0 with values of 151.5 mg/g, 219.0 mg/g, and 488.0 mg/g, respectively. A comprehensive analysis revealed a strong correlation between the adsorption capacity for NH4+ and the zeta potential of lignite.
Figure 9 presents the zeta potential profiles of lignite at varying pH levels. As the pH increased, the zeta potential of lignite samples subjected to three different milling durations initially decreased and then stabilized. The potential reached its minimum value at pH = 8, indicative of the strongest negative charge. This trend can be attributed to the suppression of ionization of -OH and -COOH groups on the lignite surface under acidic conditions, while the abundance of H+ ions in the solution neutralized the surface negative charges, resulting in reduced surface electronegativity [43]. Moreover, NH4+ being a cation created an unfavorable environment for its adsorption onto the lignite surface. As the pH rose, increased ionization of -OH and -COOH groups led to increased negative charge on the lignite surface, coupled with a decreased concentration of H+ ions in the solution, which in turn lowered the potential. Additionally, with the prolongation of milling time, the particle size of lignite became finer, exposing more surface area and increasing the number of negatively charged oxygen-containing functional groups. The lignite milled for 50 min exhibited the highest electronegativity, consistent with the results displayed in Figure 9.
3.3. Adsorption Mechanism
3.3.1. FTIR Analysis
Infrared spectroscopy analysis was performed on lignite samples subjected to varying milling durations as well as samples after ammonium ion adsorption. The results are depicted in Figure 10. The region between 3000 and 3500 cm−1 is characteristic of the stretching vibrations of -OH bonds. The area ranging from 1500 to 1750 cm−1 corresponds to the stretching vibrations of symmetric C-H bonds, while the band from 1500 to 1400 cm−1 is indicative of carboxyl group stretching vibrations. The spectral range from 1200 to 1000 cm−1 is associated with the stretching vibrations of carbonyl C-O groups. As shown in Figure 10a, the peaks for -OH functional groups in lignite were reduced after milling, whereas the peaks corresponding to carbon-containing functional groups such as C-H, -COOH, and C-O became sharper post-milling, with the effect being particularly pronounced at a milling duration of 50 min. The observed changes in the FTIR spectra can be attributed to the oxygen-containing functional groups present in lignite. Upon milling, the particle size of lignite decreased, leading to an increase in specific surface area and the exposure of more fresh carbonaceous surfaces. This resulted in an enhancement of the C-H-related absorption features, while the relative content of the -OH groups diminished. It is well established that prolonged milling durations are correlated with an increase in fresh surface areas and, consequently, a higher degree of oxidation. Therefore, comparing the spectrum after 50 min of milling to that at 30 min, there was a notable increase in the carbonyl functional groups.
The infrared spectra of lignite milled for different durations after ammonium adsorption, depicted in Figure 10b, exhibited peaks in the 3200−3500 cm−1 region, characteristic of the asymmetric stretching vibrations of NH bonds present in the adsorbed NH4+ on the lignite surface [43]. The absorption features associated with NH groups on the surface were significantly enhanced, while those related to C-H groups were correspondingly diminished. Additionally, there was a discernible increase in the -COO group peaks compared to Figure 10a. The likely explanation for these spectral changes is the electrostatic attraction between NH4+ possessing a positive charge and the coal surface carrying a negative charge, which facilitated the adsorption of NH4+ onto the coal surface. This adsorption masked the original C-H surface, leading to an intensified peak associated with NH groups and a relative weakening of the C-H absorption features. The -COOH functional groups on the surface of coal were prone to substitution by NH4+, resulting in the formation of COONH4, which was subsequently retained within the solid matrix. The strong polarity of NH4+ enhanced the absorption peak of the -COO group due to its strong polar interactions. In contrast, the functional groups associated with C-O did not exhibit significant changes in the spectra compared to Figure 10a, which solely represents the effect of milling duration. This suggested that although there was an apparent enhancement of the functional groups after 30 and 50 min of milling, as shown in Figure 10b, relative to the unadsorbed original sample, these changes were primarily due to alterations in functional groups caused by the milling process itself, rather than a direct association with NH4+ adsorption.
Overall, this study demonstrated that physical milling enhanced the adsorption capacity for NH4+ by increasing the specific surface area and the availability of active adsorption sites. This effect was more pronounced than that achieved through chemical modification with agents intended to augment adsorption capacities [44].
3.3.2. XPS Analysis
XPS analyses of lignite samples before and after milling, as well as before and after adsorption, were conducted to elucidate the adsorption mechanism. The variations in carbon (C), oxygen (O), and nitrogen (N) contents across the samples are presented in Figure 11. In comparison to the primary lignite, the proportion of carbon in the milled samples increased, while the proportion of oxygen demonstrated a decreasing trend; the content of nitrogen remained relatively unchanged. Moreover, the finer the particle size, the more pronounced were these changes. This can be primarily attributed to the reduction in particle size following milling, which led to an increase in specific surface area and consequently exposed more fresh carbonaceous surfaces on the lignite, resulting in an enhanced overall carbon ratio and decreased relative content of oxygen. Lignite inherently contains a low concentration of nitrogen, and the milling process is unlikely to expose new nitrogen-containing functional groups. Hence, minimal change was observed. After the adsorption of NH4+, the relative content of nitrogen in the lignite samples increased, with the most significant increase noted in the sample milled for 50 min. This increment was attributed to the primary adsorption mechanism of NH4+, namely electrostatic attraction to the lignite surface, leading to the coverage of the original carbonaceous surface. The increase in nitrogen content resulted in a corresponding decrease in the percentage of carbon. Oxygen-containing functional groups, such as carboxyl groups, are prone to complexation reactions with NH4+ and are inherently exposed on the coal surface. Moreover, with prolonged milling time, oxidation is enhanced. Consequently, after the adsorption of NH4+, the relative content of oxygen was increased compared to that before adsorption.
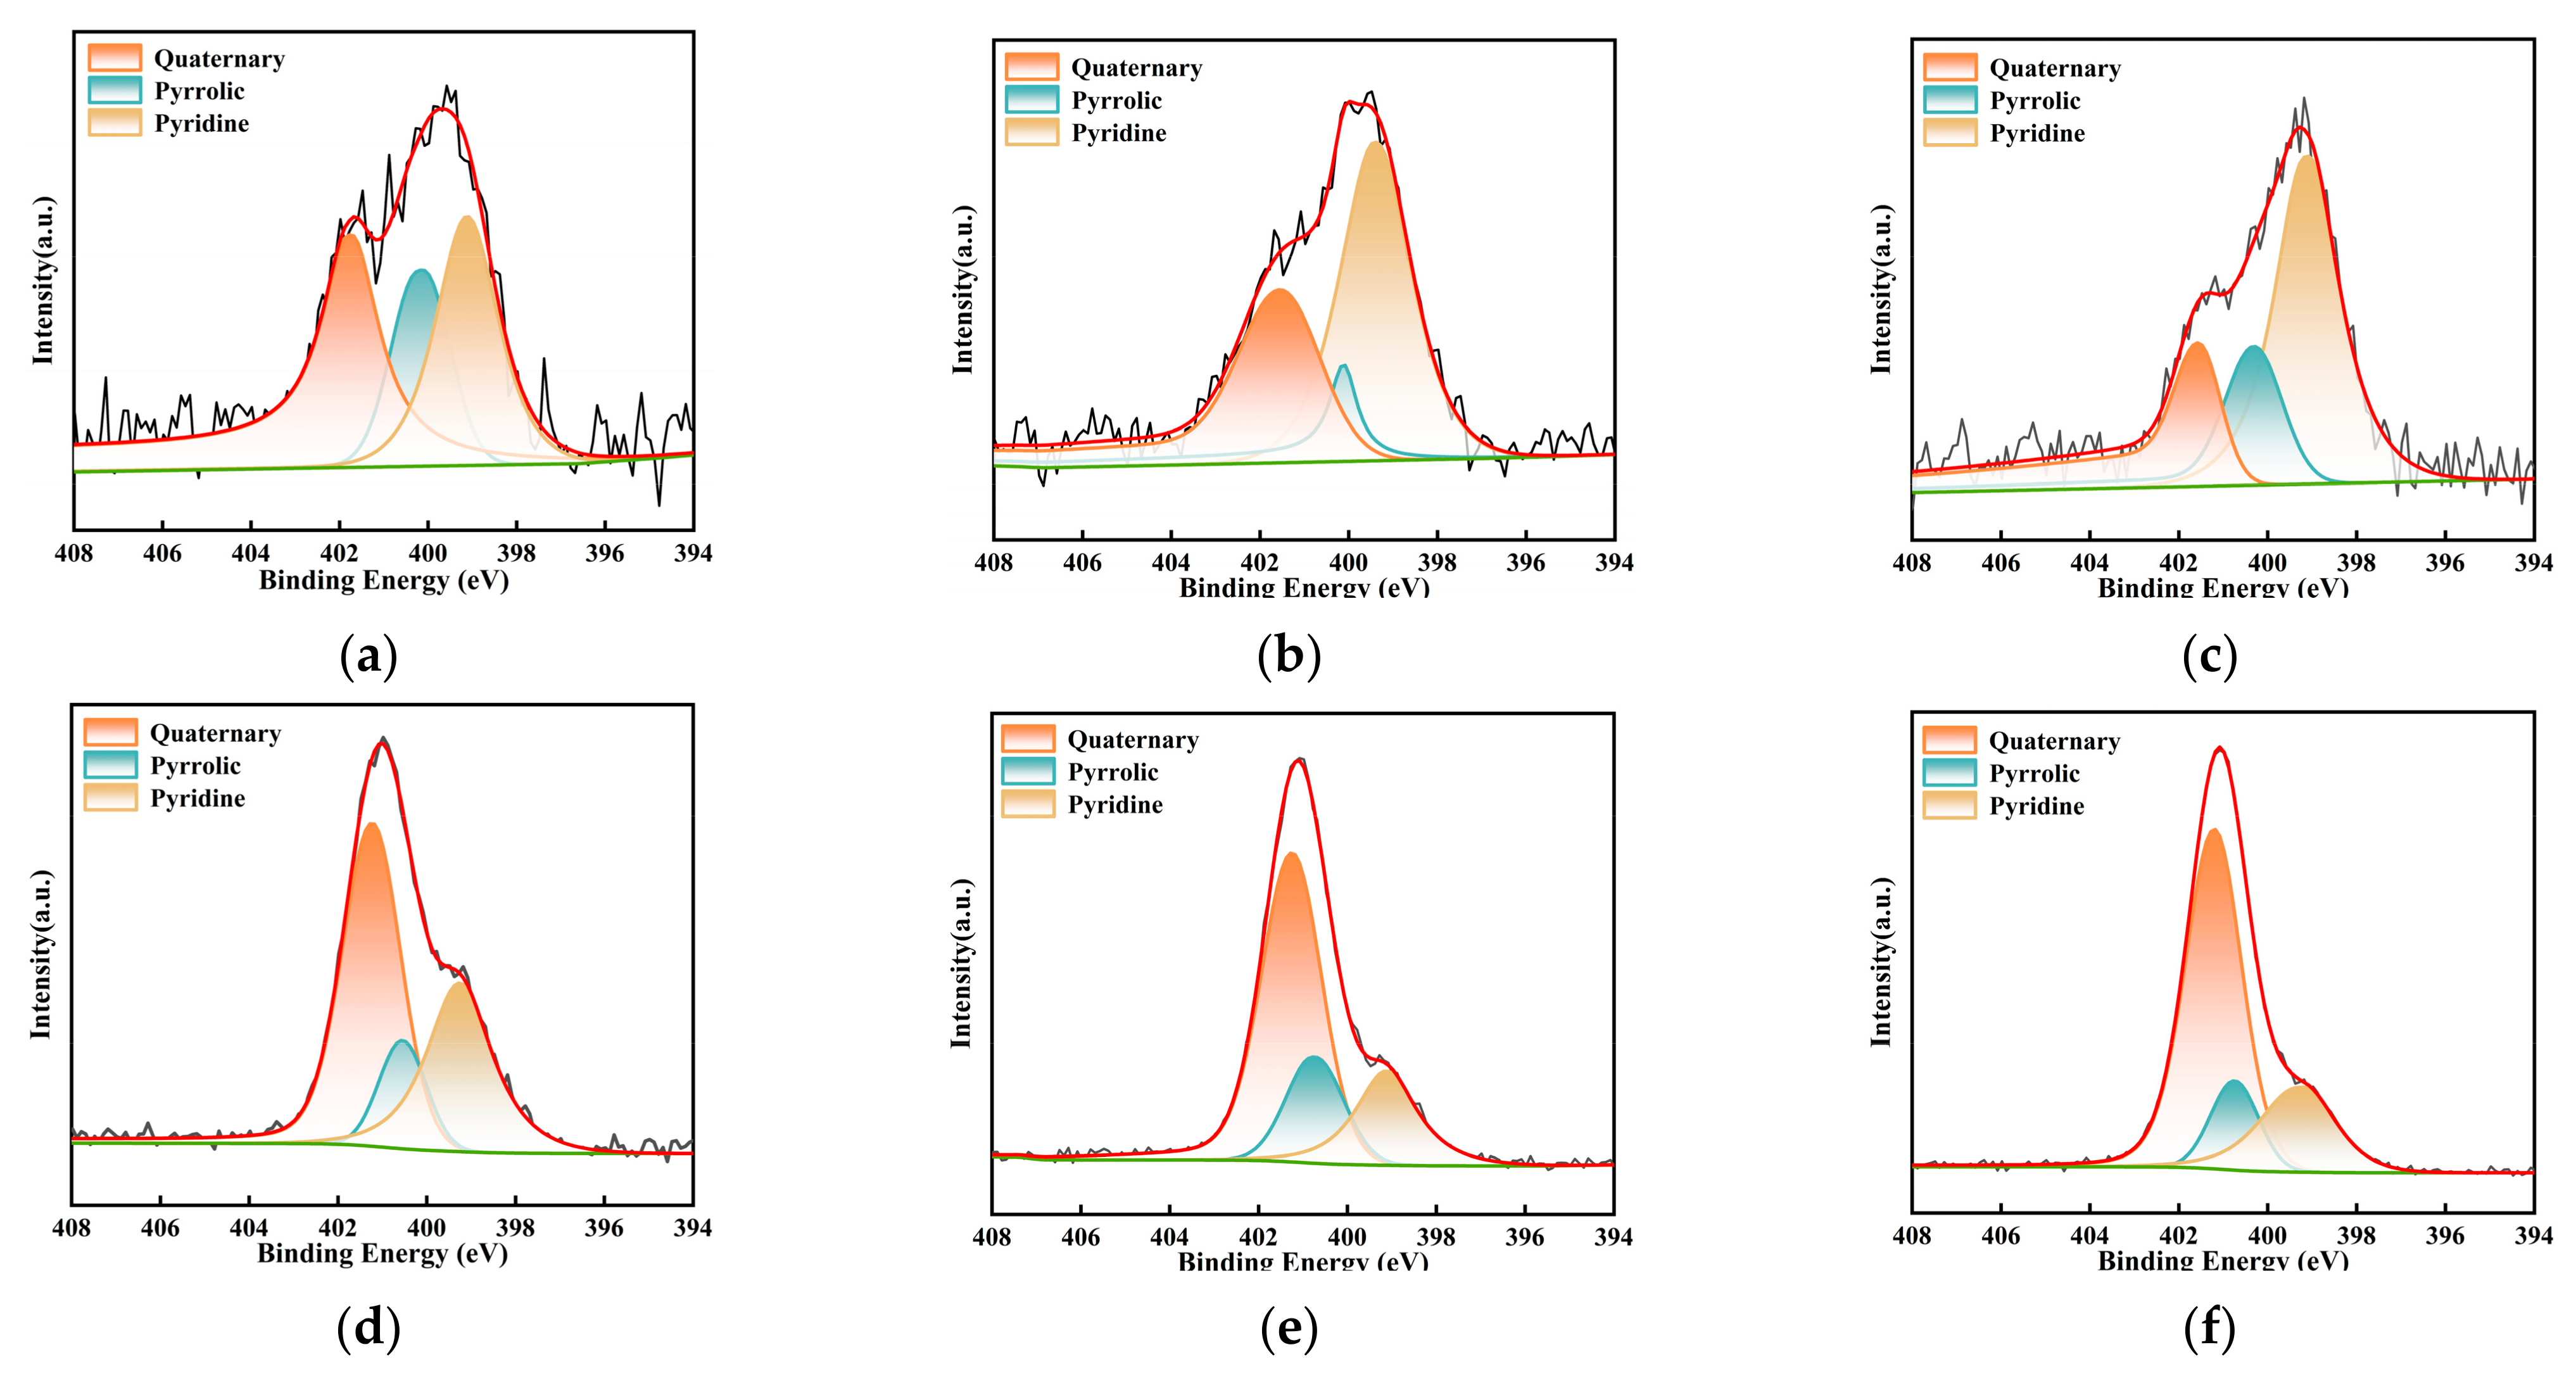
To further clarify the specific adsorption mechanism of NH4+ before and after milling, peak fitting was performed on the C 1s and N 1s spectra of the overall survey, and a correction for carbon contamination was applied. The analytical results are depicted in Figure 12 and Figure 13 and Table 5 and Table 6. Based on these results, the C 1s spectrum was categorized into four distinct peaks: C-C/C-H (284.8 eV), C-O (286.3 eV), C-N (285.7 eV), and O=C-O (289.1 eV) [45]. Concurrently, the N1s spectrum was deconvoluted into three peaks, encompassing pyridinic nitrogen (N-6, 398.8 eV), pyrrolic nitrogen (N-5, 400.2 eV), and quaternary nitrogen (N-Q, 401.4 eV) [35,46]. The relative contents of these functional groups were quantified based on the area of each peak, as listed in Table 5 and Table 6. With an increase in milling time, a decreasing trend in the content of C-C was observed, with a reduction of 7.41% from primary lignite to the sample milled for 50 min. Correspondingly, the relative content of oxygen-containing functional groups increased. This may be due to the ultrafine milling process, where the degree of oxidation of the fresh surfaces also intensified with the extension of milling time. Additionally, the increase in small micropores due to the reduced particle size likely contributed to enhanced adsorption. During the milling process, C-H bonds are the most reactive sites, reacting with oxygen adsorbed in the micropores and from the air, leading to the partial fixation of oxygen. As previously mentioned, the smaller the particle size, the greater the specific surface area and the more developed the microporous structure, resulting in a higher degree of oxygen fixation. These two factors contributed to the enhancement of oxygen-containing functional groups. Moreover, the hydrogen in -COOH functional groups present on the coal surface was readily replaced by NH4+ to form COONH4. This polar substitution attracted more -COO groups hidden within the coal molecules to the surface, resulting in an increase in -COO content on the coal sample surface post-adsorption. In the lignite samples subjected to 30 min and 50 min of milling, a decrease in the content of C-O bonds was observed after the adsorption of NH4+, which may be attributed to the formation of hydrogen bonds between the H atoms of NH4+ and the O atoms. Milling alone did not significantly affect the C-N bonds; however, after the coal samples adsorbed NH4+, the content of C-N increased. NH4+ carries a positive charge, while the coal surface exhibits negative charges (induced by groups such as -OH and -COOH). The electrostatic attraction between them resulted in the coverage of negatively charged functional groups and, consequently, a substantial increase in the proportion of C-N bonds. Furthermore, as the particle size decreased, the negative charge intensified, enhancing the adsorption of NH4+. Therefore, the increase in C-N content was most pronounced in the lignite milled for 50 min (from 11.18% to 28.38%), while the smallest increase was observed in the primary sample (only 3.37%). These overall results were in agreement with those obtained from FTIR analysis. Table 6 presents the contents of pyridinic (N-6), pyrrolic (N-5), and quaternary nitrogen (N-Q) on the surface of different coal samples. After the adsorption of NH4+, the content of quaternary nitrogen in the three lignite samples increased by 6.69%, 23.07%, and 36.87%, respectively. For the primary lignite sample, the relative content of pyridinic nitrogen remained essentially unchanged post-adsorption, while the content of pyrrolic nitrogen decreased. For the sample milled for 30 min, there was a decrease in the relative content of pyridinic nitrogen after adsorption. For the sample milled for 50 min, curve fitting results post-adsorption indicated reductions in both pyridinic and pyrrolic nitrogen contents. These results demonstrated that ultrafine lignite exhibited a stronger adsorption capacity for NH4+ and that finer particle sizes were correlated with greater adsorption quantities.
4. Conclusions
In this study, the ammonium nitrogen adsorption capacity of lignite was evaluated after ultrafine grinding with varying milling durations. The adsorption mechanism was also investigated. The main conclusions are as follows:
- (1)
- In the vertical stirring mill, the continuous collisions of zirconia balls with coal powder reduced particle size, created new micropores, and caused a significant collapse of existing macropores into mesopores and micropores. Following the milling process, a decrease in particle size is noted, leading to stronger cohesive forces between coal dust particles and resulting in denser agglomerates. This increased particle adhesion creates new porosity, including both mesopores and micropores. The increase in mesopores and micropores provides more adsorption sites, which improves the capacity to adsorb NH4+.
- (2)
- Adsorption capacity tests revealed that lignite milled for 50 min exhibited monolayer adsorption. For lignite milled for 50 min, both the adsorption rate and the time to reach equilibrium were slower compared to shorter milling times. Decreased pore size led to slower diffusion into pores, extending the time to achieve adsorption equilibrium, which resulted in higher adsorption capacity for lignite milled for 50 min compared to shorter milling times.
- (3)
- Prolonged milling time led to the exposure of more oxygen-containing functional groups, and samples milled for 50 min showed the highest electronegativity. With an increase in pH, the zeta potential of lignite decreased due to greater ionization of -OH and -COOH groups. Simultaneously, as H+ concentration in the solution decreased, competition for adsorption sites with NH4+ lessened, thus enhancing NH4+ adsorption onto the lignite.
- (4)
- FTIR and XPS analyses indicated that the -COOH functional groups on the coal surface readily underwent substitution by NH4+, forming COONH4. This polar substitution induced the exposure of more -COO groups on the surface, which were previously hidden within the coal’s molecular structure. Additionally, the hydrogen atoms in NH4+ likely formed adsorptive bonds with the oxygen atoms in C-O due to hydrogen bonding. Furthermore, a portion of NH4+ was also adsorbed onto the coal surface through electrostatic attraction. These three mechanisms collectively contributed to the increased adsorption capacity.
Overall, the enhancement of specific surface area and the augmentation of active adsorption sites through physical grinding were observed to increase the adsorption capacity for NH4+. This effect was more pronounced compared to the enhancement of adsorption capacity achieved through chemical modification with reagents. Benefiting from these characteristics, ultrafine lignite processed by grinding shows promise as a potential high-quality adsorbent material capable of effectively removing ammoniacal nitrogen from wastewater.
Author Contributions
S.Z.: investigation, data compilation, software, writing—original draft. Y.F.: funding acquisition, methodology, writing—original draft. X.D.: project administration. X.M.: writing—review and editing. M.Y.: writing—review and editing, mapping. W.X.: writing—review and editing. All authors have read and agreed to the published version of the manuscript.
Funding
This work was supported by the National Natural Science Foundation of China (Grant No. 51820105006).
Data Availability Statement
Data are contained within the article.
Conflicts of Interest
The authors declare no conflicts of interest.
References
- Cai, Y.; Zhu, M.; Meng, X.; Zhou, J.L.; Zhang, H.; Shen, X. The Role of Biochar on Alleviating Ammonia Toxicity in Anaerobic Digestion of Nitrogen-Rich Wastes: A review. Bioresour. Technol. 2022, 351, 126924. [Google Scholar] [CrossRef] [PubMed]
- Badran, A.M.; Utra, U.; Yussof, N.S.; Bashir, M.J.K. Advancements in Adsorption Techniques for Sustainable Water Purification: A Focus on Lead Removal. Separations 2023, 10, 565. [Google Scholar] [CrossRef]
- Liu, W.; Zhang, Q.; Shen, Y.; Li, W.; Zhao, S.; Zhao, Q.; Zhang, Y. A Study on the Removal Characteristics and Mechanism of Phosphorus from Simulated Wastewater Using a Novel Modified Red-Mud-Based Adsorption Material. Separations 2023, 10, 562. [Google Scholar] [CrossRef]
- Ji, B.; Zhang, H.; Zhou, L.; Yang, J.; Zhang, K.; Yuan, X.; Ma, J.; Qian, Y. Effect of the Rapid Increase of Salinity on Anoxic-Oxic Biofilm Reactor for Treatment of High-Salt and High-Ammonia-Nitrogen Wastewater. Bioresour. Technol. 2021, 337, 125363. [Google Scholar] [CrossRef]
- Dalanta, F.; Kusworo, T.D. Synergistic Adsorption and Photocatalytic Properties of AC/TiO2/CeO2 Composite for Phenol and Ammonia-Nitrogen Compound Degradations from Petroleum Refinery Wastewater. Chem. Eng. J. 2022, 434, 134687. [Google Scholar] [CrossRef]
- Cui, H.; Ma, H.; Chen, S.; Yu, J.; Xu, W.; Zhu, X.; Gujar, A.; Ji, C.; Xue, J.; Zhang, C.; et al. Mitigating Excessive Ammonia Nitrogen in Chicken Farm Flushing Wastewater by Mixing Strategy for Nutrient Removal and Lipid Accumulation in the Green Alga Chlorella Sorokiniana. Bioresour. Technol. 2020, 303, 122940. [Google Scholar] [CrossRef] [PubMed]
- Velasco-Garduño, O.; Mendoza-Reséndiz, A.; Fajardo-Ortiz, C.; Beristain-Cardoso, R. Simultaneous Ammonia and Organic Matter Removal from Industrial Wastewater in A Continuous Novel Hybrid Carrousel Bioreactor. Int. J. Environ. Sci. Technol. 2019, 16, 3429–3436. [Google Scholar] [CrossRef]
- Cheng, H.; Zhu, Q.; Xing, Z. Adsorption of Ammonia Nitrogen in Low Temperature Domestic Wastewater by Modification Bentonite. J. Clean. Prod. 2019, 233, 720–730. [Google Scholar] [CrossRef]
- Bai, T.; Yao, Y.; Zhao, J.; Tian, L.; Zhang, L. Adsorption Performance and Mechanism of H3PO4-Modified Banana Peel Hydrothermal Carbon on Pb (II). Separations 2024, 11, 17. [Google Scholar] [CrossRef]
- Zhao, A.; Liu, S.; Yao, J.; Huang, F.; He, Z.; Liu, J. Characteristics of Bio-Oil and Biochar from Cotton Stalk Pyrolysis: Effects of Torrefaction Temperature and Duration in An Ammonia Environment. Bioresour. Technol. 2022, 343, 126145. [Google Scholar] [CrossRef]
- Fang, F.; Han, H. Effect of Catalytic Ozonation Coupling with Activated Carbon Adsorption on Organic Compounds Removal Treating RO Concentrate from Coal Gasification Wastewater. Ozone Sci. Eng. 2018, 40, 275–283. [Google Scholar] [CrossRef]
- Erto, A.; Giraldo, L.; Lancia, A.; Moreno-Piraján, J.C. A Comparison Between A Low-Cost Sorbent and An Activated Carbon for the Adsorption of Heavy Metals From Water. Water Air Soil Pollut. 2013, 224, 1531. [Google Scholar] [CrossRef]
- Querol, X.; Moreno, N.; Umaña, J.C.; Alastuey, A.; Hernández, E.; López-Soler, A.; Plana, F. Synthesis of Zeolites from Coal Fly Ash: An Overview. Int. J. Coal Geol. 2002, 50, 413–423. [Google Scholar] [CrossRef]
- Moreno, N.; Querol, X.; Ayora, C.; Pereira, C.F.; Janssen-Jurkovicová, M. Utilization of Zeolites Synthesized from Coal Fly Ash for the Purification of Acid Mine Waters. Environ. Sci. Technol. 2001, 35, 3526–3534. [Google Scholar] [CrossRef]
- Yao, R.; Li, H.; Yang, J.; Zhu, W.; Yin, C.; Wang, X.; Xie, W.; Zhang, X. Combined Application of Biochar and N Fertilizer Shifted Nitrification Rate and Amoa Gene Abundance of Ammonia-Oxidizing Microorganisms in Salt-Affected Anthropogenic-Alluvial Soil. Appl. Soil Ecol. 2022, 171, 104348. [Google Scholar] [CrossRef]
- Daud, Z.; Santiagoo, R.; Tajarudin, H.A.; Gomesh, N.; Awang, H.; Nasir, N.; Ridzuan, M.B.; Detho, A. Experimental Approach for Chemical Oxygen Demand and Ammonia Nitrogen Removal from Natural Rubber Wastewater via Adsorption by Kaolin. IOP Conf. Ser. Earth Environ. Sci. IOP Publ. 2020, 616, 012070. [Google Scholar] [CrossRef]
- Yavuz, Ö.; Saka, C. Surface Modification with Cold Plasma Application on Kaolin and its Effects on the Adsorption of Methylene Blue. Appl. Clay Sci. 2013, 85, 96–102. [Google Scholar] [CrossRef]
- Pan, J.; Zhang, Z.; Li, M.; Wu, Y.; Wang, K. Characteristics of Multi-Scale Pore Structure of Coal and its Influence on Permeability. Nat. Gas Ind. B 2019, 6, 357–365. [Google Scholar] [CrossRef]
- Mao, Y.; Bu, X.; Peng, Y.; Tian, F.; Xie, G. Effects of simultaneous ultrasonic treatment on the separation selectivity and flotation kinetics of high-ash lignite. Fuel 2020, 259, 116270. [Google Scholar] [CrossRef]
- Rashid, M.; Hussain, Q.; Hayat, R.; Ahmed, M.; Islam, M.S.; Soufan, W.; Elango, D.; Rajendran, K.; Iqbal, R.; Bhat, T.A.; et al. Lignite Scaffolding as Slowrelease N-Fertilizer Extended the Sn Retention and Inhibited N Losses in Alkaline Calcareous Soils. ACS Omega 2023, 8, 22732–22741. [Google Scholar] [CrossRef]
- Sarlaki, E.; Paghaleh, A.S.; Kianmehr, M.H.; Vakilian, K.A. Extraction and Purification of Humic Acids from Lignite Wastes Using Alkaline Treatment and Membrane Ultrafiltration. J. Clean. Prod. 2019, 235, 712–723. [Google Scholar] [CrossRef]
- Jones, C. Chapter 1, The Nature of Lignites. In Lignites: Their Occurrence, Production and Utilisation; Jones, C., Ed.; Whittles Publishing: Dunbeath, UK, 2016. [Google Scholar]
- Vinodh, R.; Kim, D.K.; Ganesh, M.; Peng, M.M.; Abidov, A.; Krishnamurthy, N.; Palanichamy, M.; Cha, W.S.; Jang, H.T. Hypercross-linked Lignite for NOx and CO2 Sorption. J. Ind. Eng. Chem. 2015, 23, 194–199. [Google Scholar] [CrossRef]
- Sarah, A.G.; Rajanikanth, B.S. Nox Reduction from Biodiesel Exhaust by Plasma Induced Ozone Injection Supported by Lignite Waste Adsorption. IEEE Trans. Dielectr. Electr. Insul. 2016, 23, 2006–2014. [Google Scholar] [CrossRef]
- Ong, H.L.; Swanson, V.E. Adsorption of Copper by Peat, Lignite, and Bituminous Coal. Econ. Geol. 1966, 61, 1214–1231. [Google Scholar] [CrossRef]
- Xu, H.; Wang, Y.; Huagn, G.; Fan, G.; Lihui, G.; Li, X. Removal of Quinoline from Aqueous Solutions by Lignite, Coking Coal and Anthracite. Adsorption Kinetics. Physicochem. Probl. Miner. Process. 2016, 52, 214–227. [Google Scholar] [CrossRef]
- Rose, M.T.; Perkins, E.L.; Saha, B.K.; Tang, E.C.W.; Cavagnaro, T.R.; Jackson, W.R.; Hapgood, K.P.; Hoadley, A.F.A.; Patti, A.F. A Slow Release Nitrogen Fertiliser Produced by Simultaneous Granulation and Superheated Steam Drying of Urea with Brown Coal. Chem. Biol. Technol. Agric. 2016, 3, 10. [Google Scholar] [CrossRef]
- Sun, J.; Bai, M.; Shen, J.; Griffith, D.W.T.; Denmead, O.T.; Hill, J.; Lam, S.K.; Mosier, A.R.; Chen, D. Effects of Lignite Application on Ammonia and Nitrous Oxide Emissions from Cattle Pens. Sci. Total Environ. 2016, 565, 148–154. [Google Scholar] [CrossRef] [PubMed]
- Paramashivam, D.; Clough, T.J.; Carlton, A.; Gough, K.; Dickinson, N.; Horswell, J.; Sherlock, R.R.; Clucas, L.; Robinson, B.H. The Effect of Lignite on Nitrogen Mobility in A Low-Fertility Soil Amended with Biosolids and Urea. Sci. Total Environ. 2016, 543, 601–608. [Google Scholar] [CrossRef]
- Saha, B.K.; Rose, M.T.; Wong, V.; Cavagnaro, T.R.; Patti, A.F. Hybrid Brown Coalurea Fertiliser Reduces Nitrogen Loss Compared to Urea Alone. Sci. Total Environ. 2017, 601, 1496–1504. [Google Scholar] [CrossRef]
- Saha, B.K.; Patti, A.F.; Rose, M.T.; Wong, V.N.L.; Cavagnaro, T.R. A Slow Release Brown Coal-Urea Fertiliser Reduced Gaseous N Loss from Soil and Increased Silver Beet Yield and N Uptake. Sci. Total Environ. 2019, 649, 793–800. [Google Scholar] [CrossRef]
- Han, Z.; Wang, S.; Zhao, J.; Hu, X.; Fei, Y.; Xu, M. Identification of nitrogen-sources in an aquifer beneath a municipal solid waste landfill in the vicinity of multiple pollutant sources. J. Environ. Manag. 2020, 268, 110661. [Google Scholar] [CrossRef] [PubMed]
- Chen, L.-Q.; Hu, Y. Influencing Factors on Determination of Ammonia Nitrogen in Water by Nessler’s Reagent Spectrophotometry. Int. Symp. Water Resour. Environ. Prot. IEEE 2011, 2, 1173–1176. [Google Scholar]
- Wang, B.; Lehmann, J.; Hanley, K.; Hestrin, R.; Enders, A. Adsorption and Desorption of Ammonium by Maple Wood Biochar as A Function of Oxidation and pH. Chemosphere 2015, 138, 120–126. [Google Scholar] [CrossRef] [PubMed]
- Liu, X.; Tu, Y.; Liu, S.; Liu, K.; Zhang, L.; Li, G.; Xu, Z. Adsorption of Ammonia Nitrogen and Phenol onto the Lignite Surface: An Experimental and Molecular Dynamics Simulation Study. J. Hazard. Mater. 2021, 416, 125966. [Google Scholar] [CrossRef] [PubMed]
- Liu, J.; Jiang, X.; Huang, X.; Wu, S. Morphological Characterization of Super Fine Pulverized Coal Particle. Part 4. Nitrogen Adsorption and Small Angle X-Ray Scattering Study. Energy Fuels 2010, 24, 3072–3085. [Google Scholar] [CrossRef]
- Luo, L.; Yao, W.; Liu, J.; Zhang, H.; Ma, J.; Jiang, X. The Effect of the Grinding Process on Pore Structures, Functional Groups and Release Characteristic of Flash Pyrolysis of Superfine Pulverized Coal. Fuel 2019, 235, 1337–1346. [Google Scholar] [CrossRef]
- Zhao, J.; Xu, H.; Tang, D.; Mathews, J.P.; Li, S.; Tao, S. A Comparative Evaluation of Coal Specific Surface area by CO2 and N2 Adsorption and Its Influence on CH4 Adsorption Capacity at Different Pore Sizes. Fuel 2016, 183, 420–431. [Google Scholar] [CrossRef]
- Qi, Y.; Hoadley, A.F.; Chaffee, A.L.; Garnier, G. Characterisation of Lignite as an Industrial Adsorbent. Fuel 2011, 90, 1567–1574. [Google Scholar] [CrossRef]
- Bu, X.; Chen, Y.; Ma, G.; Sun, Y.; Ni, C.; Xie, G. Wet and dry grinding of coal in a laboratory-scale ball mill: Particle-size distributions. Powder Technol. 2020, 359, 305–313. [Google Scholar] [CrossRef]
- Bu, X.; Xie, G.; Peng, Y.; Chen, Y. Kinetic modeling and optimization of flotation process in a cyclonic microbubble flotation column using composite central design methodology. Int. J. Miner. Process. 2016, 157, 175–183. [Google Scholar] [CrossRef]
- Joglekar, A.M.; May, A.T. Product excellence through design of experiments. Cereal Foods World 1987, 32, 857. [Google Scholar]
- Tu, Y.; Feng, P.; Ren, Y.; Cao, Z.; Wang, R.; Xu, Z. Adsorption of Ammonia Nitrogen on Lignite and Its Influence on Coal Water Slurry Preparation. Fuel 2019, 238, 34–43. [Google Scholar] [CrossRef]
- Wajima, T. Preparation of Mixed Metal Hydroxide Ash-Derived Adsorbent from Coal Fly Ash and Quicklime for Removal of Pb2+, NH4+, and PO43− from Aqueous Solution. Mater. Trans. 2022, 63, 379–388. [Google Scholar] [CrossRef]
- Han, B.; Zhang, W.; He, J.-Z.; Chen, D. Lignite Ammonia Adsorption and Surface Chemistry after Dewatering. Sep. Purif. Technol. 2020, 253, 117483. [Google Scholar] [CrossRef]
- Mochizuki, Y.; Bud, J.; Byambajav, E.; Tsubouchi, N. Influence of Ammonia Treatment on the CO2 Adsorption of Activated Carbon. J. Environ. Chem. Eng. 2022, 10, 107273. [Google Scholar] [CrossRef]
Figure 1.
Particle size distribution graph of lignite samples with varying milling durations. (a) Particle size distribution of different lignites; (b) cumulative particle size distribution of different lignites; (c) mean particle size of different lignites.
Figure 1.
Particle size distribution graph of lignite samples with varying milling durations. (a) Particle size distribution of different lignites; (b) cumulative particle size distribution of different lignites; (c) mean particle size of different lignites.

Figure 2.
N2 adsorption isotherms for three types of lignite: (a) Lignite-0 min; (b) Lignite-30 min; (c) Lignite-50 min.
Figure 2.
N2 adsorption isotherms for three types of lignite: (a) Lignite-0 min; (b) Lignite-30 min; (c) Lignite-50 min.
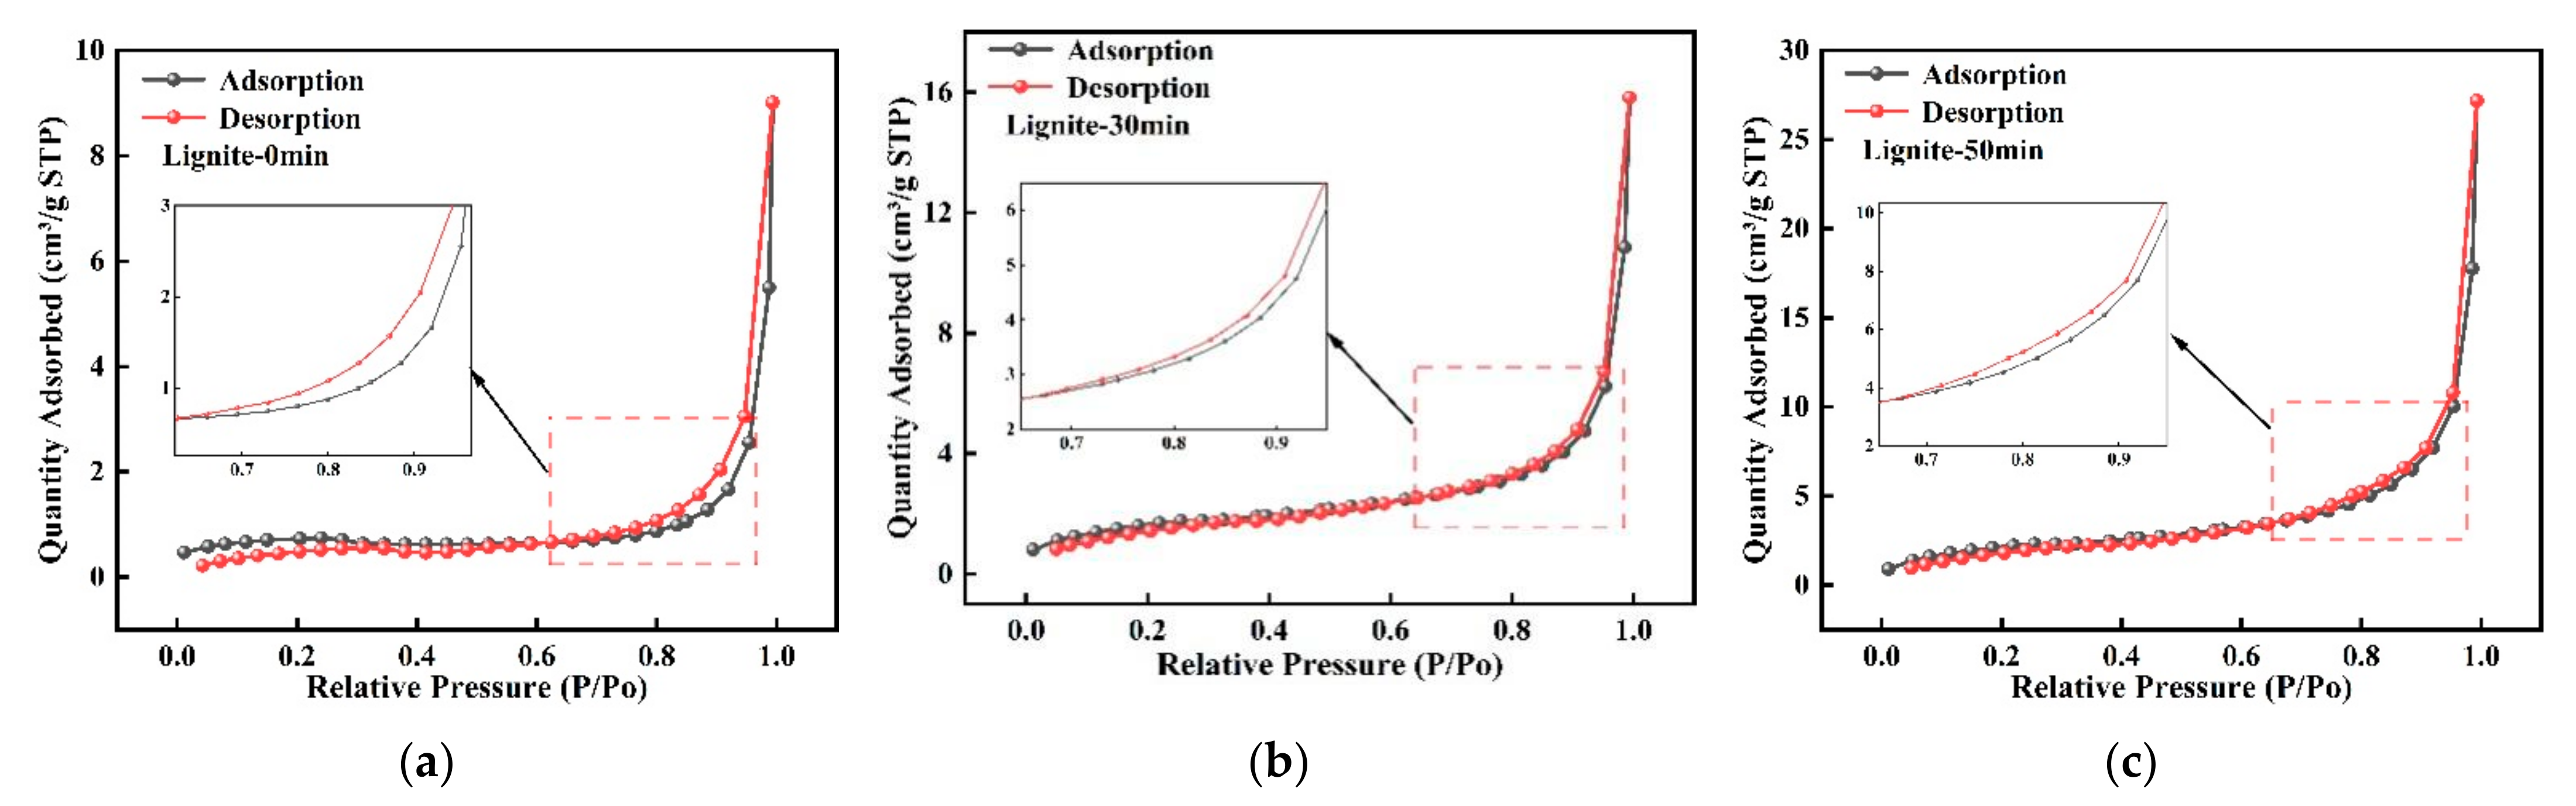
Figure 3.
Isotherms of CO2 gas adsorption for three types of lignite.
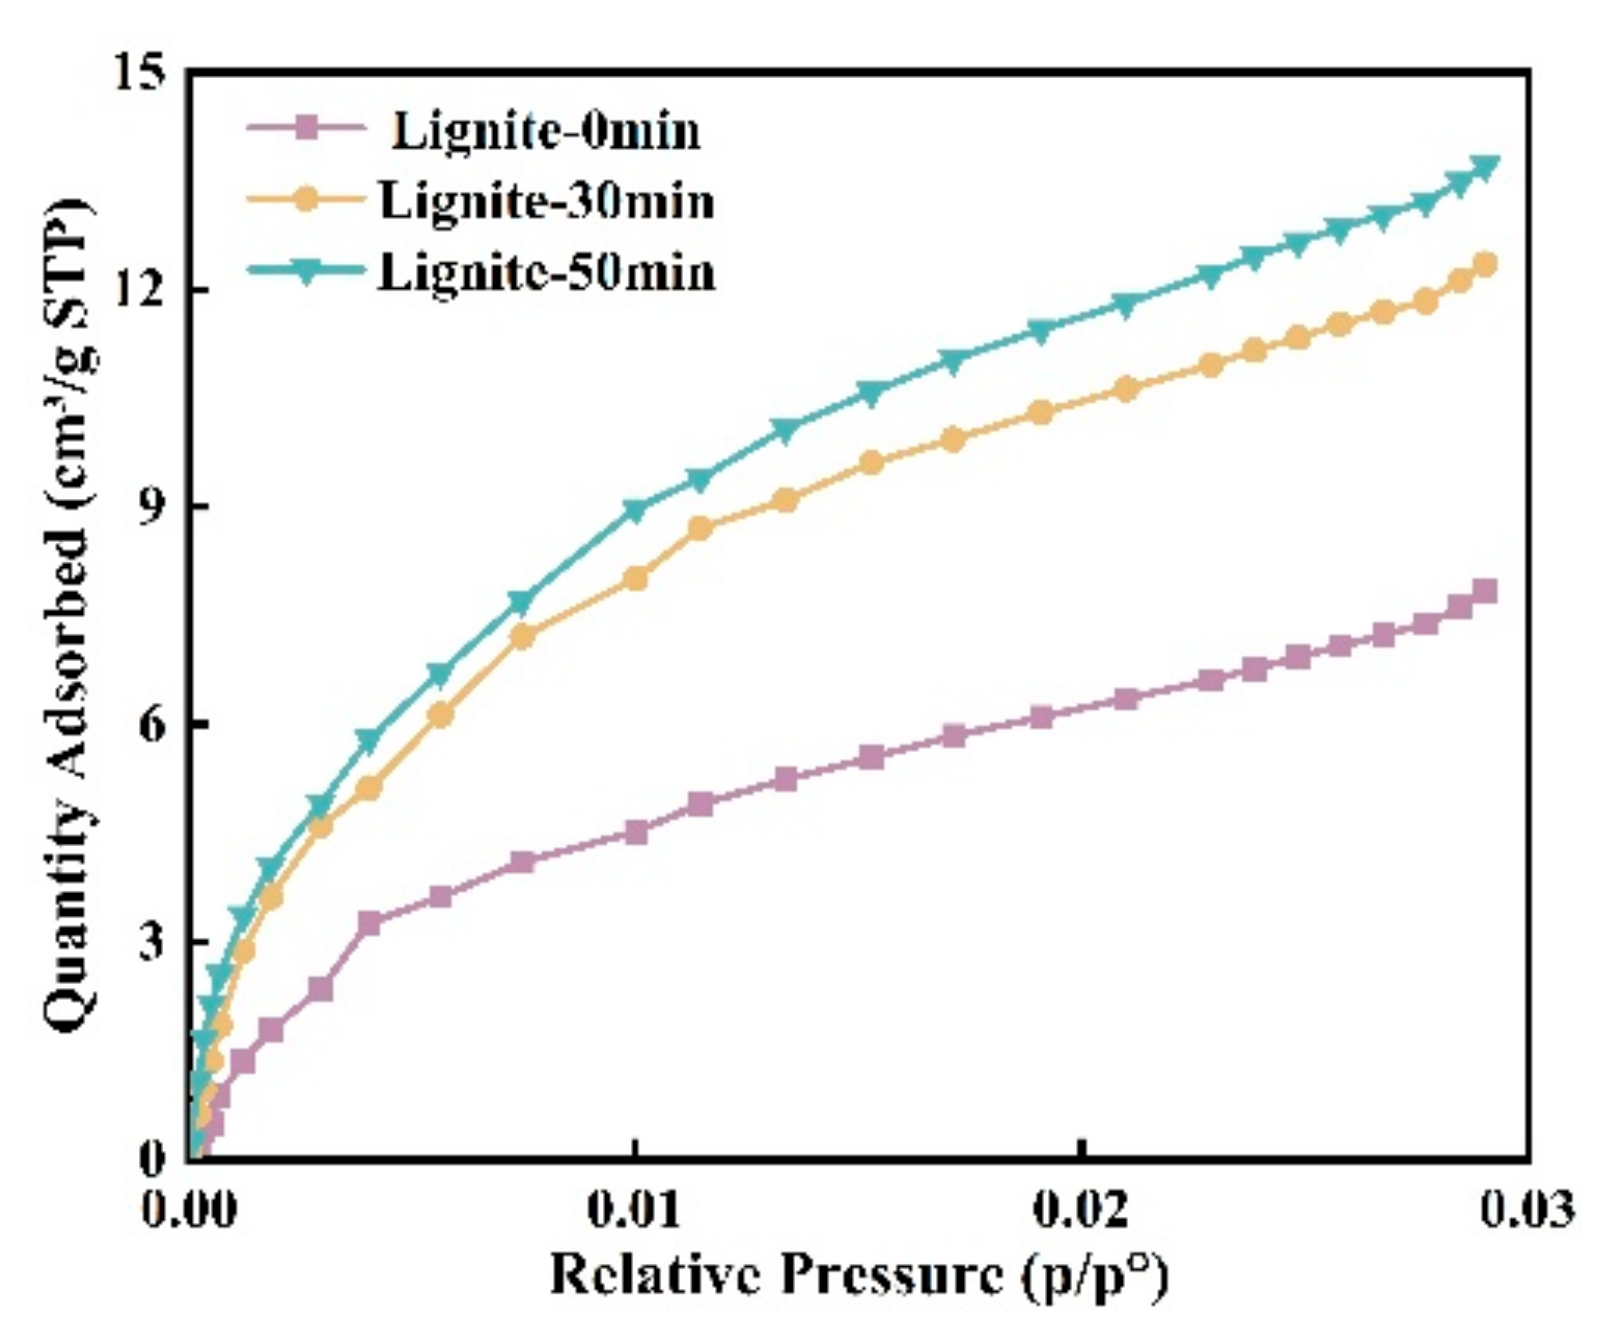
Figure 4.
Micropore distribution curves of three lignite samples.

Figure 5.
Microstructural images of three types of lignite: (a) Lignite-0 min; (b) Lignite-30 min; (c) Lignite-50 min.
Figure 5.
Microstructural images of three types of lignite: (a) Lignite-0 min; (b) Lignite-30 min; (c) Lignite-50 min.
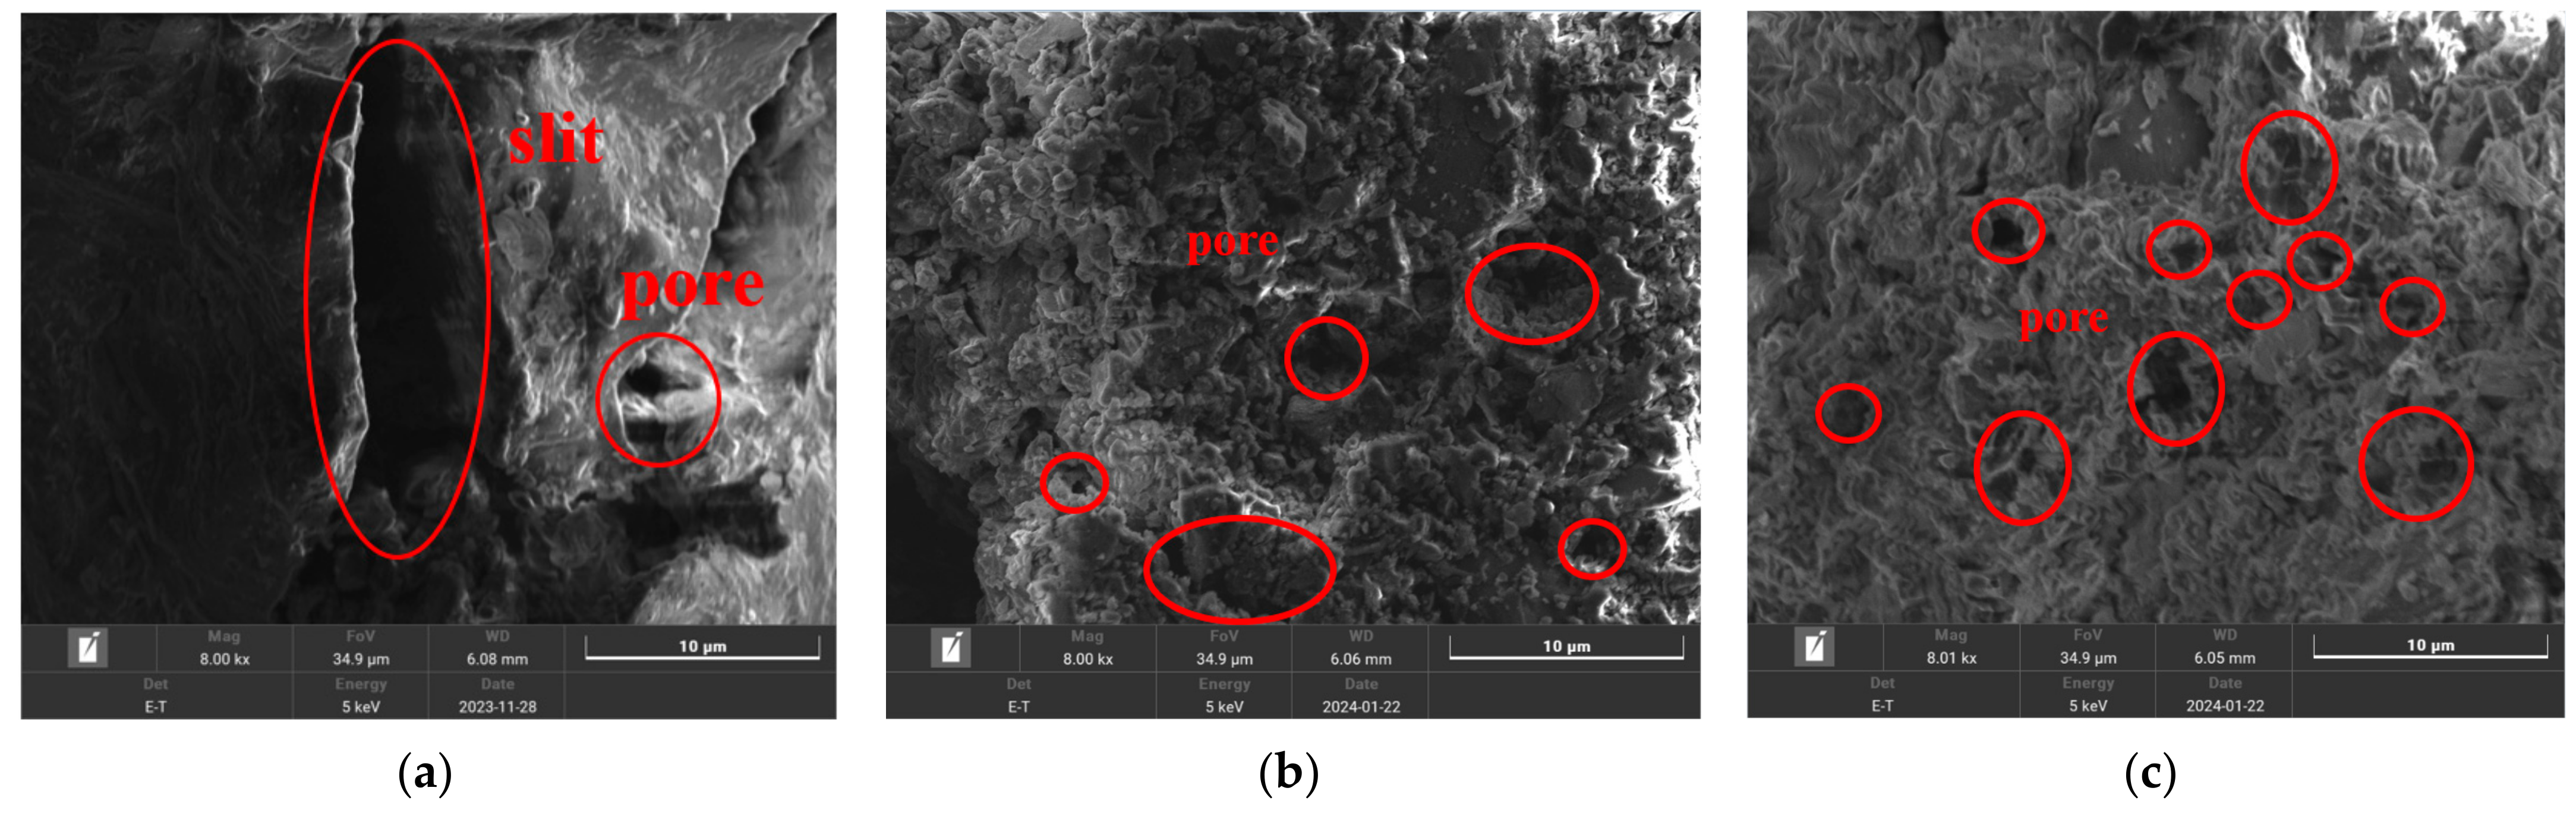
Figure 6.
Adsorption isotherms of lignite for NH4+ at different milling times: (a) Lignite-0 min; (b) Lignite-30 min; (c) Lignite-50 min.
Figure 6.
Adsorption isotherms of lignite for NH4+ at different milling times: (a) Lignite-0 min; (b) Lignite-30 min; (c) Lignite-50 min.
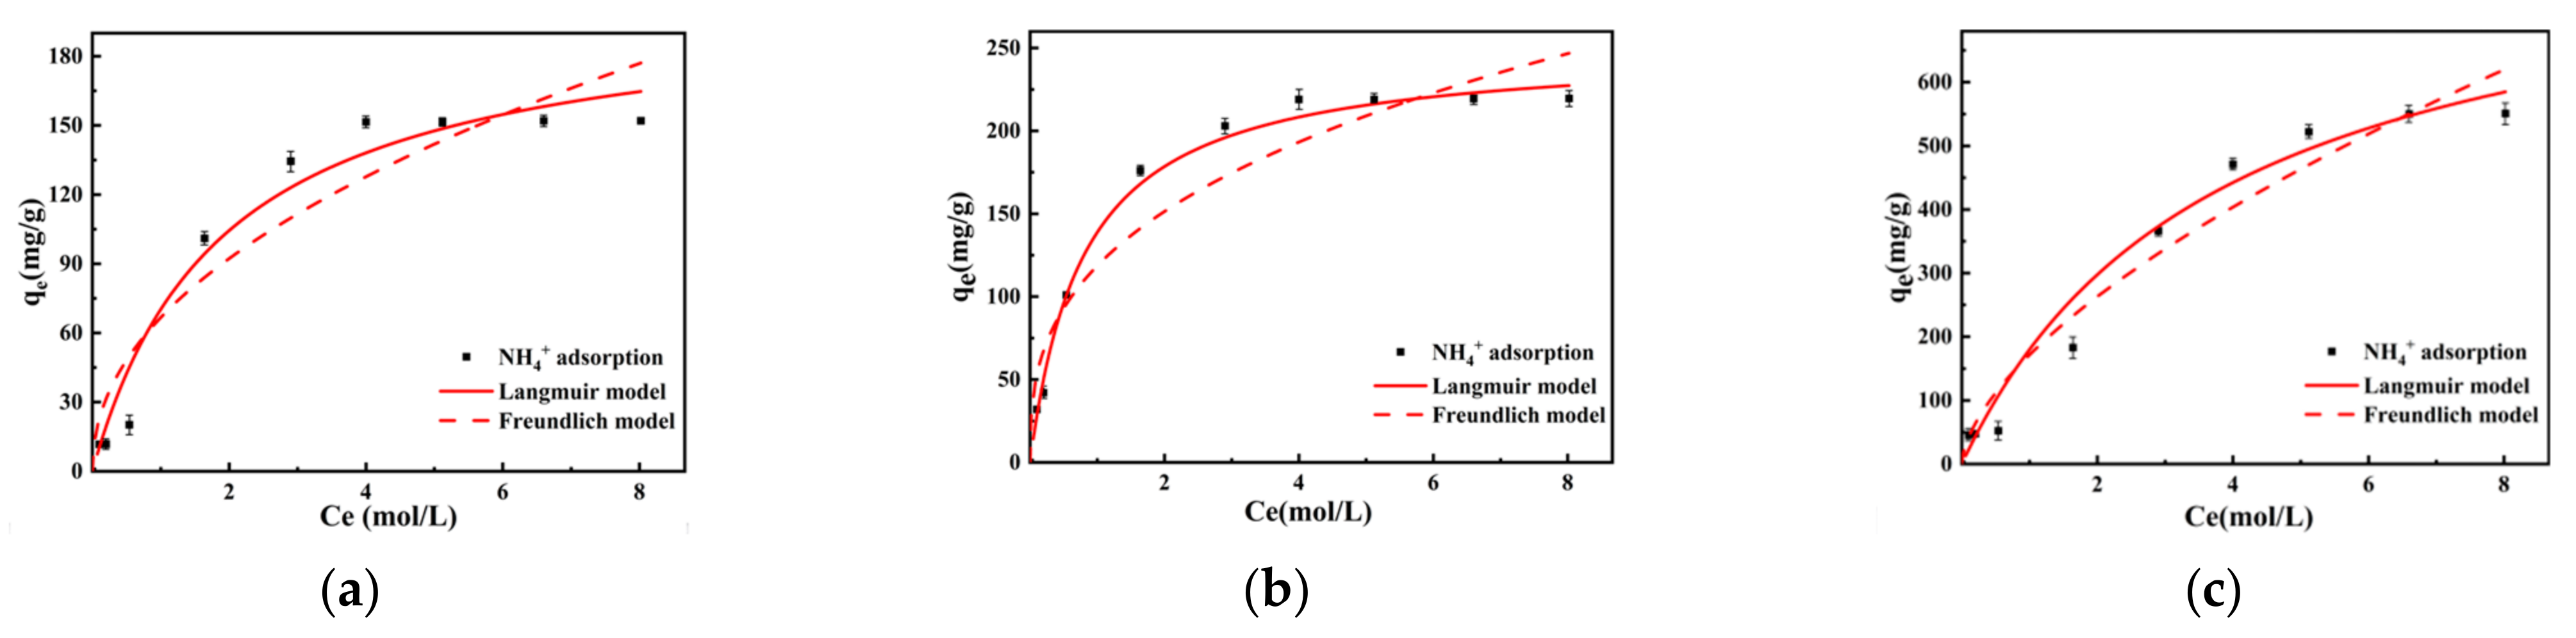
Figure 7.
Adsorption kinetics curves of lignite for NH4+ at different milling times: (a) Lignite-0 min; (b) Lignite-30 min; (c) Lignite-50 min.
Figure 7.
Adsorption kinetics curves of lignite for NH4+ at different milling times: (a) Lignite-0 min; (b) Lignite-30 min; (c) Lignite-50 min.
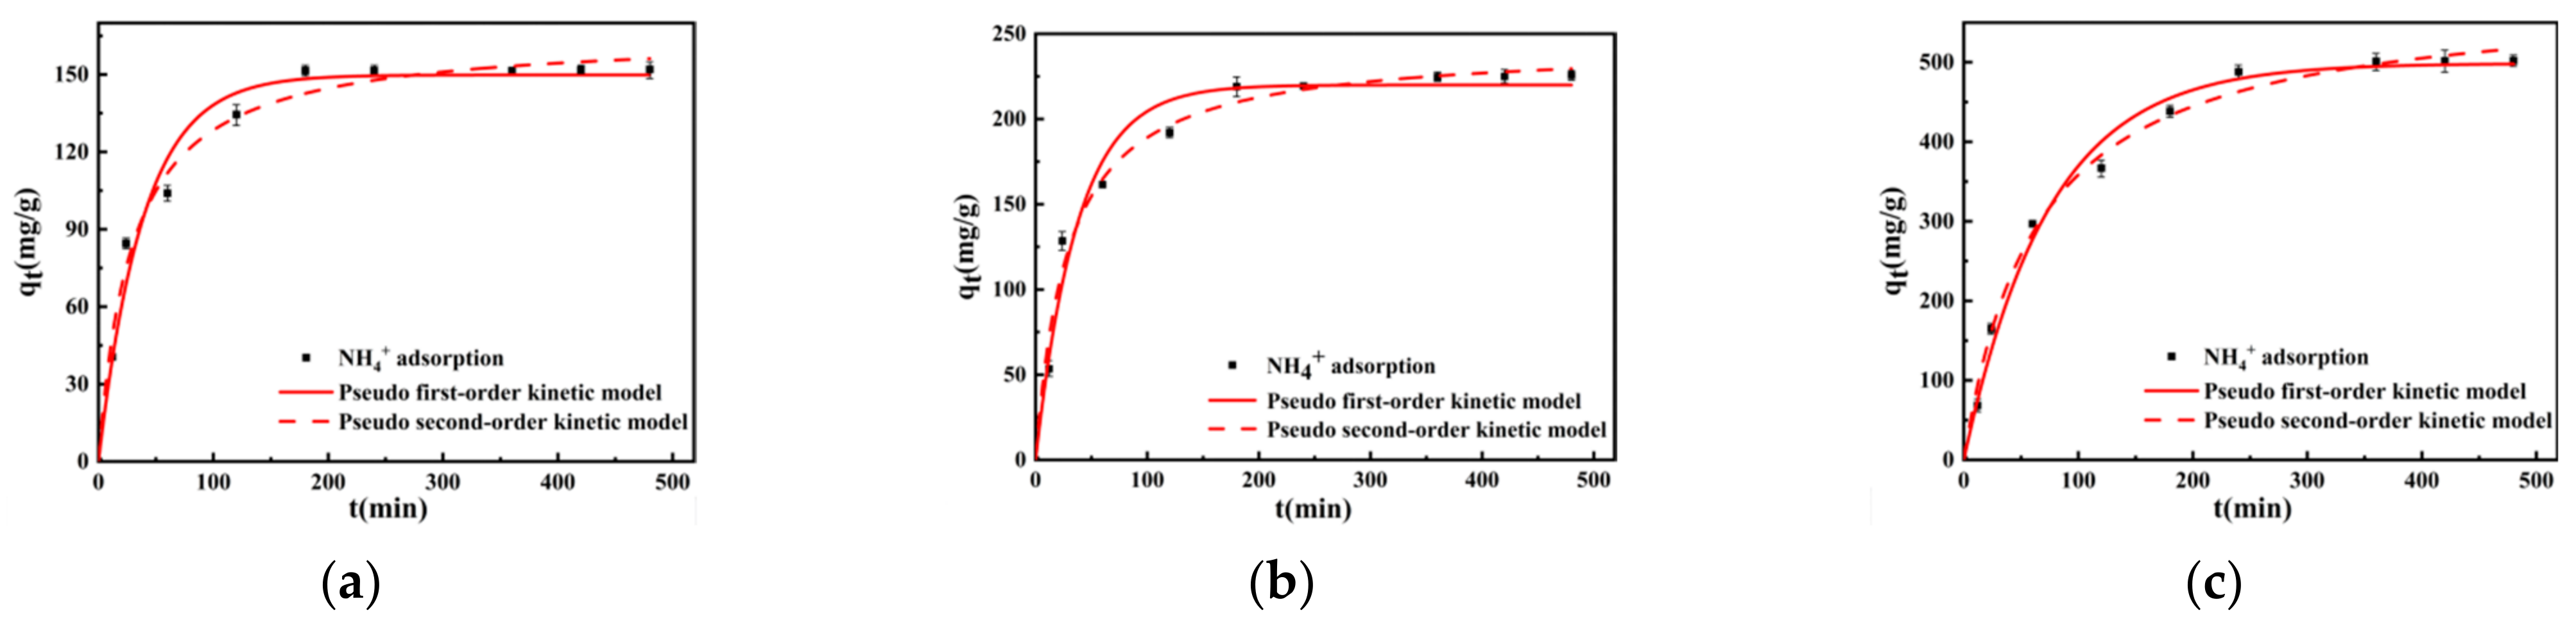
Figure 8.
Equilibrium adsorption capacity determined under initial solutions of different pH values.
Figure 8.
Equilibrium adsorption capacity determined under initial solutions of different pH values.
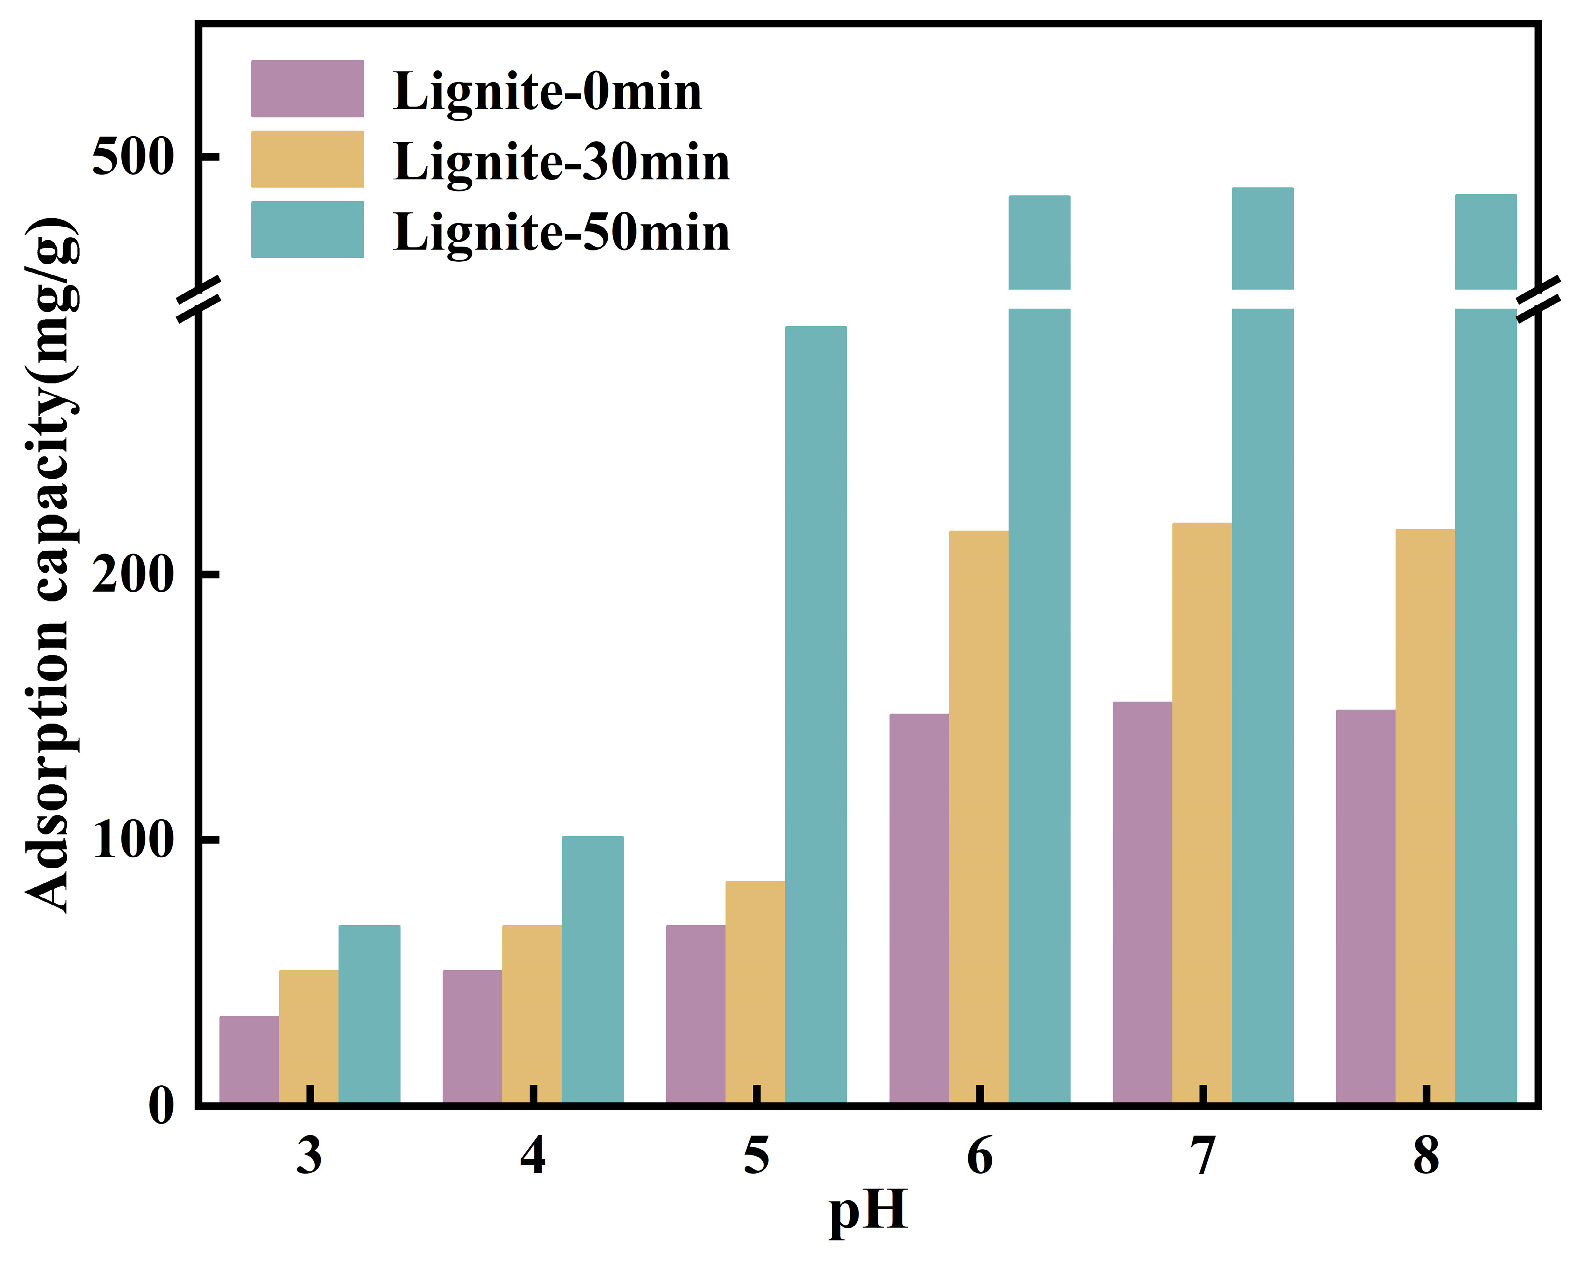
Figure 9.
Zeta potential of three types of lignite at different pH levels.
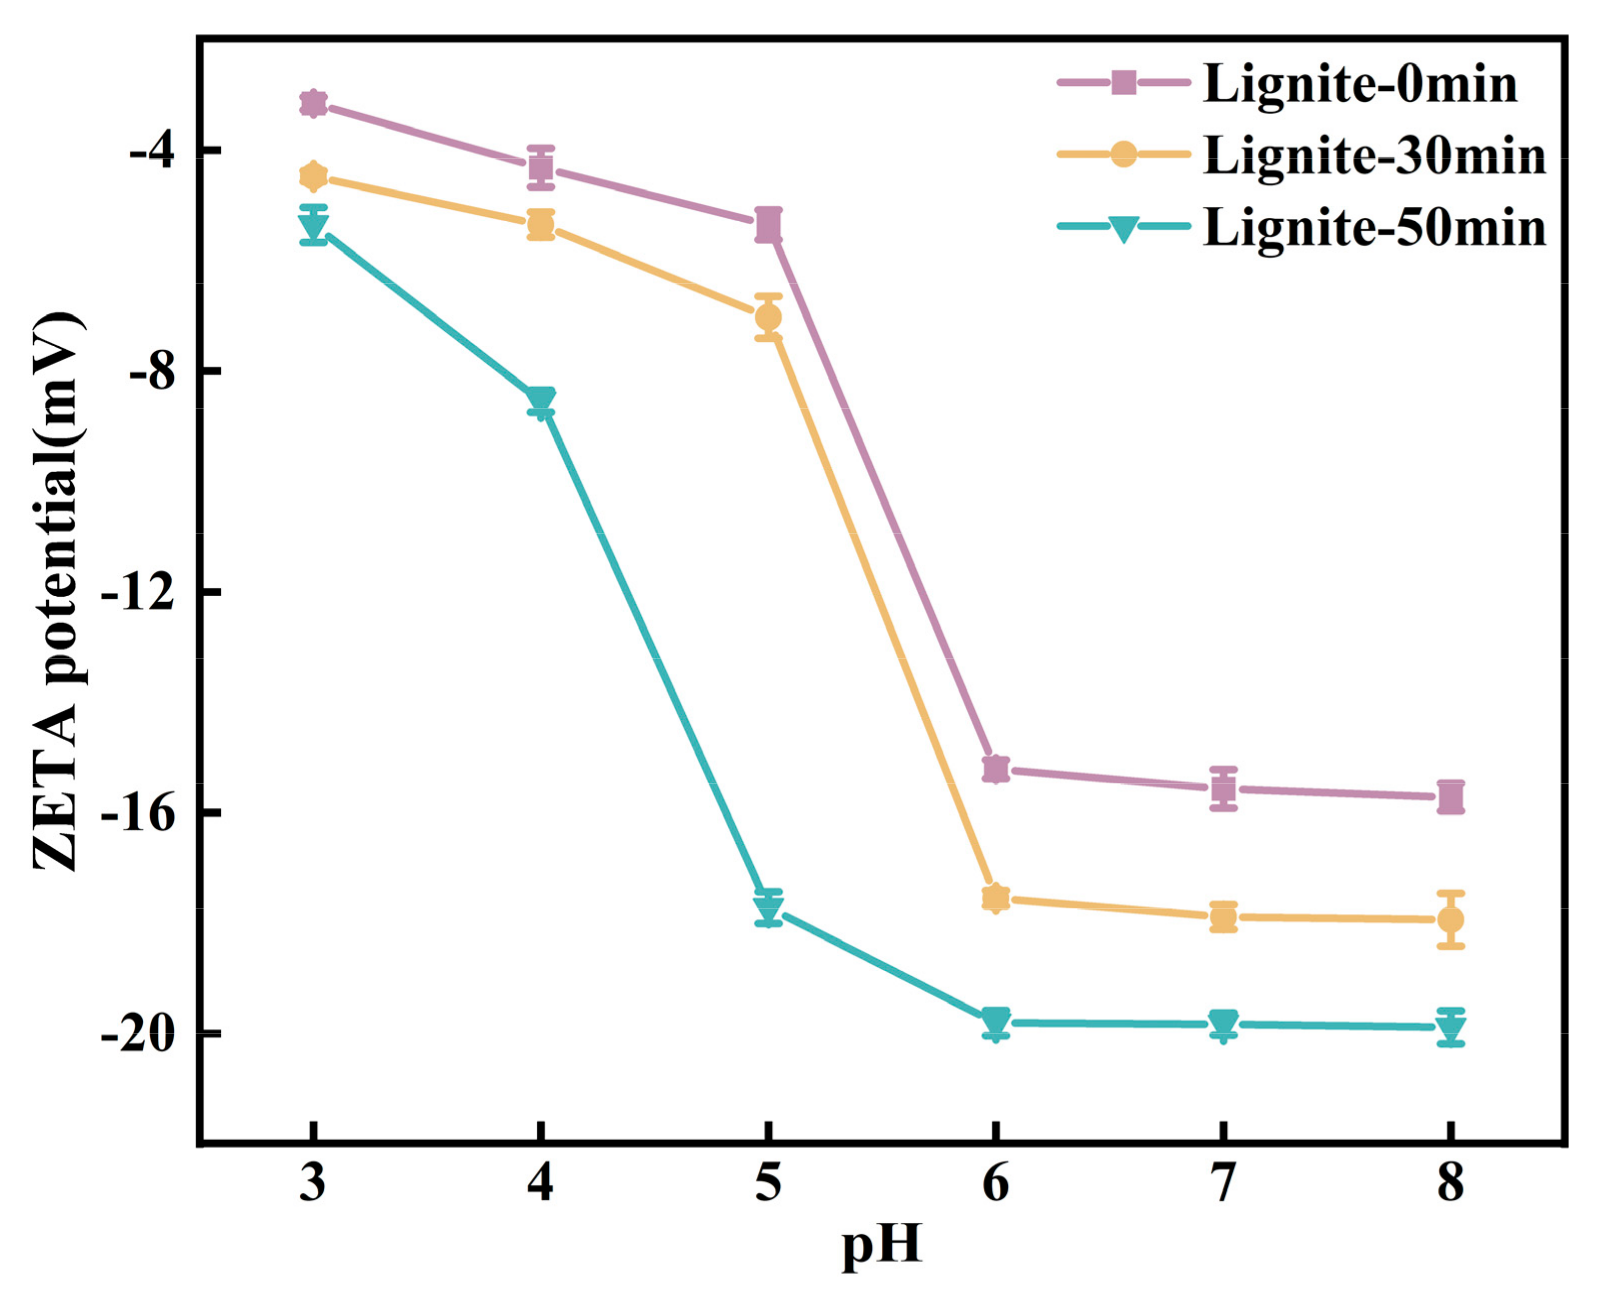
Figure 10.
Results from FTIR tests: (a) FTIR of lignite milled for different durations; (b) FTIR of lignite milled for different durations after adsorption of NH4+.
Figure 10.
Results from FTIR tests: (a) FTIR of lignite milled for different durations; (b) FTIR of lignite milled for different durations after adsorption of NH4+.
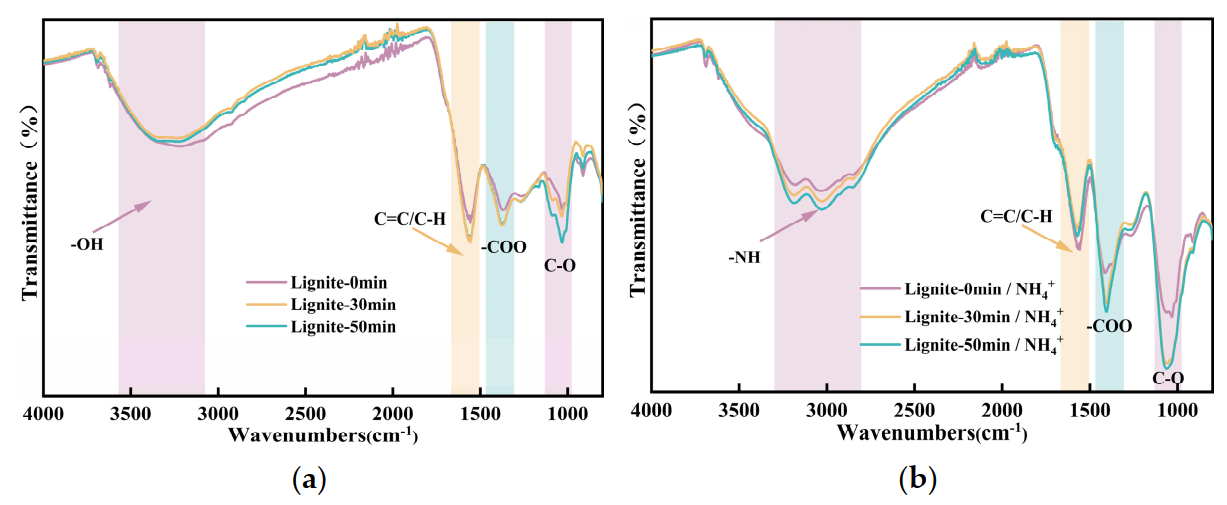
Figure 11.
XPS survey spectra of lignite after different milling durations and post-adsorption of NH4+: (a) XPS survey spectra of different samples; (b) elemental composition ratios.
Figure 11.
XPS survey spectra of lignite after different milling durations and post-adsorption of NH4+: (a) XPS survey spectra of different samples; (b) elemental composition ratios.

Figure 12.
Deconvolution results of C1s peaks for three types of lignite before and after adsorption: (a) Lignite-0 min; (b) Lignite-30 min; (c) Lignite-50 min; (d) Lignite-0 min/NH4+; (e) Lignite-30 min/NH4+; (f) Lignite-50 min/NH4+.
Figure 12.
Deconvolution results of C1s peaks for three types of lignite before and after adsorption: (a) Lignite-0 min; (b) Lignite-30 min; (c) Lignite-50 min; (d) Lignite-0 min/NH4+; (e) Lignite-30 min/NH4+; (f) Lignite-50 min/NH4+.
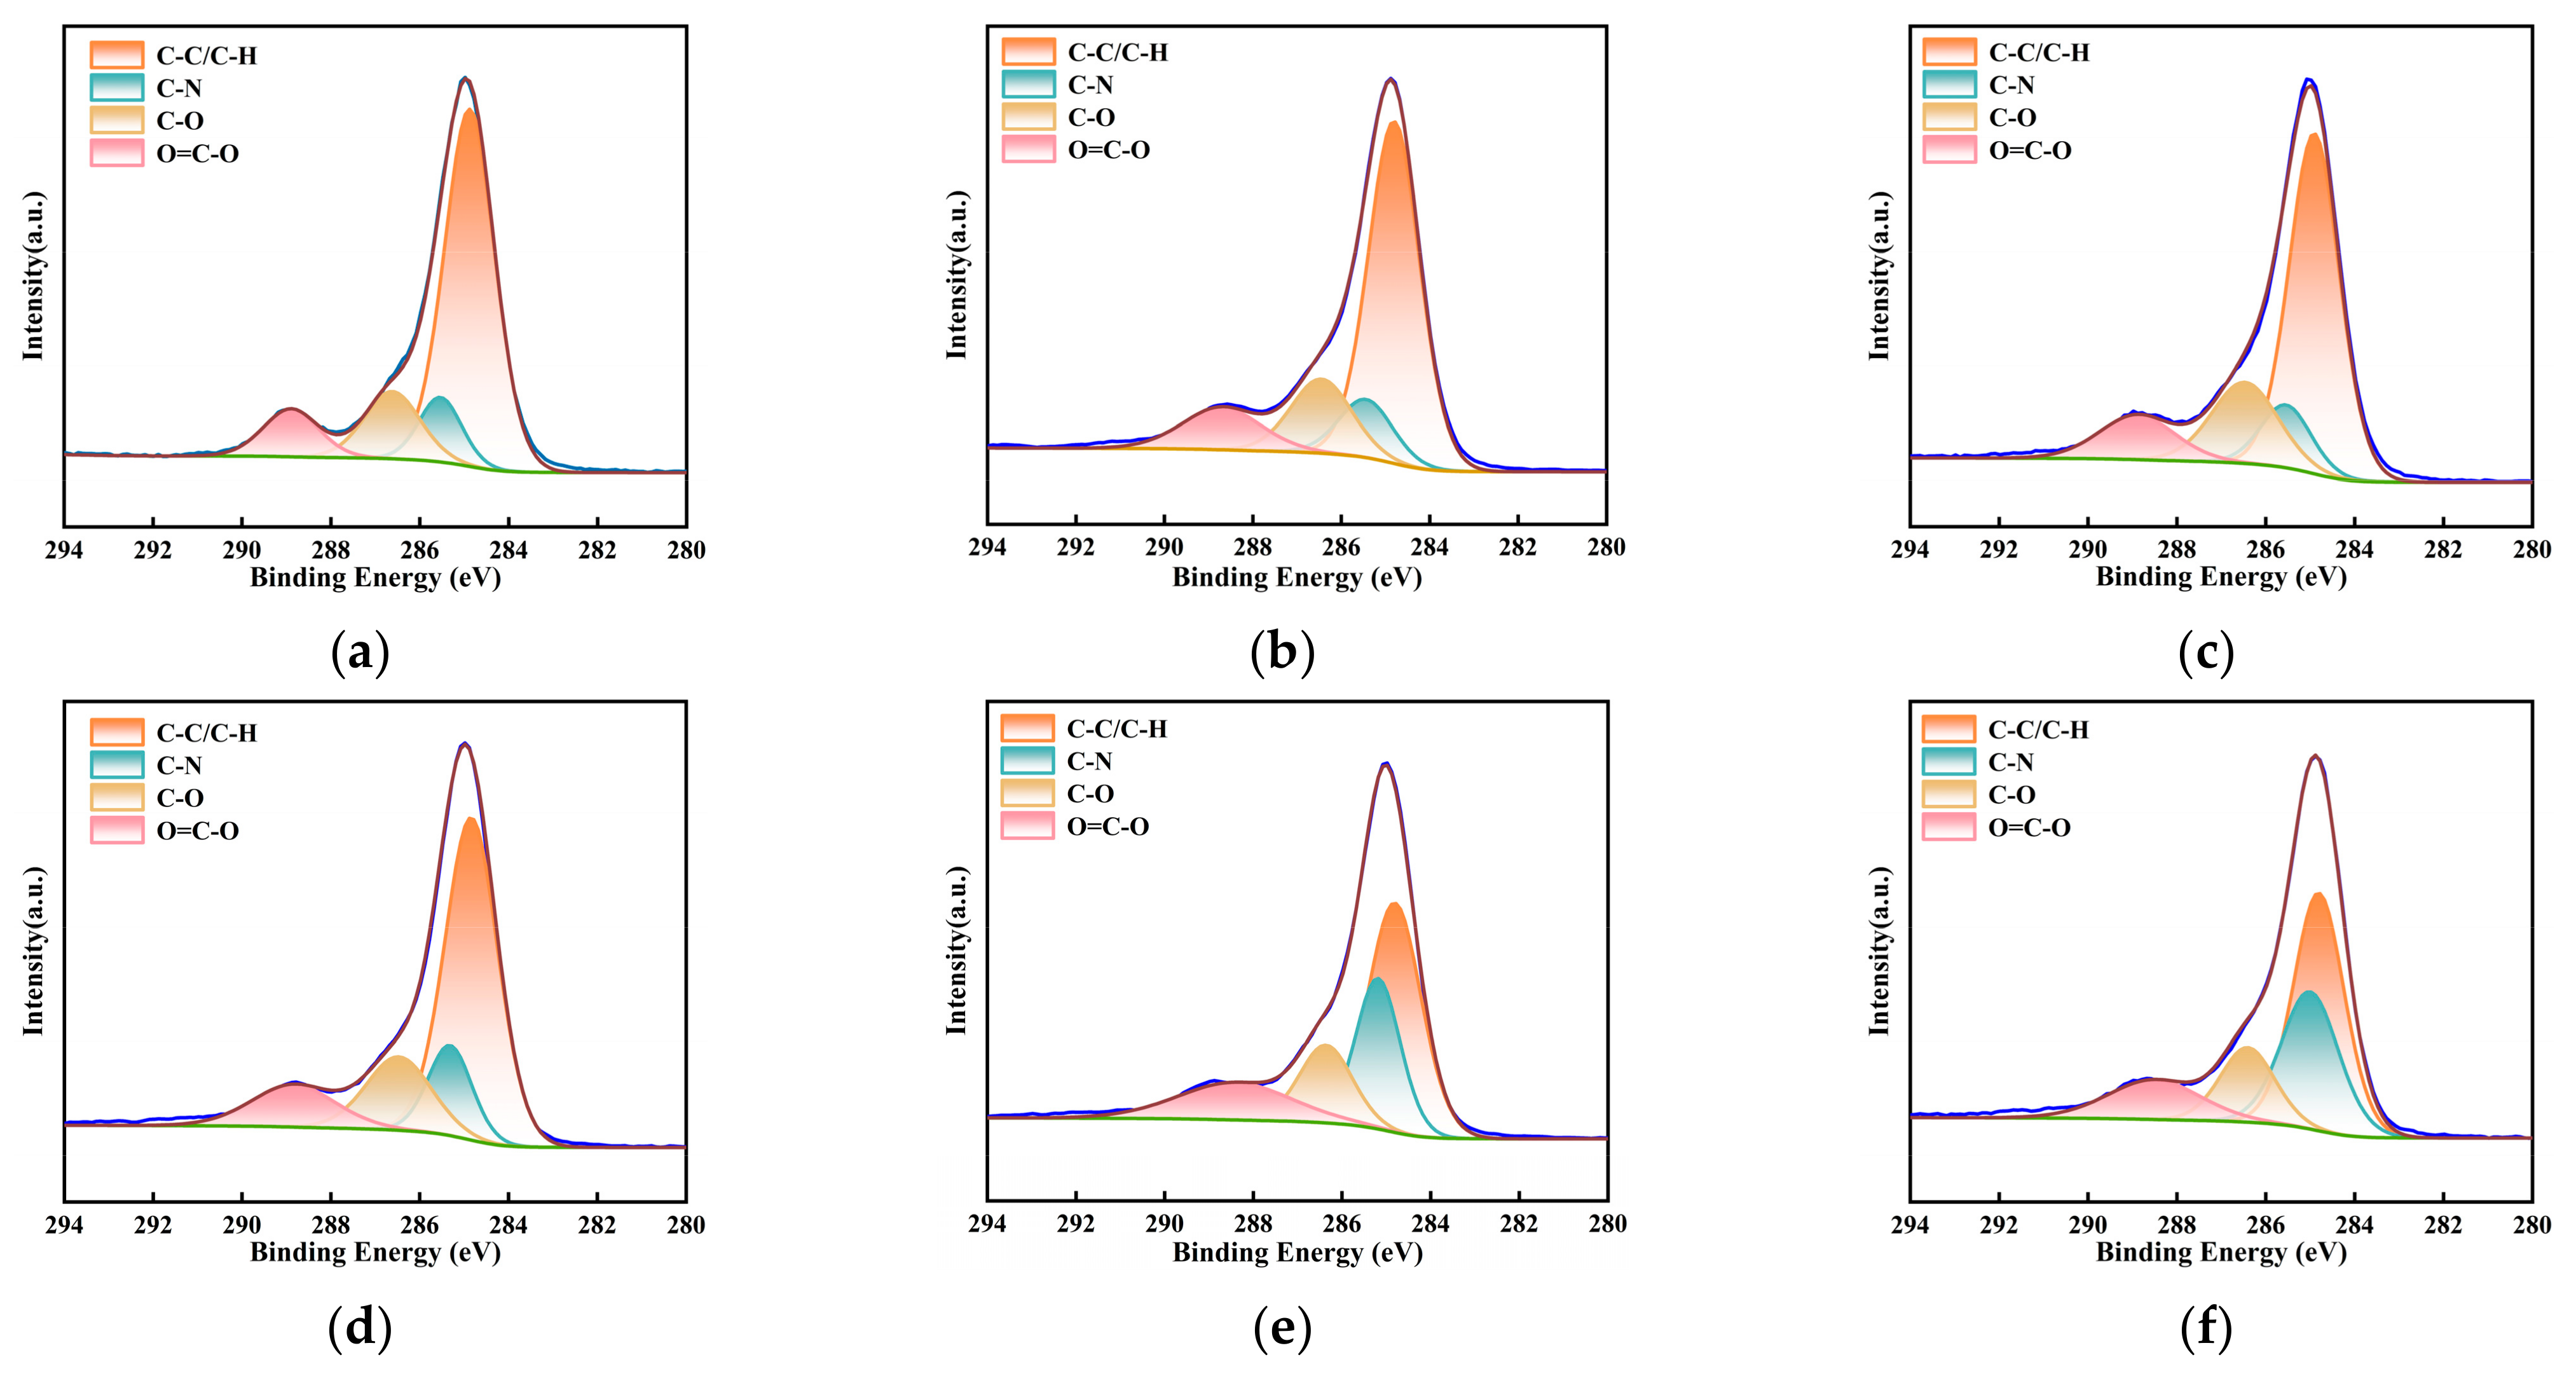
Figure 13.
Deconvolution results of N1s peaks for three types of lignite before and after adsorption: (a) Lignite-0 min; (b) Lignite-30 min; (c) Lignite-50 min; (d) Lignite-0 min/NH4+; (e) Lignite-30 min/NH4+; (f) Lignite-50 min/NH4+.
Figure 13.
Deconvolution results of N1s peaks for three types of lignite before and after adsorption: (a) Lignite-0 min; (b) Lignite-30 min; (c) Lignite-50 min; (d) Lignite-0 min/NH4+; (e) Lignite-30 min/NH4+; (f) Lignite-50 min/NH4+.

Table 1.
Proximate and ultimate analysis of the lignite.
| Proximate Analysis (%) | Ultimate Analysis (%) | |||||||
|---|---|---|---|---|---|---|---|---|
| Mad | Aad | Vad | FCd | C | H | N | S | O |
| 11.49 | 17.66 | 48.32 | 36.62 | 45.00 | 3.64 | 1.00 | 0.49 | 35.49 |
Table 2.
Specific surface area and pore volume of three lignite samples.
| Sample | Nitrogen Adsorption | Carbon Dioxide Adsorption | |||
|---|---|---|---|---|---|
| BET Surface Area (m2/g) | Pore Volume (cm3/g) | Mesopore Volume (cm3/g) | Surface Area (m2/g) | Micropore Volume (cm3/g) | |
| Lignite-0 min | 2.6624 | 0.0134 | 0.0028 | 59.469 | 0.0104 |
| Lignite-30 min | 6.1744 | 0.0241 | 0.0080 | 96.552 | 0.0186 |
| Lignite-50 min | 8.1589 | 0.0418 | 0.0131 | 103.004 | 0.0216 |
Table 3.
Fitting parameters for NH4+ adsorption isotherms of lignite at different milling times.
| Biochar | Langmuir Model | Freundlich Model | ||||
|---|---|---|---|---|---|---|
| qm | kl | R2 | Kf | 1/n | R2 | |
| Lignite-0 min | 203.795 | 0.526 | 0.958 | 66.665 | 0.469 | 0.904 |
| Lignite-30 min | 250.072 | 1.247 | 0.992 | 118.605 | 0.552 | 0.942 |
| Lignite-50 min | 860.503 | 0.264 | 0.975 | 171.375 | 0.618 | 0.954 |
Table 4.
Fitting parameters for NH4+ adsorption kinetics curves of lignite at different milling times.
Table 4.
Fitting parameters for NH4+ adsorption kinetics curves of lignite at different milling times.
| Biochar | Pseudo-First-Order Kinetic Model | Pseudo-Second-Order Kinetic Model | ||||
|---|---|---|---|---|---|---|
| k1 | qe | R2 | k2 | qe | R2 | |
| Lignite-0 min | 0.026 | 149.824 | 0.978 | 0.00021 | 165.569 | 0.986 |
| Lignite-30 min | 0.027 | 219.966 | 0.975 | 0.00023 | 243.752 | 0.985 |
| Lignite-50 min | 0.0135 | 498.545 | 0.991 | 0.00003 | 584.777 | 0.993 |
Table 5.
Content of different forms of carbon in the samples.
| Sample | Carbon Form Contents (%) | |||
|---|---|---|---|---|
| C-C/C-H | C-N | C-O | COOH | |
| Lignite-0 min | 66.23% | 9.93% | 13.91% | 9.93% |
| Lignite-0 min/NH4+ | 58.18% | 13.30% | 16.28% | 12.21% |
| Lignite-30 min | 61.73% | 11.11% | 15.43% | 11.73% |
| Lignite-30 min/NH4+ | 44.64% | 24.55% | 15.18% | 15.63% |
| Lignite-50 min | 58.82% | 11.18% | 18.24% | 11.76% |
| Lignite-50 min/NH4+ | 43.67% | 28.38% | 14.85% | 13.10% |
Table 6.
Content of different forms of nitrogen in the samples.
| Sample | Nitrogen Form Contents (%) | ||
|---|---|---|---|
| N-6 | N-5 | N-Q | |
| Lignite-0 min | 31.59% | 21.22% | 47.19% |
| Lignite-0 min/NH4+ | 32.76% | 13.36% | 53.88% |
| Lignite-30 min | 49.73% | 12.30% | 37.98% |
| Lignite-30 min/NH4+ | 26.29% | 12.66% | 61.05% |
| Lignite-50 min | 51.53% | 20.75% | 27.73% |
| Lignite-50 min/NH4+ | 21.85% | 13.55% | 64.60% |
Disclaimer/Publisher’s Note: The statements, opinions and data contained in all publications are solely those of the individual author(s) and contributor(s) and not of MDPI and/or the editor(s). MDPI and/or the editor(s) disclaim responsibility for any injury to people or property resulting from any ideas, methods, instructions or products referred to in the content. |
© 2024 by the authors. Licensee MDPI, Basel, Switzerland. This article is an open access article distributed under the terms and conditions of the Creative Commons Attribution (CC BY) license (https://creativecommons.org/licenses/by/4.0/).
Share and Cite
MDPI and ACS Style
Zhang, S.; Fan, Y.; Dong, X.; Ma, X.; Yang, M.; Xiao, W. Preparation and NH4+ Adsorption Performance of Ultrafine Lignite-Based Porous Materials. Separations 2024, 11, 40. https://doi.org/10.3390/separations11020040
AMA Style
Zhang S, Fan Y, Dong X, Ma X, Yang M, Xiao W. Preparation and NH4+ Adsorption Performance of Ultrafine Lignite-Based Porous Materials. Separations. 2024; 11(2):40. https://doi.org/10.3390/separations11020040
Chicago/Turabian StyleZhang, Siyuan, Yuping Fan, Xianshu Dong, Xiaomin Ma, Maoqing Yang, and Wei Xiao. 2024. "Preparation and NH4+ Adsorption Performance of Ultrafine Lignite-Based Porous Materials" Separations 11, no. 2: 40. https://doi.org/10.3390/separations11020040
Note that from the first issue of 2016, this journal uses article numbers instead of page numbers. See further details here.