Article

An LC-MS/MS Method for the Simultaneous Quantification of Insulin, Cortisol, Glucagon-like Peptide 1, Ghrelin, and Osteocalcin

1
Department of Nutrition, University of California Davis, Davis, CA 95616, USA
2
Department of Food Science and Technology, University of California Davis, Davis, CA 95616, USA
*
Author to whom correspondence should be addressed.
Separations 2024, 11(2), 41; https://doi.org/10.3390/separations11020041
Submission received: 11 January 2024 / Revised: 20 January 2024 / Accepted: 23 January 2024 / Published: 27 January 2024

Abstract

:
Hormones are important signaling molecules controlling physiological homeostasis. ELISA kits are commonly used to measure hormones; however, few ELISA kits are multiplex, not all species-specific ELISA kits are commercially available, and ELISA kits typically require a significant volume of biological fluids. Pigs resemble humans in digestive physiology, making them an excellent model in preclinical research of nutrition and metabolism. In this study, we developed and validated a simple liquid–liquid extraction procedure and LC-MS/MS method for the simultaneous quantification of insulin, cortisol, glucagon-like peptide-1 (GLP-1) (7-37) and (7-36), acyl and des-acyl ghrelin, and carboxylated osteocalcin in pig serum. The proposed method is specific, highly sensitive (LOQ in ng/mL and pg/mL), reasonably accurate (more than 76.2% of all quality control samples within 20% error from nominal values), and precise (intra-day CV ≤ 10% and inter-day CV ≤ 23.1%). The recoveries of all analytes and corresponding internal standards ranged from 83.7 to 116.0%. The method also requires a low serum volume of 50–100 μL, which is invaluable when sample volume is limited. These methods could be easily extended for use in other mammalian species.

1. Introduction

Hormones are signaling molecules that regulate metabolism, physiology, and behavior. They can either be peptides or steroids, and most mammals have several unique hormones that work together to control millions of intricate and overlapping metabolic pathways [1]. Subtle shifts in hormone levels are often indicative of disruptions from normal function [2]. Thus, the accurate measurement of hormones is critical for clinical diagnosis, treatment monitoring, and health research.
Currently, immunoassays are the most common analytical technique used to measure hormones, although there has been a gradual shift towards more sensitive and robust techniques involving liquid chromatography–mass spectrometry (LC-MS)-based methods. Immunoassays such as enzyme-linked immunosorbent assay (ELISA) are widely available; however, immunoassays can be time-consuming and are susceptible to matrix interference. Matrix components, such as proteins and peptides, may bind to the antibody or block the binding of the hormone to the antibody, leading to artificially high or low measurements. Improper sample handling may alter the matrix, as in the case of hemolyzed blood, rendering a sample unfit for an immunoassay [3]. The isolation procedure of peptide hormones could also affect the reliability of an ELISA-based immunoassay. Furthermore, most ELISA kits are designed for the detection of a single target; therefore, a significant amount of biological fluid is required for the analysis of multiple hormones. This limitation poses a significant challenge in studies where only small quantities of blood are available, such as research with infants and children, certain animal models, or study designs requiring repeated blood sampling during a short period of time. Finally, the scarcity of well-validated kits for less studied hormones and species presents another challenge, and the development and sourcing of antibodies and reagents for the in-house development of an immunoassay can be expensive and time-consuming.
An alternative approach to ELISAs is LC-MS/MS, which can detect several hormones in one run. MS analysis relies on the mass and structure of a molecule rather than its interaction with an antibody, which offers greater specificity than the ELISA method. In contrast to many ELISAs, MS requires a step involving extraction from biological fluids prior to analysis. The extraction of peptide hormones is notoriously challenging due to their diverse differences in molecular mass, polarity, and structure [4]. Choosing an extraction solvent and optimal pH to obtain ideal solubility and extraction efficiency for all targeted hormones can be difficult. Also, ion enhancement/suppression caused by sample matrices may occur for certain peptides. Nonetheless, a matrix-matched calibration curve could be used to compensate for the variation in ionization efficiency caused by matrix interference, allowing for accurate quantification.
While several papers have published validated protocols to extract and quantify peptide hormones [5,6,7], most methods have focused on human forms of insulinotropic peptide hormones including insulin [5], insulin-like growth factor [8], glucagon-like peptide-1 (GLP-1) [9], and glucagon [6,10,11]. None have reported the simultaneous analysis of peptide and steroid hormones. Here, we describe a multiplex method to measure several pig blood hormones in one assay: insulin (molecular weight (MW) 5777.5), GLP-1 (7-37) (MW 3355.9), GLP-1 (7-36) (MW 3297.9), acyl and des-acyl ghrelin (MWs 3316.9 and 3190.7, respectively), carboxylated osteocalcin (MW 5721.2), and cortisol (MW 362.5). We chose to develop this method in a pig model, which has been increasingly used in the preclinical research of nutrition and metabolism because of the many similarities in digestive anatomy and physiology between pigs and humans [12]; however, the methods outlined here could be easily adapted and applied to the study of humans and other mammalian species. To our knowledge, this is the first validated method to quantify this combination of hormones simultaneously and the first LC-MS method specific to pig hormones.

2. Materials and Methods

2.1. Materials

All chemicals were purchased from Sigma Aldrich (St. Louis, MO, USA). The chemicals used for extraction were ACS grade, and those used for LC-MS/MS analysis were LC-MS grade. Commercial pig serum was purchased from Thermo Fisher Scientific (Waltham, WA, USA), and the piglet serum used for the preparation of the calibration curve was pooled from serum left over from prior piglet experiments.
To prevent the non-specific binding of the peptide hormones to the sample preparation tubes, 2 mL low-protein-binding microcentrifuge tubes from Thermo Fisher Scientific (Waltham, WA, USA) and QuanRecovery LC-MS vials (Waters Corp., Milford, MA, USA) were used.
Human ghrelin and des-acyl ghrelin internal standards were purchased from R&D Systems (Minneapolis, MN, USA). Human and pig insulin, deuterated cortisol, and cortisol were purchased from Millipore Sigma (Burlington, MA, USA). Human carboxylated osteocalcin was purchased from AnaSpec (Fremont, CA, USA). Methylated pig GLP-1 (7-36) and GLP-1 (7-37) internal standards, pig GLP-1 (7-36), GLP-1 (7-37), carboxylated osteocalcin, ghrelin, and des-acyl ghrelin were custom-synthesized by GeneScript (Piscataway, NJ, USA). All peptides had purities ≥95%.

2.2. LC-MS Analysis

An Agilent AdvanceBio Peptide C18 column (120 Å, 2.1 × 150 mm, 2.7 µm) (Agilent Technologies, Santa Clara, CA, USA) was used for HPLC. Milli-Q Water containing 0.2% formic acid (solvent A) and acetonitrile (ACN) containing 0.2% formic acid (solvent B) was used for the mobile phases. The optimized gradient is shown in Table 1. To prevent hormone degradation, the autosampler was set at 8 °C. The injection volume was set to 5 μL, which maintained a good signal and resolution of peaks. Finally, 100% LC-MS methanol (MeOH) was used for needle washing.
LC-MS/MS analysis was performed using an Agilent 1260 Infinity II LC system coupled with an Agilent 6470 Triple Quad LC/MS equipped with an electrospray ionization (ESI) source. The MS was run in positive mode, and quantifiers and qualifiers were generated using Agilent MassHunter Optimizer software (version 10.1) by injecting individual standards in pure solvent. Transitions generating the highest and second highest signal abundances were selected as quantifiers and qualifiers, respectively. The suitability of these transitions was tested in pig serum spiked with standards. The quantifier to qualifier ratios between the calibrators and samples were maintained for targeted quantifications.
The gas temperature (290 °C vs. 330 °C), nebulizer pressure (20, 30, and 40 psi), sheath gas temperature (300 °C vs. 350 °C), nozzle voltage (0, 500, and 1000 V), and capillary voltage (3500 V vs. 4000 V) were tested individually to generate optimal signals for all analytes. Default gas and sheath gas flow rates were used. Dynamic MRM (multiple reaction monitoring) mode was also used.

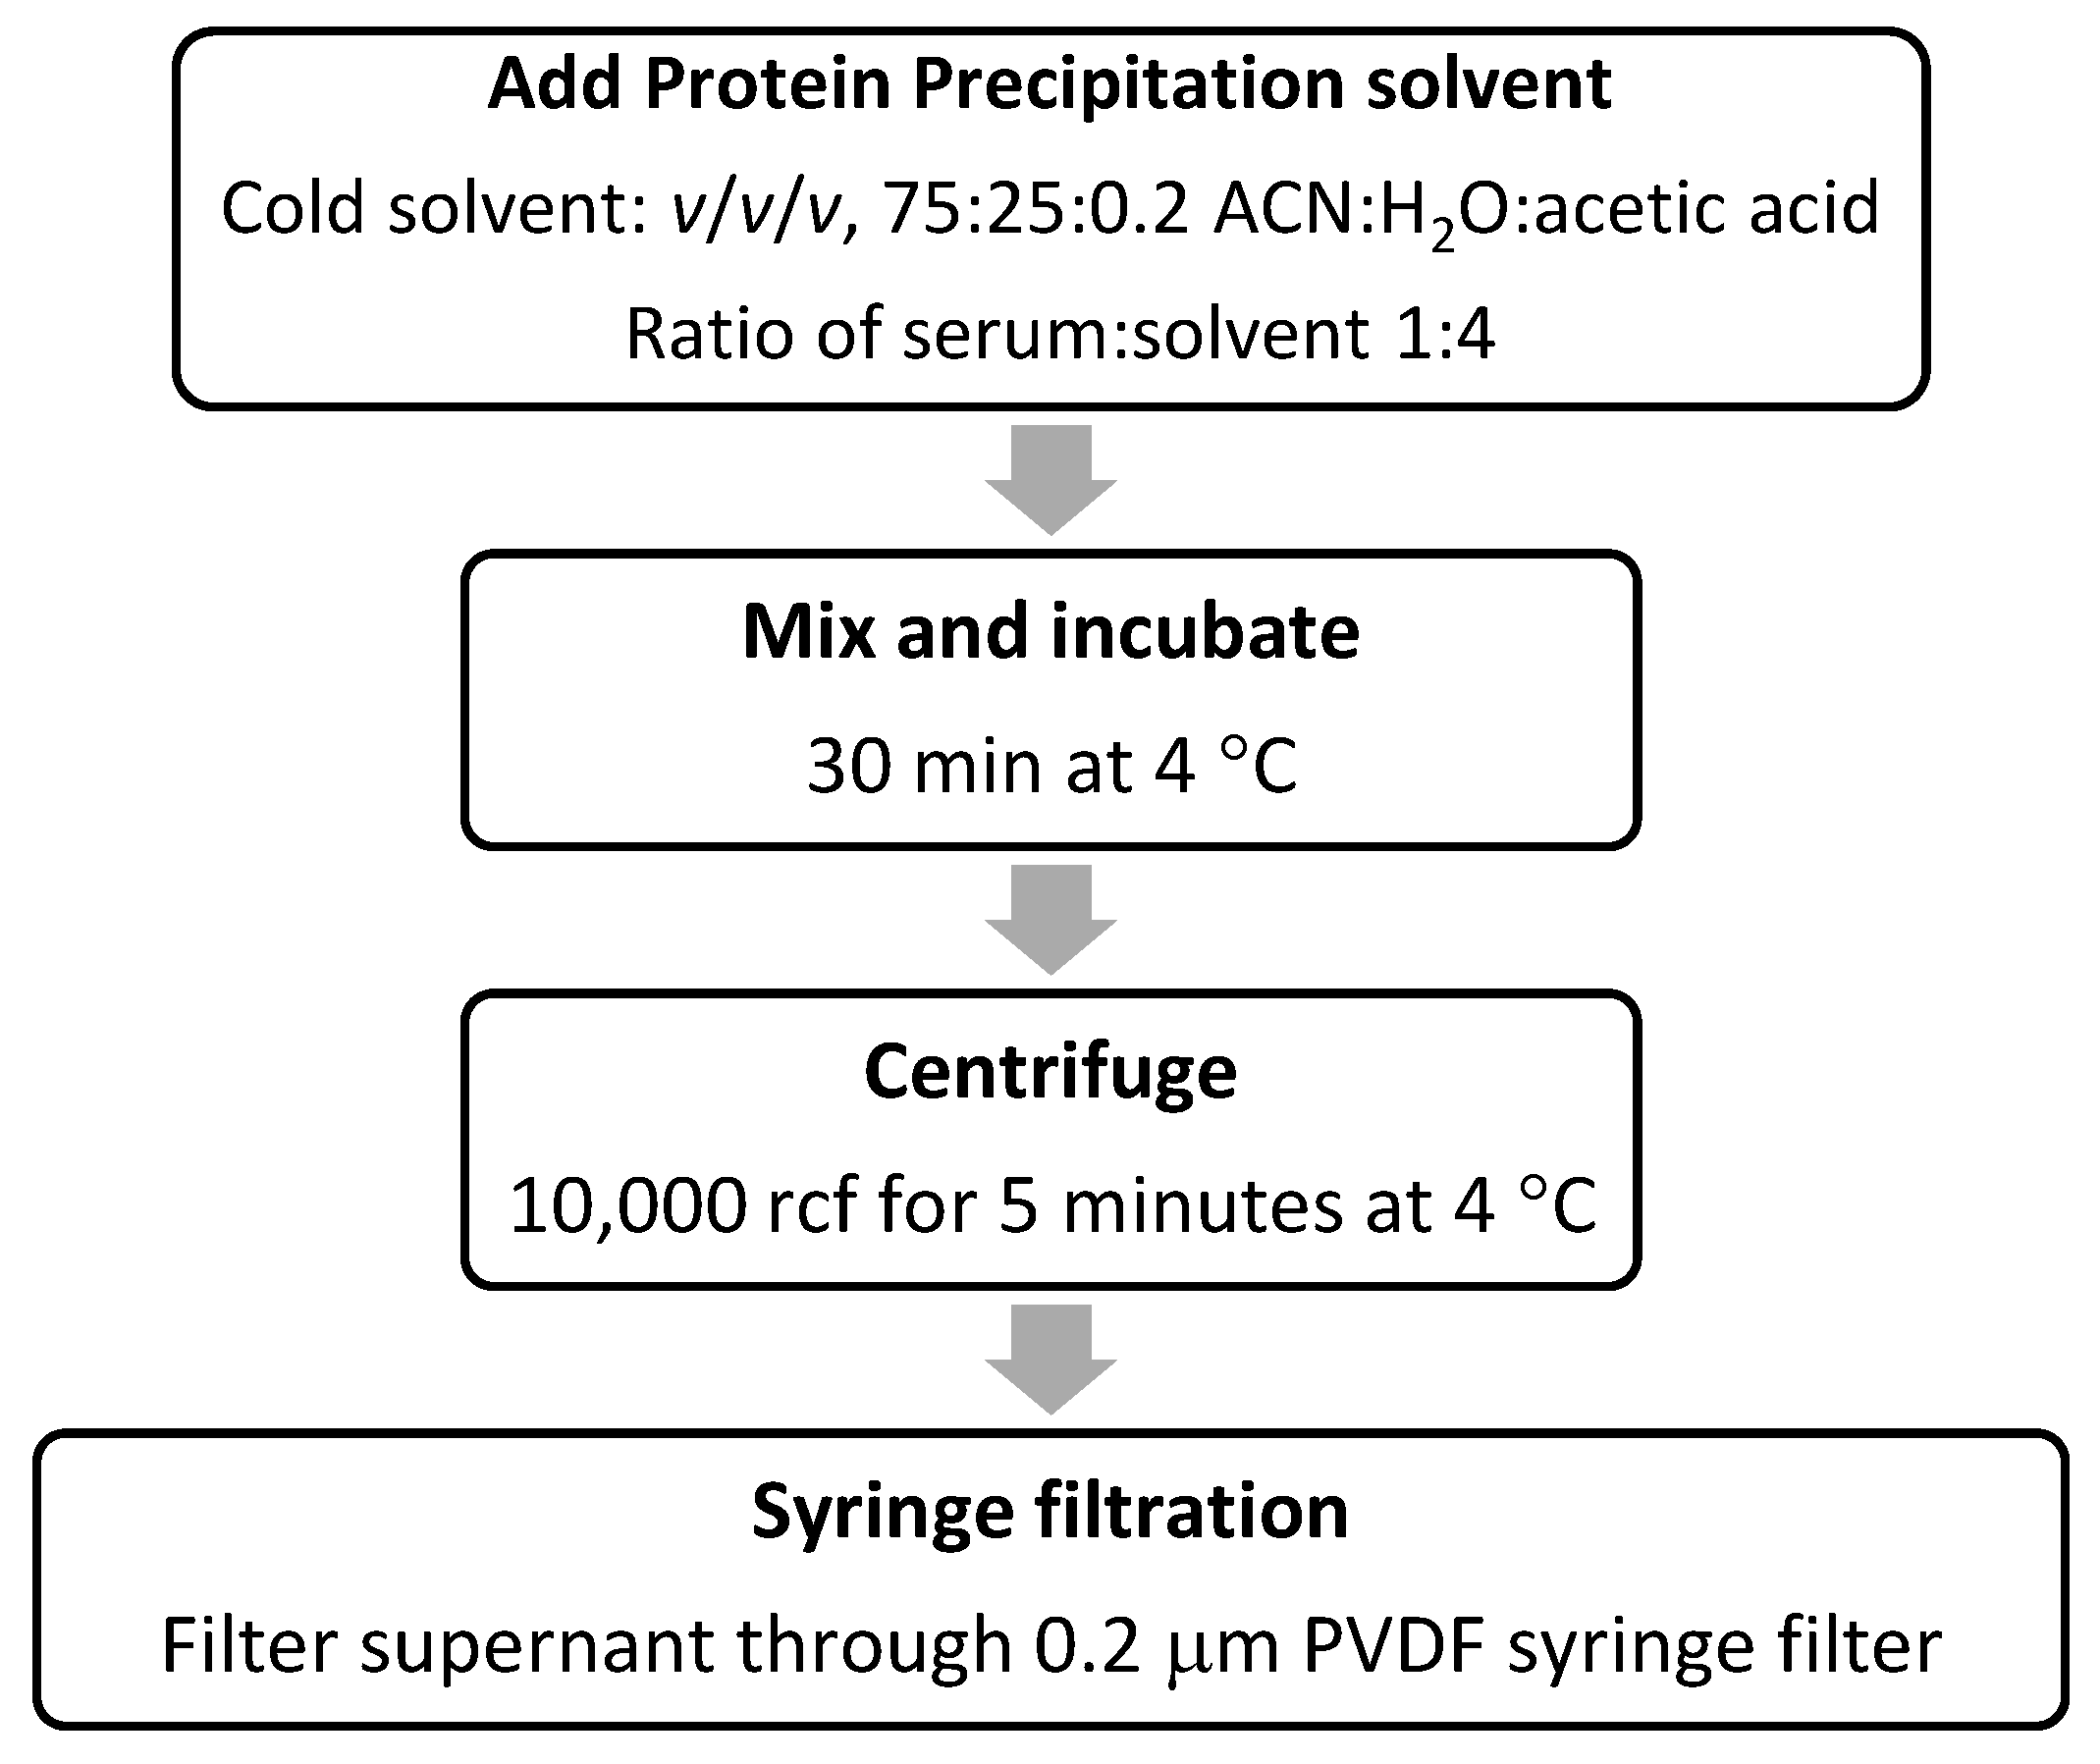
2.3. Optimization of Hormone Extraction from Serum

Figure 1 outlines the workflow for the hormone extraction method described herein. Various protein precipitation solvents and incubation times were attempted (see Figures S1–S4), and the procedure providing the most consistent and reliable result is outlined here. The procedure involves the removal of unwanted proteins through precipitation followed by filtration to remove particulate matter. The first step is to add cold solvent (consisting of 75:25:0.2 ACN:H2O:acetic acid) in a ratio of 1:4 serum:solvent. This is followed by mixing the sample and allowing it to stand for 30 min at 4 °C, and then centrifugation at 10,000× g for 5 min. The sample is then filtered through a 0.2 μm polyvinyldifluoride (PVDF) syringe filter, whereupon the samples are ready for LC-MS/MS injections using QuanRecovery LC-MS vials (note that throughout the extraction procedure, low-protein-binding microcentrifuge tubes were used to prevent the unwanted loss of hormones).

2.4. Calibration Curves

All peptides were reconstituted according to the manufacturer’s specifications, diluted to the appropriate concentration, and aliquoted before storage at −20 °C. The solvents used are described in Table S1. Each aliquot was used only once after thawing to avoid protein degradation after multiple freeze–thaw cycles. An eleven-level calibration curve was prepared with constant concentration of internal standards. The lowest calibration point did not contain any external standards. Detailed information related to the external standards in all calibration points are shown in Table 2. The concentrations of internal standards were as follows: human insulin, methyl-GLP-1 (7-37), human ghrelin, and human des-acyl ghrelin: 0.125 ng/mL; methyl-GLP-1 (7-36): 0.187 ng/mL; human osteocalcin: 6.25 ng/mL; and cortisol-d4: 12.5 ng/mL.
A combination of filtered and unfiltered piglet serum in a 40:60 ratio was used to generate the calibration curves. This combination was chosen due to its matrix similarity to the samples and release of targeted analytes in the calibration curve matrix where an R2 > 0.99 was achieved. To prepare the matrix, five 300 μL aliquots of different piglet sera were pooled and vortexed, and 600 μL was filtered using a Pierce 30 kDa centrifugal filter (Thermo Fisher Scientific, Waltham, WA, USA) at 4 °C and 14,000× g for 15 min. To 240 μL of serum filtrate, 360 μL of the unfiltered pooled pig serum was added to achieve a 40:60 ratio of filtered to unfiltered serum. The serum was then extracted as outlined in Figure 1.

2.5. Quality Control (QC) Samples

QC samples were prepared in duplicate by spiking 100 μL of the calibration curve matrix with 1 μL of standard stock solutions of pig hormones containing low (QC1: 0.0125 ng/mL of insulin, GLP-1, ghrelin and 1.25 ng/mL of osteocalcin and cortisol), medium (QC2: 0.0625 ng/mL of insulin, GLP-1, ghrelin and 6.25 ng/mL of osteocalcin and cortisol), and high (QC3: 0.625 ng/mL of insulin, GLP-1, ghrelin and 62.5 ng/mL of osteocalcin and cortisol) levels. All QC samples included internal standards at the final concentrations indicated above.

2.6. Validation of the Method

To validate the method, a total of 29 piglet serum samples collected 60 min after feeding were used. The samples were prepared as described above in Figure 1. Briefly, 7 μL of internal standard mixture was spiked into 100 μL piglet serum in low-protein-binding centrifuge tubes and vortexed. Four hundred microliters of cold extraction solvent (consisting of 75:25:0.2 ACN:H2O:acetic acid) was added. The samples were vortexed and incubated at 4 °C for 30 min followed by centrifugation at 10,000× g for 5 min at 4 °C. The supernatant layers were filtered through a 0.2 μm polyvinyldifluoride (PVDF) syringe filter and transferred to QuantRecovery LC vials. The criteria for peak determination included consistent quantifier to qualifier ratios between the samples and calibration standards, a delta retention time window of 0.5 min for each analyte, and a signal to noise ratio (S:N) of at least 5:1.

2.7. Data Analysis

Coefficient of variance (CV) was used to assess precision. The intra-day CV was calculated based on running a set of extracted samples (n = 3) on the same day and the inter-day CV was calculated based on running two sets of extracted samples on two different days (n = 3 per set). Recovery was assessed by running a set of samples spiked with analytes before extraction (A) and another set spiked after extraction (B). % R e c o v e r y = Peak Area A Peak Area B × 100 % . LOD in this study was based on a signal to noise ratio (S:N) of 3:1. LOQ was determined as the lowest spiked calibration point that could be differentiated from the non-spiked sample using a Students’ t-test with p < 0.05, %CV ≤ 20%, and S:N ≥ 5:1. All calculations were conducted using Microsoft Excel version 2312.

3. Results

3.1. Optimization of LC-MS/MS Parameters

Throughout the LC-MS/MS procedure, temperature was found to impact the quality of the chromatograms as well as the recovery of the analyte. Both insulin and ghrelin were observed to degrade when the autosampler was set at 10 °C; thus, the temperature was set to 8 °C as the hormones remained stable for at least 24 h at this temperature. The column temperature was also found to significantly affect peak shape, intensity, and noise level. Increasing the column temperature from 35 °C to 50 °C resulted in higher peak intensity for all peptide hormones (Figure S5) and improved pig insulin peak shape (Figure S5E). The column temperature did not affect peak shape or cortisol height (Figure S6). Thus, a column temperature of 50 °C was maintained in the final method.
Table 3 shows the retention times and transitions, and Table 4 shows the optimized MS parameters for each analyte. The detailed dynamic MRM method including fragmentor voltage, collision energy, and cell accelerator voltage is shown in Table S2.
While an increase in the capillary voltage from 3500 V to 4000 V reduced the peak height for pig and human osteocalcin, no other hormones were affected. An increase in nebulizer pressure from 30 psi to 40 psi resulted in a decreased signal intensity for insulin, GLP-1 (7-36), and GLP-1 (7-37). A decrease in nebulizer pressure below 30 psi had no impact on analyte chromatograms. Finally, a nozzle voltage of 500 V was concluded as ideal for all compounds since a decrease to 0 V greatly decreased the signal intensity for osteocalcin, ghrelin, and insulin. A voltage greater than 500 V had no impact on the analyte chromatograms. An increase in the gas temperature and sheath gas temperature resulted in greater signal intensity for all analytes (Figure S7). The cortisol peak shape was not impacted by the alteration of MS conditions.

3.2. Matrix Considerations

Previous methods have demonstrated the suitability of matrices for the generation of LC-MS/MS calibration curves [13,14]. An ideal matrix is analyte-free and has a composition that closely matches the sample matrix. The effectiveness of five non-serum matrices were examined. A surrogate matrix containing 20% MeOH, 80% H2O, 1% BSA, and 0.2% acetic acid had poor linearity in the calibration curve for insulin, osteocalcin, GLP-1 (7-36), and GLP-1 (7-37). The addition of 2.5% glycerin improved the suspension of analytes in the surrogate matrix without increasing the surrogate matrix effectiveness. A PBS-based surrogate matrix containing 2% BSA and 0.2% acetic acid resulted in poor calibration linearity for insulin, osteocalcin, GLP-1 (7-36), and GLP-1 (7-37). Finally, a calibration curve produced in protein precipitation solvent resulted in poor linearity for all hormones except cortisol.
The charcoal treatment of blood has been used to deplete the matrix of lipids and lipophilic compounds. Dextran-coated charcoal can deplete steroid hormones while allowing for proteins and peptides to remain in solution [15]. The use of non-treated charcoal can lead to greater reductions in peptides and other small molecules [16]. The treatment of pig serum with activated carbon successfully depleted all hormones from pig serum as evidenced by the lack of analyte signal detected in our dynamic MRM method. Although some GLP-1 (7-36) remained in the solution, the peak area was reduced 100-fold. The generation of an eight-point calibration curve in charcoal-stripped serum resulted in good calibration (R2 ≥ 0.99) for ghrelin, des-acyl ghrelin, and cortisol; however, poor calibration ranges were observed for the remaining analytes and, thus, charcoal treatment was not adopted (Figure S8).
Serum from other animal species may provide a matrix that matches the complexity of the target matrix without interference from endogenous analytes. Chicken serum represents a promising surrogate matrix for pig serum since avian GLP-1 is unique from the GLP-1 conserved across mammals [17]. However, the calibration curve generated from chicken serum resulted in poor calibration dynamic ranges for insulin, osteocalcin, GLP-1 (7-36), and GLP-1 (7-37) where an ideal R2 could not be achieved (Figure S9). Elevated background noise was observed for all peptide hormones in chicken serum compared to pig serum.
During several preliminary trials, it was observed that the filtration of pig serum with a 30 kDa centrifugal filter at 4 °C and 14,000× g for 15 min resulted in the near-complete removal of endogenous and spiked analytes. This elimination can be attributed to non-specific binding of the analytes to the polyether sulfone material of the filter and the removal of large carrier proteins for cortisol by size. Thus, we examined the effectiveness of a combination of a 40% filtered and 60% unfiltered piglet serum composite as a calibration curve matrix. Using the addition of 40% filtered serum reduced the endogenous analyte signals and the lowest calibration point was dropped to account for the trace amounts of endogenous analyte. A calibration curve produced in this matrix demonstrated excellent calibration accuracy (R2 ≥ 0.999) for cortisol, both des-acyl and acyl ghrelin (R2 ≥ 0.997), osteocalcin (R2 ≥ 0.998), and insulin (R2 ≥ 0.996). GLP-1 (7-36) and (7-37) had correlations of 0.993 and 0.998, respectively (Figure S10). It is worth noting that only 5–9 calibration points were used for the calibration curve and the lowest spiked point was always dropped to account for the low abundance of endogenous analytes in the calibration matrix. For all analytes, the calibration curve was fitted with either a linear or quadratic regression model. A suitable quantitation range (Table 5) was defined as a range with a correlation ≥ 0.993 and S:N > 5 for each calibrant. The measured extracted concentrations of targeted hormones in the adult and piglet serums were between level 2 and level 10 in the calibration range.
All analytes demonstrated an intra-day variability of ≤10.4% when analyzed in triplicate (Table 6). The inter-day precision, determined through the comparison of six samples across two days, demonstrated variability of ≤15% for both acyl and des-acyl ghrelin, GLP-1 (7-36), GLP-1 (7-37), osteocalcin, and cortisol. The inter-day precision for insulin was 23.1%. Since the inter-day precision for insulin was above the 20% threshold generally accepted for bioanalytical methods, the assay date should be factored into the analysis of insulin when running samples over multiple days [18].
The recovery of external and internal standards (Table 7) mostly fell within the range of 83.7–116.0%. The recovery of pig insulin and Me-GLP-1 (7-37) were 115% and 116%, respectively, suggesting mild matrix enhancement.
No signal was detected in the blank or chicken serum samples using the dynamic MRM method of both quantifier and qualifier transitions, suggesting the method is specific to pigs. No peaks were observed in the solvent blanks, either. The signals for internal standards were also absent from the pig serum. These results suggest the good specificity of our MRM method.
The accuracy of our method was validated across three levels of QC samples (low, medium, and high concentrations). The MS-measured concentrations were compared with the expected values and are shown in Table 8. The measured concentrations were generally close to the expected values for the three QC samples; however, we noted a decrease in accuracy at the lowest QC level (QC1), especially for GLP-1 (7-36) and ghrelin. Regardless, across replicates of all three QC levels with seven hormones, more than 76.2% of the measured concentrations had a % error within 20% of the nominal values, and more than 85.7% of the QC samples had a % error within 25% of the nominal values, which is within common LC-MS protein assay accuracy standards [18]. The challenges of achieving high accuracy for multiple peptide hormones using MS have been previously reported [19]. The lower accuracy in low-concentration QC samples (near the lower limit of quantification) compared to medium and high QC samples has also been reported in MS peptide and protein quantification [20]. However, the measured extracted piglet serum ghrelin and GLP-1 (7-36) concentrations were at least five times higher than QC level 1.
We further analyzed samples collected from 29 piglets approximately sixty minutes after feeding. The mean ± SD serum concentrations of the seven targeted hormones were insulin, 1.60 ± 0.40 ng/mL (literature value: 0.35–1.56 ng/mL), cortisol, 15.05 ± 16.02 ng/mL (literature value: 20 ± 3 ng/mL), GLP-1 (7-37), 1.76 ± 1.23 ng/mL, GLP-1 (7-36), 2.94 ± 1.23 ng/mL (GLP-1 total literature value: 1–4 ng/mL), acyl ghrelin, 1.14 ± 0.36 ng/mL (literature value: 0.1–6 ng/mL), des-acyl ghrelin, 0.0256 ± 0.0176 ng/mL, and carboxylated osteocalcin, 108.2 ± 44.0 ng/mL (literature value: 130 ± 10 ng/mL) [21,22,23,24,25,26]. The consistency observed between our measured concentrations and those observed by other researchers provides further validation of this method. The high SD from cortisol data was due to a large portion of data being below LOQ and was therefore replaced with LOQ/sqrt(2).

4. Discussion

The hormones involved in appetite regulation are of general interest in the nutrition and endocrinology fields, as they are important for mediating appetite and energy balance and have been implicated in contributing to chronic diseases such as metabolic syndrome. We chose this series of hormones (insulin, cortisol, acylated ghrelin, GLP-1s, and osteocalcin) for this assay as they are all involved in glucose homeostasis. Other hormones of interest, such as pig adiponectin and leptin, were not included in this panel, mainly due to the pig hormone standard cost and availability. Additional investigation is needed to determine whether this MRM assay panel can be expanded to include more peptide hormones.
This study presents a novel method for the simultaneous LC-MS/MS quantification of endogenous insulin, cortisol, GLP-1 (7-37), GLP-1 (7-36), acyl and des-acyl ghrelin, and carboxylated osteocalcin from pig serum. This method has a shorter sample preparation period than traditional immunoassays, has suitable precision and accuracy, and is not sensitive to matrix interference. The detection range for each hormone is relevant to the expected levels found in both adult and infant pigs in the literature [21,22,23,24,25,26], and the LOQ determined for this method for most analytes is considerably lower than the typical sensitivity of ELISA. For example, our assay allows for the quantification of GLP-1 in the picogram range, whereas commercial ELISAs have LOQs in the nanogram range. We were able to detect endogenous concentrations of all hormones in both commercial adult pig as well as piglet serum samples.
The use of internal standards and matrix-matched calibration curves limited the matrix effects in our LC-MS/MS method. Although the matrix-assisted calibration curve was prepared using a combination of filtered and unfiltered piglet serum, which was not commercially available, our proposed extraction only requires 50–100 μL serum volume and any spare volume of serum samples can be used for the preparation of the calibration curve. The scarcity of an ideal calibration curve matrix can be a challenge when sample volumes are limited. However, our proposed method still requires less sample volume for multiplex hormone analysis than ELISA kits. While ELISA kits are widely used for hormone analysis, the specificity, accuracy, and precision of the hormone measurements have not been shown to be consistent. For example, insulin and cortisol, two widely studied hormones representing peptide- and steroid-based hormones, respectively, have been shown to vary depending on the kit manufacturer [27,28,29]. Rosli et al. tested four types of insulin ELISA kits and reported intra-day and inter-day CVs up to 15.2% and 19.7%, respectively, which are similar to our results (10.1% intra-day CV and 23.1% inter-day CV, Table 6). The same authors further found variance in accuracy across four testing kits when using spiked and non-spiked certified reference material in human serum. Using four different insulin kits, they found an average percent error of approximately 0 ± 21% without spiking, 20% ± 10% with 0.62 ng/mL spiked insulin, and 7% ± 20% when spiked with 6.2 ng/mL of insulin [29]. By comparison, our assay has better accuracy (% error ≤ 7.5%) for insulin even at lower concentrations than was observed for the ELISA kits (Table 8).
Cohen et al. reported less specificity of cortisol ELISA kits due to the binding of other corticosteroids compared to using an LC method [28]. Briegel et al. reported up to 8.7% and 17.4%, respectively, for intra-day and inter-day CVs for cortisol ELISA, which is higher than the CVs for cortisol determined using the method outlined here (intra-day CV of 5.2% and inter-day CV of 11.0% in Table 6). They also found inconsistency in the accuracy between the LC-MS and ELISA methods with a correlation coefficient of 0.43 [27]. Thus, Choi proposed using MS-based cortisol measurement for better sensitivity and specificity [30].
Our proposed method could potentially be expanded to a more comprehensive multiple peptide hormone screening if coupled with shotgun proteomics using data-independent acquisition (DIA) or data-dependent acquisition (DDA). Further investigation of our proposed method may be applicable for clinical screening and peptide biomarker studies.
One advantage of this method is the measurement of multiple native and intact peptide hormones, which introduces less bias compared to methods utilizing digestion prior to MS analysis. Other advantages include a low serum volume requirement of 50–100 μL and the potential to expand for more hormones and use for different species.
A limitation of this method is that it is not optimal for all targeted hormones. Further steps such as solid phase extraction may provide better data quality such as improved peak shape and signal responses. Additionally, although the performance of our method meets the generally accepted criteria for bioanalytical quantitation, additional optimization may be needed to improve inter-day CV for insulin and further improve the accuracy of hormones at the lower limit of quantification to meet agency-specific requirements.

Supplementary Materials

The following supporting information can be downloaded at: https://www.mdpi.com/article/10.3390/separations11020041/s1, Figure S1: Relative signal intensity of hormones extracted with four types of acids; Figure S2: Relative signal intensity of spiked serum samples extracted with either no pH modifier, 0.1% NH4OH, 0.2% acetic acid, or 0.3% acetic acid; Figure S3: Recovery of spiked serum samples extracted with different pH modifiers; Figure S4: Relative signal intensity of samples incubated with acetonitrile for 0, 30, or 60 min; Figure S5: Analyte chromatograms before and after column temperature change; Figure S6: Cortisol chromatograms before and after LC-MS optimization; Figure S7: Analyte chromatograms before and after an increase in sheath gas and gas temperature; Figure S8: Charcoal-stripped serum matrix calibration curves for analytes; Figure S9: Chicken serum matrix calibration lines for analytes; Figure S10: Composite piglet serum matrix calibration lines for analytes; Table S1: Diluents used for hormone standards; Table S2: Expanded parameters for external and internal standard ions monitored using dynamic MRM.

Author Contributions

Conceptualization, Z.Z., H.S. and C.M.S.; data curation, Z.Z. and H.S.; formal analysis, Z.Z. and H.S.; funding acquisition, C.M.S.; investigation, Z.Z., H.S. and S.M.; project administration, C.M.S.; resources, P.J., D.B. and C.M.S.; supervision, Y.-P.H., D.B. and C.M.S.; writing—original draft, Z.Z. and H.S.; writing—review and editing, Y.-P.H., S.M., P.J., D.B. and C.M.S. All authors have read and agreed to the published version of the manuscript.

Funding

This research was supported by Arla Foods Ingredients Group P/S, Denmark. C.M.S. also acknowledges support from Kinsella Endowed Chair in Food, Nutrition and Health. This project was made possible in part by support from the USDA National Institute of Food and Agriculture Hatch Project 1021411.

Data Availability Statement

The data supporting the reported results are included in the manuscript. Additional datasets analyzed or generated during the study are available upon request.

Acknowledgments

We would like to acknowledge Sierra Durham in the Barile lab for her support with instrument maintenance and troubleshooting.

Conflicts of Interest

The authors declare no conflicts of interest. The funders had no role in the design of the study; in the collection, analyses, or interpretation of data; in the writing of the manuscript; or in the decision to publish the results.

References

  1. Hiller-Sturmhofel, S.; Bartke, A. The endocrine system: An overview. Alcohol Health Res. World 1998, 22, 153–164. [Google Scholar]
  2. Kulkarni, J.; Gavrilidis, E.; Worsley, R. Chapter 27—Hormones and Schizophrenia. In Handbook of Behavioral Neuroscience; Mikhail, L.W., Pletnikov, V., Eds.; Elsevier: Amsterdam, The Netherlands, 2016; Volume 23, pp. 463–480. [Google Scholar]
  3. Hughes, N.C.; Bajaj, N.; Fan, J.; Wong, E.Y. Assessing the matrix effects of hemolyzed samples in bioanalysis. Bioanalysis 2009, 1, 1057–1066. [Google Scholar] [CrossRef] [PubMed]
  4. Foreman, R.E.; George, A.L.; Reimann, F.; Gribble, F.M.; Kay, R.G. Peptidomics: A Review of Clinical Applications and Methodologies. J. Proteome Res. 2021, 20, 3782–3797. [Google Scholar] [CrossRef]
  5. Chen, Z.; Caulfield, M.P.; McPhaul, M.J.; E Reitz, R.; Taylor, S.W.; Clarke, N.J. Quantitative insulin analysis using liquid chromatography-tandem mass spectrometry in a high-throughput clinical laboratory. Clin. Chem. 2013, 59, 1349–1356. [Google Scholar] [CrossRef] [PubMed]
  6. Lapko, V.N.; Miller, P.S.; Brown, G.P.; Islam, R.; Peters, S.K.; Sukovaty, R.L.; Ruhn, P.F.; Kafonek, C.J. Sensitive glucagon quantification by immunochemical and LC–MS/MS methods. Bioanalysis 2013, 5, 2957–2972. [Google Scholar] [CrossRef] [PubMed]
  7. Rauh, M.; Gröschl, M.; Rascher, W. Simultaneous quantification of ghrelin and desacyl-ghrelin by liquid chromatography-tandem mass spectrometry in plasma, serum, and cell supernatants. Clin. Chem. 2007, 53, 902–910. [Google Scholar] [CrossRef] [PubMed]
  8. Barton, C.; Kay, R.G.; Gentzer, W.; Vitzthum, F.; Pleasance, S. Development of High-Throughput Chemical Extraction Techniques and Quantitative HPLC-MS/MS (SRM) Assays for Clinically Relevant Plasma Proteins. J. Proteome Res. 2009, 9, 333–340. [Google Scholar] [CrossRef] [PubMed]
  9. Wolf, R.; Hoffmann, T.; Rosche, F.; Demuth, H.-U. Simultaneous determination of incretin hormones and their truncated forms from human plasma by immunoprecipitation and liquid chromatography–mass spectrometry. J. Chromatogr. B 2004, 803, 91–99. [Google Scholar] [CrossRef]
  10. Delinsky, D.C.; Hill, K.T.; White, C.A.; Bartlett, M.G. Quantitation of the large polypeptide glucagon by protein precipitation and LC/MS. Biomed. Chromatogr. 2004, 18, 700–705. [Google Scholar] [CrossRef]
  11. Miyachi, A.; Kobayashi, M.; Mieno, E.; Goto, M.; Furusawa, K.; Inagaki, T.; Kitamura, T. Accurate analytical method for human plasma glucagon levels using liquid chromatography-high resolution mass spectrometry: Comparison with commercially available immunoassays. Anal. Bioanal. Chem. 2017, 409, 5911–5918. [Google Scholar] [CrossRef]
  12. Ziegler, A.; Gonzalez, L.; Blikslager, A. Large Animal Models: The Key to Translational Discovery in Digestive Disease Research. Cell. Mol. Gastroenterol. Hepatol. 2016, 2, 716–724. [Google Scholar] [CrossRef]
  13. Howard, J.W. The Development of Mass Spectrometry-Based Methodologies for the High Throughput Quantitation of Peptides in Biological Matrices, in Chemistry. Ph.D. Thesis, Loughborough University, Loughborough, UK, 2018. Epinal Way; LE11 3TU. [Google Scholar]
  14. Houghton, R.; Pita, C.H.; Ward, I.; Macarthur, R. Generic approach to validation of small-molecule LC–MS/MS biomarker assays. Bioanalysis 2009, 1, 1365–1374. [Google Scholar] [CrossRef]
  15. Sikora, M.J.; Johnson, M.D.; Lee, A.V.; Oesterreich, S. Endocrine Response Phenotypes Are Altered by Charcoal-Stripped Serum Variability. Endocrinology 2016, 157, 3760–3766. [Google Scholar] [CrossRef]
  16. Dixit, V.; Chang, T.M. In vitro and clinical studies of the removal of cortisol, thyroxine, insulin, and thyroid-stimulating hormone by coated charcoal haemoperfusion. Life Support Syst. 1984, 2, 238–244. [Google Scholar] [PubMed]
  17. Moon, M.J.; Park, S.; Kim, D.-K.; Cho, E.B.; Hwang, J.-I.; Vaudry, H.; Seong, J.Y. Structural and molecular conservation of glucagon-like Peptide-1 and its receptor confers selective ligand-receptor interaction. Front. Endocrinol. 2012, 3, 141. [Google Scholar] [CrossRef]
  18. Jenkins, R.; Duggan, J.X.; Aubry, A.-F.; Zeng, J.; Lee, J.W.; Cojocaru, L.; Dufield, D.; Garofolo, F.; Kaur, S.; Schultz, G.A.; et al. Recommendations for validation of LC-MS/MS bioanalytical methods for protein biotherapeutics. AAPS J. 2014, 17, 1–16. [Google Scholar] [CrossRef]
  19. Olsen, C.; Wang, C.; Aizenshtadt, A.; Abadpour, S.; Lundanes, E.; Skottvoll, F.S.; Golovin, A.; Busek, M.; Krauss, S.; Scholz, H.; et al. Simultaneous LC-MS determination of glucose regulatory peptides secreted by stem cell-derived islet organoids. Electrophoresis 2023, 44, 1682–1697. [Google Scholar] [CrossRef]
  20. Nouri-Nigjeh, E.; Zhang, M.; Ji, T.; Yu, H.; An, B.; Duan, X.; Balthasar, J.; Johnson, R.W.; Qu, J. Effects of calibration approaches on the accuracy for LC-MS targeted quantification of therapeutic protein. Anal. Chem. 2014, 86, 3575–3584. [Google Scholar] [CrossRef] [PubMed]
  21. Carter, S.D.; Cromwell, G.L.; Combs, T.R.; Colombo, G.; Fanti, P. The determination of serum concentrations of osteocalcin in growing pigs and its relationship to end-measures of bone mineralization. J. Anim. Sci. 1996, 74, 2719–2729. [Google Scholar] [CrossRef] [PubMed]
  22. Tian, M.; Heng, J.; Song, H.; Shi, K.; Lin, X.; Chen, F.; Guan, W.; Zhang, S. Dietary Branched-Chain Amino Acids Regulate Food Intake Partly through Intestinal and Hypothalamic Amino Acid Receptors in Piglets. J. Agric. Food Chem. 2019, 67, 6809–6818. [Google Scholar] [CrossRef]
  23. Park, J.-H.; Bakheet, N.; Na, H.K.; Jeon, J.Y.; Yoon, S.H.; Kim, K.Y.; Zhe, W.; Kim, D.H.; Jung, H.-Y.; Song, H.-Y. A Novel Full Sense Device to Treat Obesity in a Porcine Model: Preliminary Results. Obes. Surg. 2019, 29, 1521–1527. [Google Scholar] [CrossRef] [PubMed]
  24. Stull, C.L.; Kachulis, C.J.; Farley, J.L.; Koenig, G.J. The effect of age and teat order on alpha1-acid glycoprotein, neutrophil-to-lymphocyte ratio, cortisol, and average daily gain in commercial growing pigs. J. Anim. Sci. 1999, 77, 70–74. [Google Scholar] [CrossRef]
  25. El-Kadi, S.W.; Suryawan, A.; Gazzaneo, M.C.; Srivastava, N.; Orellana, R.A.; Nguyen, H.V.; Lobley, G.E.; Davis, T.A. Anabolic signaling and protein deposition are enhanced by intermittent compared with continuous feeding in skeletal muscle of neonates. Am. J. Physiol. Metab. 2012, 302, E674–E686. [Google Scholar] [CrossRef]
  26. Yan, X.; Zhang, H.; Lin, A.; Su, Y. Antagonization of Ghrelin Suppresses Muscle Protein Deposition by Altering Gut Microbiota and Serum Amino Acid Composition in a Pig Model. Biology 2022, 11, 840. [Google Scholar] [CrossRef]
  27. Briegel, J.; Sprung, C.L.; Annane, D.; Singer, M.; Keh, D.; Moreno, R.; Möhnle, P.; Weiss, Y.; Avidan, A.; Michael Vogeser for the CORTICUS Study Group; et al. Multicenter comparison of cortisol as measured by different methods in samples of patients with septic shock. Intensiv. Care Med. 2009, 35, 2151–2156. [Google Scholar] [CrossRef]
  28. Cohen, J.; Ward, G.; Prins, J.; Jones, M.; Venkatesh, B. Variability of cortisol assays can confound the diagnosis of adrenal insufficiency in the critically ill population. Intensiv. Care Med. 2006, 32, 1901–1905. [Google Scholar] [CrossRef]
  29. Rosli, N.; Kwon, H.; Lim, J.; Yoon, Y.A.; Jeong, J. Measurement comparability of insulin assays using conventional immunoassay kits. J. Clin. Lab. Anal. 2022, 36, e24521. [Google Scholar] [CrossRef] [PubMed]
  30. Choi, M.H. Clinical and Technical Aspects in Free Cortisol Measurement. Endocrinol. Metab. 2022, 37, 599–607. [Google Scholar] [CrossRef] [PubMed]
Figure 1. Workflow of hormone extraction from serum.
Separations 11 00041 g001
Table 1. LC gradient method.
Time
(min)
Flow Rate (mL/min)%A
(2% Formic Acid)
%B
(ACN + 2% Formic Acid)
0.000.20099.01.0
5.000.20095.05.0
10.000.20079.021.0
15.000.20075.524.5
18.000.20046.553.5
21.000.20026.074.0
25.000.3501.099.0
26.000.3500.0100.0
28.000.3500.0100.0
35.000.20099.01.0
37.000.20099.01.0
Table 2. Concentration (ng/mL) of external standards in calibration samples.
Level
109876543210
Pig Insulin0.62500.31250.15630.07810.03910.01950.00980.00490.00240.00120
GLP-1 (7-36)0.62500.31250.15630.07810.03910.01950.00980.00490.00240.00120
GLP-1 (7-37)0.62500.31250.15630.07810.03910.01950.00980.00490.00240.00120
Pig Ghrelin0.62500.31250.15630.07810.03910.01950.00980.00490.00240.00120
Pig Des-Acyl Ghrelin0.62500.31250.15630.07810.03910.01950.00980.00490.00240.00120
Pig CarboxylatedOsteocalcin62.500031.250015.63007.81303.90601.95300.97660.48830.24410.12210
Cortisol62.500031.250015.63007.81303.90601.95300.97660.48830.24410.12210
Table 3. Retention time and transitions for quantifiers and qualifiers with charge states.
QuantifiersQualifiers
External StandardsInternal StandardsExternal StandardsInternal Standards
TransitionRetention Time (min)TransitionRetention Time (min)TransitionRetention Time (min)TransitionRetention Time (min)
Cortisol [M+H]+363.2 → 121.020.1367.2 → 121.020.1363.2 → 327.220.1367.2 → 331.220.1
Des-acyl Ghrelin
[M+5H]5+
639.1 → 84.010.1541.5 → 70.010.6639.1 → 129.110.1541.5 → 620.910.6
Ghrelin
[M+6H]6+
553.9 → 84.013.5562.5 → 70.013.9553.9 → 129.113.5562.5 → 689.013.9
Carboxylated osteocalcin
[M+5H]5+
1145.4 → 1115.321.21186.9 → 1186.919.91145.4 → 1118.921.2--*19.9
GLP-1 (7-36)
[M+5H]5+
660.6 → 660.619.7663.5 → 72.119.7--*----*19.7
GLP-1 (7-37)
[M+5H]5+
672.1 → 84.120.1674.9 → 84.120.1672.1 → 136.120.1674.9 →110.020.1
Insulin
[M+5H]5+
1155.7 → 86.020.21161.7 → 1158.519.71155.7 → 1152.420.21161.7 → 86.119.7
* Qualifier transition peaks cannot be seen in spiked serum samples.
Table 4. Final MS source conditions.
ParameterSetting
Gas Temp330 °C
Gas Flow10 L/min
Nebulizer30 psi
Sheath Gas Temp350 °C
Sheath Gas Flow11 L/min
Capillary3500 V
Nozzle Voltage500 V
Chamber current0.19 uA
Table 5. Quantitation range of analytes.
AnalyteQuantitation Range
Pig insulin4.9–625 pg/mL
Pig des-acyl ghrelin1.2–625 pg/mL
Pig ghrelin1.2–625 pg/mL
Pig carboxylated osteocalcin0.98–62.5 ng/mL
GLP-1 (7-36)2.4–625 pg/mL
GLP-1 (7-37)2.4–625 pg/mL
Cortisol0.12–62.5 ng/mL
Table 6. Inter-day and intra-day precision expressed as %CV.
AnalyteIntra-Day (n = 3)Inter-Day (n = 6)
Pig insulin10.123.1
Pig des-acyl ghrelin1.015.0
Pig acyl ghrelin7.27.2
Pig carboxylated osteocalcin5.013.0
GLP-1 (7-37)10.49.1
GLP-1 (7-36)4.68.3
Cortisol5.211.0
Table 7. Recovery of internal and external standards (mean ± SD).
External Analyte%Recovery (n = 3)Internal Analyte%Recovery (n = 3)
Pig insulin115.3 ± 12.4Human insulin105 ± 10.8
Pig des-acyl ghrelin83.7 ± 4.5Human des-acyl ghrelin88.9 ± 2.4
Pig acyl ghrelin93 ± 3.5Human acyl ghrelin97.2 ± 3.3
Pig carboxylated osteocalcin107.1 ± 8.9Human y-carboxy osteocalcin94.5 ± 14.0
GLP-1 (7-37)97.0 ± 12.1Me-GLP-1 (7-37)99.6 ± 5.7
GLP-1 (7-36)88.3 ± 7.0Me-GLP-1 (7-36)116.0 ± 17.7
Cortisol87.9 ± 9.2D4-Cortisol90.2 ± 1.7
Table 8. Expected and measured (mean ± SD) concentrations (ng/mL) as well as accuracy of the measurement of pig hormones in QC samples.
QC1QC2QC3
ExpectedMeasuredError (%)ExpectedMeasuredError (%)ExpectedMeasuredError (%)
Insulin0.01250.0131 ± 0.00404.80.06250.0582 ± 0.00646.90.6250.578 ± 0.0287.5
GLP-1 (7-36)0.01250.0177 ± 0.000741.60.06250.0701 ± 0.006412.20.6250.670 ± 0.0387.2
GLP-1 (7-37)0.01250.0135 ± 0.00238.00.06250.0667 ± 0.00216.70.6250.459 ± 0.01826.6
Des-acyl Ghrelin0.01250.0103 ± 0.000117.60.06250.0525 ± 0.000716.00.6250.720 ± 0.01315.2
Ghrelin0.01250.0163 ± 0.000230.40.06250.0645 ± 0.00353.20.6250.729 ± 0.00416.6
Osteocalcin1.251.56 ± 0.1724.86.256.49 ± 0.233.862.558.4 ± 0.56.6
Cortisol1.251.52 ± 0.0121.66.256.46 ± 0.033.462.560.9 ± 0.52.6
Disclaimer/Publisher’s Note: The statements, opinions and data contained in all publications are solely those of the individual author(s) and contributor(s) and not of MDPI and/or the editor(s). MDPI and/or the editor(s) disclaim responsibility for any injury to people or property resulting from any ideas, methods, instructions or products referred to in the content.

