Article

An Evaluation of the Relationship between Membrane Properties and the Fouling Mechanism Based on a Blocking Filtration Model

1
Department of Environmental Technology, Meijo University, 1-501 Shiogamaguchi, Tempaku-ku, Nagoya 468-8502, Japan
2
Department of Chemical Engineering, Nagoya University, Furo-cho, Chikusa-ku, Nagoya 464-8603, Japan
*
Author to whom correspondence should be addressed.
Separations 2024, 11(3), 70; https://doi.org/10.3390/separations11030070
Submission received: 31 January 2024 / Revised: 22 February 2024 / Accepted: 23 February 2024 / Published: 24 February 2024

Abstract

:
Microfiltration plays an increasingly important role in various fields. Consequently, elucidating the mechanism of membrane fouling has emerged as a pivotal issue that needs to be resolved. In this study, a blocking filtration model was employed to evaluate the effects of membrane properties on the fouling mechanism during the microfiltration of representative polysaccharides, namely sodium alginate, pectin, and xanthan gum. Microfiltration membranes composed of hydrophilic and hydrophobic PVDF, mixed cellulose ester, as well as hydrophilic and hydrophobic PTFE were used as filter media. The flux decline behavior was significantly affected by the membrane properties, with hydrophilic membranes exhibiting a slower decrease in filtration rate. The model analysis revealed a correlation between the blocking characteristic values and the membrane properties. Although the blocking index n showed membrane material dependence, the values of this parameter remained consistent across various filtration conditions, including the wettability of the membrane surface, solute concentration, and pressure (pectin: n = 1.86, 1.85, 1.50, and 1.50 for hydrophilic PVDF, hydrophobic PVDF, hydrophilic PTFE, and hydrophobic PTFE, respectively). The resistance coefficient k was influenced by the characteristics of the membrane surface; the k values of the hydrophobic membranes were higher than those of the hydrophilic ones (pectin: k = 0.00084, 0.00725, 0.00714, and 0.0384 s1−n/cm2−n for hydrophilic PVDF, hydrophobic PVDF, hydrophilic PTFE, and hydrophobic PTFE, respectively). The model calculations, based on the values of n and k, demonstrated a relatively good agreement with the experimental data.

1. Introduction

Pure and safe water is the basic need of every individual, and thus, several water purification/treatment techniques have been established to date [1]. In recent years, microfiltration has become increasingly important across various fields, including wastewater treatment, drinking water production, as well as the food and pharmaceutical industries. While microfiltration delivers the expected filtrate quality, the dramatic increase in filtration resistance caused by membrane fouling remains a challenge that needs to be addressed. Membrane fouling arises from the adhesion and deposition of solutes and particles onto the membrane surface, leading to pore blockage and cake formation [2]. Consequently, it is of utmost importance to elucidate the mechanism behind membrane fouling and develop a method for estimating the increase in filtration resistance that occurs during filtration.
The conventional blocking filtration law consists of four models, including three types of pore-blocking models and a cake filtration model [3,4,5]. These models have been employed to explain the increase in filtration resistance observed during membrane filtration [2]. However, the actual membrane fouling mechanism is complicated, and there are cases where these models fail to fully describe the phenomenon. Therefore, several membrane fouling models that integrate multiple models from the blocking filtration law have been proposed [6,7,8,9,10,11]. Alternatively, attempts have been made to apply the Kozeny–Carman equation to analyze the behavior of membrane pore blocking [10,12]. In particular, the initial stage of filtration exhibits intricate membrane-blocking behavior, and numerous researchers have reported that the influences of membrane morphology, structure, and surface properties are significant based on the abovementioned model analysis [13,14,15,16,17,18,19,20,21,22,23,24]. Ho and Zydney [13] experimentally evaluated the microfiltration of bovine serum albumin solutions using different track-etched, isotropic, and asymmetric membranes. Their results indicated that the membranes with interconnected pores fouled more slowly because the filtrate could flow around the blocked pores through the interconnected pore structure. Tanaka et al. [16] compared the performance of an asymmetric depth filter with that of a screen filter in dead-end microfiltration of a polystyrene latex suspension and indicated that the filtration performance of the depth filter surpassed that of the screen filter. Hwang and Liao [21] proposed a membrane blocking chart correlating the blocking index to both the filtration rate and particle accumulation rejected by a membrane. This proposed chart was developed based on a serial resistance model, which was a combination of the conventional blocking filtration mechanisms. Using a simplified blocking filtration model to establish the relationship between membrane properties and the fouling mechanism is considered valuable for achieving stable microfiltration.
Membrane fouling in membrane bioreactors (MBRs) has been actively studied [25,26], and numerous reports have been published on the role of biopolymers [27,28]. Methods such as ultrafiltration membrane fractionation and liquid chromatography coupled with organic carbon detection techniques have identified polysaccharides as the predominant components of high-molecular-weight biopolymers [28]. Polysaccharide derived from microorganisms or plants have been identified as major contributors to membrane fouling and are commonly employed as model foulants [29,30,31,32,33,34,35,36,37,38,39]. Sodium alginate [30], dextran [34], xanthan gum [37], and pectin [38] have been extensively used as polysaccharide models, leading to an increased understanding of membrane fouling. Furthermore, the flux decline behavior of polysaccharide models has been investigated, with various studies examining the effects of membrane types and filtration conditions, changes in behavior resulting from different types of polysaccharide models, modeling of fouling phenomena, and visualization of fouled membranes via electron microscopy [29,30,31,32,33,34,35,36,37,38,39]. However, to the best of our knowledge, no studies have systematically investigated membrane fouling characteristics using various polysaccharides and membranes. Moreover, no analysis using a blocking filtration model has been conducted to establish the relationship between the blocking characteristic values and membrane properties.
In this study, we investigated the differences in membrane fouling behaviors using three types of polysaccharides and five types of membranes with distinct surface properties and materials. The analysis employed a blocking filtration model based on Kozeny–Carman equation, and the relationships between the blocking index n, resistance coefficient k, and membrane properties were determined. Notably, the blocking index n exhibited a unique value for each specific combination of membrane and polysaccharide, regardless of the filtration conditions. The resistance coefficient k was influenced by the concentration of polysaccharides and the characteristics of the membrane surface. Furthermore, it was confirmed that model calculations using the values of n and k accurately estimated filtration behavior. The findings from the model analysis are valuable for elucidating the membrane fouling mechanism, and we believe they will significantly contribute to establishing efficient membrane filtration operation methods and fabricating antifouling membranes.

2. Materials and Methods

2.1. Materials and Prepration of Solutions

Sodium alginate (SA, Nacalai Tesque Inc., Kyoto, Japan) with a molecular weight of 100–150 kDa, pectin (PC, from Citrus, Fujifilm Wako Pure Chemical Corp., Osaka, Japan) with a molecular weight of 140–200 kDa, and xanthan gum (XG, Xanthomonas campestris, Merck Sigma-Aldrich Co. LLC, St. Louis, USA) with a molecular weight of ~2000 kDa were used as the model polysaccharides. Polysaccharide solutions were prepared at the desired concentrations by dissolving a specified amount of the powder in ultrapure water, produced using an ultrapure water system equipped with both Elix-Essential and Milli-Q Advantage (Merck Millipore Corp., Burlington, MA, USA). The SA and PC solutions were then stirred at 200 rpm for 30 min. For XG, calcium chloride (1 mM) was added to the solutions after sufficient dissolution to prevent the formation of large gels [37], and the solutions were stirred at 400 rpm for 2 h. Five types of commercial flat-sheet membranes were employed in the experiments: hydrophilic polyvinylidene difluoride (Hilic-PVDF, Durapore VVLP, contact angle (pure water): 64.8°, Merck Millipore Corp., Burlington, MA, USA) membrane, hydrophobic polyvinylidene difluoride (Hbic-PVDF, Durapore VVHP, contact angle (pure water): 99.3°, Merck Millipore Corp., Burlington, MA, USA) membrane, hydrophilic polytetrafluoroethylene (Hilic-PTFE, H010A, contact angle (pure water): 29.1°, Advantec Toyo Co., Ltd., Tokyo, Japan) membrane, hydrophobic polytetrafluoroethylene (Hbic-PTFE, T010A, contact angle (pure water): 99.7°, Advantec Toyo Co., Ltd., Tokyo, Japan) membrane, and mixed cellulose ester (MCE, A010A, contact angle (pure water): 78.7°, Advantec Toyo Co., Ltd., Tokyo, Japan) membrane. The nominal pore size dm of the membranes was 0.1 μm. The hydrophilic membranes (Hilic-PVDF, Hilic-PTFE, and MCE) were immersed in ultrapure water for 1 h, while the hydrophobic membranes (Hbic-PVDF and Hbic-PTFE) were immersed in ethanol for 1 h and subjected to microfiltration tests.

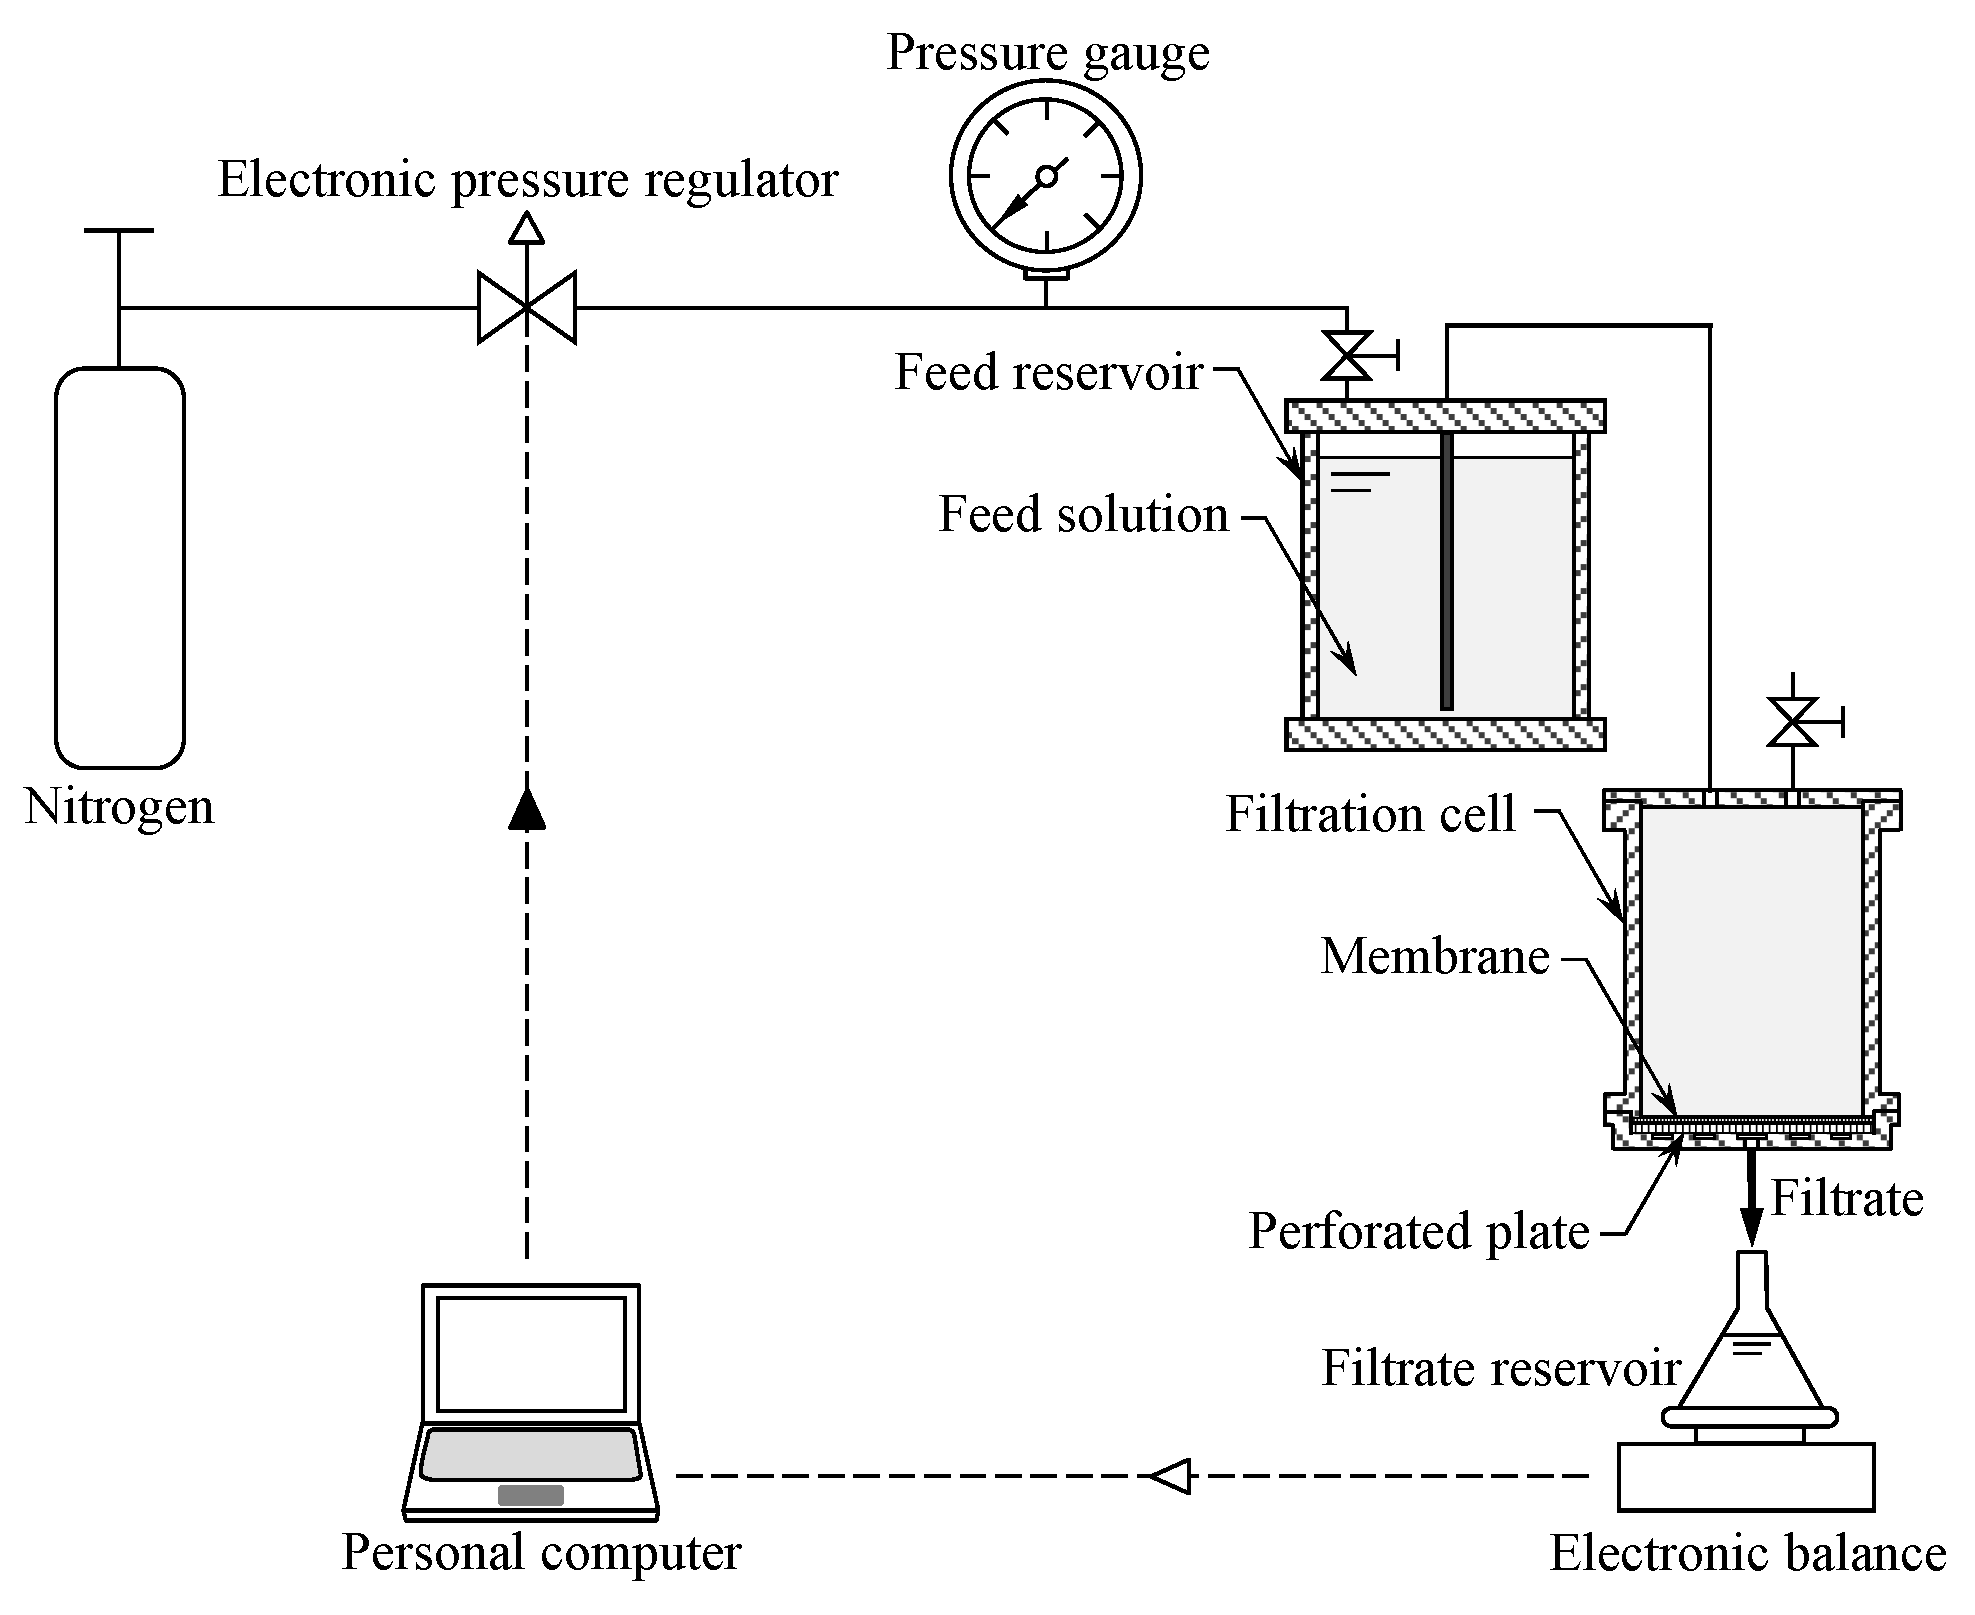
2.2. Experimental Apparatus and Technique

Figure 1 shows the schematic layout of the apparatus used for the microfiltration test. A filtration cell with an effective membrane area of 9.08 cm2 was used. Microfiltration tests were performed in dead-end filtration mode by maintaining the applied filtration pressure constant using an electronic regulator with the application of compressed nitrogen gas. The filtration pressure p ranged from 25 to 98 kPa. The filtrate was collected in a reservoir placed on an electronic balance (UX4200H, Shimadzu Corp., Kyoto, Japan) connected to a personal computer to record mass versus time data. The weights were converted into volumes using density correlations, and the filtration rates J (=dv/dt) at different volumes were computed by numerically differentiating the volume v versus time t data.

3. Blocking Filtration Model

In general, polysaccharides are smaller than the pores in a microfiltration membrane and are deposited inside the membrane, resulting in constricted pores and reduced membrane permeability. When considering the membrane as a porous medium, the flow through it can be described by the application of the Kozeny–Carman equation:
J = d v d t = ε 3 k 0 S 2 1 ε 2 · p μ L ,
where J is the filtration rate, v is the cumulative filtrate volume per unit membrane area, t is the filtration time, k0 is the Kozeny constant, ε is the porosity of the membrane, S is the specific surface area of the membrane, p is the applied filtration pressure, μ is the filtrate viscosity, and L is the membrane thickness. Iritani et al. [10] proposed a blocking filtration model based on the Kozeny–Carman Equation (1) by considering the variations in the porosity and specific surface area of the membrane caused by particle deposition within the porous membrane during filtration. Applying the model to the behavior of solutes, the porosity ε in Equation (1) decreases with the deposition of polysaccharides on the pore walls as the filtrate volume v increases, as schematically illustrated in Figure 2. The initial porosity ε0 of the clean membrane is given by
ε 0 = π 4 N p D 0 2 ,
where Np is the number of pores per unit cross-sectional membrane area, and D0 is the original representative pore diameter on a flow cross-sectional area basis. The porosity ε of the pores coated by the deposit can be expressed as
ε = π 4 N p D 2 = π 4 N p D 0 2 K v ,
where D is the representative pore diameter on a flow cross-sectional area basis, and K is an empirical constant. The relationship between the porosity ε and filtrate volume v can be expressed as
ε = ε 0 K v = 1 K ε 0 v ε 0 ,
which is equivalent to
D D 0 = 1 K ε 0 v 1 2 .
The specific surface area S of the membrane in Equation (1) also varies with increasing filtrate volume v. The initial specific surface area S0 of the clean membrane is given by
S 0 = π N p D s 0 1 ε 0 ,
where Ds0 is the original representative pore diameter on a wetted perimeter basis. The specific surface area S of the pores coated by the deposit can be established as
S = π N p D s 1 ε ,
where Ds is the representative pore diameter on a wetted perimeter basis. Depending on the deposit morphology mode of the solutes, the relationship between the diameter Ds on a wetted perimeter basis and the diameter D on a flow cross-sectional area basis can be represented by [2,10]
D s D s 0 = D D 0 β ,
where β is a shape factor of pores. Combining Equations (6) and (7) with the aid of Equations (5) and (8), we obtain
S 2 1 ε 2 = 1 K ε 0 v β S 0 2 1 ε 0 2 .
Substituting Equations (4) and (9) into Equation (1), we obtain the relationship between the filtration rate J and filtrate volume v as follows:
J = 1 K ε 0 v 3 β · ε 0 3 k 0 S 0 2 1 ε 0 2 · p μ L = 1 K ε 0 v 3 β J 0 ,
where J0 is the initial filtration rate.
Equation (10) can be transformed into
1 J = 1 + N v M 1 J 0 ,
where 1/J (= dt/dv) is the reciprocal filtration rate, N = −K/ε0, and M = β − 3. Differentiating Equation (11) with respect to the filtrate volume v under constant-pressure conditions yields
d 1 J d v = d 2 t d v 2 = k 1 J n = k d t d v n ,
where k = MN(1/J0)1/M = (3 − β)(K/ε0) (1/J0)1/(β−3) and n = (M − 1)/M = (β − 4)/(β − 3). Equation (12) is identical to the characteristic form of the blocking filtration law (complete blocking; n = 2, standard blocking; n = 1.5, intermediate blocking; n = 1, cake mode of filtration; n = 0) proposed by Hermans and Bredée [3]. However, there is no limit to the value of the blocking index n in Equation (12), and because n depends on β, it is closely related to changes in the pore shape that accompany solute deposition.
Figure 2. Schematic view of the mechanism of membrane pore blocking by polysaccharides.
Separations 11 00070 g002

4. Results and Discussion

4.1. Membrane Filtration Properties of Sodium Alginate

In Figure 3a, the constant pressure filtration data obtained using the hydrophilic polyvinylidene difluoride (Hilic-PVDF) membrane and sodium alginate (SA) solutions are plotted in the form of the reciprocal filtration rate 1/J against the cumulative filtrate volume v per unit membrane area, based on the Ruth filtration rate equation [40]
1 J = μ ρ s α a v p 1 m s v + v m = K c v + 1 J 0   ,
where μ is the viscosity of the filtrate, ρ is the density of the filtrate, s is the mass fraction of SA in the solution, αav is the average specific cake resistance, p is the applied filtration pressure, m is the average ratio of the mass of the wet cake to that of the dry cake, vm is the fictitious filtrate volume per unit membrane area, and Kc is the blocking constant for cake filtration. The datapoints corresponding to the initial stage of filtration form a downward convex curve, while a linear curve is visible in the middle when the concentration C of SA is 100–400 mg/L. The linearity of the plot, in accordance with Equation (13), indicates cake formation during this period [41,42]. Therefore, the filtration mechanism shifted from membrane blocking to cake filtration, as shown in Figure 4.
Figure 3b shows a log–log plot of d(1/J)/dv and 1/J based on Equation (12), after differentiating 1/J with respect to v in Figure 3a. The plot became a straight line rising to the right, indicating the progression of membrane blocking. It should be noted that the slopes of the plots were approximately the same for all SA concentrations C. This implies that the blocking index n in Equation (12) has the same value under all conditions. In contrast, the value of the resistance coefficient k in Equation (12) increases with increasing concentration C because the d(1/J)/dv value at 1/J = 1 increases. When the concentration C was 100–400 mg/L, the slope gradually became gentler and transitioned toward the horizontal direction. In Figure 3b, the plot is horizontal, that is n = 0, which represents the characteristics of cake filtration and corresponds to the period of a constant slope Kc in Figure 3a. Based on the abovementioned results, the transition from membrane blocking to cake filtration, which is observed in the filtration of fine particles [11], was observed during the membrane filtration of the SA solution. The scenario is outlined in Figure 4. By substituting the values of n and k and the value of the initial filtration rate J0 into Equation (14) [11,43], which is a modified version of Equation (11), the change in the filtration rate over time can be obtained. Furthermore, Equation (13) is applicable after the transition from blocking to cake filtration. The solid lines in Figure 3a represent the calculations based on Equations (14) and (13) and are in relatively good agreement with the experimental data.
1 J = 1 + N v M 1 J 0 = 1 J 0 1 n + k 1 n v 1 1 n  
Figure 3c shows the blocking filtration characteristic plot when the SA concentration was maintained constant, and the filtration pressure p was varied. The plots become straight lines, indicating that neither the values of n nor k are influenced by the filtration pressure. In other words, it can be determined that the filtration pressure affects the initial filtration rate, but its effect on the pore-blocking mechanism is small. As shown in the figure, this trend is also observed for the hydrophobic polyvinylidene difluoride (Hbic-PVDF) membrane. Comparing the Hilic-PVDF and Hbic-PVDF membranes, the slopes of the plots were parallel, indicating that the n values of both membranes were approximately equal. The blocking index n is a parameter related to changes in the pore shape accompanying polysaccharide deposition on the pore walls, and its value is considered to be influenced by the membrane structure. The resistance coefficient k was higher for the Hbic-PVDF membrane compared to the Hilic-PVDF membrane, and the surface properties of the membrane affected this value.
Using the values of n = (β − 4)/(β − 3) and k = (3 − β)(K/ε0) (1/J0)1/(β−3) gives K/ε0 in Equation (4), which describes the porosity change with polysaccharide entrapment. K/ε0 is an index of the capture ratio of the polysaccharides, and the relationship between this value and the SA concentration C or filtration pressure p is shown in Figure 3d. K/ε0 is proportional to C, indicating that the rate at which SA blocks the membrane increases with increasing concentration of SA. In contrast, K/ε0 did not depend on the filtration pressure p, and changing the pressure did not affect the progress of membrane blocking per filtrate volume. Note that the K/ε0 value of the Hbic-PVDF membrane was larger than that of the Hilic-PVDF membrane under all conditions.

4.2. Relationship between Membrane Properties and Fouling Mechanism

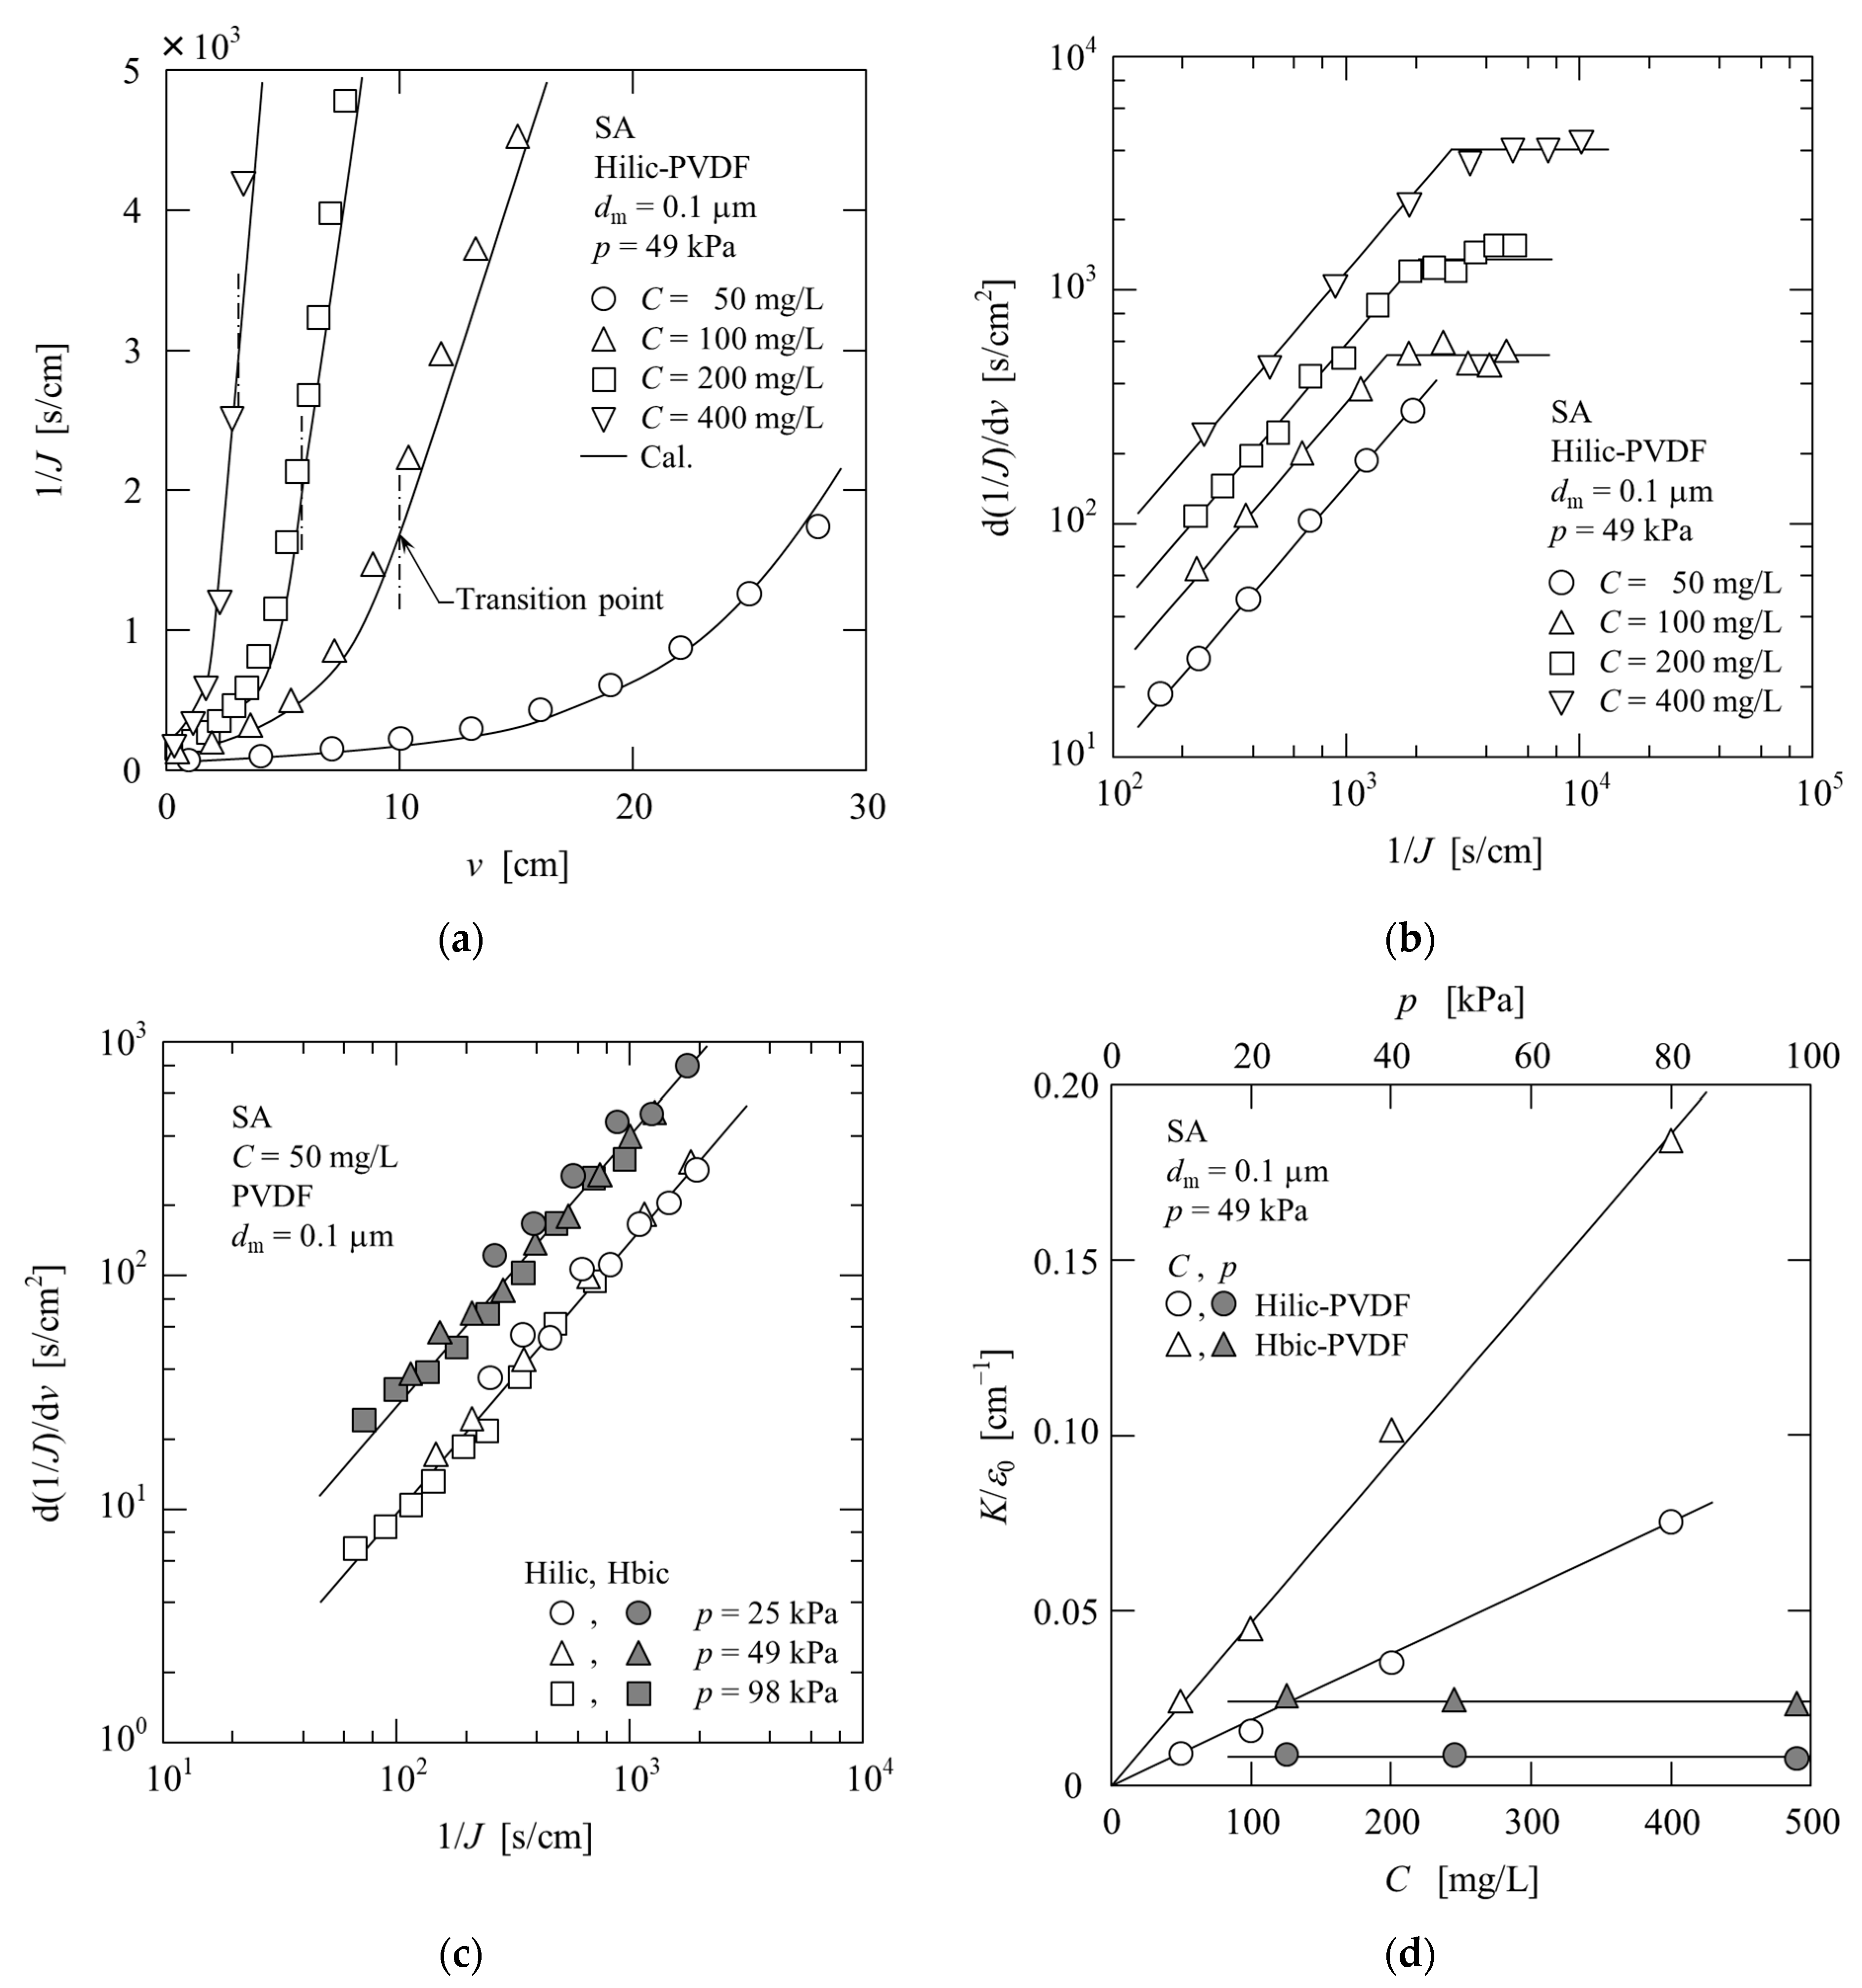
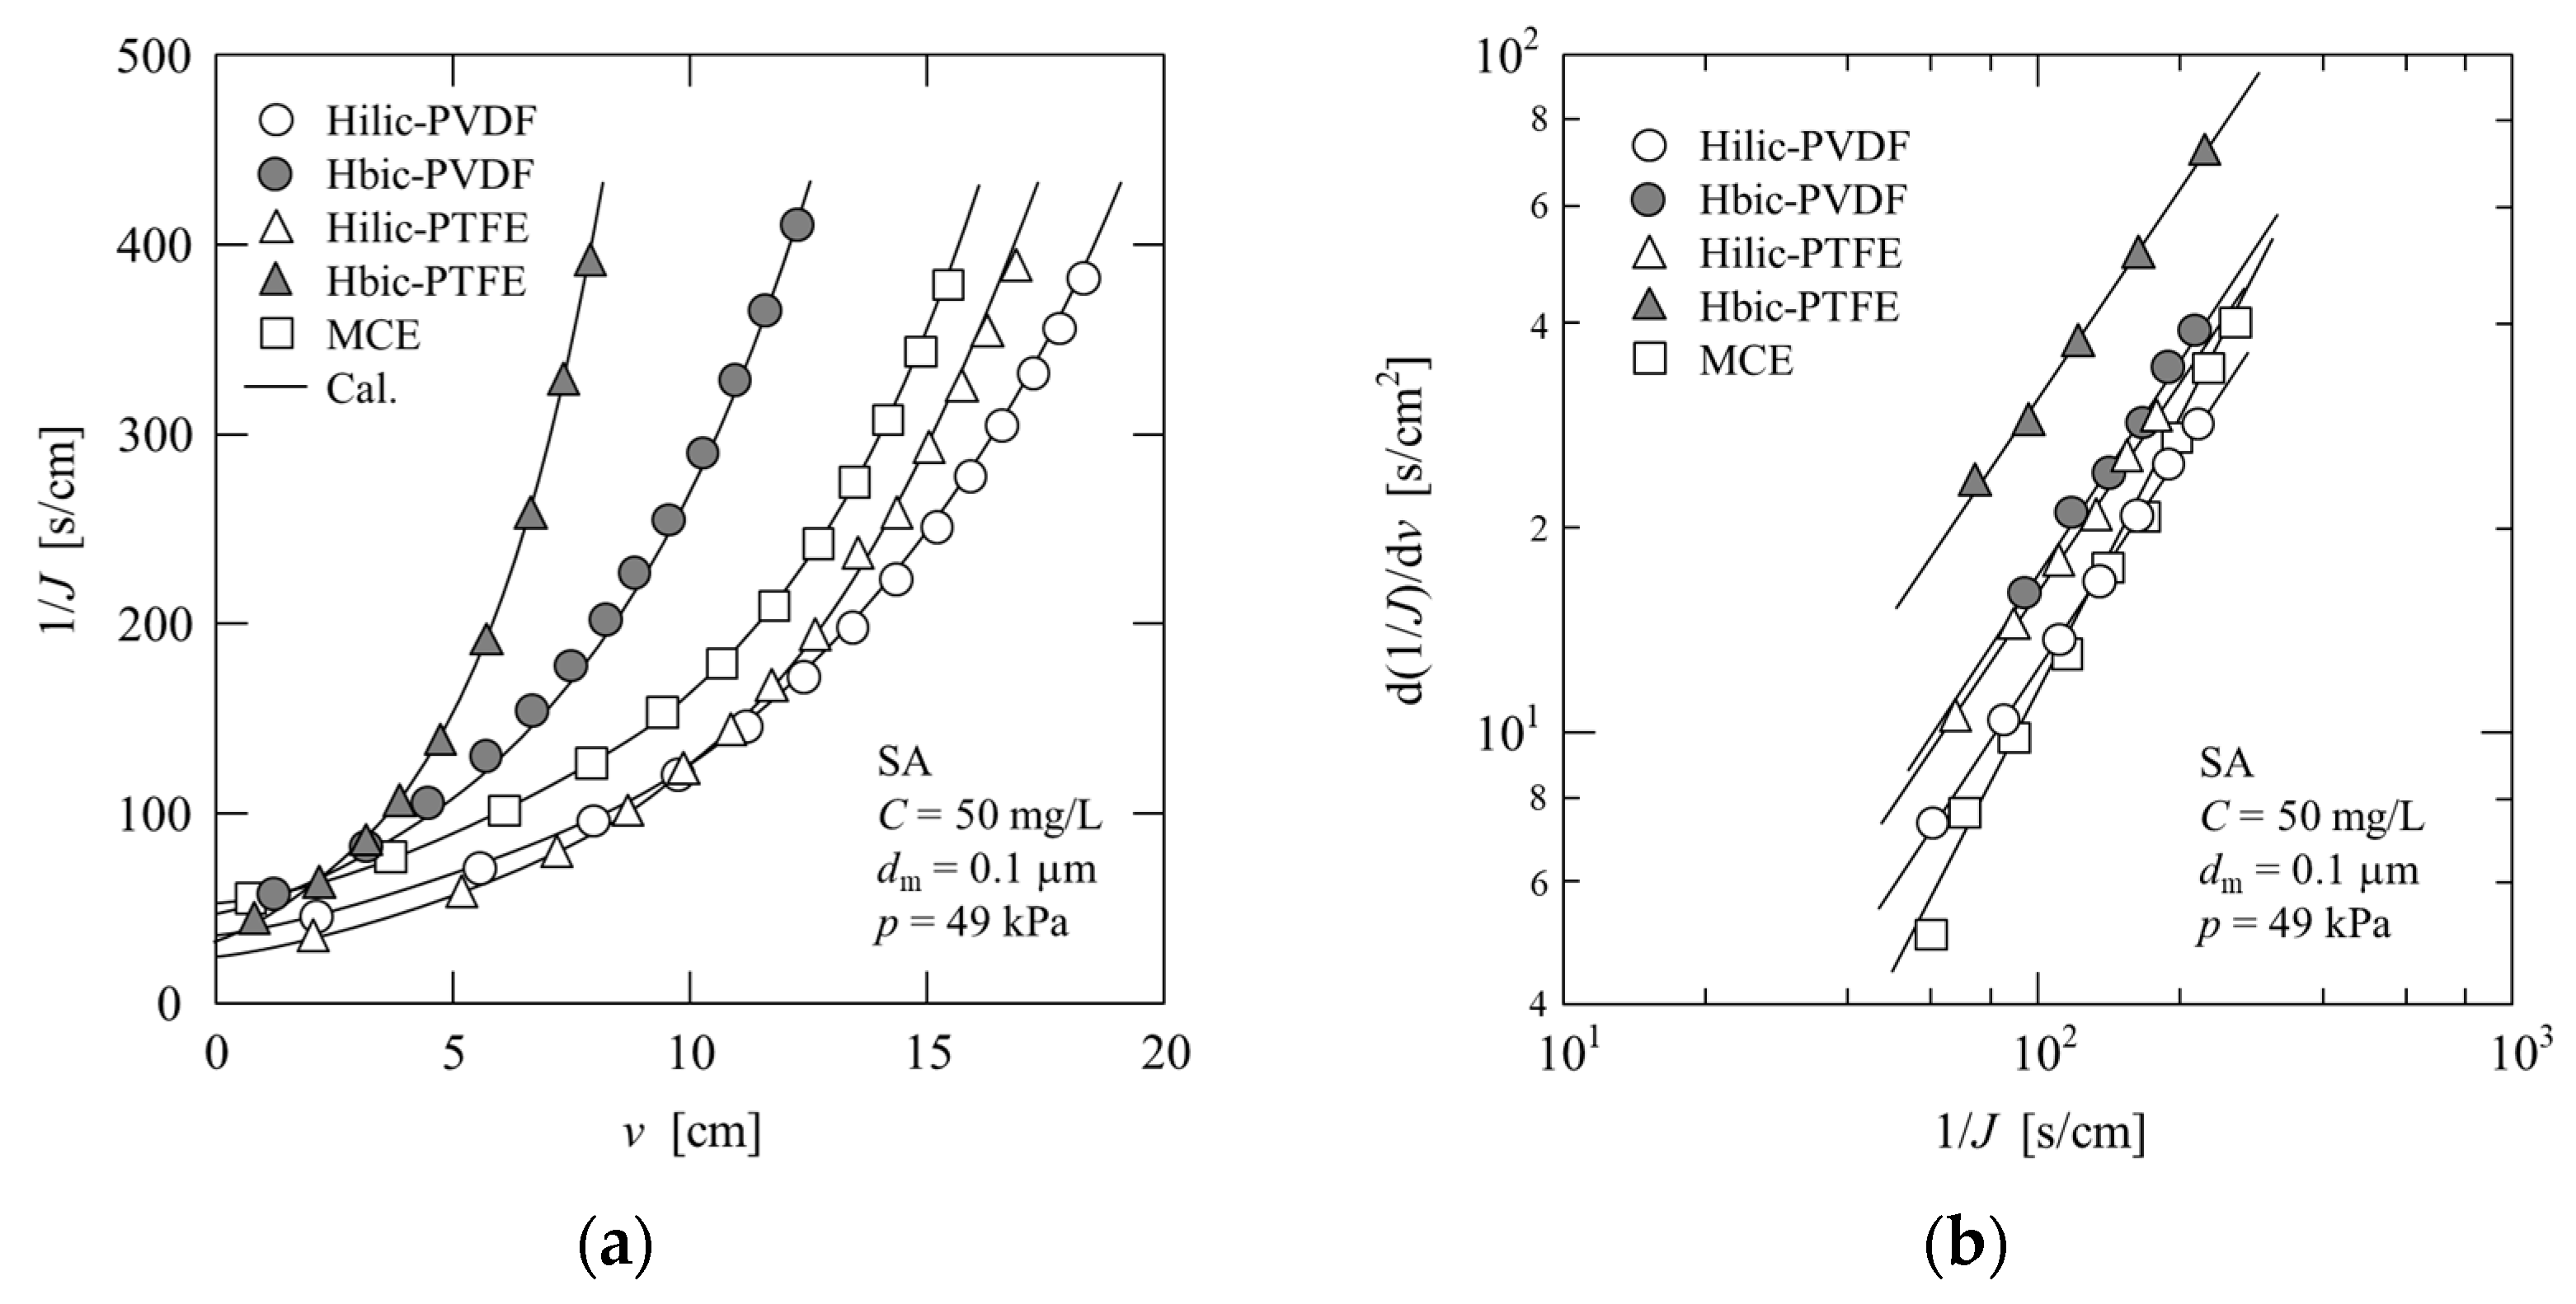
4.2.1. Sodium Alginate (SA)
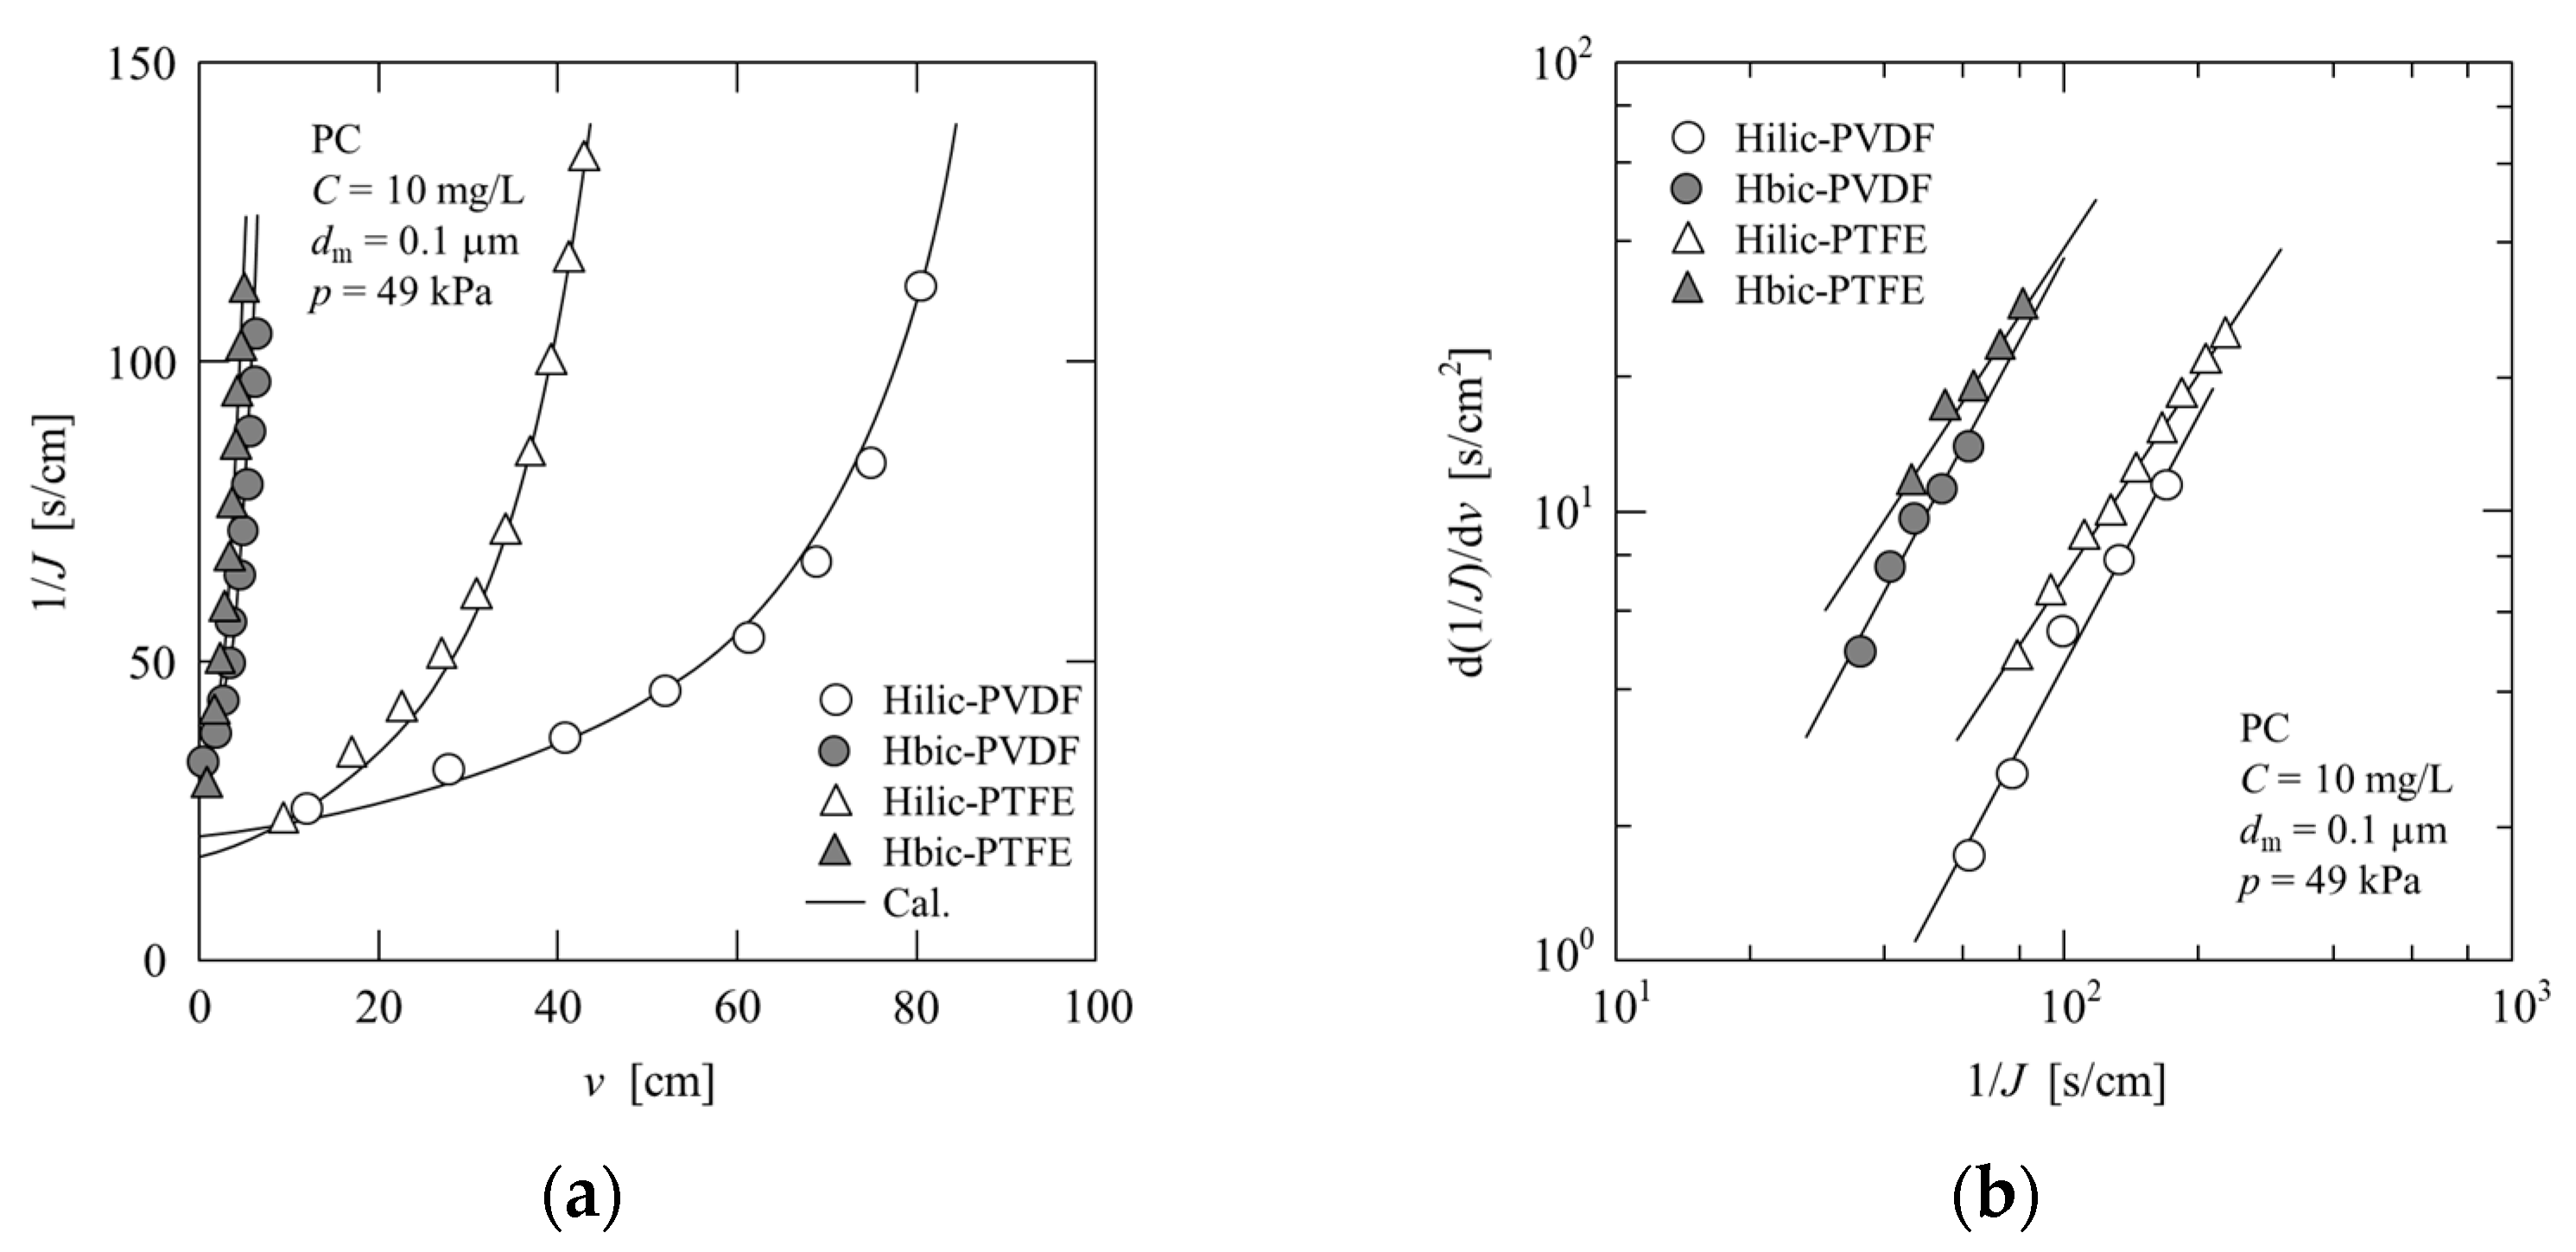
Figure 5 shows the filtration behavior of sodium alginate (SA) solutions with five types of membranes (Hilic-PVDF, Hbic-PVDF, Hilic-PTFE, Hbic-PTFE, and MCE). Figure 5a shows 1/J versus v and Figure 5b shows d(1/J)/dv versus 1/J. As shown in Figure 5a, the decrease in the filtration rate J was faster for hydrophobic membranes (Hbic-PVDF, Hbic-PTFE) and slower for hydrophilic membranes (Hilic-PVDF, Hilic-PTFE, and MCE). The progression of membrane fouling was the slowest on the Hilic-PVDF membrane. As shown in Figure 5b, which is a double-logarithmic plot of d(1/J)/dv and 1/J based on Equation (12), all the membranes exhibited an upward-sloping straight line. At the same 1/J value, the hydrophobic membrane exhibited a larger d(1/J)/dv value, and the plots were approximately parallel for membranes made of the same material. The values of the blocking index n and resistance coefficient k in Equation (12) were determined for all the membranes and are listed in Table 1. The n values for the Hilic-PVDF, Hbic-PVDF, Hilic-PTFE, Hbic-PTFE, and MCE membranes were 1.05, 1.05, 1.02, 1.03, and 1.32, respectively. The blocking index n is a parameter closely related to changes in the pore shape accompanying polysaccharide deposition on the pore walls and is considered to be significantly affected by the membrane structure. In contrast, the resistance coefficient k is affected by the surface properties of the membrane, with a hydrophobic membrane exhibiting a larger value than a hydrophilic membrane when membranes are made of the same material. The model calculations based on Equation (14) using the values of n and k were in relatively good agreement with the experimental data, as shown in Figure 5a.

4.2.2. Pectin (PC)

Membrane filtration tests were performed using four types of membranes (Hilic-PVDF, Hbic-PVDF, Hilic-PTFE, and Hbic-PTFE) with pectin (PC) as the solute, and the results are shown in Figure 6 and Table 2. The transition from membrane blocking to cake filtration occurred more rapidly with PC compared to SA. The cake filtration behavior was similar between the membranes; therefore, the membrane-blocking behavior was achieved by reducing the PC concentration. As shown in Figure 6a, even for PC, a significant difference in the filtration behavior was observed between the hydrophilic and hydrophobic membranes, which was more pronounced compared to the case of SA (Figure 5a). Figure 5a and Figure 6a show that the Hilic-PVDF membrane exhibited the slowest reduction in the filtration rate J. In the blocking filtration characteristic plot in Figure 6b, the Hilic-PVDF and Hbic-PVDF membranes are in parallel. Similarly, in Figure 5b, the Hilic-PTFE and Hbic-PTFE membranes are also parallel. In addition, the n values, which represent the slope of the plots, were approximately the same between the PVDF membranes (1.86 and 1.85) as well as between the PTFE membranes (1.50 and 1.50), as shown in Table 2. However, the values differ from those of SA shown in Table 1, indicating that n exhibits a unique value for each specific membrane–polysaccharide combination. The k value was higher for the Hbic-PVDF membrane compared to the Hilic-PVDF membrane, and for the Hbic-PTFE membrane compared to the Hilic-PTFE membrane, indicating that hydrophobic membranes exhibit higher k values. As shown in Figure 6a, the model calculations based on Equation (14) using the values of n and k were in relatively good agreement with the experimental data.

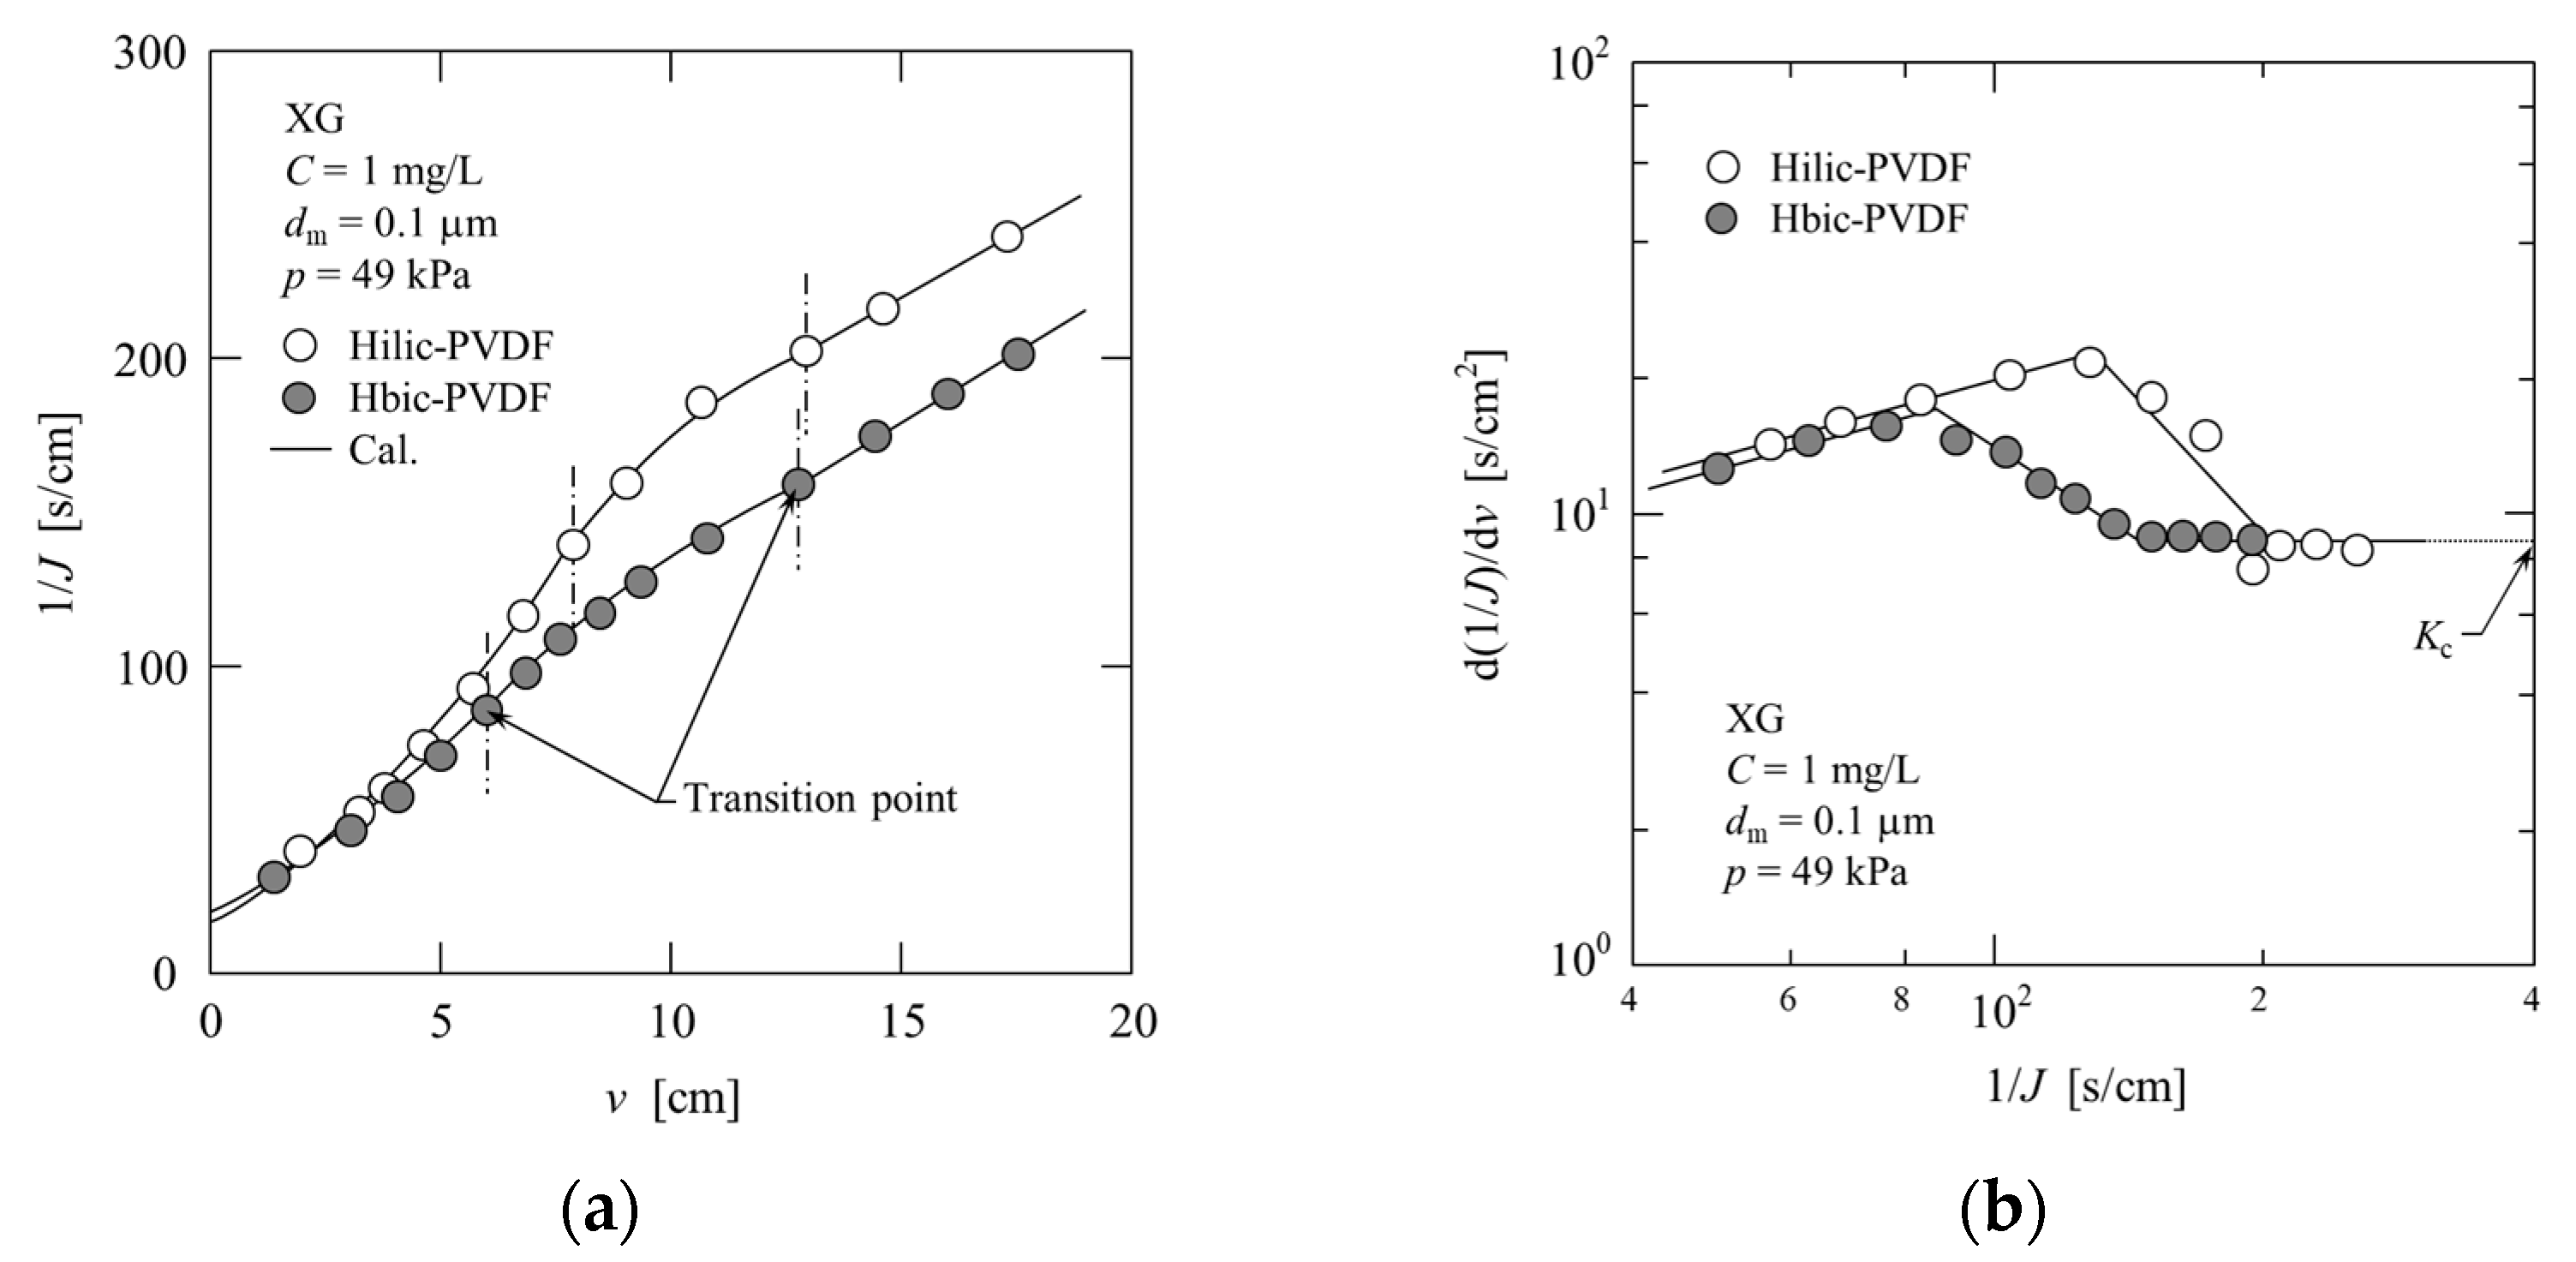
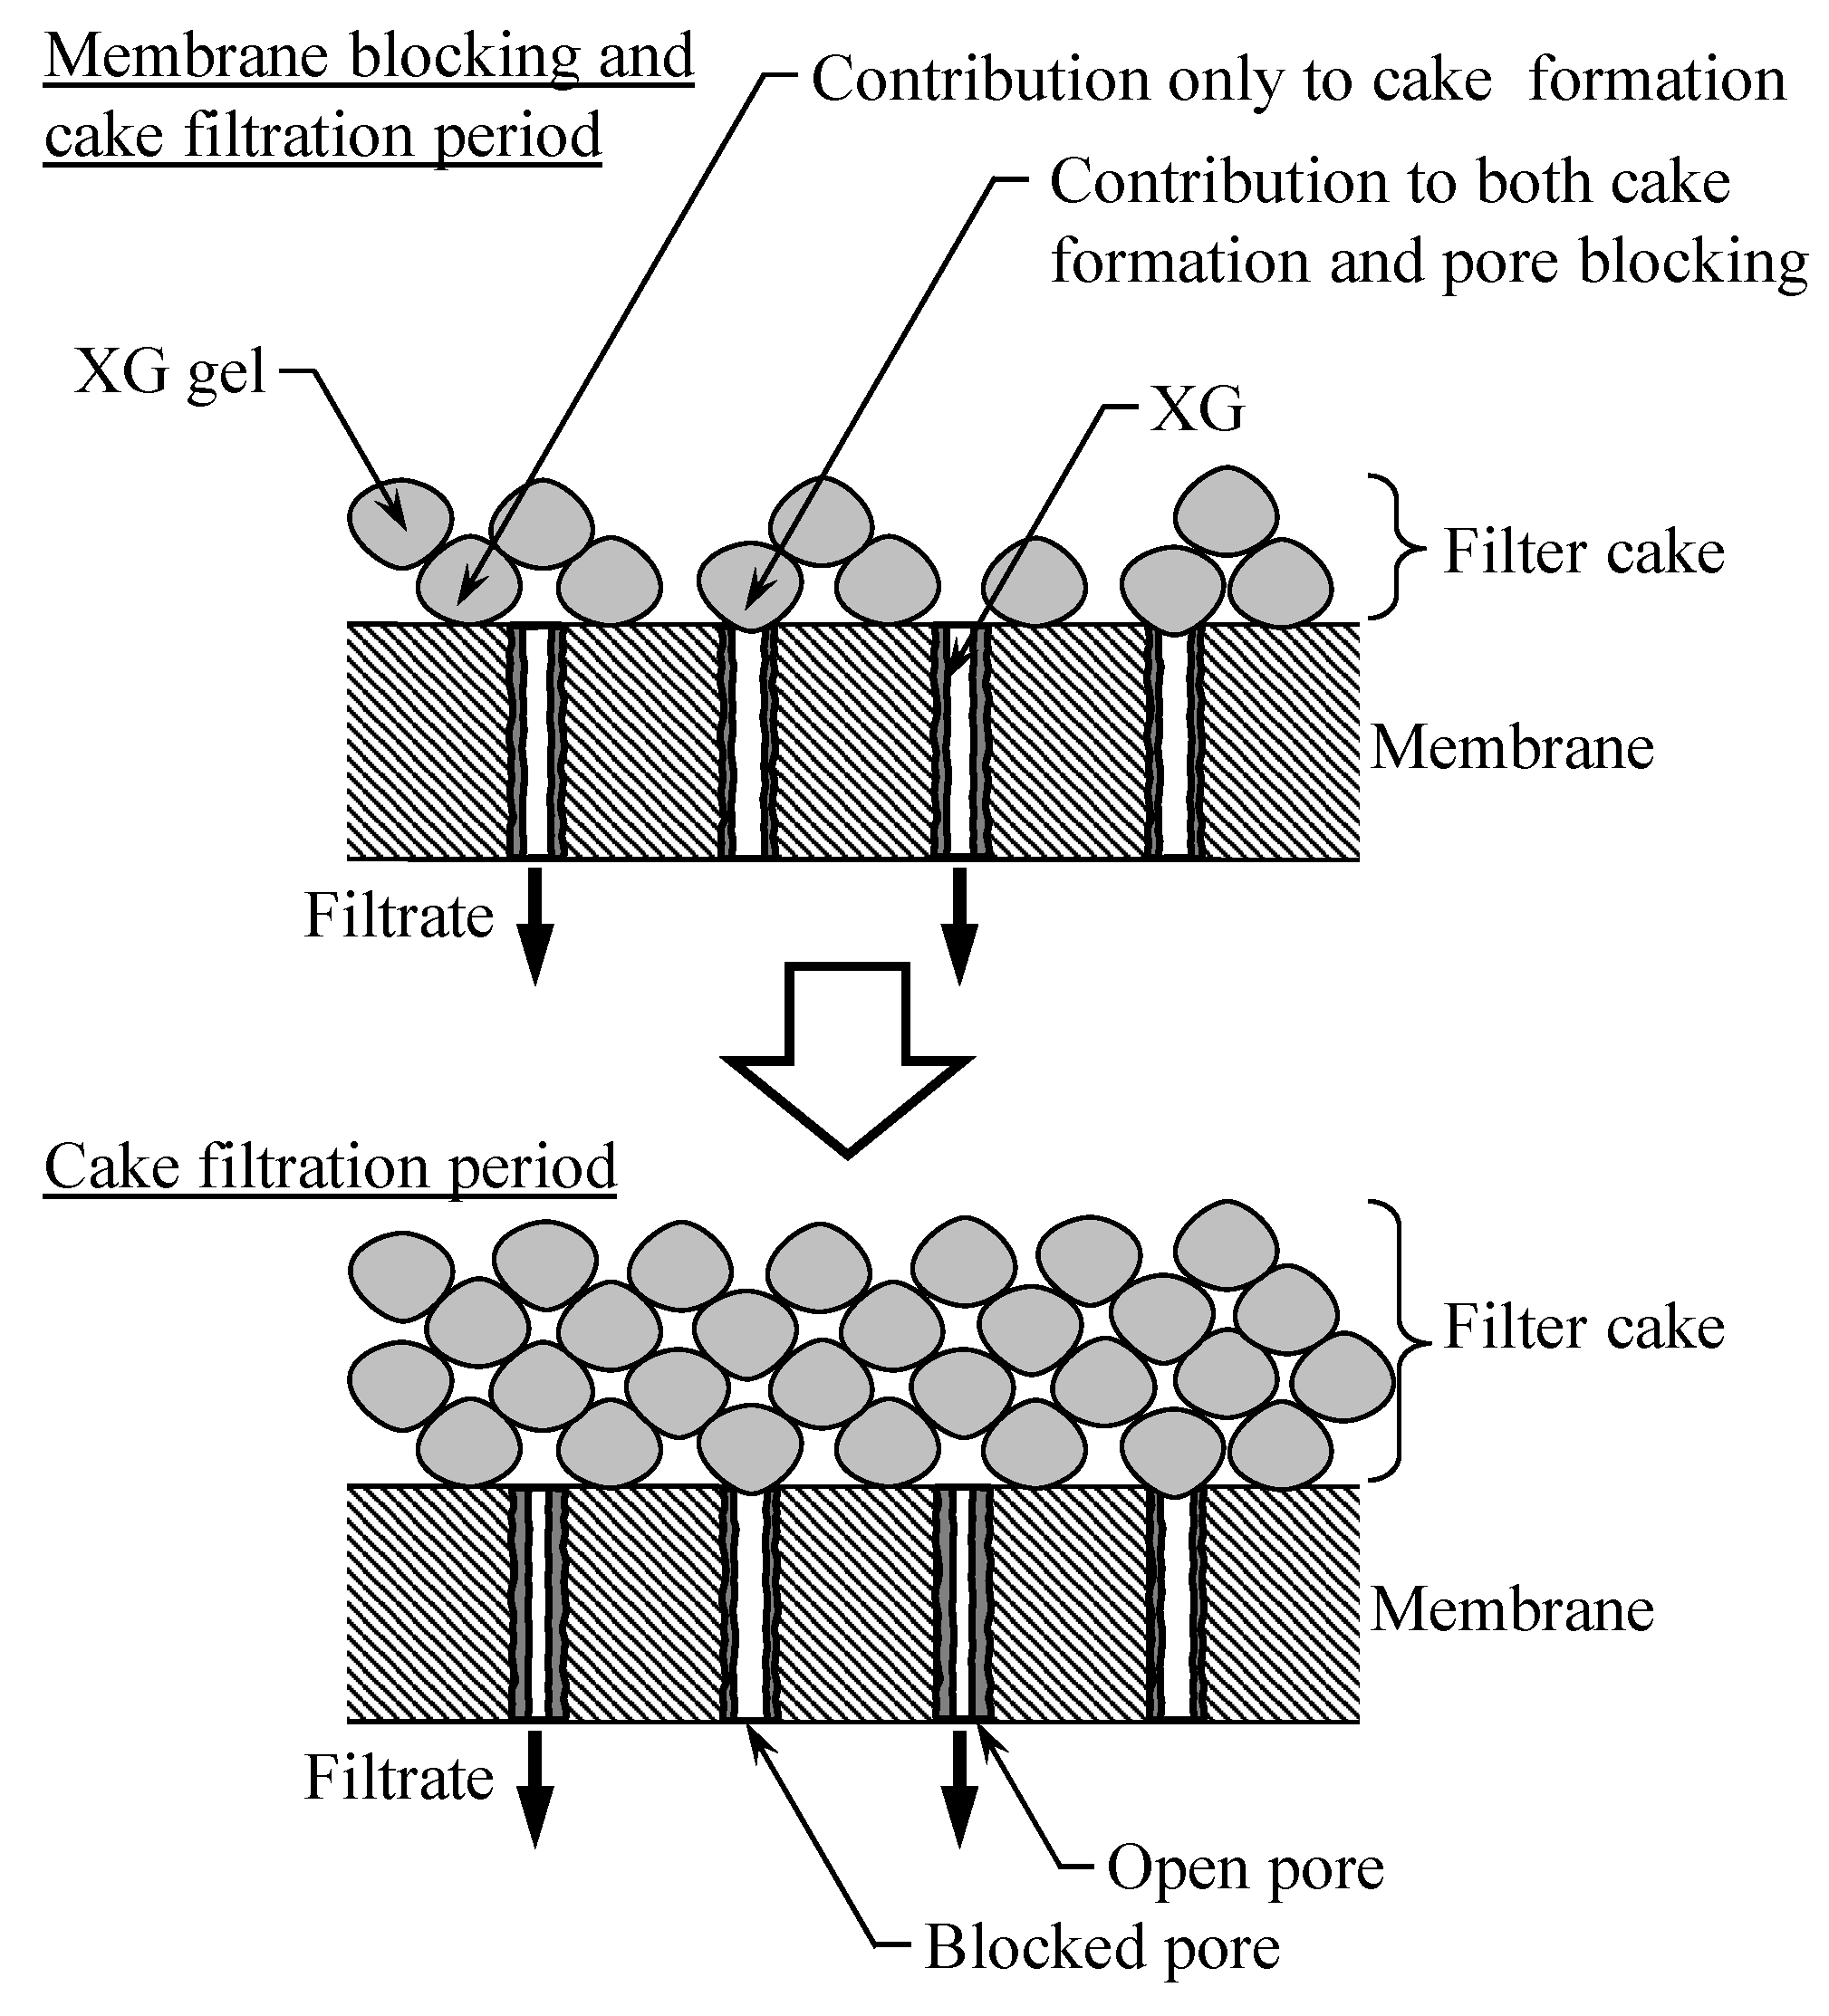
4.2.3. Xanthan Gum (XG)

In the case of xanthan gum (XG), cake filtration was observed from the initial stage of filtration owing to the presence of gel-like substances in the solution, even at a concentration of 10 mg/L. Consequently, the concentration C was lowered to 1 mg/L, and filtration tests were performed using the PVDF membranes. Figure 7a shows the relationship between the reciprocal filtration rate 1/J and the cumulative filtrate volume v per unit membrane area. The filtration behavior of both the Hilic-PVDF and Hbic-PVDF membranes changed from a downward convex curve to an upward convex curve and, finally, to a straight line. Although the Hilic-PVDF membrane exhibited a longer curved membrane-blocking period, the slopes of the plots after the linear cake filtration period were parallel for the Hilic-PVDF and Hbic-PVDF membranes. The fact that the slopes are the same indicates that similar cakes were formed on both the membranes [41].
Figure 7b shows a log–log plot of d(1/J)/dv and 1/J based on Equation (12). For both the membranes, the plot transitions from a straight line rising to the right to a straight line falling to the right and then flattens corresponding to a constant value (Kc). In the blocking filtration characteristic plot, a negative slope indicates that the filtration behavior is affected by both membrane blocking and cake formation [11,44]. In addition, during the positive slope period in the early stage of filtration, the n value was approximately 0.5, which was smaller compared to other polysaccharides such as SA and PC. It was presumed that both membrane blocking and cake formation occurred during this period. The presence of gel-like XG in the sample and the extremely low concentration of XG contributed to the observation of this complex filtration behavior. This phenomenon is illustrated in Figure 8. The period where the filtration resistance increased significantly, during which pore blocking on the surface and inside the membrane, as well as cake formation, occurred simultaneously, transitioned to a period where only cake formation occurred. These were divided into three periods, namely the first blocking, second blocking, and cake filtration periods. The n and k values obtained in each blocking period (first blocking; n = 0.58, k = 1.4 s1−n/cm2−n, second blocking; n = −2.4, k = 2.9 × 10⁶ s1−n/cm2−n) were substituted into Equation (14), and then, the Kc value obtained in the cake filtration period (Kc = 8.9 s/cm2) was substituted into Equation (13). The filtration behavior was estimated by combining these results. The calculated value is represented by the solid line in Figure 7a, which represents the actual filtration behavior.

5. Conclusions

The relationship between membrane properties and the fouling mechanism in the microfiltration of polysaccharides was analyzed using a blocking filtration model. The blocking index n, which is correlated to the changes in the pore shape due to polysaccharide deposition on the pore walls, exhibited a unique value for each particular membrane–polysaccharide combination, independent of the filtration conditions (pectin: n = 1.86, 1.85, 1.50, and 1.50 for hydrophilic PVDF, hydrophobic PVDF, hydrophilic PTFE, and hydrophobic PTFE, respectively). In contrast, the resistance coefficient k varied with the polysaccharide concentration and membrane surface characteristics (pectin: k = 0.00084, 0.00725, 0.00714, and 0.0384 s1−n/cm2−n for hydrophilic PVDF, hydrophobic PVDF, hydrophilic PTFE, and hydrophobic PTFE, respectively). Furthermore, it was confirmed that the model calculations using the values of n and k accurately estimated the filtration behavior. Additionally, it was elucidated that, typically, the transition to cake filtration occurred after membrane blocking caused by polysaccharides. However, when polysaccharides undergo gelation, both membrane blocking and cake formation occur simultaneously during the initial filtration stages. These model analysis results are valuable for understanding the membrane fouling mechanism and determining the timing of cleaning and replacement of membranes in practical applications. These findings will be useful for establishing efficient membrane filtration methods and fabricating antifouling membranes.

Author Contributions

Conceptualization, N.K. and E.I.; methodology, N.K.; formal analysis, T.U. and H.T.; investigation, T.U. and H.T.; writing—original draft preparation, N.K.; writing—review and editing, E.I. All authors have read and agreed to the published version of the manuscript.

Funding

This research was funded by JSPS KAKENHI, grant number JP 20K05190.

Data Availability Statement

Data are contained within the article.

Conflicts of Interest

The authors declare no conflicts of interest.

References

  1. Shah, S.S.A.; Sohail, M.; Murtza, G.; Waseem, A.; Rehman, A.; Hussain, I.; Bashir, M.S.; Alarfaji, S.S.; Hassan, A.M.; Nazir, M.A.; et al. Recent trends in wastewater treatment by using metal-organic frameworks (MOFs) and their composites: A critical view-point. Chemosphere 2024, 349, 140729. [Google Scholar] [CrossRef] [PubMed]
  2. Iritani, E.; Katagiri, N. Developments of blocking filtration model in membrane filtration. KONA Powder Part. J. 2016, 33, 179–202. [Google Scholar] [CrossRef]
  3. Hermans, P.H.; Bredée, H.L. Principles of the mathematical treatment of constant-pressure filtration. J. Soc. Chem. Ind. 1936, 55, 1–4. [Google Scholar]
  4. Grace, H.P. Structure and performance of filter media. II. Performance of filter media in liquid service. AIChE J. 1956, 2, 316–336. [Google Scholar] [CrossRef]
  5. Hermia, J. Constant pressure blocking filtration laws—Application to power-law non-Newtonian fluids. Trans. IChemE 1982, 60, 183–187. [Google Scholar]
  6. Blanpain-Avet, P.; Fillaudeau, L.; Lalande, M. Investigation of machanisms governing membrane fouling and protein rejection in the sterile microfiltration of beer with an organic membrane. Food Bioprod. Process. 1999, 77, 75–89. [Google Scholar] [CrossRef]
  7. Ho, C.C.; Zydney, A.L. A combined pore blockage and cake filtration model for protein fouling during microfiltration. J. Colloid Interface Sci. 2000, 232, 389–399. [Google Scholar] [CrossRef]
  8. Hwang, K.J.; Chou, F.Y.; Tung, K.L. Effects of operating conditions on the performance of cross-flow microfiltration of fine particle/protein binary suspension. J. Membr. Sci. 2006, 274, 183–191. [Google Scholar] [CrossRef]
  9. Bolton, G.; LaCasse, D.; Kuriyel, R. Combined models of membrane fouling: Development and application to microfiltration and ultrafiltration of biological fluids. J. Membr. Sci. 2006, 277, 75–84. [Google Scholar] [CrossRef]
  10. Iritani, E.; Katagiri, N.; Sugiyama, Y.; Yagishita, K. Analysis of flux decline behaviors in filtration of very dilute suspensions. AIChE J. 2007, 53, 2275–2283. [Google Scholar] [CrossRef]
  11. Iritani, E.; Katagiri, N.; Yamashita, Y. Effect of membrane morphology on rising properties of filtration resistance in microfiltration of dilute colloids. AIChE J. 2017, 63, 3511–3522. [Google Scholar] [CrossRef]
  12. Broeckmann, A.; Busch, J.; Wintgens, T.; Marquardt, W. Modeling of pore blocking and cake layer formation in membrane filtration for wastewater treatment. Desalination 2006, 189, 97–109. [Google Scholar] [CrossRef]
  13. Ho, C.C.; Zydney, A.L. Effect of membrane morphology on the initial rate of protein fouling during microfiltration. J. Membr. Sci. 1999, 155, 261–275. [Google Scholar] [CrossRef]
  14. Hwang, K.J.; Lin, T.T. Effect of morphology of polymeric membrane on the performance of cross-flow microfiltration. J. Membr. Sci. 2002, 199, 41–52. [Google Scholar] [CrossRef]
  15. Fu, X.; Maruyama, T.; Sotani, T.; Matsuyama, H. Effect of surface morphology on membrane fouling by humic acid with the use of cellulose acetate butyrate hollow fiber membranes. J. Membr. Sci. 2008, 320, 483–491. [Google Scholar] [CrossRef]
  16. Tanaka, T.; Mimura, T.; Koga, M.; Yoshida, M.; Taniguchi, M.; Nakanishi, K. Microfiltration of incompressible particle suspension with an asymmetric depth filter. Kagaku Kogaku Ronbunshu 2009, 35, 81–86. [Google Scholar] [CrossRef]
  17. Yoshida, M.; Taniguchi, M.; Tanaka, T. Microfiltration of bacterial cell suspensions with an asymmetric depth filter. Kagaku Kogaku Ronbunshu 2010, 36, 494–500. [Google Scholar] [CrossRef]
  18. Tung, K.L.; Li, Y.L.; Wang, S.; Nanda, D.; Hu, C.C.; Li, C.L.; Lai, J.Y.; Huang, J. Performance and effects of polymeric membranes on the dead-end microfiltration of protein solution during filtration cycles. J. Membr. Sci. 2010, 352, 143–152. [Google Scholar] [CrossRef]
  19. Hashino, M.; Katagiri, T.; Kubota, N.; Ohmukai, Y.; Maruyama, T.; Matsuyama, H. Effect of membrane surface morphology on membrane fouling with sodium alginate. J. Membr. Sci. 2011, 366, 258–265. [Google Scholar] [CrossRef]
  20. Hashino, M.; Katagiri, T.; Kubota, N.; Ohmukai, Y.; Maruyama, T.; Matsuyama, H. Effect of surface roughness of hollow fiber membranes with gear-shaped structure on membrane fouling by sodium alginate. J. Membr. Sci. 2011, 366, 389–397. [Google Scholar] [CrossRef]
  21. Hwang, K.J.; Liao, C.Y. Effects of membrane morphology and operating conditions on microfiltration particle fouling. J. Taiwan Inst. Chem. Eng. 2012, 43, 46–52. [Google Scholar] [CrossRef]
  22. Xiao, K.; Sun, J.; Mo, Y.; Fang, Z.; Liang, P.; Huang, X.; Ma, J.; Ma, B. Effect of membrane pore morphology on microfiltration organic fouling: PTFE/PVDF blend membranes compared with PVDF membranes. Desalination 2014, 343, 217–225. [Google Scholar] [CrossRef]
  23. Wu, S.E.; Lin, N.J.; Chou, C.Y.; Hu, C.C.; Tung, K.L. Biofouling mechanism of polysaccharide-protein-humic acid mixtures on polyvinylidene fluoride microfiltration membranes. J. Taiwan Inst. Chem. Eng. 2019, 94, 2–9. [Google Scholar] [CrossRef]
  24. Lin, Y.C.; Liu, K.M.; Chao, C.M.; Wang, D.K.; Tung, K.L.; Tseng, H.H. Enhanced anti-protein fouling of PVDF membrane via hydrophobic-hydrophobic adsorption of styrene-terminated amphiphilic linker. Chem. Eng. Res. Des. 2020, 156, 273–280. [Google Scholar] [CrossRef]
  25. Jørgensen, M.K.; Nierychlo, M.; Nielsen, A.H.; Larsen, P.; Christensen, M.L.; Nielsen, P.H. Unified understanding of physico-chemical properties of activated sludge and fouling propensity. Water Res. 2017, 120, 117–132. [Google Scholar] [CrossRef] [PubMed]
  26. Christensen, M.L.; Jørgensen, M.K.; Van De Staey, G.; De Cock, L.; Smets, I. Hydraulic resistance and osmotic pressure effects in fouling layers during MBR operations. J. Membr. Sci. 2021, 627, 119213. [Google Scholar] [CrossRef]
  27. Krzeminski, P.; Leverette, L.; Malamis, S.; Katsou, E. Membrane bioreactors—A review on recent developments in energy reduction, fouling control, novel configurations, LCA and market prospects. J. Membr. Sci. 2017, 527, 207–227. [Google Scholar] [CrossRef]
  28. Meng, F.; Zhang, S.; Oh, Y.; Zhou, Z.; Shin, H.S.; Chae, S.R. Fouling in membrane bioreactors: An updated review. Water Res. 2017, 114, 151–180. [Google Scholar] [CrossRef]
  29. Ye, Y.; Le Clech, P.; Chen, V.; Fane, A.G. Evolution of fouling during crossflow filtration of model EPS solutions. J. Membr. Sci. 2005, 264, 190–199. [Google Scholar] [CrossRef]
  30. Ye, Y.; Le Clech, P.; Chen, V.; Fane, A.G.; Jefferson, B. Fouling mechanisms of alginate solutions as model extracellular polymeric substances. Desalination 2005, 175, 7–20. [Google Scholar] [CrossRef]
  31. Ye, Y.; Chen, V.; Fane, A.G. Modeling long-term subcritical filtration of model EPS solutions. Desalination 2006, 191, 318–327. [Google Scholar] [CrossRef]
  32. Katsoufidou, K.; Yiantsios, S.G.; Karabelas, A.J. Experimental study of ultrafiltration membrane fouling by sodium alginate and flux recovery by backwashing. J. Membr. Sci. 2007, 300, 137–146. [Google Scholar] [CrossRef]
  33. Listiarini, K.; Chun, W.; Sun, D.D.; Leckie, J.O. Fouling mechanism and resistance analyses of systems containing sodium alginate, calcium, alum and their combination in dead-end fouling of nanofiltration membranes. J. Membr. Sci. 2009, 344, 244–251. [Google Scholar] [CrossRef]
  34. Hwang, K.J.; Tsai, P.C.; Iritani, E.; Katagiri, N. Effect of polysaccharide concentration on the membrane filtration of microbial cells. J. Appl. Sci. Eng. 2012, 15, 323–332. [Google Scholar] [CrossRef]
  35. Karabelas, A.J.; Karanasiou, A.; Sioutopoulos, D.C. Experimental study on the effect of polysaccharides on incipient membrane scaling during desalination. Desalination 2017, 416, 106–121. [Google Scholar] [CrossRef]
  36. Meng, S.; Fan, W.; Li, X.; Liu, Y.; Liang, D.; Liu, X. Intermolecular interactions of polysaccharides in membrane fouling during microfiltration. Water Res. 2018, 143, 38–46. [Google Scholar] [CrossRef] [PubMed]
  37. Meng, S.; Liu, H.; Zhao, Q.; Shen, N.; Zhang, M. Filtration performances of different polysaccharides in microfiltration process. Processes 2019, 7, 897. [Google Scholar] [CrossRef]
  38. Meng, X.; Wang, F.; Meng, S.; Wang, R.; Mao, Z.; Li, Y.; Yu, M.; Wang, X.; Zhao, Q.; Yang, L. Novel surrogates for membrane fouling and the application of support vector machine in analyzing fouling mechanism. Membranes 2021, 11, 990. [Google Scholar] [CrossRef] [PubMed]
  39. Tong, X.; Zhao, X.H.; Wu, Y.H.; Bai, Y.; Ikuno, N.; Ishii, K.; Hu, H.Y. The molecular structures of polysaccharides affect their reverse osmosis membrane fouling behaviors. J. Membr. Sci. 2021, 625, 118984. [Google Scholar] [CrossRef]
  40. Ruth, B.F. Studies in filtration. III. Derivation of general filtration equations. Ind. Eng. Chem. 1935, 27, 708–723. [Google Scholar] [CrossRef]
  41. Katagiri, N.; Tomimatsu, K.; Date, K.; Iritani, E. Yeast cell cake characterization in alcohol solution for efficient microfiltration. Membranes 2021, 11, 89. [Google Scholar] [CrossRef]
  42. Katagiri, N.; Kuwajima, Y.; Kawahara, H.; Yamashita, R.; Iritani, E. Special features of microbial cake under high pressure conditions in microfiltration. Sep. Purif. Technol. 2022, 303, 122234. [Google Scholar] [CrossRef]
  43. Katagiri, N.; Shinoda, T.; Yamashita, R.; Fukuchi, S. Estimation of filtration behavior based on simplified evaluation of membrane fouling characteristics. J. Jpn. Soc. Water Environ. 2021, 44, 149–155. [Google Scholar] [CrossRef]
  44. Hwang, K.J.; Liao, C.Y.; Tung, K.L. Analysis of particle fouling during microfiltration by use of blocking models. J. Membr. Sci. 2007, 287, 287–293. [Google Scholar] [CrossRef]
Figure 1. Schematic layout of the apparatus for the microfiltration test.
Separations 11 00070 g001
Figure 3. The filtration behaviors of sodium alginate (SA) in different PVDF membranes: (a) 1/J vs. v; (b) d(1/J)/dv vs. 1/J (C = 50–400 mg/L); (c) d(1/J)/dv vs. 1/J (p = 25–98 kPa); (d) K/ε0 vs. C and K/ε0 vs. p.
Separations 11 00070 g003
Figure 4. Schematic view of the membrane fouling mechanism of polysaccharides.
Separations 11 00070 g004
Figure 5. The microfiltration behaviors of sodium alginate (SA): (a) 1/J vs. v; (b) d(1/J)/dv vs. 1/J.
Separations 11 00070 g005
Figure 6. The microfiltration behaviors of pectin (PC): (a) 1/J vs. v; (b) d(1/J)/dv vs. 1/J.
Separations 11 00070 g006
Figure 7. The microfiltration behaviors of xanthan gum (XG): (a) 1/J vs. v; (b) d(1/J)/dv vs. 1/J.
Separations 11 00070 g007
Figure 8. Schematic view of the membrane fouling mechanism of xanthan gum (XG).
Separations 11 00070 g008
Table 1. Values of n and k in the microfiltration of sodium alginate.
MembraneHilic-
PVDF
Hbic-
PVDF
Hilic-
PTFE
Hbic-
PTFE
MCE
n [-]1.051.051.021.031.32
k [s1−n/cm2−n]0.09490.1340.1440.2580.0246
Table 2. Values of n and k in the microfiltration of pectin.
MembraneHilic-
PVDF
Hbic-
PVDF
Hilic-
PTFE
Hbic-
PTFE
MCE
n [-]1.861.851.501.501.98
k [s1−n/cm2−n]0.000840.007250.007140.03840.00213
Disclaimer/Publisher’s Note: The statements, opinions and data contained in all publications are solely those of the individual author(s) and contributor(s) and not of MDPI and/or the editor(s). MDPI and/or the editor(s) disclaim responsibility for any injury to people or property resulting from any ideas, methods, instructions or products referred to in the content.

