
Features and Advantages of the Recurrent Approximation of Retention Times in Reversed-Phase High-Performance Liquid Chromatography


Institute for Chemistry, St. Petersburg State University, UniversitetskyAve., 26, St. Petersburg 198504, Russia
*
Author to whom correspondence should be addressed.
Separations 2024, 11(3), 69; https://doi.org/10.3390/separations11030069
Submission received: 29 January 2024
/
Revised: 17 February 2024
/
Accepted: 18 February 2024
/
Published: 24 February 2024
(This article belongs to the Section Chromatographic Separations)
Abstract
:Background: Recurrent approximation of retention parameters in reversed-phase HPLC is effective for revealing anomalies that are otherwise difficult to detect, namely, the reversible hydration of analytes. This was demonstrated previously for restricted sets of analytes with acetonitrile–water eluents. Expanding the number of analytes and eluents seems to be a topical problem. Two kinds of derivatives of aromatic carbonyl compounds were characterized: unsubstituted hydrazones and oximes. Methods: If analyte demonstrates no anomalies in dependences of retention times vs. concentration of organic modifier, the recurrent approximations of these dependences are linear. To explain the features of recurrent approximations, the numerical experiments were proposed and considered. The artificial shifting of one, two, or more points allows for the modeling the different kinds of deviations of approximations from linearity. Results: It was shown that hydrazones are the class of analytes having no anomalies of retention parameters. On the contrary, several anomalies were detected for oximes. Downward deviations of points in the plots of recurrent approximations of retention times are the signs of reversible hydration. This effect for methanol–water eluents was detected for the first time. Some of oximes underwent hydrolysis. Conclusions: Recurrent approximation of retention times allows detecting chemical transformations of analytes during RP HPLC analysis.
1. Introduction
One of the general approaches in reversed-phase high-performance liquid chromatography (RP HPLC) for characterizing both analytes and sorption materials in chromatographic columns is based on the dependences of the retention parameters (retention times tR, retention volumes, retention factors, etc.) on the content of the organic component in an eluent (C, volume fraction of the organic modifier) [1,2,3,4,5,6]. As opposed to gas chromatography, in RP HPLC, it is accepted that there is no single universal equation for dependences tR(C). Several functions were proposed in the literature for approximation of these dependencies, namely, hyperbolic correlation (Scott–Kuchera approach [7]), logarithmic dependence (Soczewinski–Wachtmeister equation [8,9]), log–log model (Snyder–Soczewinski equation [8,10]), the second-degree polynomial (proposed by Schoenmakers [11]), and many others. All of these relationships are functions of retention parameters at various eluent compositions (at different ratios of organic modifier and water). If the sorption mechanism or chemical nature of an analyte remains the same within the whole range of eluent composition variations, all the equations provide more or less accurate linearization of the dependences k′(C), where k′ is retention factor [k′ = (tR−t0)/t0], and t0 is hold-up retention time. However, if the sorption mechanism or analyte speciation depends on the eluent composition, anomalies appear in approximation of the retention data. Such anomalies in k′(C) dependences (appearance of minima instead of monotonic variations) are observed for retention parameters of several pyridinium oximes [12], some 4-aminoquinoline derivatives [5], etc.
The variations of the chemical nature of analytes in an eluent can be caused by the following factors:
- i.
- Shifts of the prototropic equilibria. Such shifts may be due to variations of the concentration of an organic modifier in an eluent (an increase in its concentration causes an increase in pH):
B + H+ ⇄ [BH]+
- ii.
X + H2O ⇄ X×H2O
- iii.
- The last case seems to be not a common one, but cannot be ruled out. It is the possibility of partial or complete irreversible hydrolysis of analytes during chromatographic runs. An example is the hydrolysis of unsubstituted hydrazones of some carbonyl compounds in acidic eluents at pH < 7. Such processes seem to most likely be for compounds that are formed by condensation reactions and, consequently, are most susceptible to the hydrolysis, namely, acetals, ketals, esters, hydrazones, oximes, etc. Even a slightly acidic medium of an eluent promotes hydrolysis of such analytes.
However, up to now, most of chromatographic retention anomalies in RP HPLC were usually attributed to changes in sorption mechanisms rather than in properties of analytes.
In this connection, it is important to note that, instead of several equations [7,8,9,10,11], most of the tR(C) dependences in RP HPLC can be approximated by the single so-called recurrent relations(see refs. in [13,14]). This kind of relations is well known in mathematics, but is rarely used in chemistry:
where ΔC = const is a constant increment of the organic component concentration in an eluent (in our work, we used ΔC = 5 or 10% v/v).
tR(C + ΔC) =atR(C) + b,
Principal features of linear recurrent relations (3) have been considered in several previous papers (see [13,14] and references therein), and there is no need to consider them in detail once again. Recurrent regressions are applied to functions of integer or equidistant values of an argument. They have several unusual mathematical features. First, recurrences unite the properties of arithmetic (at a ≡ 1 and b ≠ 0) and geometric (at 0 < a ≠ 1 and b ≡ 0) progressions, which accounts for their unique approximating ability. The applicability of recurrences to equidistant values of the argument extends their applications to properties that depend on pressure, temperature, or concentrations of sample constituents. Examples of the latter two variables are the dependences of tR on temperature in gas chromatography and on the content of an organic modifier in an eluent in RP HPLC. It is noteworthy that using the recurrence relations in chromatography does not require preliminary determination or calculation of the hold-up time (t0). Another feature that seems to be important for plotting recurrent dependences is that the values of arguments are not represented in such plots; every point is fixed by two “neighboring” values of functions. Hence, the variations of any value in the initial data set lead to variations of two adjacent points on the plots.
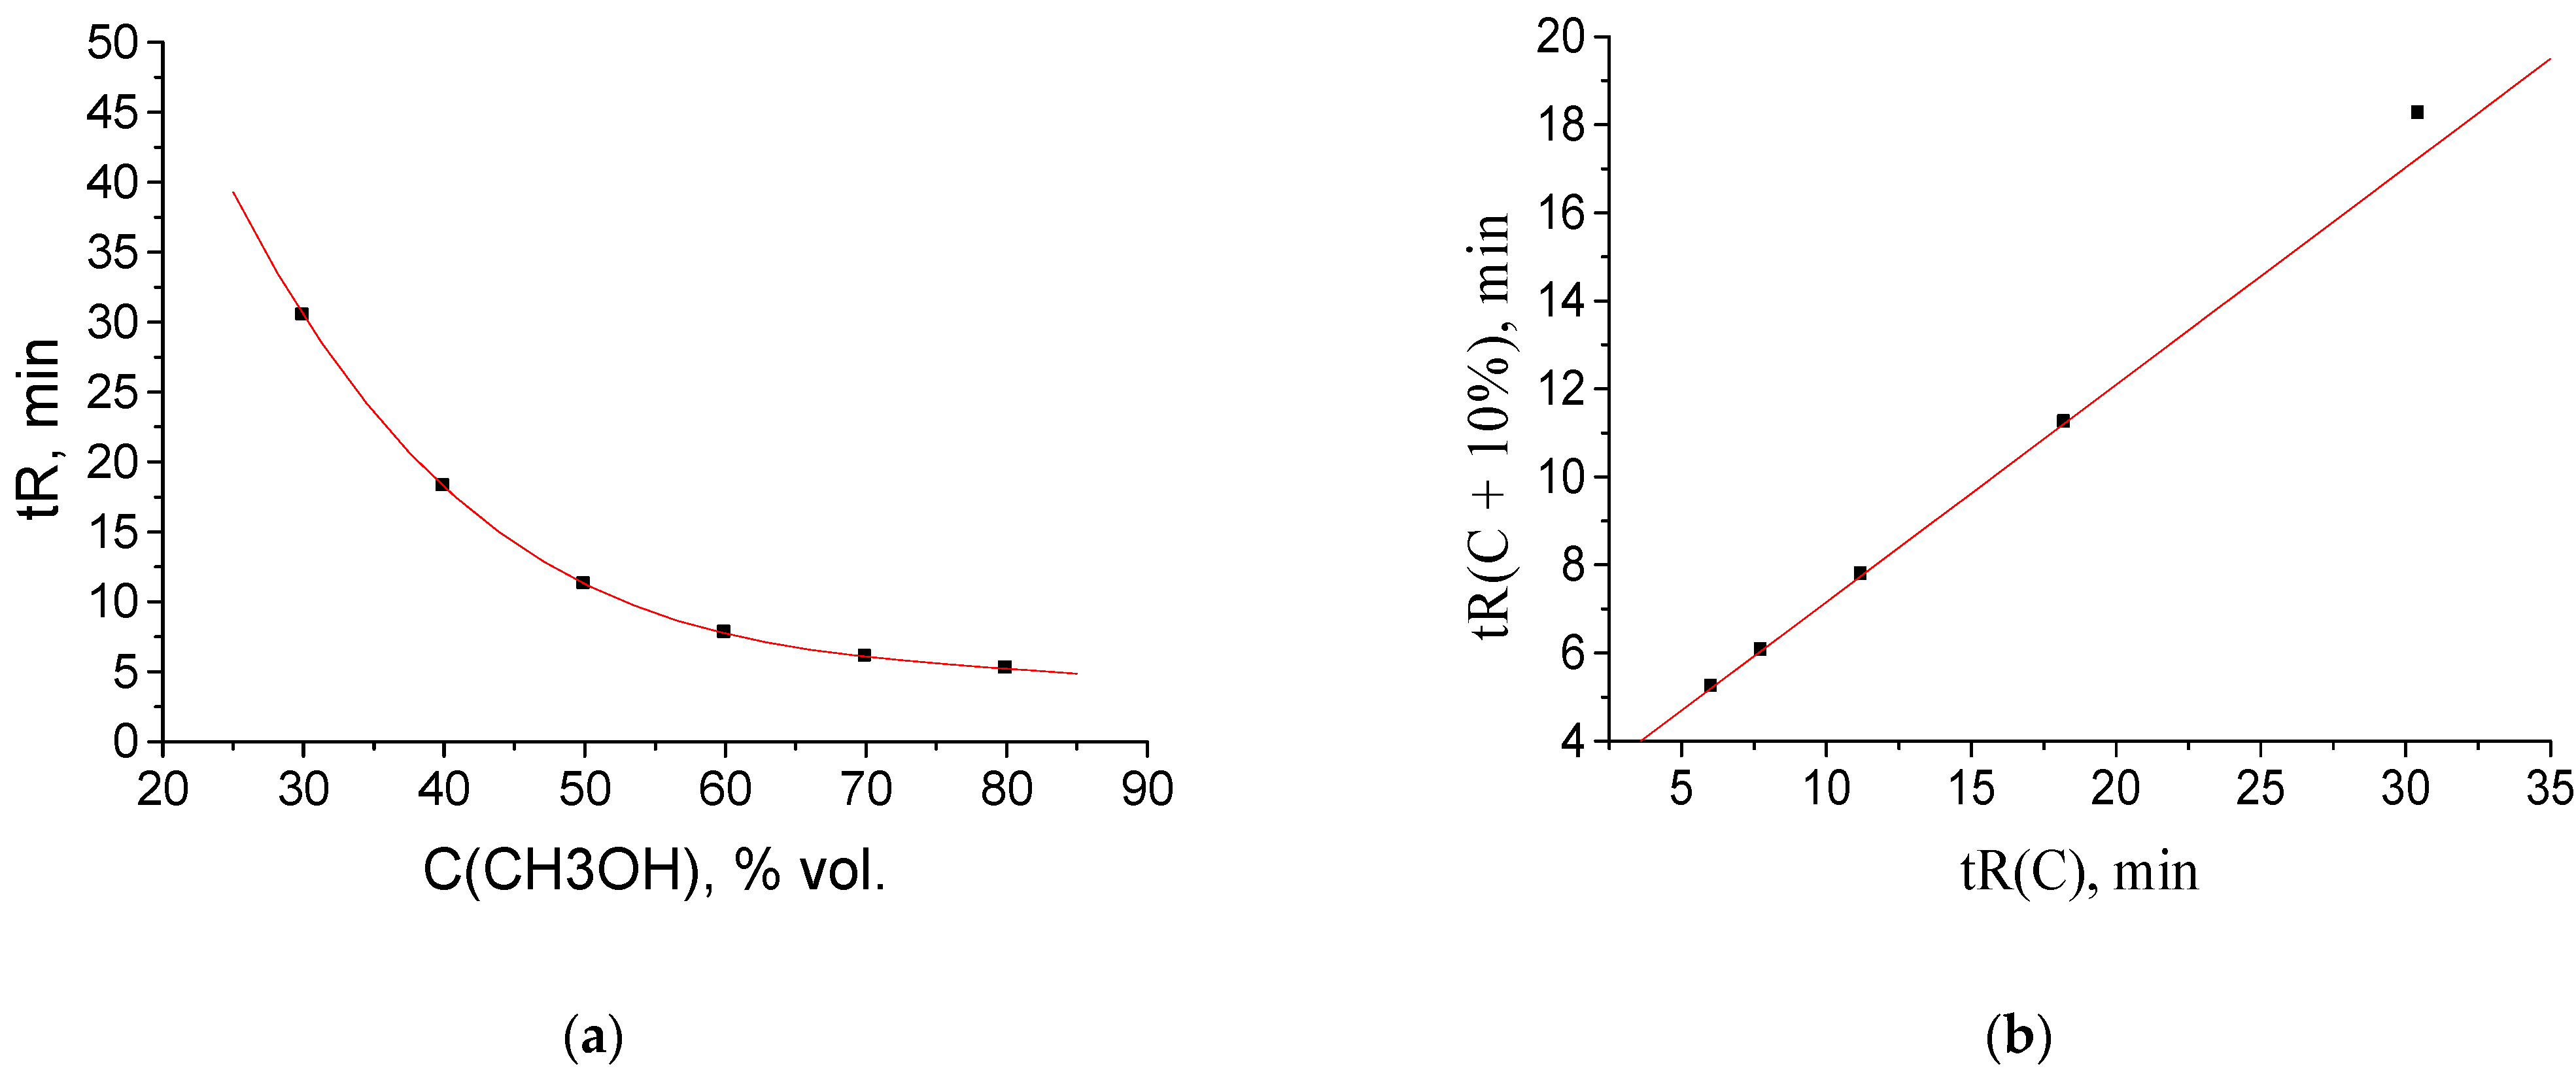
When applied to retention parameters in RP HPLC, recurrence relations (3) are characterized by correlation coefficients R > 0.999 for analytes that show no anomalies of their chemical nature or no variations of the sorption mechanism at different contents of an organic modifier in an eluent. This fact can be illustrated by the retention data for acetophenone, the first reference compound for determining retention indices (RI)in RP HPLC. The plot in Figure 1a represents the initial approximately hyperbolical dependence of acetophenone retention times, tR, on the concentration of methanol in an eluent, C. The set of tR(C) data is indicated in the caption to Figure 1. As the retention of acetophenone on C18 silica gel in RP HPLC is characterized by no anomalies, the recurrent approximation of these data at Figure 1b is linear with the correlation coefficient R = 0.99999. Other parameters of linear regression are listed in the caption of the Figure 1 as well.
If any of the above-mentioned factors (variations of sorption mechanisms and/or chemical nature of analytes) take place, the deviations of recurrent dependences (3) from the linearity can be expected. This is due to the fact that the linearization “ability” of recurrences is significant but not infinite; any changes in the ratio of two (or more) coexisting forms of analyte lead to the distortions of the linearity of the recurrent dependences.
The deviations of recurrent dependences from linearity were detected for the first time for such complex organic compounds as synthetic drugs (see refs. in [13,14]) with acetonitrile–water eluents. The subsequent analysis of the causes of this anomaly showed that it is due to the presence of highly polar sulfonamide groups –SO2–NRR′ in analyte molecules. As most of sulfonamides’ form hydrates in the crystalline state, it was assumed that the cause of retention anomalies is the reversible formation of hydrates in an eluent at high water content. To confirm this assumption, a series of N-substituted arenesulfonamides ArSO2NRR′ were synthesized and characterized; all of them exhibited the similar deviations. It should be emphasized that this effect for arenesulfonamides was observed for the water–acetonitrile eluents and but was not practically observed for the water–methanol eluents [14]. This was attributed to the preferable formation of more stable methanol hydrates. The free energy of methanol hydration was estimated experimentally at −5.1 kcal mol−1 [15]; it exceeds the hydration energies of the majority of organic compounds.
Further verification of the concept for hydrate detection in RP HPLC using recurrent approximation of retention times requires considering the following tasks:
- -
- So far as the recurrent approximation still remains to be a non-standard unusual form of data processing, a special consideration of its features and anomalies is required;
- -
- So far as the anomalies of recurrent approximation have previously been observed for acetonitrile–water eluents only, it seems reasonable to find compounds (or classes of compounds) for which these anomalies are observed in methanol–water systems.
With these aims in mind, we examined the features of recurrent approximation of retention parameters in methanol–water eluents for such compounds as unsubstituted hydrazones (I) and oximes (II) of aromatic carbonyl compounds:
ArC(R) = N–NH2 (I)
ArC(R) = NOH (II)
It is interesting that oximes are believed to be more resistant to hydrolysis than hydrazones [16]. Literature data on the formation of hydrates of organic compounds of both these classes are very limited. Formation of hydrates is confirmed for 2-acetyl-3-hydroxybenzo(b)thiophene hydrazone (CAS no. 194783-95-4, information from Merck), 1,3-diphenyl-1H-pyrazole-4-carboxaldehyde 4-nitrophenylhydrazone (CAS no. 1173017-26-9, Merck, Darmstadt, Germany), and cyclohexanone hydrazone(melting point 102–104 °C, no CAS). According to information from ChemSpider, the formation of hydrate (1:1) is confirmed for bis(3-fluorobenzylidene)hydrazine (it is not a hydrazone but the structurally related azine). Within the group of oximes, the hydrate formation is confirmed for 4-hydroxybenzaldehyde oxime [17,18], 3-(2-mercaptoethyl)-1,3-benzothiazol-2(3H)-one oxime (CAS no. 1173016-19-7), and some more complex compounds.
This study is aimed at detecting retention anomalies for a series of unsubstituted hydrazones and oximes of aromatic carbonyl compounds by considering recurrent approximations of their net retention times, relative optical densities at different wavelengths, Arel = A(254)/A(220), and retention indices (RI)together with their concentration coefficients, dRI/dC.
2. Materialand Methods
Synthesis of hydrazones and oximes. All hydrazones were synthesized from hydrazine hydrate (99%, Lenreaktiv, St. Petersburg, Russia) and corresponding aromatic carbonyl compounds: p-methylbenzaldehyde (chemical grade, Reakhim, Moscow, Russia), acetophenone, propiophenone, butyrophenone (all from Sigma–Aldrich Rus LLC, Moscow, Russia), and p-methylacetophenone (Reakhim, Moscow, Russia). The reaction of carbonyl compounds (100 μL of liquid or approx. 100 mg of solid substances) with 1 mL of hydrazine hydrate was carried out at ambient temperature in a solution with 1 mL of isopropyl alcohol (chemical grade, Kriokhrom, St. Petersburg, Russia) for homogenization of reaction mixtures. The large molar excess of hydrazine (approx. 25–30) was taken to prevent the formation of azines as the principal by-products:
ArCOR + NH2–NH2 →ArC(R) = N–NH2 (I) + [ArC(R) = N–N = C(R)Ar]
All hydrazones were analyzed directly in the reaction mixtures diluted with the mobile phase in the 1:100 ratio.
All the oximes were synthesized from hydroxylamine sulfate (Reakhim, Moscow, Russia) and corresponding aromatic carbonyl compounds in the presence of a base. The carbonyl precursors were benzaldehydes [2-methyl- (Lancaster, UK), 4-methyl-, 2-hydroxy- (Aldrich, St. Louis, MO, USA), 4-hydroxy- and 2-methoxy- (Fluka, Gillingham, Dorset, UK), 4-methoxy- (Kiev, former USSR), 3-hydroxy-4-methoxy- (vanillin, Ferak, Berlin, Germany), 4-hydroxy-3-methoxy- (isovanillin, Janssens Chimica, Beers, Belgium), and 3,4-dimethoxy- (veratric aldehyde, Acros, Geel, Belgium)] and alkyl aryl ketones C6H5COCnH2n+1 with n = 1–3 [acetophenone, propiophenone, and butyrophenone (all from Sigma–Aldrich Rus LLC, Moscow, Russia)]. The same ketones were used as reference components for calculating the hold-up time and determining the retention indices:
ArCOR + NH2OH×H2SO4 + 2NaOH → ArCR=NOH (II)+ Na2SO4 + 2H2O
The reactions of carbonyl compounds (100 μL of liquid or approx. 100 mg of solid substances, 0.65–0.80 mM) with approx. 100 mg of hydroxylamine sulfate (0.80 mM) and approx. 40 mg of sodium hydroxide (1 mM, Reakhim, Moscow, Russia) were carried out in 2–4 mL of isopropyl alcohol (chemical grade, Kriokhrom, St. Petersburg, Russia). The reaction mixtures were kept at ambient temperature for approx. 24 h with intermittent stirring to complete the reactions, which was followed by dilution with the mobile phaseby a factor of 103.
All oximes as well as hydrazones were characterized directly in reaction mixtures (without isolation). This is permitted if their formation can be considered as a derivatization reaction [19].
Conditions of HPLC analysis. Chromatographic analyses of reaction mixtures were performed using a Shimadzu LC-20 Prominence liquid chromatograph equipped with a diode-array detector and Phenomenex C18 columns 250 mm long and4.6 mm i. d. with a sorbent particle size of 5 μm. Water–methanol mobile phases were used in several isocratic modes with 5 or 10% concentration steps of the organic component at an eluent flow rate of 1.0 mL min−1 and column temperature of 30 °C. No acidic substances were added to the eluent. The samples were injected using an SIL-20A/AC autosampler; the sample volume was 20 μL. To prepare eluents, we used deionized water (resistivity 18.2 MΩcm) prepared using a Milli-Q device (Millipore, St. Louis, MO, USA), acetonitrile (HPLC-gradient grade, Panreac, Castellar del Valles, Spain), and methanol (analytical grade, Kriokhrom, St. Petersburg. Russia).The pH values of the eluent were 6.2–6.3. The number of replicate injections of each sample was 2–3. The inter injection variations of the retention times of the target analytes in all the cases did not exceed 0.01–0.02 min.
Data processing. All hydrazones and oximes were characterized by logarithmic (Kovats) retention indices under the conditions of isocratic elution [20]:
where tR′, tR.n′, and tR,n+k′are the adjusted retention times of the target analyte and reference n-alkyl phenyl ketones C6H5COCnH2n+1, RIn = 100nC (nC is the total number of carbon atoms in a molecule) with the closest retention times, tR′ = tR−t0, k ≥ 1.
RIx = RIn + (RIn+k−RIn) [log(tR,x′) − log(tR,n′)]/[log(tR,n+k′) − log(tR,n′)],
The retention times of the theoretically nonsorbed component (hold-up time, t0) were evaluated from the net retention times of three reference n-alkyl phenyl ketones using Peterson and Hirsch equation [21]:
t0 ≈ (tR,1tR,3 − tR,22)/(tR,1 + tR,3 − 2tR,2)
The data were statistically processed using Excel software (Microsoft Office, 2010). ORIGIN software (versions 4.1 and 8.1) was used for calculating the parameters of recurrences and plotting the regression equations.
Allhydrazones and oximes were characterized by relative optical densities at different wavelengths:
where λ1 was selected as 254 nm and λ2, as 220 nm.
Arel = A(λ1)/A(λ2) ≈ S(λ1)/S(λ2)
The Arel values were used for controlling the completeness of the transformation of carbonyl compounds to oximes. In addition, they are informative for revealing possible changes in the chemical nature of analytes at different concentrations of an organic modifier in an eluent.
3. Results and Discussion
Identifying anomalies of recurrent approximation by numerical experiments. So far as recurrent approximation of retention parameters in RP HPLC is still a nonstandard method of data processing, a special consideration of its features seems to be desirable. Let us start the discussion with the experimental dependences tR(C) and corresponding recurrent approximation for acetophenone, presented in Figure 1 above. Nonlinear dependence tR(C) in RP HPLC (a) can be approximated by various functions (hyperbolic, exponential, polynomial, etc.) with the comparable accuracy. The curves of approximation with 4th degree polynomials are shown for all the cases considered below. This approach is similar to the proposition of R. Kaiser [22] 4th use 5th degree polynomials for approximating most of chromatographic dependences. As for the recurrent approximation (b), it is a practically straight line (correlation coefficient R = 0.99999) due to the absence of any retention anomalies for acetophenone (It is interesting that n-alkyl phenyl ketones having no retention anomalies in RP HPLC were chosen, maybe intuitively, as the reference compounds for the determination of retention indices in the mid-1980s).
The numerical experiments discussed below consist in the artificial distortions of some tR values in the initial data set. To optimize the discussion, let us restrict these distortionsby shifting the maximal tR values only, which correspond to the maximal content of water in an eluent.
The first kind of distortion is a hypothetical increase in the value of 32.464 min by two minutes (for methanol contentC = 30% v/v), namely 32.464 → 34.464 min. Such deviation has practically no effect on the shape of dependence tR(C), as can be seen in Figure 2a. It means that one cannot detect such anomaly visually by considering the “raw” retention data. Moreover, the applications of the known mathematical methods of data processing (e.g., numerical differentiation, or finite-differences method [23,24]) do not allow us to detect anomalous values and flag them. At the same time, recurrent approximation of retention times immediately allows us to find the anomalous rightmost point on the plot; it deviates downwards from the regression line.
Hence, the following rule can be formulated: the downward deviation of the rightmost point on the plot of the recurrent approximation of retention times from the regression line is the sign of the anomalous increase in the maximal tR value within the data set above its “normal” value. Using the same logical scheme of numerical experiment, if we decrease the value of 32.464 min by two minutes (→30.464 min), the corresponding point appears to be shifted upwards from the regression line, as shown in Figure 3b. Similarly to the previous case, no visually detected anomalies are observed in the tR(C) plot (Figure 3a).
A more complex case for visual perception using recurrent approximation is a simultaneous shift of two points from their “normal” values (see caption to Figure 1). Let us increase two tR values, namely, 18.244 → 20.244 and 32.464 → 34.464 min. This case corresponds to A rather unusual shift of two points on the plot of recurrent data approximation from the regression line: the rightmost point appears to be located above the regression line, whereas the previous one is located below it, as illustrated in Figure 4.
The downward shifts of two retention times (e.g., 18.244 → 16.244 and 32.464 → 30.464 min) expectedly lead to opposite deviations of two points on the plot (Figure 5b)relative to the case shown in Figure 4.
These unusual graphical representations of distorted sets of retention times are accounted for just by specific properties of recurrent regressions. After these simplest examples (when tR values of one or two points were distorted), let us consider the example when four minimal tR values are increased by two minutes each. A graphical manifestation of such distortions is illustrated in Figure 6. The rest of non-distorted tR values correspond to the rest of the initial data set (straight fragment in Figure 6a), when four distorted tR values(three points) form a new straight fragment (Figure 6b). Similar cases are observed for recurrent approximation of the temperature dependence of solubility of inorganic salts in water [25].Let us consider the case when, at high temperatures, the salts exist in the non-hydrated form in solutions, and at low temperatures, in hydrated forms. In this case, the recurrent data approximation consists of two straight linear fragments. Hence, two different linear sections in the recurrent plots of tR(C) dependences are the sign of the coexistence and/or interconversion of two chemical forms of analytes.
To summarize the results of these numerical experiments, it should be noted that most the cases mentioned above were found among recurrent approximations of retention times of any analytes under RP HPLC conditions considered below.
Revealing compounds capable of chemical transformations during RP HPLC separation. As noted in the introduction, there is a class of organic compounds capable of reversible hydrate formation under RP HPLC conditions: it is N-substituted arenesulfonamides. The nonlinearity of recurrent approximations of their retention times appeared to be visually detectable only when acetonitrile–water eluents were used; the analogous dependences for methanol–water eluents turned out to be practically linear. Hence, a question arises: is the linearity of the recurrent dependences a property of the methanol–water eluents, or are there analytes that form hydrates even in the presence of methanol? To answer this question, two series of derivatives of aromatic carbonyl compounds were synthesized: unsubstituted hydrazones ArC(R)=N–NH2 and oximes ArRC(R)=N–OH. The choice of these derivatives is governed by the literature data on the existence of hydrated forms for some of them (see Introduction).
All compounds (hydrazones, oximes, and initial aromatic aldehydes and ketones) were characterized with net retention times, parameters of their recurrent approximations, retention indices (RI), concentration coefficients of retention indices, dRI/dC(primarily foroximes), relative optical densities Arel = A(254)/A(220), and (for hydrazones and oximes) differences between their RIs and initial carbonyl compounds, ΔRI.
Unsubstituted hydrazones (of three aldehydes and four ketones) show no anomalies of retention and auxiliary parameters at the methanol content in the eluent within the range 50–85% with the step of 5%. Thus, considering such analytes is not of immediate interest. Nevertheless, the “condensed” analytical data for hydrazones are presented in Table 1 as an example of the class of organic compounds having no retention anomalies in RP HPLC. This table, along with molecular weights (MW) of hydrazones, includes such “compressed” analytical data as the correlation coefficients of recurrent approximation of retention times (R), concentration coefficients of retention indices (dRI/dC) with standard deviations ±sdRI/dC, average values of relative optical densities, <Arel>, and average values of differences between RIs of hydrazones and initial carbonyl compounds.
High values of correlation coefficients (R) confirm the linearity of recurrent approximations of retention times of hydrazones, so there is no need to illustrate this fact with plots (in all cases, they are approximately linear). The similarity of Arel values may be used (i) as an indicator of the constancy of a chromophore in analyte molecules, (ii) as a criterion of neglecting any interactions of analytes with eluent components, and (iii) as an additional criterion for identification of analytes in RP HPLC. All <Arel> values are close to each other for all analytes except 2-hydroxybenzaldehyde hydrazone (due to the different chromophore type; oxygen atom of hydroxyl group is conjugated with aromatic system) and 2-methylbenzaldehyde hydrazone (weaker conjugation of aromatic system and CH=N fragment due to steric hindrance produced by the methyl substituent in ortho-position).
The concentration coefficients of retention indices, dRI/dC±sdRI/dC, are slightly different for hydrazones of aldehydes (from −0.6 to 0.11) and of ketones (from −0.1 to 2.3). The similar differences between derivatives of aldehydes and ketones are observed in ΔRI values: −132 ± 30 for hydrazones of aldehydes and−78 ± 17 for hydrazones of ketones. Both these facts may be of analytical interest for distinguishing the chemical nature of carbonyl compounds.
As compared to unsubstituted hydrazones, the data for oximes of aromatic carbonyl compounds (nine aldehydes and three ketones) exhibit a noticeable number of retention anomalies in RP HPLC. Therefore, their more detailed consideration is necessary. The information on chromatographic parameters of oximes of aromatic carbonyl compounds is summarized in Table 2.
For each oxime, this table includes the net retention times at the methanol concentrations (C) within the range 30–80% v/v with 10% step (in some cases, these ranges were reduced, as indicated in Table 2), retention indices, relative optical densities Arel = A(254)/A(220), corresponding Arel values for the initial carbonyl compounds (for confirming the completeness of their conversion), and differences between the retention indices of the oximes and carbonyl precursors, ΔRI. The “integrated” analytical parameters include the correlation coefficients of recurrent approximation of retention times (R) and concentration coefficients of retention indices, dRI/dC. If the dependence of Arel on C is clearly expressed, the parameters of linear regression Arel = aC + b are presented; otherwise, the average values <Arel> with the corresponding standard deviations are given. If no anomalies are observed within the sets of analytical parameters at different methanol contents, they are marked with symbol NA (No Anomalies).
The anomalous values of tR, RI, and Arel in Table 2 are marked in bold. If these outliers exceed the average values for other data (upward deviations from the regression lines), they are additionally marked with symbol “↑”, and in the case of downward deviations, with symbol “↓”. For example, the value of Arel for 4-methylbenzaldehyde oxime (0.83↓) at C(CH3OH) = 40% is smaller than all other values (within the range 1.07–1.86, average value 1.6 ± 0.4).
At first glance, oximes seem to be more hydrophilic than their carbonyl precursors because of the presence of so-called active hydrogen atom in the OHgroup. However, comparison of the ΔRI values for these compounds does not confirm this conclusion: The average differences ΔRI = RI(oxime) − RI(carbonyl compound) do not statistically significantly differ from zero and are equal to −20 ± 28 (aldehyde oximes, cf. −132 ± 30 for aldehyde hydrazones) and −6 ± 21 (ketone oximes, cf. −78 ± 17 for ketone hydrazones). This inconsistency between different polarity and/or hydrophilicity/hydrophobicity characteristics is a known fact, well commented in the review by Katritzky et al. [26]. Some oximes demonstrate extremely large variations of ΔRI values with increasing methanol content of the eluent from 30 to 80%. For instance, for vanillin oxime, these variations are from −27 to −276; for isovanillin oxime, from −55 to −272; and for 3,4-dimethoxybenzaldehyde oxime, from −7 to −219 i.u. However, this may be a result of the presence of other functional groups in the molecules. The additional heuristic value of these large negative ΔRI values is that they confirm the conversion of aromatic carbonyl compounds into the corresponding oximes. At the same time, this fact makes any algorithms of RI precalculation in RP HPLC considerably less reliable; this inconstancy restricts the applicability of additive schemes to evaluating retention indices.
Similar discrepancies can be traced for other polarity characteristics. If we compare such “classical” variables as dipole moments (μ) and dielectric permittivity (ε), both of them are higher for carbonyl compounds. For instance, for benzaldehyde, μ = 2.9 D and ε = 17.8, whereas for benzaldoxime, μ = 0.9 D and ε = 3.8. On the other hand, the values of the hydrophobicity factor logP are comparable for the carbonyl compounds and their oximes, as is illustrated by the reference data in Table 3:
As shown recently by special experiments, the more polar the analyte, the lower the concentration coefficient of retention indices, dRI/dC. Hence, these coefficients can be recommended as another polarity characteristic. So far as the coefficients dRI/dC for aromatic oximes (from −1.2 to −1.6) appeared to be lower than for their carbonyl precursors (from −0.3 to 4.6), and in most cases had even the opposite sign, this polarity criterion is opposite to the previous one.
Joint consideration of the Arel and ΔRI values is of interest to distinguish initial carbonyl compounds and their oximes. In other words, their parameters allow us to control both the completeness of the carbonyl → oxime derivatization or the possible hydrolysis of oximes in an eluent. The Arel and ΔRI values for carbonyls and oximes statistically significantly differ for nine compounds out of twelve. Only three analytes appeared to be “suspicious” in accordance with these criteria: oximes of 2-hydroxy- and 4-hydroxybenzaldehydes and acetophenone oxime (Table 2). For example, the average difference of Arel values for 2-hydroxybenzaldehyde oxime and corresponding aldehyde itself is 0.06 ± 0.12. In combination with the average ΔRI value of 2 ± 4 only, we must conclude that we deal with the same analyte (no conversion of the initial carbonyl compounds to oxime or hydrolysis of the oxime). The second example is 4-hydroxybenzaldehyde oxime, for which <ΔArel> = 0.02 ± 0.02 and ΔRI(60–80% CH3OH) = 1 ± 2 i.u. (index units). The last suspicious analyte is acetophenone oxime, for which <ΔArel> = −0.5 ± 0.3, but ΔRI(30–80% CH3OH) = 6 ± 6 i.u. The anomalous properties of acetophenone oxime are confirmed by strong dependence Arel = aC + b (a = −0.04 ± 0.01, b = 5.0 ± 0.4). In the case of 4-methylbenzaldehyde oxime, RI values are close to each other, but Arel values are statistically different.
Several causes of this anomaly should be considered. The first version is no reaction between the “problematic” carbonyl compounds and hydroxylamine. The second possible cause is rapid hydrolysis of oximes at the moment of dissolving the reaction mixtures (basic media) in a large amount of a water-containing eluent. Finally (third cause), the hydrolysis of oximes seems to be possible during separation within the chromatographic column. This process was observed for unsubstituted hydrazones of aromatic aldehydes separated using eluents containing acidic additives [15]. Hence, the most likely cause for the anomalies observed for the three oximes is the second factor: rapid hydrolysis of oximes during dissolution of reaction mixtures in the eluent. All the dRI/dC values determined for such “problematic” oximes were excluded from further consideration.
Anomalies in recurrent approximation of retention times of oximes. The results of numerical experiments (see above) confirm the existence of several kinds of anomalies in the recurrent approximation of retention times. The most common anomaly appears to be the downward deviation of the points corresponding to the highest water content in an eluent from the regression lines. Such deviations suggest the conversion of analytes to more hydrophilic forms, in particular, reversible formation of hydrates (Equation (2)). Among the compounds considered in this work, such behavior has been confirmed for oximes of 4-methyl-, 2-methoxy-,and 3,4-dimethoxybenzaldehyde oximes. The recurrent approximation of retention times for 2-methoxybenzaldehyde oxime is plotted in Figure 7 as an example. It is completely analogous to the plot of numerical experiment results, shown in Figure 2:
It should be noted that the downward deviations of points from regression lines due to formation of hydrates were observed previously for acetonitrile–water eluents only. Just oximes of aromatic carbonyl compounds demonstrate similar deviations with the methanol–water eluents. Hence, this effect (deviations caused by hydrate formation) is general and it is not a specific property of acetonitrile-containing eluents.
Another kind of transformations of analytes that may affect the linearity of recurrent approximations of retention times may be shifts of the prototropic equilibria (Equation (2)). However, in the case of oximes, these processes can be neglected because their pKa values strongly exceed pH of the eluent (approx. 6.2–6.3), as shown in Table 4:
If the downward deviations of points in the plots of recurrent tR approximations mean the reversible formation of more hydrophilic hydrated forms of analytes, then, following the same logics, the upward deviations of points should mean the transformation of analytes into more hydrophobic forms. It should be noted that no examples of upward deviations of points in the plots of recurrent approximations of retention times (cf. Figure 3) are observed for oximes, because hydrates cannot be more hydrophobic than the initial analytes. Maybe examples of such deviations will be found in the future for other organic compounds.
Instead of that, a rare anomaly was found for propiophenone oxime (Table 2). The plot of recurrent approximation of its retention times has two anomalous points; one of them(not the rightmost point, but the previous one also), the point tR(40)–tR(50), is located above the regression line, whereas the rightmost point tR(30)–tR(40) is located below the regression line (Figure 8).
This case is rather similar to one of the numerical experiment results presented in Figure 6. It means that not one, but two maximal values of retention times (at two minimal contents of methanol in the eluent, 30 and 40%) are underestimated. Thus, it is the same effect as those for other oximes (one point is distorted), but more pronounced (two points are distorted). In other words, the hydration of propiophenone oxime is observed at the lower content of water in the eluent than for some other oximes.
Finally, the interesting anomaly of recurrent approximation of retention times is observed for 2-methylbenzaldehyde oxime; the plot of this dependence is shown in Figure 9.
Instead of a straight line, or a straight line with one or two outlying points, the plot consists of two straight segments. One of them (a) is formed by two points corresponding to the maximal tR values for eluents with maximal water content, and the second one (b), by three points, tR values for eluents with lower water content. Keeping in mind the analogy with the temperature dependence of the solubility of inorganic salts in water [26], this pattern may be caused by the existence of two relatively stable forms of this oxime. At present, it is still difficult to establish what exactly these forms are. The boundary between the hydrated forms of analytes and any products with chemically bound water can be quite blurred. In any case, this kind of anomaly of recurrent approximations of retention times in RP HPLC requires further consideration.
4. Conclusions
Recurrent approximation of retention parameters in RP HPLC proved to be useful in identifying small anomalies in their values that are difficult to detect otherwise, namely, in confirming the reversible hydration of analytes. Before starting this work, these potentialities of recurrent approximations were revealed for a restricted set of organic compounds with acetonitrile–water eluents only. Hence, the expansion of the range of chemically different analytes and characterization of methanol–water eluents seem to be topical problems. In this connection, two kinds of derivatives of aromatic carbonyl compounds were characterized: unsubstituted hydrazones and oximes.
Theoretical consideration of the possible anomalies (one, two, or more retention times deviated from their “normal” values) appeared to be useful in their explanation. The downward deviations of points corresponding to the highest water content from the regression lines mean the reversible conversion of analytes to more hydrophilic forms, most often, their hydration. The deviations of two points in opposite directions from the regression line suggest the same but more pronounced effect. The “limiting” case is when the plots of recurrent approximation consist of two straight-line segments. By analogy with the temperature dependence of the solubility of inorganic salts in water (when hydrated and non-hydrated forms are observed), this can be attributed to the existence of two different chemical forms of analytes.
Hydrazones of aromatic carbonyl compounds have no anomalies of their retention parameters in RP HPLC. On the contrary, several kinds of anomalies were revealed for oximes. First, some oximes undergo hydrolysis; it most likely happens at the moment of dissolving the reaction mixtures in the methanol–water eluent. The downward deviations of points in the plots of recurrent approximation of retention times of several oximes can be interpreted as the sign of their reversible hydration. For methanol–water eluents, this effect was detected for the first time.
Author Contributions
Formulation and development of recurrent approximation concept, selection and synthesis of analytes, manuscript preparation (I.G.Z.); all HPLC experiments and data processing (A.D.). All authors have read and agreed to the published version of the manuscript.
Funding
The work was not supported by any funds. It was carried out as a part of the educational program for foreign postgraduate students at the Institute for Chemistry of St. Petersburg State University.
Data Availability Statement
The complete set of experimental data of this work will be available in PhD thesis of Abdennour Derouiche that is under preparing for presentation.
Acknowledgments
All HPLC experiments were performed at the Center of Chemical and Material Research, Research Park of St. Petersburg State University. The authors are grateful to the staff of this Center for the assistance.
Conflicts of Interest
The authors declare no conflicts of interest.
References
- Snyder, L.R.; Kirkland, J.J.; Dolan, J.W. Introduction to Modern Liquid Chromatography; JohnWiley&Sons: New York, NY, USA, 2009. [Google Scholar]
- Soczewinski, E. Quantitative retention-eluent composition relationships in liquid chromatography. J. Liquid Chromatogr. 1980, 3, 1781–1806. [Google Scholar] [CrossRef]
- Sander, L.C.; Field, L.R. Effect of eluent composition on thermodynamics properties in high-performance liquid chromatography. Anal. Chem. 1982, 52, 2009–2013. [Google Scholar] [CrossRef]
- Saifutdinov, B.R.; Davankov, V.A.; Il’in, M.M. Thermodynamics of the sorption of 1,3,4-oxadiazole and 1,2,4,5-tetrazine derivatives from solutions on hypercrosslinked polystyrene. J. Phys. Chem. A 2014, 88, 358–364. [Google Scholar] [CrossRef]
- Paramonova, A.S.; Kurbatova, S.V.; Zemtsova, M.N. Physicochemical characteristics of the sorption of 4-aminoquinoline derivatives from water-acetonitrile solutions on nonpolar sorbents. J. Phys. Chem. A 2014, 88, 318–322. [Google Scholar] [CrossRef]
- Saifutdinov, B.R.; Buryak, A.K. The influence of water-acetonitrile solvent composition on thermodynamic characterization of adsorption of aromatic heterocycles on octadecyl-bonded silica gels. Colloid J. 2019, 87, 754–761. [Google Scholar] [CrossRef]
- Row, K.H. Comparison of retention models for the dependence of retention factors on mobile phase composition in reversed-phase high-performance liquid chromatography. J. Chromatogr. A 1998, 797, 23–31. [Google Scholar] [CrossRef]
- Soczewinski, E. Mechanistic molecular model of liquid-solid chromatography retention-eluent composition relationships. J. Chromatogr. A 2002, 965, 109–116. [Google Scholar] [CrossRef]
- Soczewinski, E.; Wachtmeister, C.A. The relation between the composition of certain ternary two-phase solvent systems and RM values. J. Chromatogr. 1962, 7, 311–320. [Google Scholar] [CrossRef]
- Soczewinski, E. Solvent composition effects in thin-layer chromatography systems of the type silica gel-electron donor solvent. Anal. Chem. 1969, 41, 179–182. [Google Scholar] [CrossRef]
- Schoenmakers, P.J.; Billiet, H.A.H.; Tijssen, R.; De Galan, L. Gradient selection in reversed-phase liquid chromatography. J. Chromatogr. A 1978, 149, 519–537. [Google Scholar] [CrossRef]
- Dohnal, V.; Musilek, K.; Kuca, K. Retention behavior of pyridinium oximes on PFP stationary phase in HPLC. J. Chrom. Sci. 2013, 52, 246–251. [Google Scholar] [CrossRef] [PubMed]
- Zenkevich, I.G.; Derouiche, A.; Nikitina, D.A. Detection of organic hydrates in reversed phase high performance liquid chromatography using recurrent approximation of their retention times. J. Liquid Chromatogr. Relat. Technol. 2021, 44, 588–598. [Google Scholar] [CrossRef]
- Zenkevich, I.G.; Derouiche, A.; Nikitina, D.A. Evidence for the Hydration of Some Organic Compounds during Reverse-Phase HPLC Analysis. Molecules 2023, 28, 734. [Google Scholar] [CrossRef] [PubMed]
- Zhong, Y.; Warren, G.L.; Patel, S. Thermodynamic and structural properties of methanol-water solutions using non-additive interaction model. J. Comput. Chem. 2008, 29, 1142–1152. [Google Scholar] [CrossRef] [PubMed]
- Kalia, J.; Reines, R.T. Hydrolytic stability of hydrazones and oximes. Angew. Chem. Int. Edn. 2008, 47, 7523–7526. [Google Scholar] [CrossRef] [PubMed]
- Jerslev, B.; Larsen, S. Hydrogen bonding and stereochemistry of ring-hydroxylated aromatic aldehyde oximes, Crystal structure of three 4-OH-substituted benzaldehyde oximes. Acta Chem. Scand. 1991, 45, 285–291. [Google Scholar] [CrossRef]
- Jerslev, B.; Larsen, S. Crystallization and crystal structure at 122K of anhydrous (E)-4-hydroxybenzaldehyde oxime. Acta Chem. Scand. 1992, 46, 1195–1199. [Google Scholar] [CrossRef]
- Zenkevich, I.G. Derivatization of Analytes in Chromatography: General Aspects. In Encyclopedia of Chromatography, 3rd ed.; Cazes, J., Ed.; Taylor & Francis: New York, NY, USA, 2010; Volume 1, pp. 562–566. [Google Scholar]
- Zenkevich, I.G. Kovats’ Retention Index System. In Encyclopedia of Chromatography, 3rd ed.; Cazes, J., Ed.; Taylor & Francis: New York, NY, USA, 2010; Volume 2, pp. 1304–1310. [Google Scholar]
- Peterson, M.L.; Hirsch, J. A calculation for locating the carrier gas front of a gas-liquid chromatogram. J. Lipid Res. 1959, 1, 132–134. [Google Scholar] [CrossRef]
- Kaiser, R.E.; Rackstraw, A.J. Computer Chromatography; Dr.Alfred Huthig Verlag GmbH: Heidelberg, Germany, 1983; Volume 1. [Google Scholar]
- Demidovich, B.; Maron, I.; Shuvalova, E. Numerical Methods of (Mathematical) Analysis; NaukaPublic: Moscow, Russia, 1967. (In Russian) [Google Scholar]
- Boehm, W.; Prautzsch, H. Numerical Methods; A. K. Peters/CRCPress: Braunschweig/Wiesbaden, Germany, 1993. [Google Scholar]
- Zenkevich, I.G. Recurrent approximation of the temperature dependence of the solubility of inorganic salts in water. J. Phys. Chem. A 2021, 95, 1358–1371. [Google Scholar] [CrossRef]
- Katritzky, A.R.; Fara, D.C.; Yang, H.; Tamm, K.; Tamm, T.; Karelson, M. Quantitative measures of solvent polarity. Chem. Rev. 2004, 104, 75–98. [Google Scholar] [CrossRef] [PubMed]
Figure 1.
(a) Plot of the acetophenone retention time (min) vs. methanol concentration in the eluent, tR(C): 32.464(30), 18.244(40), 11.230(50), 7.774(60), 6.052(70), and 5.226(80); (b) recurrent approximation of these data: tR(C + 10%) = atR(C) + b. Parameters of the linear regression: a = 0.4932 ± 0.0005, b = 2.231 ± 0.008, R = 0.99999, S0 = 0.01.

Figure 2.
(a) Plot of the acetophenone retention time (one point is shifted: 32.464 → 34.464 min) vs. methanol concentration in the eluent, tR(C); (b) recurrent approximation of these data: tR(C + 10%) = atR(C) + b. Parameters of the linear regression (without outlying point): a = 0.4932 ± 0.0005, b = 2.231 ± 0.008, R = 0.99999, S0 = 0.01.

Figure 3.
(a) Plot of the acetophenone retention time (one point is shifted: 32.464 → 30.464 min) vs. methanol concentration in the eluent, tR(C); (b) recurrent approximation of these data: tR(C + 10%) = atR(C) + b. Parameters of the linear regression (without outlying point) are the same as in the caption to Figure 2.

Figure 4.
(a) Plot of the acetophenone retention time (two points are shifted: 18.244 → 20.244, 32.464 → 34.464 min) vs. methanol concentration in the eluent, tR(C); (b) recurrent approximation of these data: tR(C + 10%) = atR(C) + b.
Figure 4.
(a) Plot of the acetophenone retention time (two points are shifted: 18.244 → 20.244, 32.464 → 34.464 min) vs. methanol concentration in the eluent, tR(C); (b) recurrent approximation of these data: tR(C + 10%) = atR(C) + b.

Figure 5.
(a) Plot of the acetophenone retention time (two points are shifted: 18.244 → 16.244, 32.464 → 30.464 min) vs. methanol concentration in the eluent, tR(C); (b) recurrent approximation of these data: tR(C + 10%) = atR(C) + b.
Figure 5.
(a) Plot of the acetophenone retention time (two points are shifted: 18.244 → 16.244, 32.464 → 30.464 min) vs. methanol concentration in the eluent, tR(C); (b) recurrent approximation of these data: tR(C + 10%) = atR(C) + b.

Figure 6.
Recurrent approximation of acetophenone retention times (four points are shifted: 5.226 → 7.226, 6.052 → 8.052, 7.774 → 9.774, 11.230 → 13.230 min), tR(C + 10%) = atR(C) + b: (a) linear regression line for the subset of non-distorted data and (b) the same for the subset of distorted points.

Figure 7.
The plot illustrating the anomaly (the point below the regression line) in the recurrent approximation of retention times for 2-methoxybenzaldehyde oxime. Parameters of the linear regression (without outlier): a = 0.4763 ± 0.0006, b = 2.144 ± 0.007, R = 1.000, S0 = 0.006.
Figure 7.
The plot illustrating the anomaly (the point below the regression line) in the recurrent approximation of retention times for 2-methoxybenzaldehyde oxime. Parameters of the linear regression (without outlier): a = 0.4763 ± 0.0006, b = 2.144 ± 0.007, R = 1.000, S0 = 0.006.

Figure 8.
The plot illustrating the anomalous locations of two points in the recurrent approximation of retention times for propiophenone oxime. Parameters of the linear regression (without two outliers): a = 0.41 ± 0.02, b = 2.144 ± 0.007, R = 0.9993, S0 = 0.15.
Figure 8.
The plot illustrating the anomalous locations of two points in the recurrent approximation of retention times for propiophenone oxime. Parameters of the linear regression (without two outliers): a = 0.41 ± 0.02, b = 2.144 ± 0.007, R = 0.9993, S0 = 0.15.

Figure 9.
The plot illustrating the anomalous locations of points in the recurrent approximation of the retention times for 2-methylbenzaldehyde oxime (two subsets of points corresponding to two straight-line segments): (a) maximal tR values for eluents with high water content and (b) minimal tR values for eluents with lower water content.


Table 1.
Some “compressed” analytical data for unsubstituted hydrazones of aromatic carbonyl compounds at the methanol content C(CH3OH) in the eluent in the range 50–85% v/v: molecular weights (MW), correlation coefficients of recurrent approximation of retention times (R), concentration coefficients of retention indices (dRI/dC) with standard deviations, sdRI/dC, average values of relative optical densities within the same range of C(CH3OH), <Arel>, and average values of RI differences between hydrazones and initial carbonyl compounds, ΔRI.
| Initial Carbonyl Compound | MW of Hydrazone | R | dRI/dC ±sdRI/dC | <Arel> | ΔRI |
|---|---|---|---|---|---|
| Acetophenone | 134 | 0.9995 | −0.1 ± 0.1 | 1.16 ± 0.09 | −64 ± 2 |
| 2-Methylbenzaldehyde | 134 | 0.9996 | −0.6 ± 0.1 | 0.60 ± 0.04 | −143 ± 6 |
| 4-Methylbenzaldehyde | 134 | 0.9997 | 0.11 ± 0.06 | 0.98 ± 0.07 | −155 ± 4 |
| 4-Methylacetophenone | 148 | 0.995 | 4.3 ± 1.0 | 1.18 ± 0.03 | −70 ± 22 |
| Propiophenone | 148 | 0.99992 | 2.3 ± 0.5 | 1.13 ± 0.10 | −74 ± 16 |
| Butyrophenone | 162 | 0.99995 | 1.6 ± 0.4 | 1.16 ± 0.09 | −103 ± 11 |
| 2-Hydroxybenzaldehyde | 136 | 0.9997 | −0.6 ± 0.1 | 0.44 ± 0.03 | −98 ± 14 |
Table 2.
Some analytical parameters of oximes of aryl-substituted aromatic carbonyl compounds at different content of methanol in the eluent (C), retention times (tR), retention indices (RI) and values of dRI/dC, relative optical densities Arel = A(254/220) as a function of C, and differences ΔRI = RI(oxime) − RI(carbonyl compound). Anomalous values are marked in bold with the indication of the deviation direction (upwards ↑ or downwards ↓). The dash means that the measurement at this concentration was not carried out. The abbreviation “NA” in the column “Comment” means “No anomalies”.
| Initial Carbonyl Compoud | MW of Oxime | Analytical Parameter | Content of Methanol in the Eluent,C, % v/v | Comments | |||||
|---|---|---|---|---|---|---|---|---|---|
| 30 | 40 | 50 | 60 | 70 | 80 | ||||
| 2-Methylbenzaldehyde | 135 | tR, min | 31.262 | 21.736 | 14.261 | 8.869 | 6.399↑ | 5.220↑ | Two straight sub-lines in the plot (see comments in the text); R1 = 0.9997, R2 = 0.9997 |
| RI | 796 | 826 | 846 | 837 | 825 | 799 | No anomalies (thereafter marked as NA); dRI/dC = −1.5 ± 0.3 (R = −0.968) | ||
| Arel | - | 0.93 | 1.18 | 1.23 | 0.96 | 1.17 | NA; <Arel> = 1.09 ± 0.14 | ||
| Arel (ald) | - | - | 4.60 | 4.77 | 4.79 | 4.27 | NA; Arel values for oxime and aldehyde are statistically different | ||
| ΔRI | - | - | −24 | −41 | −60 | −77 | NA; RI values for oxime and aldehyde are statistically different | ||
| 4-Methylbenzaldehyde | 135 | tR,min | - | 28.953↓ | 15.001 | 9.459 | 6.636 | 5.320 | The value tR(40)−tR(50) is below the regression line; R = 0.9998 |
| RI | - | 806↓ | 855 | 855 | 842 | 813 | The value RI(40) is less than others; dRI/dC = −1.4 ± 0.5 (R = −0.906) | ||
| Arel | - | 0.83↓ | 1.82 | 1.78 | 1.07 | 1.86 | The value A(40) is less than others; <Arel> = 1.6 ± 0.4 | ||
| Arel (ald) | - | - | 3.63 | 3.93 | 3.39 | 3.20 | NA | ||
| ΔRI | - | - | −2 | −2 | −16 | −33 | RI values are close to the RI values for aldehyde | ||
| 2-Hydroxybenzaldehyde | 137 | tR, min | 27.586 | 16.432 | 10.798 | 7.738 | 6.166 | 5.266 | R = 0.9998 |
| RI | 780 | 785 | 792 | 799 | 808 | 805 | NA; Average RI value is 795 ± 11 | ||
| Arel | 0.88 | 0.86 | 0.80 | 0.72 | 0.82 | 0.77 | <Arel> = 0.80 ± 0.06 | ||
| Arel (ald) | 0.92 | 0.91 | 0.84 | 0.61 | 0.60 | 0.59 | Arel values for oxime and aldehyde are close to each other | ||
| ΔRI | −2 | 0 | +2 | +1 | +6 | +7 | RI values for oxime and aldehyde are close to each other | ||
| 4-Hydroxybenzaldehyde | 137 | tR, min | - | 18.913 | 10.817 | 7.772 | 6.699 | 5.981 | R = 1.0000 |
| RI | 747 | 798 | 792 | 800 | 846 | 886 | dRI/dC = 3.3 ± 0.6 (R = −0.969) | ||
| Arel | - | - | 0.02 | 0.07 | 0.07 | 0.04 | <Arel> = 0.04 ± 0.02 | ||
| Arel (ald) | - | - | 0.04 | 0.04 | 0.04 | 0.04 | The values RI and Arel are close to the values for aldehyde | ||
| ΔRI | - | - | 41 | +4 | 0 | 0 | |||
| 2-Methoxybenzaldehyde | 151 | tR, min | 39.031 | 18.916 | 11.151 | 7.460 | 5.700 | 4.853 | R = 0.9998 |
| RI | 822 | 805 | 799 | 788 | 772 | 746 | NA; dRI/dC = −1.4 ± 0.1 (R = −0.978) | ||
| Arel | 0.75 | 0.71 | 0.76 | 0.67 | 0.76 | 0.54 | NA; <Arel> = 0.70 ± 0.08 | ||
| Arel (ald) | - | - | 0.08 | 0.08 | 0.08 | 0.05 | NA | ||
| ΔRI | - | - | −103 | −119 | −136 | −146 | NA | ||
| 4-Methoxybenzaldehyde | 151 | tR, min | 30.999 | 15.673 | 9.448 | 6.647 | 5.340 | 4.610 | R = 0.9993 |
| RI | 794 | 778 | 765 | 753 | 741 | 708 | NA; dRI/dC = −1.31 ± 0.04 (R = −0.998) | ||
| Arel | 1.23 | 1.24 | 1.34 | 1.29 | 1.28 | 0.52↓ | <Arel> = 1.28 ± 0.04 | ||
| Arel (ald) | 0.52 | 0.49 | 0.52 | 0.49 | 0.54 | 0.63 | NA | ||
| ΔRI | −8 | −15 | −25 | −36 | −48 | −74 | NA | ||
| 4-Hydroxy-3-methoxybenzaldehyde (Vanillin) | 167 | tR, min | 11.444 | 7.250 | 5.476 | 4.698 | 4.286 | 4.077 | R = 0.9994 |
| RI | 672 | 655 | 643 | 635 | 623 | 611 | NA; dRI/dC = −1.17 ± 0.06 (R = −0.995) | ||
| Arel | 0.52 | 0.54 | 0.54 | 0.53 | 0.55 | 0.54 | NA; <Arel> = 0.54 ± 0.01 | ||
| Arel (ald) | 0.33↑ | 0.04 | 0.05 | 0.04 | 0.04 | 0.04 | Anomaly in Arel value for initial aldehyde | ||
| ΔRI | −27 | −52 | −106 | −162 | −223 | −276 | NA | ||
| 3-Hydroxy-4-methoxybenzaldehyde (Isovanillin) | 167 | tR, min | 13.344 | 7.884 | 5.700 | 4.786 | 4.332 | 4.094 | R = 0.9993 |
| RI | 691 | 669 | 653 | 642 | 630 | 614 | NA; dRI/dC = −1.47 ± 0.09 (R = −0.993) | ||
| Arel | 0.54 | 0.55 | 0.53 | 0.53 | 0.53 | 0.52 | NA; <Arel> = 0.53 ± 0.01 | ||
| Arel (ald) | 0.05 | 0.04 | 0.05 | 0.05 | 0.05 | 0.04 | NA | ||
| ΔRI | −55 | −47 | −97 | −154 | −216 | −272 | NA | ||
| 3,4-Dimethoxybenzaldehyde | 181 | tR, min | 21.929↓ | 11.074 | 7.174 | 5.534 | 4.747 | 4.374 | The value tR(30)−tR(40) is below the regression line; R = 0.9995 |
| RI | 753 | 724 | 707 | 694 | 680 | 668 | NA; dRI/dC = −1.63 ± 0.14 (R = −0.985) | ||
| Arel | 0.58 | 0.34 | 0.59 | 0.62 | 0.60 | 0.57 | NA; <Arel> = 0.55 ± 0.10 | ||
| Arel (ald) | - | - | 0.04 | 0.04 | 0.04 | 0.04 | NA | ||
| ΔRI | −7 | −15 | −43 | −103 | −165 | −219 | NA | ||
| Acetophenone | 135 | tR, min | 37.194↓ | 18.494 | 11.428 | 7.852 | 6.176 | 5.264 | The value tR(30)−tR(40) is below the regression line; R = 0.9998 |
| RI | 816 | 802 | 803 | 803 | 810 | 800 | NA; Average RI value is 795 ± 11 | ||
| Arel | 3.70 | 3.51 | 3.31 | 2.12 | 2.21 | 1.97 | NA; <Arel> = 2.8 ± 0.8or <Arel> = aC + b,a = −0.04 ± 0.01, b = 5.0 ± 0.4 | ||
| Arel (ketone) | - | - | 3.34 | 2.85 | 2.78 | 2.53 | NA | ||
| ΔRI | 16 | 2 | 3 | 3 | 10 | 0 | The values RI and Arel are practically the same as values for initial ketone | ||
| Propiophenone | 149 | tR | 67.65↓ | 30.02↑ | 20.86 | 11.306 | 7.50 | 5.719 | The value tR(40)−tR(50) is upwards, while the value tR(30)−tR(40)–downwards the regression line; R = 0.9993 |
| RI | 887 | 872 | 915 | 902 | 893 | 862 | NA; dRI/dC = −1.7 ± 0.3 (R = −0.962) | ||
| Arel | - | - | 1.14 | 1.16 | 1.18 | 0.99 | <Arel> = 1.12 ± 0.09 | ||
| Arel (ketone) | - | - | 1.98 | 2.56 | 2.29 | 1.82 | NA | ||
| ΔRI | −13 | −28 | 15 | 2 | −7 | −38 | NA | ||
| Butyrophenone | 163 | tR | - | - | 36.86 | 17.89 | 9.49 | 6.515 | R = 0.998 |
| RI | - | 968 | 1015 | 1015 | 987 | 948 | NA; dRI/dC = −2.3 ± 0.6 (R = −0.932) | ||
| Arel | - | - | 1.09 | 1.12 | 1.14 | 1.13 | NA; <Arel> = 1.12 ± 0.02 | ||
| Arel (ketone) | - | - | 2.78 | 2.76 | 2.52 | 2.37 | NA | ||
| ΔRI | - | −32 | 15 | 15 | −13 | −52 | NA | ||
Table 3.
Comparing of hydrophobicity factors (logP) as polarity measures for some aromatic carbonyl compounds and their oximes.
Table 3.
Comparing of hydrophobicity factors (logP) as polarity measures for some aromatic carbonyl compounds and their oximes.
| Carbonyl Compound | logP | Mutual Relation | logP of Oxime |
|---|---|---|---|
| Benzaldehyde | 1.46 ± 0.02* | ≈ | 1.49 |
| 2-Hydroxybenzaldehyde | 1.83 ± 0.19 | ≈ | 1.88 |
| 4-Hydroxybenzaldehyde | 1.3 | > | 1.2 |
| 4-Methoxybenzaldehyde | 1.7 | > | 1.5 |
| Acetophenone | 1.70 ± 0.09 | < | 1.88 |
| Propiophenone | 2.23 ± 0.05 | ≈ | 2.27 |
* The values indicated with standard deviations are calculated using ACD Labs software, version pro 10.The averaged value of the differences of logP values of oximes and carbonyl compounds is −0.01 ± 0.18; i.e., it is statistically insignificant.
Table 4.
The values pKa for some oximes of aromatic carbonyl compounds.
| Oxime of | pKa |
|---|---|
| Benzaldehyde | 11.3 ± 0.1 |
| 2-Hydroxybenzaldehyde | 9.1 ± 0.1 * |
| 2-Methoxybenzaldehyde | 11.9 |
| Acetophenone | 11.4 ± 0.1 |
* Lower pKa value for 2-hydroxybenzaldehyde oxime is caused by the presence of phenolic hydroxyl group.
Disclaimer/Publisher’s Note: The statements, opinions and data contained in all publications are solely those of the individual author(s) and contributor(s) and not of MDPI and/or the editor(s). MDPI and/or the editor(s) disclaim responsibility for any injury to people or property resulting from any ideas, methods, instructions or products referred to in the content. |
© 2024 by the authors. Licensee MDPI, Basel, Switzerland. This article is an open access article distributed under the terms and conditions of the Creative Commons Attribution (CC BY) license (https://creativecommons.org/licenses/by/4.0/).
Share and Cite
MDPI and ACS Style
Zenkevich, I.G.; Derouiche, A. Features and Advantages of the Recurrent Approximation of Retention Times in Reversed-Phase High-Performance Liquid Chromatography. Separations 2024, 11, 69. https://doi.org/10.3390/separations11030069
AMA Style
Zenkevich IG, Derouiche A. Features and Advantages of the Recurrent Approximation of Retention Times in Reversed-Phase High-Performance Liquid Chromatography. Separations. 2024; 11(3):69. https://doi.org/10.3390/separations11030069
Chicago/Turabian StyleZenkevich, Igor G., and Abdennour Derouiche. 2024. "Features and Advantages of the Recurrent Approximation of Retention Times in Reversed-Phase High-Performance Liquid Chromatography" Separations 11, no. 3: 69. https://doi.org/10.3390/separations11030069
Note that from the first issue of 2016, this journal uses article numbers instead of page numbers. See further details here.