Article

Accelerated Development of AAV Purification Process Using a High-Throughput and Automated Crossflow System

by
Sónia Mendes
1,2,†,
Tiago Q. Faria
1,2,†,
André Nascimento
1,2,
Marc Noverraz
3,
Franziska Bollmann
4,
Piergiuseppe Nestola
3,
António Roldão
1,2,
Cristina Peixoto
1,2 and
Ricardo J. S. Silva
1,2,*
1
iBET, Instituto de Biologia Experimental e Tecnológica, Apartado 12, 2780-901 Oeiras, Portugal
2
ITQB-NOVA, Instituto de Tecnologia Química e Biológica António Xavier, Universidade Nova de Lisboa, 2780-157 Oeiras, Portugal
3
Sartorius Stedim Switzerland AG, 8317 Tagelswangen, Switzerland
4
Sartorius Stedim Biotech GmbH, 37079 Göttingen, Germany
*
Author to whom correspondence should be addressed.
These authors contributed equally to this work.
Separations 2024, 11(3), 73; https://doi.org/10.3390/separations11030073
Submission received: 18 January 2024 / Revised: 20 February 2024 / Accepted: 23 February 2024 / Published: 26 February 2024
(This article belongs to the Section Separation Engineering)

Abstract

:
Adeno-associated viruses (AAV) are currently predominant viral transfer tools for gene therapy, and efforts are being made to design faster and more efficient methods and technologies for their manufacturing. The early selection of high-performing filters is essential for developing an ultrafiltration and diafiltration (UF/DF) process, especially when feed material is scarce, and timelines are short. However, few methods and technologies exist to enable process optimization with multiple variations in a single run. In this study, we explored the potential of Ambr® Crossflow for high-throughput, automated screening of different membrane materials, pore sizes and different process conditions for the UF/DF step of AAV8. The best overall performance was obtained with a 100 kDa PES flat sheet cassette. The UF/DF process was further transferred to a larger scale to the Sartoflow® Smart Tangential Flow Filtration (TFF) system using a 100 kDa PES Sartocon® Slice 200 cassette and compared to a 100 kDa PES hollow fiber. Virus recovery, permeate flux and total protein removal values of the flat sheet cassette were similar to those achieved in small-scale devices, and higher than those of the hollow fiber, thus demonstrating similar performance at a larger process scale. The high-throughput, automated method described herein allowed to screen multiple materials and process parameters of a UF/DF process in a time- and resource-efficient way, making it a useful tool to accelerate early-stage downstream process development of AAV.

1. Introduction

The need for industrialized cost-effective manufacturing platforms for viruses is growing rapidly as their usage in precision medicines continues to rise. Among viral delivery systems, recombinantly produced adeno-associated viruses (AAV) are now the predominant vector for in vivo gene therapies to deliver a specific genetic material into the target cells, or for oncolytic treatment, being extensively used in clinical trials with promising results [1,2]. AAV serotype 8 is the second most frequently used serotype, after AAV2, with its main application for the treatment of blood and eye disorders [3].
The manufacturing of AAVs for clinical gene therapy can make use of different methodologies for the harvesting of vector particles from producer cells and/or the culture media and for their subsequent purification [1]. Recovery of recombinant AAV from cell culture typically requires cell lysis followed by nuclease treatment to reduce viscosity and facilitate the separation of AAV from cells and media components through filtration prior to concentration of the product [4]. The stream volume usually is reduced as early in the process as possible to reduce the upfront investment in downstream equipment and materials [2,5]. Filtration-based processes such as tangential flow filtration (TFF) can be used for volume reduction and rebuffering, typically by ultrafiltration and/or diafiltration (UF/DF) [6]. Ultrafiltration is the method of choice for concentration and diafiltration (buffer exchange) of AAV while removing low-molecular-weight impurities and reducing product volume. Ultrafiltration is a robust and relatively low-cost technique usually leading to high recovery yields. However, the early selection of a high-performing filter as a base for the development of a TFF step can represent a particular challenge when the feed material is scarce and the development timelines are short. One approach that can overcome these issues is the implementation of high-throughput technology [7,8]. Typically, this technology integrated with scale-down systems enables the simultaneous generation of a large amount of data using a small fraction of material through parallel and automated experimentation [9]. Bioprocess development can be accelerated by evaluating a large experimental space maximizing the amount of information and minimizing the sample volume, cost, and time [10].
The Ambr® Crossflow (CF) system is a tool for high-throughput development of the UF/DF operation, as the reduced material requirements significantly increase the number of possible experimental runs, while its screening capabilities are even more efficient when used in combination with design of experiments (DoE) methodologies. The system can operate with a minimum recirculation volume from as low as 5 mL and can process up to 16 runs in parallel. When comparing the starting material volume typically required for a bench-scale TFF process development system, like Sartoflow® Smart (1 L for a Sartocon® Slice 200 cassette) with the small volume that Ambr® Crossflow is capable of processing, 16 different runs could be performed with the same amount of starting material (resulting in a 62.5 mL starting volume for Ambr® Crossflow). Furthermore, those 16 different runs could be completed simultaneously, leading to a significant saving of run time compared to typical bench-scale TFF systems, as well as the absence of material ageing effects, due to wait times being potentially longer, and operator effects. The Ambr® Crossflow system allows the screening of different membrane materials and molecular weight cut-offs (MWCO). As it cannot be generalized which TFF membrane and cut-off perform better for a specific application or target molecule, a screening of different membranes is recommended to obtain optimal TFF step performance. We evaluated two different membrane materials, polyethersulfone (PES) and Hydrosart®. PES membrane is a membrane polymer that is well established in the biotechnological and pharmaceutical industries, providing minimal adsorption properties to viruses and proteins [11]. The chemical properties of the Hydrosart® membrane correspond to those of regenerated cellulose being highly hydrophilic and showing very low non-specific adsorption [12]. Moreover, due to crosslinking, the membrane has reduced swelling behavior and therefore higher alkali resistance. Furthermore, as demonstrated previously for mAb [13,14], Bispecific Antibody [15], and Engineered Protein Capsules (EnPC) [15] UF/DF process development, the Ambr® Crossflow is well suited to screen various buffer compositions for diafiltration and formulation, identify optimal concentration factors and diafiltration volumes, and can be used to characterize the UF/DF process by studying the behavior of process parameters including the transmembrane pressure (TMP) or flow rate. Additionally, due to the low sample volume requirements and the parallel processing capabilities, it was shown to be a useful screening tool for product candidate selection, thereby increasing the number of candidate molecules that can be further developed, while also assessing their manufacturability, securing the advancement of exclusively the most potential product candidates within the development pipeline [13].
Here, we report the screening of different membrane materials and pore sizes for the UF/DF of an AAV8 containing clarified lysate and the determination of their impact on process performance and product quality using the Ambr® Crossflow system. Accordingly, we evaluated two different membrane materials, polyethersulfone (PES) and Hydrosart®, with two different pore sizes (MWCOs) of 30 and 100 kDa. We analyzed the AAV total particle recovery, flux behavior during the TFF concentration and diafiltration process, and the impurities removal (total protein and dsDNA). The process was transferred to a larger scale with the best-performing membrane using the Sartoflow® Smart TFF system, and the performance was compared to a hollow fiber device.

2. Materials and Methods

2.1. AAV8 Production

AAV8 was produced in a 10 L stirred tank bioreactor (Sartorius) equipped with two Rushton impellers and a ring-sparger for gas supply. The pO2 was set to 40% of air saturation and was maintained by varying the agitation rate (70–200 rpm), the percentage of O2 in the gas mixture (0–100%), and the gas flow rate (0.01–0.04 vvm). The pH value was maintained by the automatic addition of either 1 M of NaHCO3 or CO2 within the gas mix. BalanCD HEK293 medium (Irvine Scientific, Santa Ana, USA) supplemented with 4 mM of GlutaMAX (Gibco, Waltham, USA) was used as a cell culture medium. The bioreactor was inoculated with HEK293T cells adapted to suspension at a cell density of 0.6 × 10⁶ cells/mL. When cell density reached 2×10⁶ cells/mL, HEK293T cells were triple-transfected with pRC8 (produced in-house from an Escherichia coli clone and purified using ZymoPURE IITM Plasmid GigaPrep (Zymo Research, Irvine, USA), pAAV-GFP and pHelper plasmids (both purchased from PlasmidFactory, Bielefeld, Germany). At 72 h post transfection (hpt), cells were lysed in the bioreactor using an appropriate lysis buffer (50 mM of Tris, 1% (v/v) Tween 20, 2 mM of MgCl2, pH 8.0). Nuclease treatment was performed using 10 U/mL (Benzonase, Merck, Darmstadt, Germany) with an incubation period of 1 h after which NaCl (0.5 M) was added for virus stabilization prior to harvest. Upon harvest, AAVs were clarified by filtration using Sartopure® PP3 20 µm (Sartorius Stedim Biotech, Göttingen, Germany), followed by filtration using Sartopure® PP3 1.2 µm (Sartorius Stedim Biotech) and finally Sartopore® 2 XLG 0.8 + 0.2 µm (Sartorius Stedim Biotech). AAVs (4.7 × 10¹¹ TP/mL) were stored in aliquots, frozen at −80 °C, and used as feed for all the studies. Each feed solution was thawed at room temperature before the start of the experiment.

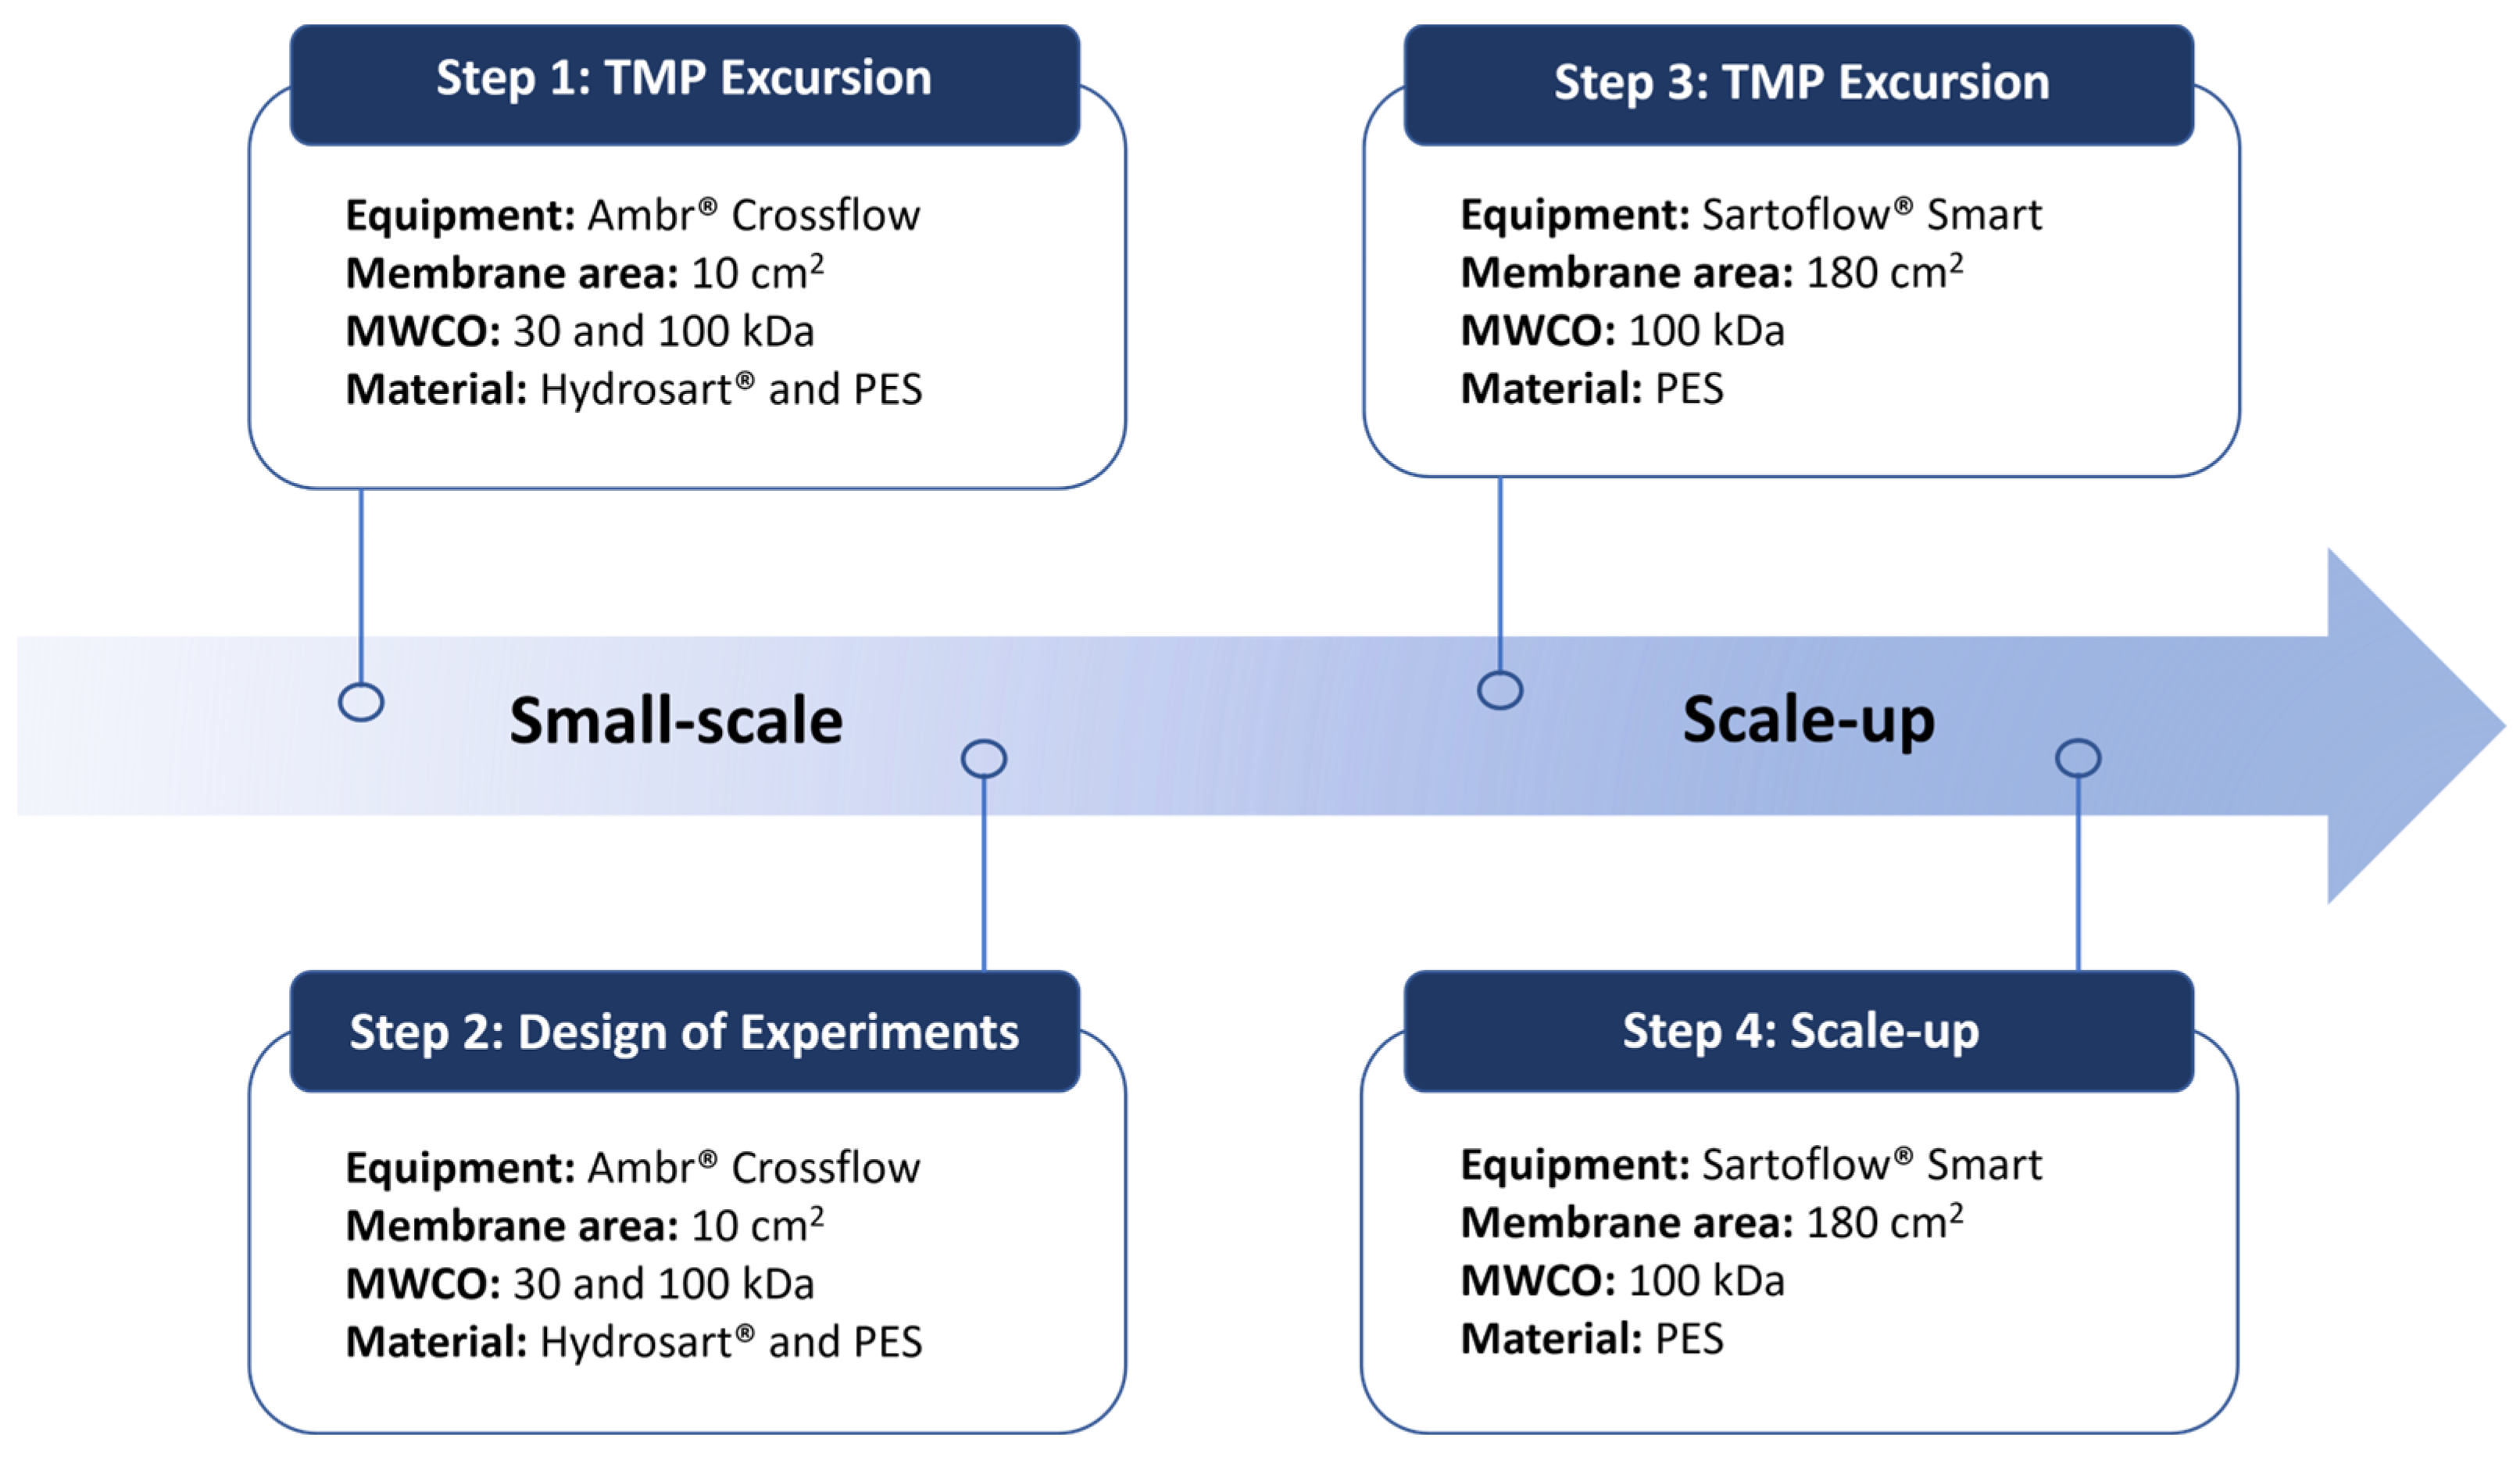
2.2. High-Throughput TFF Step Development Using Ambr® Crossflow

The Ambr® Crossflow system (Sartorius Stedim Biotech) comprises a high-throughput TFF processing unit that enables parallel operation with 4 independent crossflow channels per module, with up to 4 modules managed by one control station. Each channel consists of a 100 mL feed/retentate tank attached to a load cell, a feed, crossflow, sampling pump and an automatic retentate valve. The diafiltration buffer is connected to the feed/retentate tank via a second pump that enables automatic level control. Each channel is fitted with a pH (inside the vessel) and conductivity (in the feed line) sensor, and pressure sensors in all lines. The pH sensors and pump are all automatically calibrated prior to each experimental run. A predefined recipe was run for each experiment consisting of six steps: (1) automatic component calibration and taring; (2) filter gas tightening test and water flux test; (3) UF/DF experiment including an equilibration step before the experiment; (4) product recovery; (5) system cleaning with 1 M of NaOH; and (6) storage (dry). Hydrosart® and Polyethersulfone (PES) (with MWCO of 30 and 100 kDa) Ambr® crossflow filters of 10 cm2 membrane area (Sartorius Stedim Biotech) were used for high-throughput small-scale TFF experiments. A flux characterization study was carried out for all Ambr® CF devices to determine the optimal operating pressure independent Transmembrane Pressure (TMP) for UF/DF operation. For each module, the TMP was ramped up from ~100 mbar to greater than 1500 mbar, and the corresponding permeate flux at the intermediate TMP target was measured. In these studies, the permeate flux was returned to the retentate vessel to ensure that the concentration in the retentate vessel remained constant.
A full factorial design of experiments (DoE) was performed using Ambr® Crossflow at a feed flow rate (QFeed) from 50 to 75 mL/min, and TMP from 600 to 900 mbar for 30 kDa devices and from 300 to 600 mbar for 100 kDa devices. All experiments were conducted using the same initial total loading volume of 70 mL (67.7 mL of feed AAV8 stock + 2.3 mL of buffer within the system hold-up), followed by a 10-fold concentration (final retentate volume of 7 mL) and 5 volumes diafiltration with buffer 10 mM of Bis-Tris propane, 700 mM of NaCl, 0.003% poloxamer 188, 1% sucrose, pH 6.9 ± 0.2. The permeate flux was automatically calculated based on the change in the feed weight (for the concentration step) and/or on the diafiltration pump flow rate required to maintain the retentate volume (for the diafiltration step).

2.3. Transfer of the TFF Step to a Larger Scale Using Sartoflow® Smart

A 100 kDa PES Sartocon® Slice 200 e-screen cassette of 180 cm2 (Sartorius Stedim Biotech) and a 100 kDa PES 0.5 mm inner diameter (ID) hollow fiber were used for larger-scale experiments on the Sartoflow® Smart TFF system (Sartorius Stedim Biotech).
A flux characterization study for the devices used was performed to determine the optimal operating TMP condition for UF/DF operation. For each module, TMP was ramped up from ~100 mbar to greater than 1300 mbar, and the corresponding permeate flux at the intermediate TMP target was measured. In these studies, the permeate flux was returned to the retentate vessel to ensure that the concentration in the retentate vessel remained constant. An initial volume of 1 L followed by a 10-fold concentration (final retentate volume of 100 mL), for the 100 kDa PES Sartocon® Slice 200 cassette and an initial volume of 640 mL, keeping the same filter challenge rate (L/m2) for both devices, followed by a 10-fold concentration (final retentate volume of 64 mL) for the hollow fiber, was performed. After ultrafiltration/diafiltration with five diafiltration volumes, flushing with three hold-up volumes of buffer was performed to increase product recovery.

2.4. Analytical Methods

Total particle concentration, total protein concentration, and dsDNA concentration in feed and retentate samples were quantified by ELISA (Progen), Pierce BCA (Thermo Scientific, Waltham, MA, USA), and Picogreen (Invitrogen, Waltham, MA, USA), respectively. Briefly, the determination of total AAV particle concentration (TP) was carried out with a conformational AAV ELISA assay (Progen Biotechnik GMBH, Heidelberg, Germany) according to the manufacturer’s instructions. The reference curve was built from 4.9 × 10⁸ TP/mL with serial dilutions to 7.7 × 10⁶ TP/mL. The absorbance was quantified at 450 nm on an Infinite PRO NanoQuant (Tecan, Männedorf, Switzerland) microplate multimode reader using a clear 96-well plate provided in the kit. The samples were analyzed at multiple dilutions. The total protein concentration and dsDNA concentration were assessed with specific assays according to the manufacturer’s instructions for each. The total protein content was quantified using a BCA Protein Assay Kit (Thermo Fisher Scientific), and total ds-DNA was quantified with a Quant-iT™ Picogreen® dsDNA assay kit (Invitrogen, Waltham, MA, USA). Samples were applied in serial dilutions, and reference material was applied in duplicate. Absorbance with respect to protein quantification and fluorescence with respect to ds-DNA quantification were measured with an Infinite PRO NanoQuant (Tecan) microplate reader.

3. Results and Discussion

In this study, we have evaluated different molecular weight cut-offs and different membrane materials to establish a rational TFF step development workflow going from small-scale screening experiments to scaling up the developed process. The experimental workflow is summarized in Figure 1.

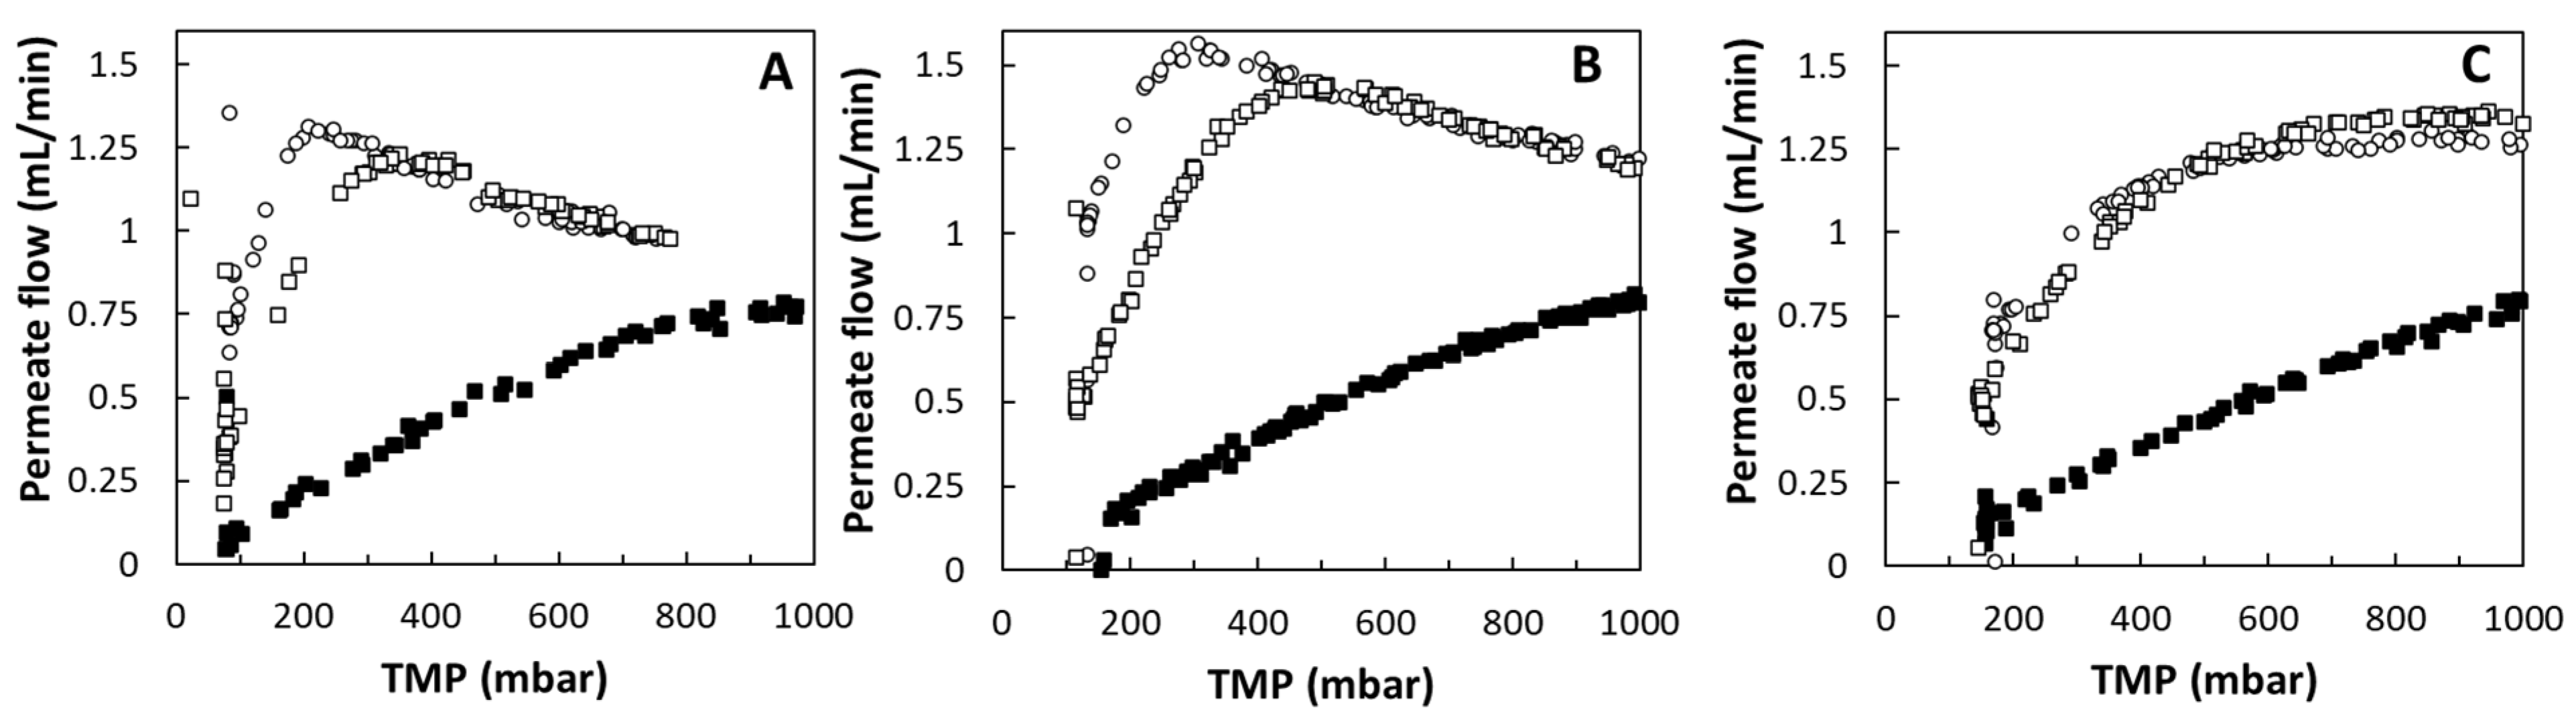
3.1. High-Throughput TFF Step Development Using Ambr® Crossflow: Small-Scale Screening Experiments

A flux characterization experiment was performed for the 30 and 100 kDa MWCO Ambr® CF filters with Hydrosart® and PES membranes using clarified and filtrated AAV8 material to define the feed flow rate (QFeed) and the optimal TMP values for maximum permeate flux without causing excessive membrane polarization or fouling for the next steps (Figure 2). During ultrafiltration, the permeate flow increases with the increase in TMP, until a TMP where the feed flow rate is not able to completely remove accumulation at the wall of the membrane [16]. Beyond this TMP, the resistance to filtrate flux is controlled by the concentration polarization boundary layer and not the membrane alone. For a given concentration and for a given feed flow rate, the permeate flux does not change with TMP beyond the critical TMP. The point where the critical TMP is reached is normally chosen for UF/DF unit operations [16]. Therefore, higher QFeed (between 50 and 75 mL/min) was found to be optimal for both 30 and 100 kDa devices, leading to higher concentration polarization resistance. The TMP values optimal settings, where the permeate flux did not change, were found at 600900 mbar and 300600 mbar for the 30 and 100 kDa devices, respectively (Figure 2). Similarly, Arunkumar and Singh proposed for AAV2 and AAV9 serotypes clarified and purified by affinity chromatography and polished using anion exchange chromatography that higher feed flow rates would mean that critical TMP beyond which concentration polarization resistance predominates will be higher [16].
A full factorial DoE was then performed using the factors identified above (Table 1); seven experiments were performed for each flat sheet device. Total particle recovery (quantified by ELISA), average flux, total protein removal (quantified by BCA), and total DNA removal (quantified by picogreen) were evaluated at the end of the TFF operation (concentration followed by diafiltration) (Table 1).
For the 30 kDa MWCO flat sheet cassettes, total particle recovery and impurity (total protein and DNA) removal showed coefficients of variance (CV) between 2 and 19% among all conditions (QFeed and TMP) and membrane types (PES and Hydrosart®) evaluated. In general, the PES membrane showed a better performance compared to the Hydrosart® membrane for total particle recovery and DNA removal at any combination of TMP and QFeed, while the opposite occurs for permeate flux (2-fold higher in Hydrosart® compared to PES membrane); total protein removal is similar in both membrane types (Table 1). The highest total particle recovery was obtained with the PES membrane (97%) at 75 mL/min Qfeed (high) and 600 mbar TMP (low).
For the 100 kDa MWCO flat sheet cassettes, total particle recovery and impurity (total protein and DNA) removal revealed CV between 1 and 14% regardless of the condition and membrane type evaluated. In general, the performance of both membranes is similar for total particle recovery, permeate flux, and total protein removal; a slight increase in DNA removal is achieved with the PES membrane when compared to the Hydrosart® membrane (Table 1). The highest total particle recovery was obtained with the PES membrane (93%) at 75 mL/min QFeed (high) and 300 mbar TMP (low).
The data generated in the DoE were further analyzed with MODDE® by using the membrane type (Hydrosart® and PES) and the MWCO (30 kDa and 100 kDa) as additional factors. The TMP ranges were different between the 30 kDa and 100 kDa flat sheet membranes, so a re-coding of the ranges was needed to keep the design balanced. Since the QFeed range was the same for all flat sheet membranes, no re-coding was needed. After the removal of outliers, models were fitted for all four responses. While the model fit for permeate flux and for protein and DNA removal was acceptable, the model for TP recovery was poor probably because recoveries higher than c.a. 70% were observed for all conditions tested. Results show that the best performance response for average flux, for protein and DNA removal, is achieved with 100 kDa PES membrane and at low TMP and high QFeed ranges. On the other hand, the contour plot of TP recovery indicates that the best condition is with the 30 kDa PES membrane at mid-low TMP; however, since the TP recovery model is poorly fitted, this response was not considered when deciding on the best-performing membrane and condition. Overall, based on the data generated, the 100 kDa MWCO PES flat sheet membrane, 75 mL/min QFeed, and 300 mbar TMP were selected as the best combination of factors for subsequent studies. Three independent experiments were performed to assess process robustness. Reproducible results were obtained, with CV between 1 and 4% for all measured variables (i.e., total particles recovery, total protein and DNA removal, permeate flux) and yields in line with those obtained in DoE (i.e., 84 ± 1% of TP recovery, 69 ± 3 LMH of permeate flux, 88 ± 1% total protein removal and 70 ± 1% of DNA removal).

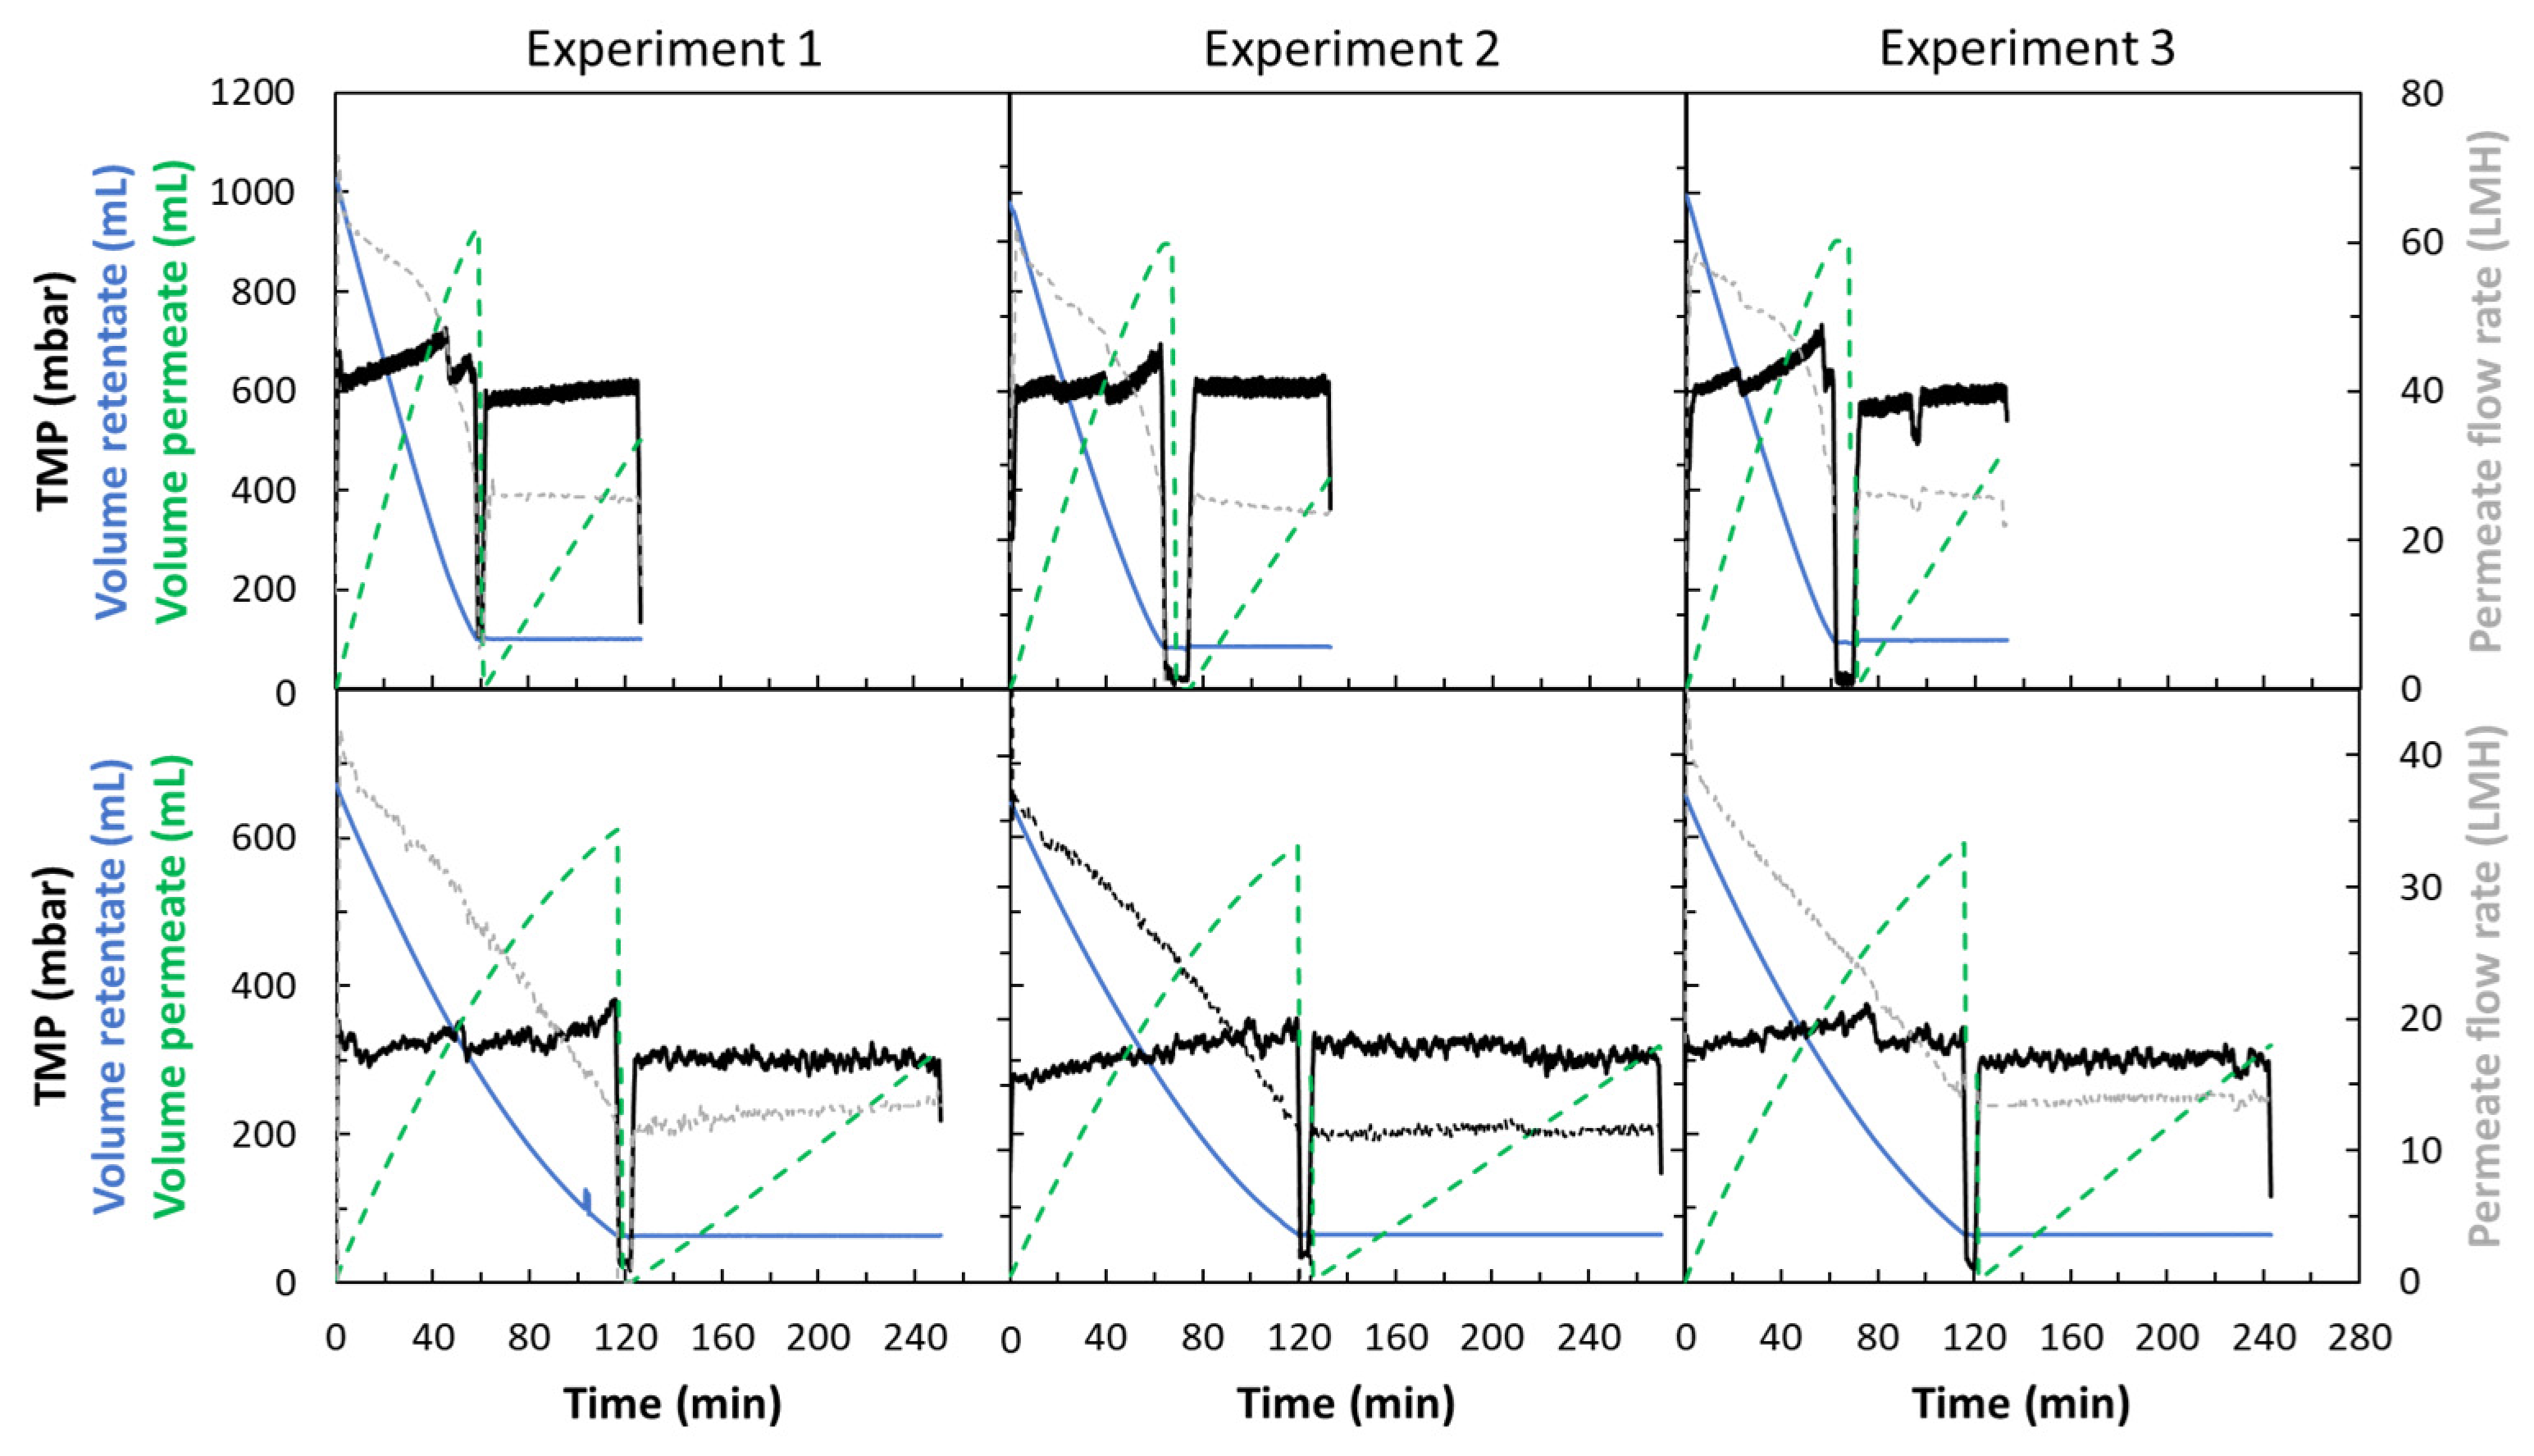
3.2. Characterization of the Flat Sheet Membrane Process Scale-Up and Hollow Fiber Comparison

The developed TFF process was transferred to the Sartoflow® Smart TFF system to verify the optimal parameters/conditions determined at small scale and compared with a 100 kDa PES hollow fiber. The two modules evaluated were: (i) the 100 kDa MWCO PES Sartocon® Slice 200 e-screen flat sheet cassette, following the results obtained in small-scale experiments (Figure 3A), and (ii) the 100 kDa PES hollow fiber (Figure 3B). The flux characterization profiles obtained with both modules using the Sartoflow® Smart TFF system are shown in Figure 3. The flat sheet cassette reached its maximum flux at a higher TMP than the hollow fiber, most likely due to the higher flow resistance of the material by dimension, as the wall thickness of the hollow fiber is between 200 and 250 µm, and the membrane thickness of the PES cassette is between 100 and 150 µm [17,18]; therefore, using the same crossflow rate for both technologies, the hollow fiber causes lower wall shear as no turbulence promoter is placed inside the fibers. Based on these results, the parameters selected for the larger process volume runs for each module were: for flat sheet cassette, QFeed = 260 mL/min, and TMP = 600 mbar, and for hollow fiber, QFeed = 212 mL/min and TMP = 300 mbar.
The permeate flow rate, pressure, and volume of retentate and permeate were plotted against process time (concentration and diafiltration phases) for three independent larger-scale experiments of both the 100 kDa PES flat sheet cassette and hollow fiber (Figure 4). The total particle recovery, average flux, total protein and DNA removal were the parameters evaluated at the end of the TFF operation (concentration followed by diafiltration) (Table 2). Both flat sheet cassette and hollow fiber showed reproducible results, with CV between 1 and 6% regardless of the parameters evaluated; the only exception was the CV of DNA removal in the flat sheet cassette that presented a value higher than that observed in small-scale experiments (i.e., 18% CV). Importantly, the TP recovery (91 ± 2% vs. 87 ± 1%), permeate flux (37 ± 1 LMH vs. 19 ± 4 LMH), and total protein removal (79 ± 1% vs. 75 ± 1%) achieved in the flat sheet cassette were higher than those of the hollow fiber; however, DNA removal was higher in the hollow fiber, with 64 ± 1% vs. 36 ± 6% in the flat sheet cassette.
In general, the 100 kDa MWCO PES Sartocon® Slice 200 flat sheet cassette outperformed the hollow fiber in most parameters evaluated (i.e., total particle recovery, total protein removal, permeate fluxes) (Table 2). The DNA removal was 1.8-fold higher in the hollow fiber when compared with the flat sheet cassette; however, this impurity clearance can be further increased with the later additional downstream purification steps such as affinity capture chromatography [19,20].
Next, we compared the performance for the 100 kDa PES ultrafiltration membrane across various devices and scales (Figure 5), including the 100 kDa PES Sartocon® Slice 200 and Ambr® Crossflow flat sheet cassettes and the 100 kDa PES hollow fiber. Notably, the small-scale Ambr® Crossflow device exhibits comparable performance to the 100 kDa PES Sartocon® Slice 200 in terms of total particle recovery and total protein removal. However, it is worth mentioning that both total DNA removal and average permeate flux were notably lower for the 100 kDa PES Sartocon® Slice 200. This suggests the potential for further development of operational efficiency at a larger scale.

4. Conclusions

In this study, the data obtained showed that the Ambr® Crossflow system can be a useful tool for developing the ultrafiltration and diafiltration steps for AAV. Thanks to its advanced multi-parallel processing capabilities, this system accelerated and simplified AAV TFF step process development, by enabling the investigation of the effects of different membrane materials and MWCO on AAV recovery, process time, and impurity removal, determined with less time and operator effort, and with a smaller amount of costly and scarce product needed to evaluate different parameter sets. Moreover, it was shown that the transfer of the best-performing membrane/cut-off candidate from the Ambr® Crossflow system to the larger benchtop crossflow filtration system Sartoflow® Smart is easily possible, enabling a faster selection of ultrafiltration consumables at an early stage of process development, and may be extended for any target molecule.

Author Contributions

S.M.: conceptualization, methodology, investigation, resources, data curation, writing—original draft, review and editing; T.Q.F.: conceptualization, methodology, investigation, resources, data curation, writing—review and editing; M.N.: conceptualization, methodology, resources, data curation, writing—review and editing; F.B.: conceptualization, methodology, resources, writing—review and editing; P.N.: conceptualization, supervision, resources, funding acquisition; A.N.: methodology, investigation, resources, data curation, writing—review and editing; A.R.: supervision, resources, writing—review and editing, funding acquisition; C.P.: supervision, resources, writing—review and editing, funding acquisition; R.J.S.S.: supervision, resources, writing—review and editing, funding acquisition. All authors have read and agreed to the published version of the manuscript.

Funding

This work was funded by the Fundação para a Ciência e Tecnologia/Ministério da Ciência, Tecnologia e Ensino Superior (FCT/MCTES, Portugal) through national funds to iNOVA4Health (UIDB/04462/2020 and UIDP/04462/2020), the Associate Laboratory LS4FUTURE (LA/P/0087/2020) and projects PTDC/EQU-EQU/0142/2020 and EXPL/EQU-EQU/1567/2021.

Data Availability Statement

The data that support the findings of this study are available from the corresponding author upon reasonable request.

Conflicts of Interest

S.M., T.F., A.N., A.R., C.P. and R.J.S.S. declare no conflicts of interest. M.N. and P.N. are employees of Sartorius Stedim Switzerland AG; F.B. is an employee of Sartorius Stedim Biotech GmbH.

References

  1. El Andari, J.; Grimm, D. Production, Processing, and Characterization of Synthetic AAV Gene Therapy Vectors. Biotechnol. J. 2021, 16, e2000025. [Google Scholar] [CrossRef] [PubMed]
  2. Moleirinho, M.G.; Silva, R.J.S.; Alves, P.M.; Carrondo, M.J.T.; Peixoto, C. Current challenges in biotherapeutic particles manufacturing. Expert. Opin. Biol. Ther. 2020, 20, 451–465. [Google Scholar] [CrossRef] [PubMed]
  3. Au, H.K.E.; Isalan, M.; Mielcarek, M. Gene Therapy Advances: A Meta-Analysis of AAV Usage in Clinical Settings. Front. Med. 2021, 8, 809118. [Google Scholar] [CrossRef]
  4. Kotin, R.M. Large-scale recombinant adeno-associated virus production. Hum. Mol. Genet. 2011, 20, R2–R6. [Google Scholar] [CrossRef] [PubMed]
  5. Vicente, T.; Mota, J.P.; Peixoto, C.; Alves, P.M.; Carrondo, M.J. Rational design and optimization of downstream processes of virus particles for biopharmaceutical applications: Current advances. Biotechnol. Adv. 2011, 29, 869–878. [Google Scholar] [CrossRef] [PubMed]
  6. Loewe, D.; Dieken, H.; Grein, T.A.; Salzig, D.; Czermak, P. A Combined Ultrafiltration/Diafiltration Process for the Purification of Oncolytic Measles Virus. Membranes 2022, 12, 105. [Google Scholar] [CrossRef] [PubMed]
  7. Cramer, S.M.; Holstein, M.A. Downstream bioprocessing: Recent advances and future promise. Curr. Opin. Chem. Eng. 2011, 1, 27–37. [Google Scholar] [CrossRef]
  8. Lacki, K.M.; Brekkan, E. High throughput screening techniques in protein purification. Methods Biochem. Anal. 2011, 54, 489–506. [Google Scholar] [PubMed]
  9. Fernandez-Cerezo, L.; Rayat, A.; Chatel, A.; Pollard, J.M.; Lye, G.J.; Hoare, M. An ultra scale-down method to investigate monoclonal antibody processing during tangential flow filtration using ultrafiltration membranes. Biotechnol. Bioeng. 2019, 116, 581–590. [Google Scholar] [CrossRef] [PubMed]
  10. Fernandez-Cerezo, L.; Wismer, M.K.; Han, I.; Pollard, J.M. High throughput screening of ultrafiltration and diafiltration processing of monoclonal antibodies via the ambr(R) crossflow system. Biotechnol. Prog. 2020, 36, e2929. [Google Scholar] [CrossRef]
  11. Blanco, J.; Nguyen, Q.; Schaetzel, P. Sulfonation of polysulfones: Suitability of the sulfonated materials for asymmetric membrane preparation. J. App. Polym. Sci. 2002, 84, 2461–2473. [Google Scholar] [CrossRef]
  12. Beer, H.; Demmer, W.; HÖRL, H.-H.; Melzner, D.; Nussbaumer, D.; Schmidt, H.-W.; Wünn, E. Hydrophilic Porous Membranes Made of Cross-Linked Cellulose Hydrate, Method of Producing Them and Their Use; European Patent Office: Munich, Germany, 2001; p. EP0762929B1. [Google Scholar]
  13. Borujeni, E.; Betts, J.; Jenke, M.; Pollard, J. Applications of an Automated High Throughput Crossflow System for Ultrafiltration Process Development to Assess Manufacturability of Monoclonal Antibodies. Application Note. 2019. Available online: https://www.sartorius.com/download/714524/ambr-cf-hts-scale-down-model-mab-application-note-en-b-25463-1--data.pdf (accessed on 17 January 2024).
  14. Fernandez-Cerezo, L.; Benner, S.W.; Pollard, J.M. Streamlining process characterization efforts using the high throughput ambr® crossflow system for ultrafiltration and diafiltration processing of monoclonal antibodies. Biotechnol. Prog. 2021, 37, e3118. [Google Scholar] [CrossRef]
  15. Gibson, D.; Betts, J.; Jenke, M.; Lewis, W. Optimizing Diafiltration Parameters for Maximum Recovery of a Bispecific Antibody Using Low Process Volumes and an Automated High Throughput Crossflow System. Application Note. 2019. Available online: https://www.sartorius.com/download/714528/appl-note-ambr-cf-hts-manufacturability-bsab-sl-4086-e-pdf-data.pdf (accessed on 17 January 2024).
  16. Arunkumar, A.; Singh, N. Ultrafiltration behavior of recombinant adeno associated viral vectors used in gene therapy. J. Membr. Sci. 2021, 620, 118812. [Google Scholar] [CrossRef]
  17. Baitalow, K.; Wypysek, D.; Leuthold, M.; Weisshaar, S.; Lölsberg, J.; Wessling, M. A mini-module with built-in spacers for high-throughput ultrafiltration. J. Membr. Sci. 2021, 637, 119602. [Google Scholar] [CrossRef]
  18. Thiess, H.; Leuthold, M.; Grummert, U.; Strube, J. Module design for ultrafiltration in biotechnology: Hydraulic analysis and statistical modeling. J. Membr. Sci. 2017, 540, 440–453. [Google Scholar] [CrossRef]
  19. Mendes, J.P.; Bergman, M.; Solbrand, A.; Peixoto, C.; Carrondo, M.J.T.; Silva, R.J.S. Continuous Affinity Purification of Adeno-Associated Virus Using Periodic Counter-Current Chromatography. Pharmaceutics 2022, 14, 1346. [Google Scholar] [CrossRef]
  20. Escandell, J.; Moura, F.; Carvalho, S.B.; Silva, R.J.S.; Correia, R.; Roldão, A.; Gomes-Alves, P.; Alves, P.M. Towards a scalable bioprocess for rAAV production using a HeLa stable cell line. Biotechnol. Bioeng. 2023, 120, 2578–2587. [Google Scholar] [CrossRef]
Figure 1. Workflow of the study.
Separations 11 00073 g001
Figure 2. TMP excursion for 30 kDa and 100 kDa MWCO Hydrosart® and PES membranes. Feed flow rate of (A) 35.4 mL·min1, (B) 59 mL·min1, and (C) 75 mL·min1. Empty circles represent the 100 kDa MWCO Hydrosart® membrane, full black squares represent the 30 kDa PES membrane and empty squares represent the 100 kDa PES membrane.
Separations 11 00073 g002
Figure 3. TMP excursion for 100 kDa MWCO PES Sartocon® Slice 200 flat sheet cassette vs. 100 kDa MWCO hollow fiber. (A) Feed flow rate of 260 mL/min in flat sheet cassette and (B) 8000 s1 shear rate (212 mL/min) in hollow fiber. * Minimum TMP value obtained at used feed flow rate with totally opened retentate valve.
Separations 11 00073 g003
Figure 4. Profiles of permeate flow rate (grey dashed line), TMP (full black line), volume of retentate (blue full line), and volume of permeate (green dashed line) as a function of process time, obtained for the 100 kDa PES Sartocon® Slice 200 flat sheet cassette (upper panels) and the 100 kDa PES hollow fiber (bottom panels). Three independent experiments were performed.
Separations 11 00073 g004
Figure 5. Total particle recovery (A), total protein removal (B), DNA removal (C), and average flux (D) for the 100 kDa PES Sartocon® Slice 200 flat sheet cassette vs. the 100 kDa PES hollow fiber. Full grey bars represent Ambr® CF 10 cm2 (SS), full black bars represent Sartocon® Slice 200 180 cm2 (SC), and dashed bars represent the hollow fiber device (HF).
Separations 11 00073 g005
Table 1. Results of the DoE for the parameters total particle recovery (TP recovery), average flux, total protein removal, and total DNA removal using the 30 and 100 kDa MWCO PES and Hydrosart® flat sheet membranes with TMP and QFeed as factors. Center points values are highlighted in bold.
PESHydrosart®
MWCO (kDa)QFeed (mL/min)TMP (mbar)TP Recov. (%)Avg. Flux (LMH)Protein Remov. (%)DNA Remov. (%)TP Recov. (%)Av. Flux (LMH)Protein Remov. (%)DNA Remov. (%)
30506008923743386498113
509008626773574368219
756009727752269558125
759008532783080548118
62.57509523783582468019
62.575092271013188548123
62.57509325782391567337
100503008546906984508453
506007730834179368142
753009363887285668457
756008038875286437737
62.54508350834386457949
62.54508052865782417739
62.54508846865577457947
Table 2. Results of the total particle recovery (TP recovery), average flux, total protein removal, and total DNA removal for the triplicate Sartoflow® Smart experiments using the 100 kDa MWCO PES Sartocon® Slice 200 flat sheet cassette and the 100 kDa PES hollow fiber.
DeviceRunQFeed (mL/min)TMP (mbar)TP Recovery (%)Average Flux (LMH)Protein Removal (%)DNA Removal (%)
Flat sheet cassette
 
100 kDa PES
1st 26060093387929
2nd 90367941
3rd 90378037
Hollow fiber
 
100 kDa PES
0.5 mm ID
1st 21230088197563
2nd 88187363
3rd 86207565
Disclaimer/Publisher’s Note: The statements, opinions and data contained in all publications are solely those of the individual author(s) and contributor(s) and not of MDPI and/or the editor(s). MDPI and/or the editor(s) disclaim responsibility for any injury to people or property resulting from any ideas, methods, instructions or products referred to in the content.

