Article

Mechanism of Alleviating Acute Lung Injury in Mice from Serum Metabolomics Analysis of Cordyceps fumosorosea

1
Yunnan Herbal Laboratory, School of Life Science, Yunnan University, Kunming 650504, China
2
The International Joint Research Center for Sustainable Utilization of Cordyceps Bioresources in China and Southeast Asia, Yunnan University, Kunming 650201, China
3
College of Science, Tibet University, Lhasa 850001, China
4
Institutional Center for Shared Technologies and Facilities of Kunming Institute of Zoology, Chinese Academy of Sciences, Kunming 650223, China
5
Institute of Medical Biology, Chinese Academy of Medical Sciences, Kunming 650118, China
*
Author to whom correspondence should be addressed.
Separations 2024, 11(3), 74; https://doi.org/10.3390/separations11030074
Submission received: 17 January 2024 / Revised: 9 February 2024 / Accepted: 12 February 2024 / Published: 27 February 2024
(This article belongs to the Section Materials in Separation Science)

Abstract

:
Cordyceps fumosorosea is a common species within the Cordyceps genus. In this study, the protective effect of Cordyceps fumosorosea mycelium was investigated to clarify the potential mechanism of alleviating acute lung injury in mice using serum metabolomic analysis, which could provide a theoretical basis for the clinical application of C. fumosorosea. Sixty mice were divided into six groups (NS, LPS, MIX, COR, COC and DMX). Lung cell nuclei were analyzed using hematoxylin and eosin staining and cellular changes were observed using transmission electron microscopy (TEM). Metabolomic analyses using liquid chromatography-mass spectrometry (LC-MS) were used to identify various compounds. In all six groups, lung nuclear inflammation was observed in the COR, COC and DMX groups, whereas the NS, LPS and MIX groups showed no cellular changes, indicating good health. Metabolomic analysis using LC-MS identified 1607 compounds across various classes. Statistical analyses, including the coefficient of variation and OPLS-DA, revealed distinct metabolic proles, indicating significant changes after the consumption of C. fumosorosea mycelia. Lipids constituted the largest proportion (30.37%) of the 30 identified classes and subclasses of metabolites. A total of 617 differentially accumulated metabolites (DAMs) were identified, both unique and shared between comparisons. Metabolite analysis identified 617 differentially accumulated metabolites, with 493 common to the LPS vs. MIX group, 75 in the LPS vs. NS group and 49 in the LPS vs. NS group and LPS vs. MIX group. This comprehensive investigation suggests that C. fumosorosea mycelia treatment holds promise as a therapeutic intervention for lung injury, influencing both the histopathological (lung) features and serum metabolic profiles.

1. Introduction

Traditional Chinese Medicine (TCM) originated in China and has a rich history spanning millennia [1]. This medical system has garnered significant attention owing to its potential anti-inflammatory properties and its ability to enhance the immune response of the body. These attributes have been suggested to contribute to the prevention and protection against acute organ injuries (AOI), while also improving symptoms, quality of life and lung function [2,3]. Acute lung infections (ALI) and their severe form, acute respiratory distress syndrome (ARDS), can ultimately result in multiple organ dysfunction syndrome (MODS) in lung tissues [4]. In MODS, respiratory dysfunction can manifest as pulmonary infiltrates and hypoxemia. Pulmonary infiltrates involve abnormal substances such as fluid, cells or inflammatory debris in the lung tissue or airspaces. ALI, on the other hand, is a severe respiratory condition triggered by various factors, including pneumonia, sepsis, burns, trauma and systemic inflammatory reactions rooted in diffuse lung cell injuries (DLCI) [5]. ALI is characterized by lung tissue damage and intense oxidative stress caused by pathogens, chemicals and trauma, making it a serious and potentially life-threatening condition [6]. Both ALI and ARDS are characterized by severe hypoxemia, pulmonary edema and neutrophil accumulation in lung tissues. These conditions frequently afflict critically ill patients and can result in significant morbidity and mortality [7,8]. Sepsis, which is a systemic inflammatory response to infection, is a major cause of ALI. Lipopolysaccharide (LPS), a core component of the outer membrane of gram-negative bacteria, is a potent inducer of inflammatory responses and is capable of replicating human ALI features in mice [9,10]. Pulmonary macrophages (PM), also known as alveolar macrophages, are primary inflammatory cells found in the alveoli during the early stages of ALI [11,12]. Alveolar macrophages are a type of pulmonary macrophage (PM) that play a critical role in lung immune defense against micro-organisms and clearing them from the respiratory system. When stimulated by LPS and other factors, the release of TNF-α and other proinflammatory agents can initiate a cascade of events, leading to uncontrolled inflammation. This excessive inflammatory response can result in damage to various tissues and organs, including the lungs, and in severe cases ALI and ARDS [13,14]. ARDS has emerged as a significant focus of clinical research, owing to its complex nature and high mortality rate. Despite recent advances in ARDS diagnosis and treatment, effective management remains a formidable challenge [15,16]. Periplaneta americana, commonly known as the American cockroach, belongs to the insect class Insecta, order Dictyoptera and family Blattidae [17]. Dried worms or fresh adult P. americana have been used in Traditional Chinese Medicine (TCM) [18]. The active compounds extracted from P. americana have been formulated into clinical drugs in China, including “Xiaozheng Yigan Tablets,” “Kangfuxin Liquid,” “Ganlong Capsule,” and “Xinmailong Injection.” Among these, “Xiaozheng Yigan Tablets” are notable oral medications with strong antitumor and antibacterial properties. Research has demonstrated its efficacy in reducing liver inflammation, promoting liver function recovery and diminishing liver fibrosis in individuals with hepatitis B virus (HBV) infection [18,19]. Insect pathogenic fungi have long been considered potential agents for the biological control of various insects. Kepler et al. reclassified I. fumosorosea, S. fumosorosea and P. fumoroseus as C. fumosorosea [20,21]. Cordyceps fumosorosea has a broad geographical distribution, strong ecological adaptability, ease of cultivation, rapid growth, spore production and widespread use in biological control. Owing to its wide host range, it is a highly efficient and cost-effective insecticide with a broad spectrum of activity, low production costs and safety for both humans and nontarget species [22]. Nevertheless, there are challenges associated with C. fumosorosea, such as a delay in the manifestation of its effects after practical application and susceptibility to environmental factors. Recent studies have indicated that nanoparticles of C. fumosorosea can effectively manage various insect pests [23,24]. Different strains of C. fumosorosea have also demonstrated pathogenicity against various insect species worldwide [25,26]. This study was aimed at investigating the protective effect of C. fumosorosea mycelium and clarifying the potential mechanism of alleviating acute lung injury in mice using serum metabolomic analysis, which could provide a theoretical basis for the clinical application of C. fumosorosea.

2. Materials and Methods

2.1. Testing Samples

(1) Cordyceps fumosorosea: Cordyceps fumosorosea is an important species in the genus of Cordyceps; (2) Periplaneta americana: the American cockroach, Periplaneta americana (Linnaeus) is the largest of the common peridomestic cockroaches; (3) Kunming mice (KM): Kunming mice (KM) are the most widely used strain in China.

2.2. Preparation of C. fumosorosea Mycelium Solution

Cordyceps fumosorosea cultures were placed in a 250 mL Erlenmeyer flask containing 100 mL of basal medium, which consisted of soaking the P. americana 35 g/flask in water for 4 h before use, glucose (C6H12O6) 1.35 g, 5 mL/flask of water and 0.3 g/flask of glycerin (C3H8O3). The mixture was sterilized at 121 °C and 105 Pa for 30 min and subsequently introduced into a sterile culture dish to create 24 solid media [27]. Wild C. fumosorosea specimens were collected in Dayao County, Chu Xiong City, Yunnan Province, China. The culture medium was inoculated with C. fumosorosea using a tissue separation technique. The mycelia of C. fumosorosea were cultivated for 2 months at 18 °C. Following the removal of the culture medium, 20 g of fresh C. fumosorosea mycelia was obtained through artificial cultivation. The mycelia were then dried at 50 °C for 10 h, ground into a fine powder and passed through a 100-mesh sieve. To prepare a solution, 1.5 g of C. fumosorosea mycelia was mixed with distilled water to obtain a 45 mg/mL concentration of C. fumosorosea mycelium solution. The solution was then stored at 4 °C [28].

2.3. Grouping and Administration

The experiment involved animals that were maintained under controlled environmental conditions for 1 week at a temperature of 20 ± 2 °C and a relative humidity of 55 ± 5%. The animals were subjected to a 12-h day–night cycle and had unrestricted access to food and water. The study protocol was approved by the Medical Ethics Committee of Yunnan University (MECYU). Sixty mice were divided into six distinct groups: NS (normal saline), LPS (lipopolysaccharide), MIX (C. fumosorosea mycelia + Periplaneta americana), COR (C. fumosorosea mycelia), COC (Periplaneta americana) and DMX (5-Dehydro-m-xylylene). On the first day, the mice in the NS and LPS groups were intraperitoneally injected with physiological saline. In contrast, the COR and DXM groups received injections of C. fumosorosea solution (45 mg/mL), mixture (COR + COC) solution and dexamethasone solution for seven consecutive days. After the 7-day treatment, the LPS, COR, mixture (COC) and DXM groups were anesthetized and their tracheas were surgically exposed. Tracheal puncture was performed using a miniature sampler and LPS solution (5 mg/kg) was administered to induce acute lung injury. In the NS group, 15–20 min following the administration of physiological saline, the mice were anesthetized and sterile saline was dripped into their tracheas. Blood samples were collected from the orbital plexus of each mouse 6 h after the establishment of the acute lung injury model for each group. The collected blood was cooled on ice, followed by centrifugation at 3500 rpm for 10 min to separate the serum, which was subsequently stored at −80 °C in a refrigerator [29].

2.4. Acute Lung Injury Induced by Lipopolysaccharides

The mice were anesthetized with an intraperitoneal injection of 1% sodium pentobarbital at a dose of 30 mg/kg. Following anesthesia, the limbs and teeth of the mice were immobilized and sterilized using a 75% alcohol wipe. A longitudinal incision was made along the central neck of each mouse. This incision provided access to the tracheal cartilage ring, which is part of the airway. A microinjector, which is a device for injecting small volumes of substances, was directed toward the proximal level of the tracheal cartilage ring. LPS, and was used to induce acute lung injury by slowly injecting the mice through a microinjector. In contrast, the control group, known as the normal saline (NS) group, received an injection of sterile saline instead of LPS. The microsampler was then withdrawn, indicating that the injection procedure was complete. The mice were immediately placed in an upright position and rotated.

2.5. Ratio of Wet and Dry Weight

The weight of the mice was measured before the start of the experiment. Anesthesia was administered to ensure that the mice were unconscious and free from pain. The entire lung of each mouse was extracted and any remaining blood in the lung tissue was removed using wet cotton. The weight of the middle lobe of the right lung was measured and recorded as the wet weight. The lung samples were then placed in an oven at 60 °C for 24 h to complete the drying process. After drying, the lung samples were weighed again and their weights were recorded as the dry weight of the lungs. The lung coefficient was calculated as a percentage using the following formula: lung coefficient (%) = lung wet/dry weight ratio Ö100. The data were statistically analyzed using SPSS software (version 22.0; IBM Corp., Armonk, NY, USA). Data that adhered to a normal distribution are presented as mean ± standard deviation (x ± SD). For multiple sample comparisons where variances were equal, a one-way analysis of variance (ANOVA) and q-test were used. In cases where variances were unequal, a rank-sum test was performed for multiple sample comparisons. For two-group comparisons, a rank-sum test was performed for two independent samples [29].

2.6. Hematoxylin and Eosin Stains

Lung tissue samples were acquired and preserved in a 10% paraformaldehyde solution. Subsequently, 5-μm sections were generated from paraffin-embedded tissue blocks and subjected to hematoxylin and eosin (HE) staining. The stained sections were observed under an optical microscope (Olympus, Tokyo, Japan). To compute the lung injury score, two independent researchers, who were unaware of the group identities, adhered to a previously established protocol [30]. The lung injury score was determined based on five distinct factors: the presence of neutrophils in the alveolar space; neutrophils in the interstitial space; the existence of hyaline membranes; the presence of proteinaceous debris within airspaces; and the thickening of alveolar septa [30].

2.7. Microscopic Observation

The samples were placed in a fixation solution overnight at 4 °C, consisting of 2.5% glutaraldehyde [C5H8O2] in 0.1 M phosphate buffer (pH 7.2), and subsequently rinsed 3 times for 7 min each with the same 0.1 M phosphate buffer (pH 7.2). Subsequently, the samples were post-fixed in a solution containing 1% osmium tetroxide [OsO4] and 1.5% potassium ferrocyanide [K4Fe(CN)6] for 2 h at 4 °C, followed by a triple rinse in “double-distilled water” [ddH2O] for 7 min each. Next, the samples were subjected to a series of dehydration steps using ethanol [C2H5OH] and then transitioned into acetone [(CH3)2CO] for 5-min intervals before being embedded in SPI-Pon 812 resin and polymerized at 60 °C for 48 h. Uniform sections measuring 60 nm in thickness were prepared using a Leica EM UC7 ultramicrotome. These ultrathin sections were affixed to copper grids and double stained with a solution of 2% uranyl acetate [UO2(CH3CO2)2·H2O] and lead citrate [C6H8O7]. The prepared samples were examined using a JEM-1400 Plus transmission electron microscope at an operating voltage of 80 kV [29].

2.8. Extraction of Metabolite from Serum

Fifteen quality control (QC) samples were collected at various intervals during the sample mass spectrometry. The assessment of data quality involved the analysis of the repeatability of QC sample testing. To commence the procedure, frozen serum and QC samples were defrosted in a refrigerator until all observable ice had liquefied. Subsequently, 100 μL of each sample, including the QC samples, was transferred to an Eppendorf (EP) tube, while the rest of the samples remained frozen. Subsequently to this, 700 μL of an extractant solution containing the internal standard 1 (a mixture of methanol [CH3OH], acetonitrile [C2H3N] and water [H2O]) was added to each tube. The samples were thoroughly mixed and stored in a refrigerator at −20 °C for 2 h. The samples were then centrifuged at 25,000× g at 4 °C for 15 min. The resulting supernatant was carefully transferred to a new EP tube and a drying apparatus was employed to eliminate the solvent. Subsequently, 180 μL of methanol/pure water solution (1:1 v/v) was combined with the dried residue and the mixture was vortexed for 10 min until complete dissolution was achieved in the reconstituted solution. This solution was subjected to another round of centrifugation and the resulting supernatant was transferred to another EP tube. Finally, 20 μL of each sample was combined with the QC samples and the prepared supernatant was subjected to LC-MS/MS analysis [29].

2.9. UPLC-MS Analysis

Metabolite detection was performed using a Waters 2777c ultraperformance liquid chromatography (UPLC) system (Waters, Milford, MA, USA) combined with a Q Exactive HF high-resolution mass spectrometer (Thermo Fisher Scientific, Waltham, MA, USA). Separation of compounds was achieved using a Waters ACQUITY UPLC BEH C18 column (1.7 μm, 2.1 mm × 100 mm) maintained at a temperature of 45 °C. The composition of the mobile phase varied depending on the ion mode. In the positive mode, the mobile phase consisted of 0.1% formic acid (A) and acetonitrile (B), whereas the negative mode consisted of 10 mM ammonium formate (A) and acetonitrile (B). The elution program involved the following steps: 0–1 min, 2% B; 1–9 min, 2–98% B; 9–12 min, 98% B; 12–12.1 min, 98–2% B; and 12.1–15 min, 2% B. The flow rate of the mobile phase was set at 0.35 mL/min, with an injection volume of 5 μL. Mass spectrometry analysis was performed using a Q Exactive HF instrument with primary and secondary mass spectrometry data acquisition. The full scan range was set from 70 to 1050 m/z (mass-to-charge ratio) at a resolution of 120,000. The automatic gain control (AGC) target for MS acquisition was set to 3 × 10⁶, with a maximum ion injection time of 100 ms. The top 3 precursor ions were selected for subsequent MS/MS (tandem mass spectrometry) fragmentation, with a maximum ion injection time of 50 ms and a resolution of 30,000. The AGC was set to 1 × 10⁵ and the stepped normalized collision energies were set to 20, 40 and 60 eV. The electrospray ionization (ESI) parameters were configured as follows: sheath gas flow rate of 40; auxiliary gas flow rate of 10; spray voltage of 3.80 (in positive-ion mode) or 3.20 (in negative-ion mode); capillary temperature of 320 °C; and auxiliary gas heater temperature of 350 °C [31,32].

2.10. Extraction and Identification Metabolite Ion Peak

The mass spectrometry data were imported into Compound Discoverer v.3.3, software developed by Thermo Fisher Scientific (Waltham, MA, USA). Subsequently, the mass spectrometry data were analyzed alongside the BGI metabolome database (IMDb), McCloud database and the online ChemSpider database. This comprehensive analysis yielded a data matrix containing details such as metabolite peak areas and identification outcomes. This table was further scrutinized and processed using specific parameters, including maintaining a parent ion mass deviation of less than 5 ppm, ensuring a mass deviation of fragment ions of less than 10 ppm and maintaining a retention time deviation of less than 0.2 min. Statistical evaluation of metabolites with detailed identification was performed based on their final classification [29].

3. Statistical Analysis

The Compound Discoverer-generated file was subjected to the initial data processing and subsequent analysis using MetaX. The data preprocessing steps involved the following procedures: (1) Signal correction was performed using a quality-control-based robust LOESS to rectify batch effects [33]; (2) normalization was conducted to obtain the relative peak areas using probabilistic quotient normalization [34]; (3) metabolites with a coefficient of variation exceeding 30% in their relative peak areas in excluded QC samples were excluded. Principal Component Analysis (PCA) and partial least squares discriminant analysis (PLS-DA) were performed using the SIMCA software Version 14.1 (Umetrics AB, Umeå, Sweden). For each comparison group, the fold change of each metabolite was calculated and statistical significance was assessed using Student’s t-test. The p-value was used to determine the significance level of the difference between the two sample groups. The fold change indicated whether the mean values of the metabolites in both sample groups exhibited changes, whereas the p-value determined whether these changes were statistically significant. Only metabolites meeting the criteria of fold change p-values ≥ 1.2 or ≤0.83 and p-values < 0.05 were categorized as differential metabolites. To analyze the metabolic pathways associated with the differentially expressed metabolites, we employed the online tool MetaboAnalyst (https://www.metaboanalyst.ca/ [accessed on 3 March 2023]).

4. Results

4.1. Lung Wet/Dry Weight

The lung wet/dry weight ratio showed (Figure 1) substantial variation among the groups. In particular, the lung coefficients of mice in the LPS group were significantly higher than those of mice in the NS group (p < 0.001). In contrast, both the MIX and DXM groups displayed a declining trend in lung index compared to the LPS group (p < 0.01) but also showed an increase compared to the NS group (p < 0.05). These findings suggest that C. fumosorosea mycelia have the potential to decrease lung coefficients in mice, similarly to the effects of DXM, COR and COC.

4.2. Hematoxylin and Eosin

Examination of lung tissues by histopathology revealed that, in control mice, the lung structure appeared typical and showed no histopathological changes when viewed under a light microscope. Alveolar macrophages (AM) are a type of pulmonary macrophage (PM) that are crucial in improving acute lung injury (ALI) as they produce and release various inflammatory mediators in response to infection or noninfectious stimuli. Hematoxylin and eosin (HE) staining suggested that the lung tissue structure of mice in the NS group was clear, with no inflammatory cell exudation in the alveolar cavity and no thickening of the alveolar septa. In contrast, the model group displayed indications of alveolar collapse, thickened alveolar walls, alveolar edema and significant infiltration of inflammatory cells. Conversely, both the MIX and NS groups showed fewer occurrences of alveolar collapse, no thickening of alveolar walls and no notable infiltration of inflammatory cells. Their therapeutic effects were comparable to those of DXM, COC and COR compared to the LPS group (Figure 2).

4.3. Transmission Electron Microscopy (TEM) Observation

The observations made using transmission electron microscopy were consistent with the results obtained from HE staining (Figure 3). The electron density of the mitochondrial matrix was higher than that of the mitochondrial membrane. The rough endoplasmic reticulum surrounded the mitochondria and lamellar bodies with ribosomes attached to the surface. The lamellar body shape was normal and the cell surface was rich in microvilli. Mitochondria in the LPS group showed severe swelling and cristae fractures and obvious pyknosis of the inner mitochondrial membrane structure was observed. The endoplasmic reticulum was relatively normal, myeloid inclusions appeared in some cell nuclei and lamellar bodies were normal. However, the massive fusion of the microvilli on the cell surface almost disappeared. In the COC group, the mitochondria were severely swollen, electronic density was low and cristae almost disappeared. Abnormal membrane pyknosis or karyopyknosis produced a myeloid structure inside the mitochondria and there seemed to be a tendency for fusion between mitochondria. The structure of the endoplasmic reticulum was relatively normal, lamellar bodies had the largest number of holes among the six groups and the microvilli on the cell surface appeared to be fused and enlarged. In the COR group, large mitochondria appeared, the cristae structure was disordered, the cristae broke, the endoplasmic reticulum cisternae widened and swelled, the lamellar bodies were normal and the cell surface microvilli developed, but partial fusion occurred. Mitochondria in the MIX group were significantly swollen, the overall electron density decreased and multiple mitochondria wrapped in a double-layer membrane structure formed autophagosomes. The endoplasmic reticulum was similar to NS, the lamellar bodies were normal and the cell surface microvilli became shorter.

4.4. Extraction and Identification Metabolite Ion Peak (UPLC-MS/MS)

A standard base peak chromatogram (BPC) was generated for each set of samples in both positive and negative ion modes, offering a visual representation of metabolite detection within the blood serum samples. The prepared blood serum sample was injected into the UPLC-MS system for chromatographic separation and mass spectrometric detection. The chromatographic conditions such as column type, mobile phase composition, flow rate and gradient program were optimized to achieve efficient separation of analytes. The appropriate ionization mode (positive or negative), mass analyzer and detector settings were selected based on the analyte properties and the desired sensitivity and selectivity of detection. A higher number of ion peaks observed in the BPC chart typically signifies a greater diversity of identified metabolites. As illustrated in Figure 4, the total ion flow chromatogram reflects the ion intensity of the highest peak at 100%. The separation between the spectral peaks in the chart is satisfactory. Through ULC-MS/MS analysis, 1607 compounds were successfully identified. These compounds encompass a wide range of categories including phytochemical compounds, biologically significant molecules, lipids and other organic compounds. Notable among the identified compounds are those derived from plants such as terpenoids, flavonoids and alkaloids. Furthermore, compounds with significant biological roles, including amino acids, peptides, analogs, benzene and its derivatives, organic acids, steroids, and their derivatives, were identified.

4.5. Coefficient of Variation Analysis (CV)

CV revealed that the samples within each group exhibited strong clustering and concentration in both positive and negative ion modes. These findings demonstrated the high precision, reproducibility and stability of the assay system. Moreover, the serum samples displayed distinct clustering patterns with discernible separation trends observed among the serum samples within each group (Figure 5). These results implied significant alterations in the serum metabolic profiles of the samples following consumption. After selecting all QC samples from the dataset, the repeatability of the QC samples was assessed by calculating the coefficient of variation (CV) for each metabolite’s intensity. A higher proportion of metabolites with low CV values in the QC samples indicated greater stability of the experimental data. In this case, over 60% of the compounds in the QC samples had CV values of less than 0.30, indicating that the quantity of experimental data met the qualification criteria.

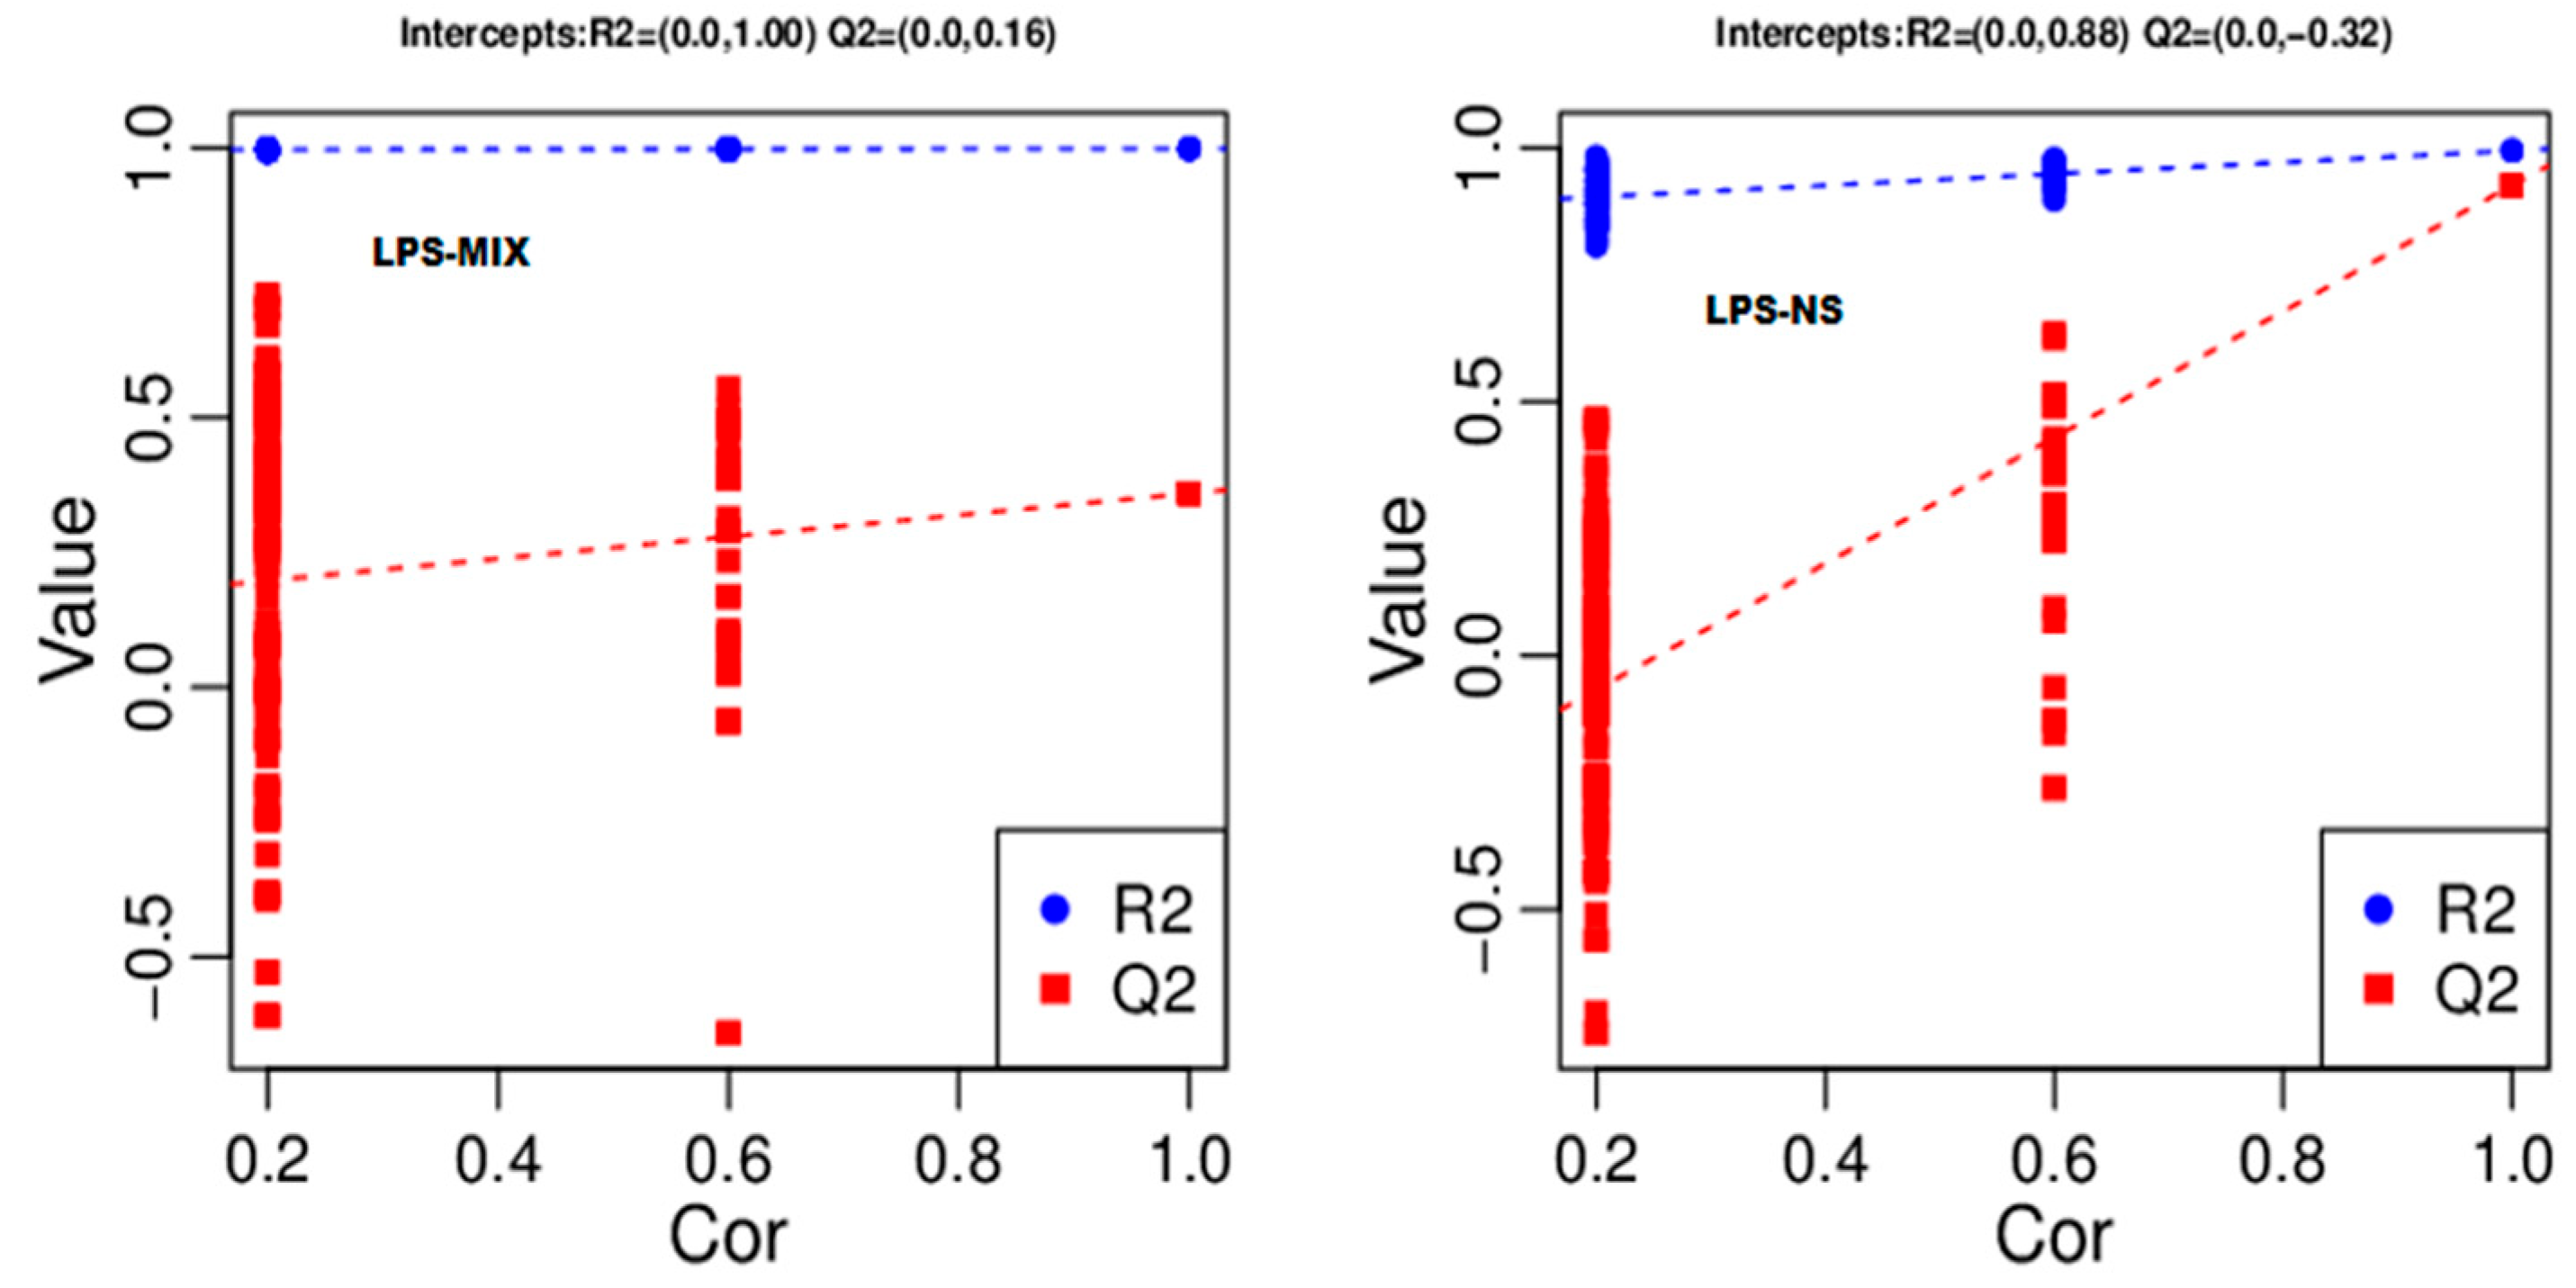
4.6. Partial Least Squares Discriminant Analysis (PLS-DA) Analysis

PLS-DA was conducted on two distinct sets of biological samples to establish a correlation between metabolite expression and sample categorization, thereby facilitating anticipation of sample classes. The model produced the following outcomes: R2Y = 1 and Q2 = 0.92 for the LPS and NS control groups and R2Y = 0.99 and Q2 = 0.52 for the LPS and MIX groups (Figure 6). These findings were deemed valid and reliable. The x-axis denotes PC1, which represents the first principal component, and the values in parentheses indicate the proportion of the variance explained by PC1. The y-axis represents PC2, the second principal component, with values in parentheses signifying the explained variance in PC2. Each data point corresponds to an individual sample and the diverse colors represent different sample groupings. Additionally, the ellipses encircling the data points delineate 95% confidence intervals.

4.7. Metabolic Pathway Enrichment Analysis

The most effective factor in LPS_MIX was equal to 9.419_523.26 with the highest correlation (9 correlations). Therefore, any type of change to improve the studied traits and changes in their expression process should be performed within this limit. In addition, the present results are confirmed by the heatmap. However, the LPS_NS was equal to 8.057_391.27 with the highest correlation (9 correlations). Therefore, any type of change to improve the studied traits and changes in their expression process should be performed within this limit. In addition, the present results are confirmed by the heatmap in Figure S3, where red represents positive correlation, blue represents negative correlation and the darker the color, the greater the absolute value of the correlation coefficient between LPS_MIX and LPS_NS. “*” represents a p-value of <0.05. When the number of differential metabolites is greater than or equal to 20, the first 20 are differential metabolites.

4.8. Principal Component Analysis

In inferential statistical analysis, a concept called principal component analysis (PCA) is used. This analysis is a multivariate technique used to reduce the dimensions of a dataset while preserving as much information as possible. In simpler terms, we use the PCA analytical method to reduce the number of variables as much as possible and summarize them into a few main and effective components. In the current study, the PCA results showed that the LPS and MIX groups were consistent with the original data based on the first few components (Figure 2A); therefore, the variables can be reduced to a smaller number that controls the most phenotypic changes. Based on PCA1 (approximately 37.81) and PCA2 (21.48%) of the phenotypic changes, the first few components were controlled. Figure 2B shows that, according to PCA1 and PCA2, approximately 47.48% and about 22.77%, respectively, of the phenotypic changes were controlled by the first few components. In general, NS compared to MIX based on LPS had a greater standard deviation in its results (Figure 2C). In the presence of LPS, MIX content increased (Figure 2D).

4.9. Orthogonal Partial Least Squares Discriminant Analysis (OPLS-DA) Analysis

OPLS-DA was conducted on two distinct sets of biological samples to establish a relationship between metabolite expression and sample classification, enabling the accurate prediction of sample classes. The model exhibited the following parameters: R2Y = 0.995, Q2 = 0.926, R2 = (0.0, 0.88) and Q2 = (0.0, −0.32) for the LPS and NS control groups (Figure 7), R2Y = 0.999 and Q2 = 0.360, R2 = (0.0, 1.00) and Q2 = (0.0, 0.16) for the LPS and MIX, thus demonstrating their validity and reliability. R2Y represents the interpretation rate of the classification matrix Y, while Q2 indicates the prediction ability of the model. A higher value for both R2Y and Q2 indicates greater stability and reliability of the model. Specifically, a Q2 value > 0.5 suggests that the model’s predictive performance is satisfactory. Model verification involves examining the intercepts of the y-axis in the regression lines R2 and Q2. In general, Q2 < 0.

4.10. Identification of Metabolites Classes and Sub-Classes

LPS, MIX and NS were the sample groups and 30 different classes and subclasses of differential metabolites were identified. Metabolites were counted based on the identified results. The count was performed according to the final class and the results were displayed together if the final class belonged to a large class of lipids, excluding compounds with biological roles. Phytochemical compounds and lipids in the three major classes were represented separately. It is important to note that not every metabolite contained final class information. If a metabolite was a lipid, the number of metabolites was counted by subclass. The results, as verified in Figure 8a,b, show 30 different classes and subclasses of metabolites with corresponding numbers and percentages (%). Lipids accounted for 195 metabolites (30.37% of the total). Amino acids, peptides and analogs comprised 74 metabolites (11.53%). Other categories included 64 metabolites (9.97%); benzene and derivatives with 46 metabolites (7.17%); organic acids with 39 metabolites (6.07%); carbohydrates with 35 metabolites (5.45%); steroids and derivatives with 26 metabolites (4.05%); amino acids with 17 metabolites (2.85%); purines and derivatives with 15 metabolites (2.34%); indole and derivatives with 14 metabolites (2.18%); and bile acids, alcohols and derivatives as well as 14 metabolites (2.18%). Phenols and derivatives made up 2.02%, amines had 9 metabolites (1.4%), amines and derivatives accounted for 1.09%, nucleic acids and analogs had 6 metabolites (0.93%), indoles had 6 metabolites (0.93%), pyridine and derivatives had 5 metabolites (0.78%), alcohols had 5 metabolites (0.78%), imidazoles had 4 metabolites (0.62%), vitamins and derivatives had 2 metabolites (0.31%), pteridines and derivatives had 2 metabolites (0.31%), antibiotics had 1 metabolite (0.16%), flavonoids had 13 metabolites (2.02%), terpenoids had 12 metabolites (1.87%), phenylpropanoic acids had 10 metabolites (1.56%), alkaloids and derivatives had 3 metabolites (0.47%), coumarins and derivatives had 2 metabolites (0.31%), quinone has 1 metabolite (0.16%), lignans have 1 metabolite (0.16%) and lignans had 1 metabolite (0.16%). However, the results indicated that the maximum number of metabolites and the lowest percentage of metabolites (%) were reported in lipids, with 195 metabolite numbers and 30.37%, respectively. Similarly, the minimum number of phytochemical compounds among metabolites was determined.

4.11. Metabolic Pathway Analysis

Metabolic pathway enrichment analysis of differential metabolites, using the KEGG database, can unveil significantly altered metabolic pathways. This contributes to our understanding of biological phenotypes. Target pathways with a p-value of <0.05, or an impact of <0.1, were identified, as depicted. Three potential target pathways related to serum metabolites were identified using impact values and metabolite enrichment analysis. The first pathway is the pathway enrichment analysis bar chart in LPS vs. MIX (Figure S1a), ten metabolic pathways were identified, including D-glutamine and D−glutamate metabolism, pyrimidine metabolism, arginine and proline metabolism, African trypanosomiasis, glutamatergic synapse, GABAergic synapse, prostate cancer, ABC transporters, proximal tubule bicarbonate reclamation and nitrogen metabolism and the analysis of LPS vs. NS (Figure S1b), central carbon metabolism in cancer, protein digestion and absorption, mineral absorption, tryptophan metabolism, biosynthesis of amino acids, aminoacyl−tRNA biosynthesis, phenylalanine metabolism, bile secretion, ABC transporters, vitamin digestion and absorption. In LPS vs. MIX, four metabolites, D-glutamine and D-glutamate metabolism, pyrimidine metabolism, arginine and proline metabolism and ABC transporters, were significant at <5. In contrast, in the LPS vs. NS group, the levels of all metabolites were significantly higher than five.
The RichFactor on the x-axis signifies the proportion of differential metabolites annotated within the pathway (Figure S2a,b) relative to the total number of identified metabolites annotated within the same pathway. A larger RichFactor value corresponds to a higher ratio of differential metabolites within the pathway. The size of the data points was correlated with the number of annotated differential metabolites. In terms of a metabolic pathway enrichment analysis of the bubble chart, the x-axis rich factor was calculated as the number of annotated differential metabolites in the pathway divided by the total number of identified metabolites. A higher value indicated a greater ratio of annotated differential metabolites in the LPS vs. MIX and LPS vs. NS pathways.
The (Figure S2a,b) y-axis represents the name of the metabolic pathway, while the x-axis coordinate signifies the differential abundance score (DA score). The differential abundance score reflects the overall change in the metabolite abundance within a given metabolic pathway. A DA score of 1 indicated that all annotated differential metabolites in the pathway exhibited an upregulated expression trend, whereas a score of −1 suggested a downregulated expression trend for all annotated differential metabolites. The length of each line segment in the figure corresponds to the absolute value of the DA score and the size of the dot at the end of the line segment indicates the number of metabolites within the pathway. The larger dots represent a higher number of metabolites. The differential abundance score represents a pathway-centric approach to examining alterations in metabolic processes. It quantifies collective variations in metabolite levels within a given pathway. To gain insight into the broader modifications occurring within metabolic pathways, we conducted a differential abundance score analysis of the top 10 metabolic pathways, including pyrimidine metabolism, proximal tubule bicarbonate reclamation, prostate cancer, nitrogen metabolism, glutamatergic synapse, GABAergic synapse, D-glutamine and D-glutamate metabolism, arginine and proline metabolism, African trypanosomiasis and ABC transporters in LPS vs. MIX and LPS vs. NS samples. In LPS vs. MIX, all pathways were downregulated, except prostate cancer, as shown in Figure 9a. In LPS vs. NS, all pathways were downregulated, except vitamin digestion, and absorption was upregulated, as shown in Figure 9b, which exhibited significant enrichment in each comparison group. This allowed us to understand the global shifts in metabolism.

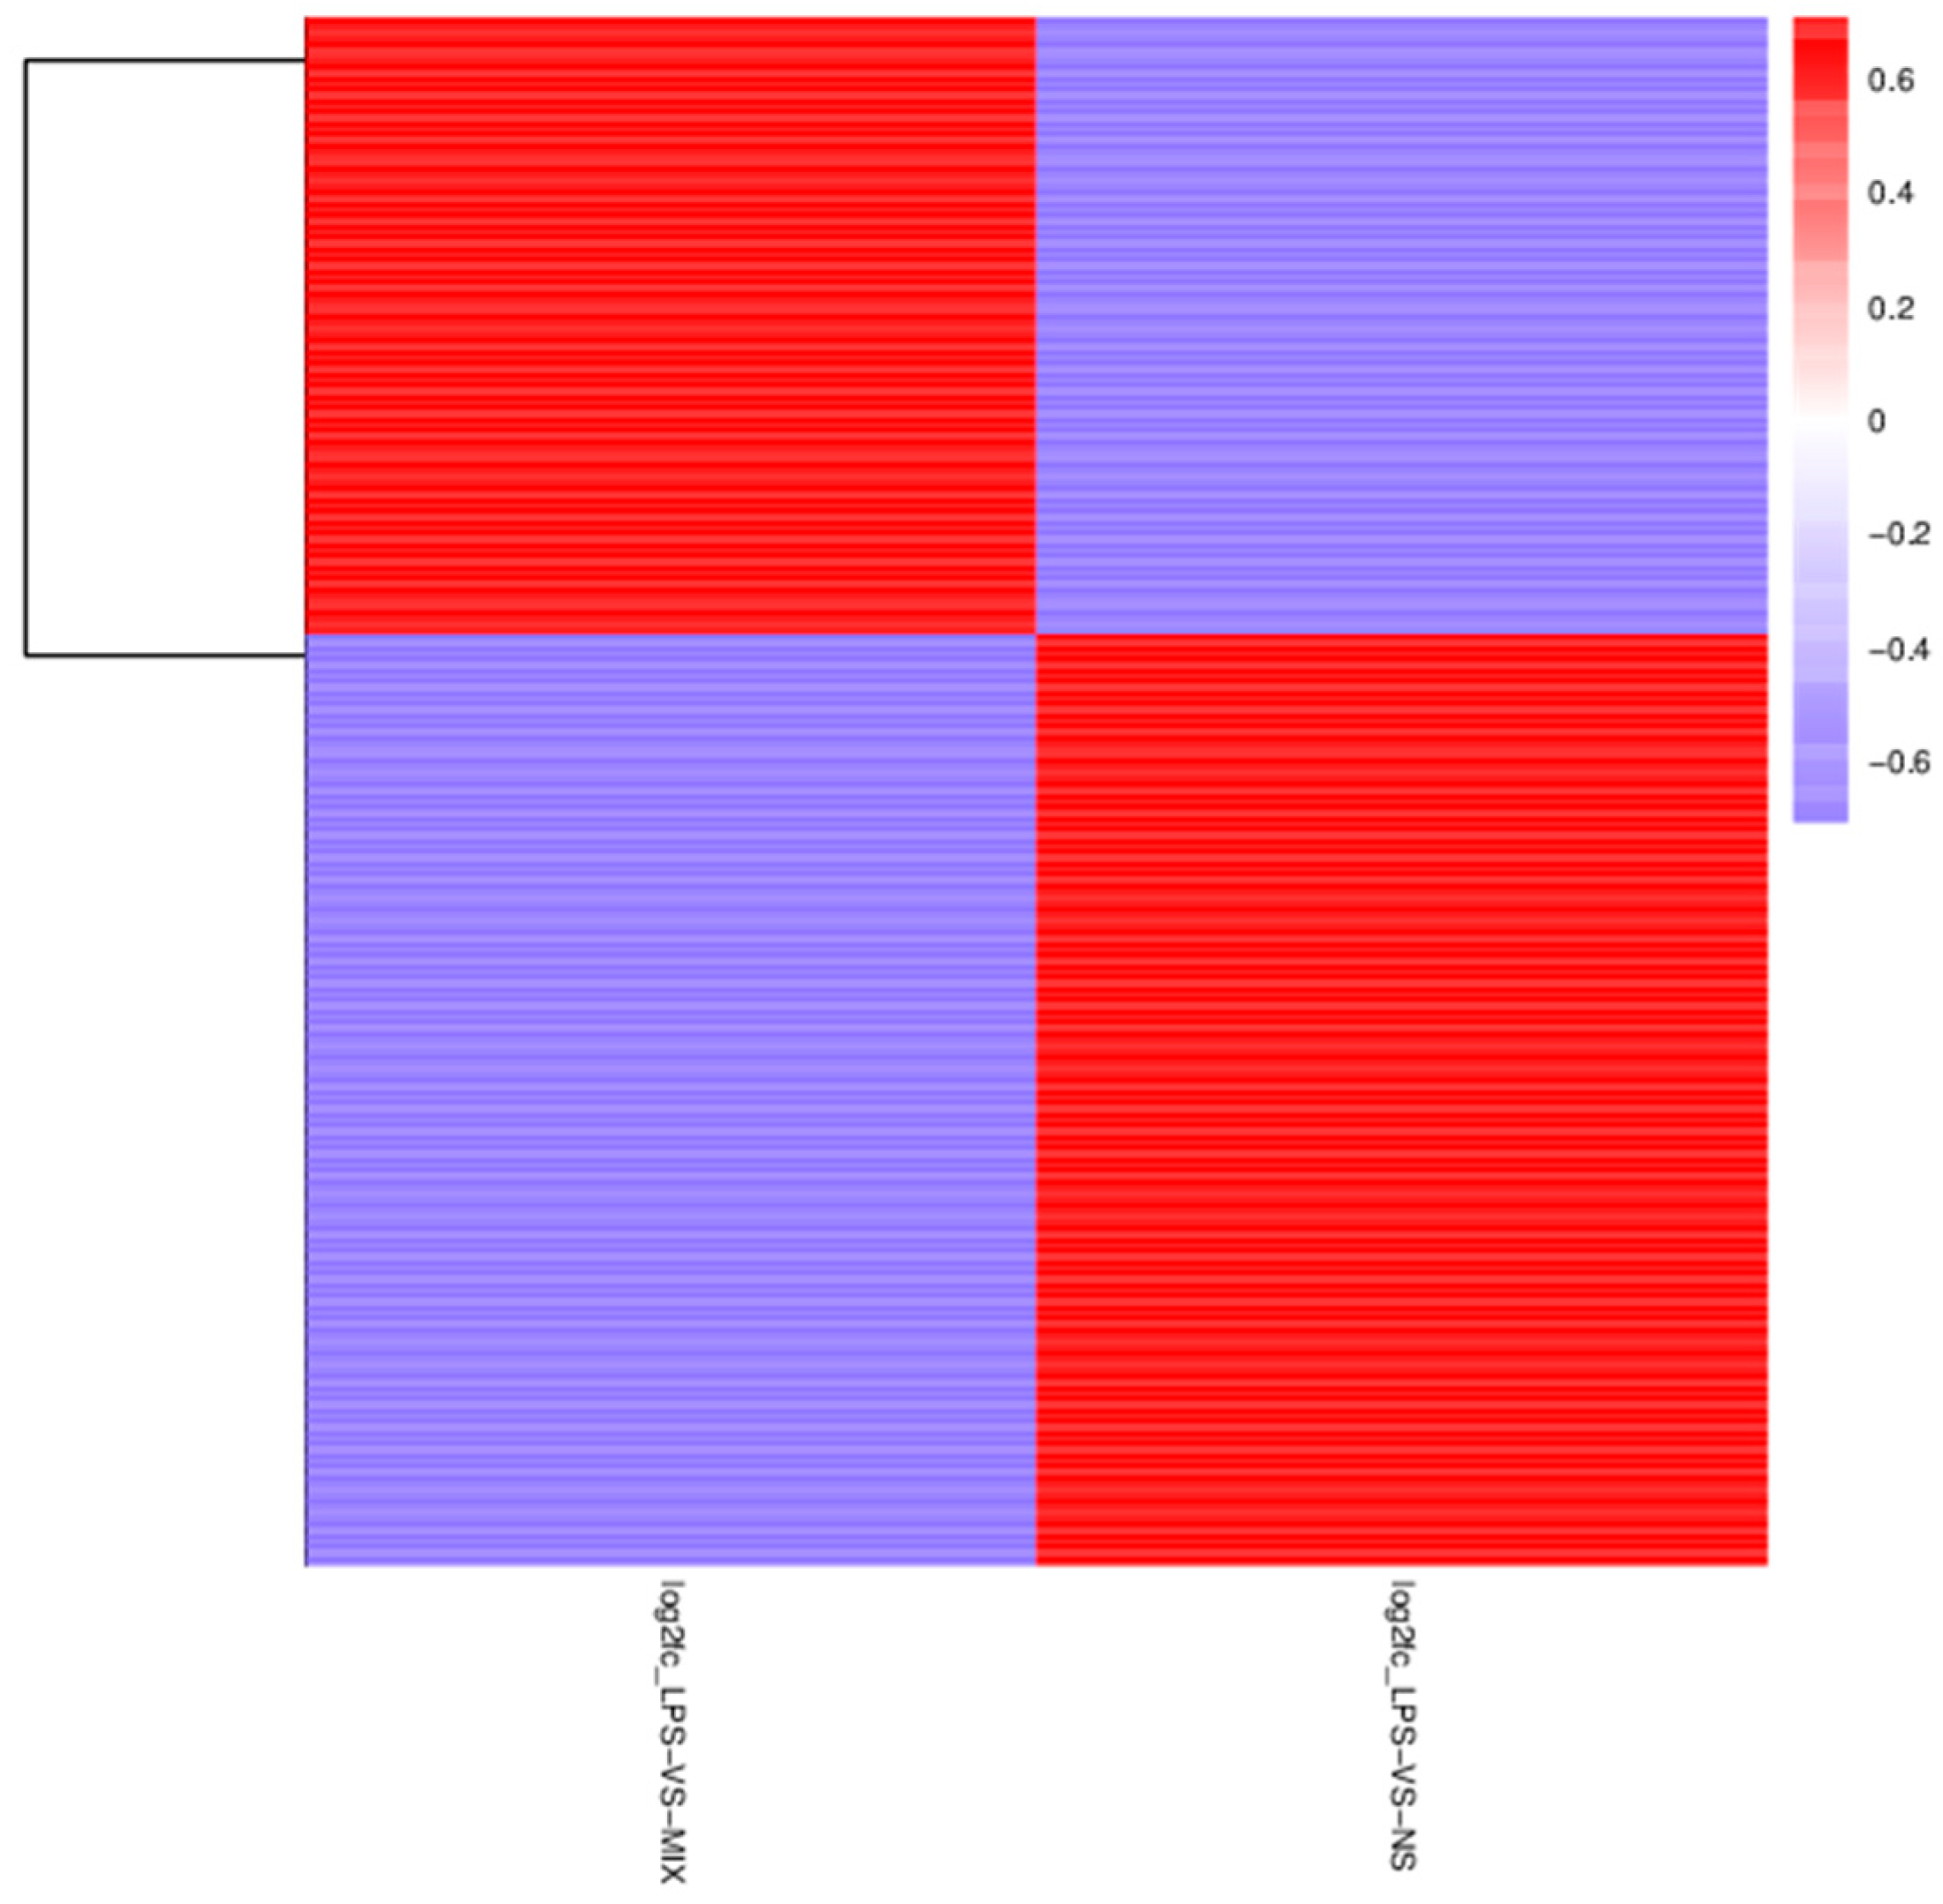
4.12. Identification of Differentially Accumulated Metabolites (DAMs)

Differential metabolites were acquired for each comparison group and compared and visualized for overlap, enabling consistency analysis. Additionally, the fold-change rule was applied to assess differences within each comparison group for all identified metabolites. Deferentially accumulated metabolites (DAMs) were defined as those exhibiting a fold change ≥2 or a fold change ≤0.5 and variable importance in the project (VIP) ≥1 between logscale_LPS vs. logscale_MIX and logscale_LPS vs. logscale_NS (p < 0.05). logscale_LPS vs. logscale_MIX and logscale_LPS vs. logscale_NS 617 were identified (Table 1). For logscale_LPS vs. logscale_MIX, a number of differential metabolites were upregulated at 350 (56.72%) vs. 389 (63.04) and downregulated at 267 (43.27%) vs. 228 (36.95). Of the 617 metabolites differentially accumulated in LPS vs. NS, 350 (56.72%) vs. 263 (42.62) and 267 (43.27%) vs. 354 (57.37) metabolites were upregulated and downregulated, respectively (Figure 10).
The results presented in Figure 11 were verified using Venn analysis to compare all the groups: LPS vs. MIX and LPS vs. NS. A total of 617 metabolites were examined, with 493 (79.90%) metabolites found in the LPS vs. MIX group and 75 (12.31%) metabolites found in the LPS vs. NS comparison. This analysis allowed for a visual comparison of 49 (7.94%) metabolites that were common and unique to the differential comparisons between the LPS vs. MIX and LPS vs. NS groups.

5. Discussion

In this study, we investigated the impact of (C. fumosorosea mycelia, cockroaches), their combination (MIX) on lung health and serum metabolites in a mice model of (LPS) acute lung injury (ALI). Inflammation can be described as the body’s reaction, whether localized or systemic, to tissue damage or various stimuli, including biological, chemical, physical and thermal factors [35]. When the inflammatory response intensifies, there is an increase in the levels of proinflammatory markers such as cytokines and inflammatory chemokines, which leads to a state of hyperinflammation [36]. Hyperinflammation, in conjunction with the presence of reactive oxygen species (ROS) generated by oxidative stress, plays a significant role in the development of a range of diseases including arthritis, cardiovascular disease, cancer and diabetes [37,38]. Globally, ALI has emerged as a significant public health concern, marked by elevated levels of proinflammatory signaling molecules, infiltration of inflammatory cells and apoptosis of alveolar epithelial cells [39]. Thus, managing irregular inflammation significantly enhances prognosis [40]. Our results revealed significant differences in lung wet/dry weight ratios among the experimental groups. Mice in the lip-polysaccharide (LPS) group exhibited significantly higher lung coefficients than those in the NS group, suggesting a severe lung injury. Lip-polysaccharide (LPS) is the primary bioactive constituent found in the cell wall of gram-negative bacteria. It has been extensively used to induce lung inflammation (ILI) in mice with acute lung injury. This usage is attributed to their compact size, rapid proliferation and straightforward accessibility [41]. LPS also demonstrated a fluidizing effect on films in vitro, inhibiting lipid packing during compression [42] and preventing cholesterol packing in vitro [43]. However, the MIX group showed a reduction in lung coefficients, similar to the effects observed in the dexamethasone (DXM), cockroach (COC) and C. fumosorosea (COR) groups, indicating a potential protective role of MIX in reducing lung injury. The histopathological examination further supported these findings. Consistently, elevated ROS production overwhelms the antioxidant defense system in mice, resulting in harm to DNA, lipids and proteins [44]. Lung tissues from the NS group displayed a typical structure, whereas those from the LPS group exhibited signs of lung injury, including alveolar collapse, thickened alveolar walls, alveolar edema and inflammatory cell infiltration (ICI). In contrast, the MIX group showed fewer signs of lung injury, with a therapeutic effect comparable to those of DXM, COC and COR. A significant and sustained increase in ROS production within the lungs disrupts the structural integrity of lung epithelial and endothelial barriers. This disruption results in a substantial increase in cell membrane permeability, exacerbating pulmonary edema and amplifying the extent of damage to the lung tissue [45]. Transmission electron microscopy (TEM) observations of type II alveolar cells supported the protective effect of MIX. The LPS group displayed cellular edema, mitochondrial damage and decreased microvilli, indicating cellular injury. In contrast, the MIX group exhibited cellular structures resembling those of the NS group, with minor differences in microvilli. These findings suggested that MIX mitigates LPS-induced inflammation at the cellular level. The results, as verified in Figure 9a,b, show 30 different classes and subclasses of metabolites with corresponding numbers and percentages (%). Lipids accounted for 30.37% of total lipid content. For amino acids, peptides, and analogs (11.53%), the yield of peptide synthesis was highly dependent on the sequence. As the complexity of the synthesis process increases, analytical characterization becomes crucial, leading to a significant increase in both the associated costs and the time required. Additionally, unless chemically modified, peptides often exhibit poor metabolic stability and oral bioavailability, typically requiring injection as the route of administration [46]. Recent advances in chemical modification techniques, new formulations, drug delivery systems and innovative administration methods have effectively addressed these issues. These developments have revitalized the use of peptides as promising candidates for novel anti-inflammatory drugs. As a result, peptides have regained competitiveness in the pharmaceutical market [47]. Other categories included 9.97% benzene and derivatives (7.17%); organic acids (6.07%); carbohydrates (5.45%); steroids and derivatives (4.05%); amino acids (2.85%); purines and derivatives (2.34%); indole and derivatives (2.18%); and bile acids, alcohols and derivatives, also 2.18%, phenols and derivatives 2.02%, amines 1.4%, amines and derivatives 1.09%, nucleic acids and analogs 0.93%, indoles 0.93%, pyridine and derivatives 0.78%, alcohols 0.78%, imidazoles 0.62%, vitamins and derivatives 0.31%, pteridines and derivatives 0.31%, antibiotics 0.16%, flavonoids 2.02%, terpenoids 1.87%, phenylpropanoic acids 1.56%, alkaloids and derivatives 0.47%, coumarins and derivatives 0.31%, quinone 0.16%, lignans 0.16% and amino acids 0.16%. However, the results indicated that the maximum number of metabolites and the lowest percentage of metabolites (%) were reported in lipids with 195 metabolite numbers and 30.37%, respectively. Lipoid pneumonia typically manifests as an abrupt onset of nonspecific respiratory symptoms. Diagnosis can be confirmed by detecting lipid-engorged macrophages in the bronchoalveolar lavage (BAL), sputum or lung tissue. Although treatment approaches for this uncommon condition are not well established, some potential interventions for advanced or recurring cases of lipoid pneumonia have been mentioned, including whole-lung lavage and corticosteroid administration [48]. Metabolomic analysis revealed significant modifications in serum metabolite profiles upon consumption of a mixture (referred to as MIX). Coefficient of variation (CV) and orthogonal partial least squares discriminant analysis (OPLS-DA) revealed distinctive clustering patterns among the three groups, normal saline (NS), lipopolysaccharide (LPS) and MIX, signifying notable alterations in serum metabolism due to MIX administration. Additionally, examination of metabolic pathways identified various pathways affected by MIX consumption. In the comparison of LPS versus MIX, significant changes were observed in D-glutamine and D-glutamate metabolism, pyrimidine metabolism, arginine and proline metabolism and ABC transporters. When comparing LPS to NS, the affected pathways included the central carbon metabolism in cancer, protein digestion and absorption, mineral absorption and vitamin digestion and absorption. These findings indicated that MIX may influence diverse metabolic pathways, potentially contributing to its protective effects. Cortisol, a steroid hormone crucial for human metabolism and the stress response, is produced by adrenocortical fasciculus cells. Along with tetrahydrocortisone, a key component of the steroid hormone biosynthesis pathway, cortisol exerts biological effects and acts as a negative regulator of adrenocorticotropic hormone synthesis and secretion. Cortisol also plays a significant role in the treatment of acute lung injury [49]. It functions by suppressing the production of oxygen-free radicals in normal human peripheral blood poly-morpho-nuclear leukocytes (PMN) over an extended period by regulating NF-κB activation. Moreover, cortisol reduces lung injury by inhibiting the output of the syndrome intermediator and overactivation of PMN [50,51]. To continue, 7-keto deoxycholic acid, derived from cholesterol catabolism, is a steroidal amphiphilic molecule that plays a crucial role in regulating bile flow and lipid secretion and is essential for the absorption of dietary fats and vitamins. Additionally, it regulates the key enzymes involved in cholesterol homeostasis. Bile acid receptor agonists have been investigated as potential treatments for pulmonary inflammatory diseases [52]. The bile-acid receptor TGR5 controls pulmonary inflammation by blocking the activation of the nuclear factor-κB (NF-κB) signaling pathway. Similarly, the bile-acid receptor farnesol X-receptor (FXR) controls lip-polysaccharide-induced pulmonary proinflammatory cytokines by suppressing cytokine secretion and inflammation [53,54]. Apocynin inhibited NADPH oxidase activation, elevated super-oxide dismutase levels, reduced total protein levels and decreased TNF-α levels, thereby demonstrating a significant protective effect against lip-polysaccharide-induced acute respiratory distress syndrome in mouse models [55]. Differential accumulation analysis identified 617 differentially accumulated metabolites (DAMs) between the LPS and MIX groups, as shown in Table 1, with 350 upregulated and 267 downregulated metabolites. In the LPS vs. NS comparison, 389 metabolites were upregulated, and 228 were downregulated. Venn analysis revealed 49 common and unique DAMs between the two comparison groups, shedding light on the specific metabolic changes associated with MIX treatment. In conclusion, this study provides evidence that the combination of C. fumosorosea mycelia and cockroaches (MIX) has potential therapeutic effects in a mice model of LPS-induced acute lung injury. MIX appears to reduce lung injury and inflammation, protect type II alveolar cells and induce significant changes in the serum metabolite profiles. In addition to surfactant lipids, various lipid components in bronchoalveolar lavage (BAL) undergo alterations in response to pneumonia. One such lipid is cardiolipin, which is predominantly found in mitochondria. Research indicates that during pneumonia, there is a substantial increase in cardiolipin levels in the BAL fluid of both infected humans and mice. This elevation in cardiolipin levels is associated with a significant increase in alveolar surface tension, leading to decreased lung compliance and an increase in the concentrations of interleukin-10 (IL-10) and proteins in the BAL fluid [56]. Phosphatidylglycerol levels in BAL are reduced in ARDS, accompanied by an increase in surface tension [57]. In an experimental neonatal piglet ARDS model, phosphatidylglycerol supplementation decreased IL-6 levels, reduced alveolar apoptosis and preserved the alveolar–capillary barrier. This intervention ultimately leads to a reduction in pulmonary edema [58]. These findings warrant further investigation into the mechanisms underlying the protective effects of MIX and its potential applications in the treatment of lung-related disorders.

6. Conclusions

In conclusion, this study investigated the impact of C. fumosorosea mycelia on lung coefficients in mice and compared its effects on established drugs, such as LPS, NS, MIX, DXM, COR and COC. The results revealed the potential of C. fumosorosea mycelia to reduce lung coefficients, mirroring the effects of reference drugs. Histopathological examination and transmission electron microscopy revealed an improved lung tissue structure, alleviation of inflammatory responses and preservation of cellular integrity. Metabolite analysis identified 1607 compounds, demonstrating the precision of the assay system. PLS-DA and OPLS-DA analyses revealed distinct metabolite profiles, highlighting the significant alterations in serum metabolism. Pathway analysis revealed changes in D-glutamine and D-glutamate metabolism, pyrimidine metabolism, arginine and proline metabolism and ABC transporters. Notably, 617 differentially accumulated metabolites were identified, with 493 metabolites common to the LPS vs. MIX group and 75 unique to the LPS vs. NS group. In summary, this comprehensive investigation suggests that C. fumosorosea mycelia treatment holds promise as a therapeutic intervention for lung injury, influencing both the histopathological (lung) features and serum metabolic profiles.

Supplementary Materials

The following supporting information can be downloaded at: https://www.mdpi.com/article/10.3390/separations11030074/s1, Figure S1: (a,b). Pathway enrichment analysis bar chart; Figure S2: (a,b). Metabolic pathway enrichment analysis bubble chart; Figure S3: Correlation heatmap of differential metabolites LPS_MIX. (D) Correlation heatmap of differential metabolites LPS_NS. Red represents positive correlation, blue represents negative correlation, and the darker the color, the greater the absolute value of the correlation coefficient between LPS_MIX and LPS_NS. “*” represent p-value < 0.05. When the number of differential metabolites is greater than or equal to 20, the first 20 differential metabolites.

Author Contributions

T.K. and H.Y. contributed to the study’s conception and design. The paper was written by T.K., grammar-checked by D.H. and Y.G. and reviewed by J.Z., N.P. and Y.Y. and supervised by H.Y. All authors have read and agreed to the published version of the manuscript.

Funding

This study was supported by the National Natural Science Foundation of China (Grant No. 31870017).

Institutional Review Board Statement

The experiments were performed at the Yunnan Herbal Laboratory and were approved by the Experimental Ethics Committee of the School of Life Science, Yunnan University (R-06202032, 22 April 2023). This article does not contain any studies with human participants performed by any of the authors.

Informed Consent Statement

Not applicable.

Data Availability Statement

The data presented in this study are available on request from the corresponding author.

Acknowledgments

Thanks to the Yunnan Fungal Culture Collection (YFCC), Yunnan Herbal Laboratory (YHL) and School of Life Science at Yunnan University for providing us with all the facilities we needed to do our work and financial support.

Conflicts of Interest

The authors declare no competing interests.

References

  1. Ping, L.; Haiping, H.; Ge, L. Bioanalysis of traditional Chinese medicines. J. Chromatogr. B Analyt. Technol. Biomed. Life Sci. 2016, 1026, 1. [Google Scholar]
  2. Graham, D.T. Regulation of proprietary traditional Chinese medicines in Australia. Chin. J. Nat. Med. 2017, 15, 12–14. [Google Scholar] [CrossRef]
  3. Chan, K. Chinese medicinal materials and their interface with Western medical concepts. J. Ethnopharmacol. 2005, 96, 1–18. [Google Scholar] [CrossRef]
  4. Coudroy, R.; Lu, C.; Chen, L.; Demoule, A.; Brochard, L. Mechanism of airway closure in acute respiratory distress syndrome: A possible role of surfactant depletion. Intens. Care Med. 2019, 45, 290–291. [Google Scholar] [CrossRef] [PubMed]
  5. Kurosawa, T.; Miyoshi, S.; Yamazaki, S.; Nishina, T.; Mikami, T.; Oikawa, A.; Homma, S.; Nakano, H. A murine model of acute lung injury identifies growth factors to promote tissue repair and their biomarkers. Genes Cells 2019, 24, 112–125. [Google Scholar] [CrossRef] [PubMed]
  6. LV, Q. Glucocorticoid combined with hyaluronic acid enhances glucocorticoid receptor activity through inhibiting p-38MAPK signal pathway activation in treating acute lung injury in rats. Eur. Rev. Med. Pharmacol. Sci. 2016, 20, 3920–3929. [Google Scholar]
  7. Han, S.C.; Cai, W.X.; Yang, X.K.; Jia, Y.; Zheng, Z.; Wang, H.; Li, J.L.; Ygao, J.; Fan, L.; Hu, D. ROS-mediated NLRP3 inflammasome activity is essential for burn-induced acute lung injury. Mediat. Inflamm. 2015, 2015, 720457. [Google Scholar] [CrossRef] [PubMed]
  8. Yu, J.L.; Zhang, X.S.; Xue, X.; Wang, R.M. Patchouli alcohol protects against lipopolysaccharide induced acute lung injury in mice. J. Surg. Res. 2015, 194, 537–543. [Google Scholar] [CrossRef] [PubMed]
  9. Sakaguchi, M.; Marutani, E.; Shin, H.; Chen, W.; Hanaoka, K.; Xian, M.; Ichinose, F. Sodium thiosulfate attenuates acute lung injury in mice. Anesthesiology 2014, 121, 1248–1257. [Google Scholar] [CrossRef] [PubMed]
  10. Zhang, X.; Liu, F.; Liu, H.; Cheng, H.; Wang, W.; Wen, Q.; Wang, Y. Urinary trypsin inhibitor attenuates lipopolysaccharide-induced acute lung injury by blocking the activation of p38 mitogen-activated protein kinase. Inflamm. Res. 2011, 60, 569–575. [Google Scholar] [CrossRef] [PubMed]
  11. Garbi, N.; Lambrecht, B.N. Location, function, and ontogeny of pulmonary macrophages during the steady state. Pflug. Arch. 2017, 469, 561–572. [Google Scholar] [CrossRef]
  12. Florentin, J.; Dutta, P. Origin and production of inflammatory perivascular macrophages in pulmonary hypertension. Cytokine 2017, 100, 11–15. [Google Scholar] [CrossRef]
  13. Wang, F.; Wang, R.; Liu, H. The acute pulmonary toxicity in mice induced by Staphylococcus aureus, particulate matter, and their combination. Exp. Anim. 2018, 68, 159–168. [Google Scholar] [CrossRef]
  14. Liu, H.; Zhou, K.; Liao, L.; Zhang, T.; Yang, M.; Sun, C. Lipoxin A4 receptor agonist BML-111 induces autophagy in alveolar macrophages and protects from acute lung injury by activating MAPK signaling. Respir. Res. 2018, 19, 243. [Google Scholar] [CrossRef] [PubMed]
  15. Pereira, M.L.; Ortolan, L.S.; Sercundes, M.K.; Debone, D.; Murillo, O.; Lima, F.A.; Marinho, C.R.F.; Epiphanio, S. Association of heme oxygenase 1 with lung protection in malaria-associated ALI/ARDS. Mediat. Inflamm. 2016, 2016, 4158698. [Google Scholar] [CrossRef]
  16. Li, H.; Zhou, X.; Tan, H.; Hu, Y.; Zhang, L.; Liu, S.; Dai, M.; Li, Y.; Li, Q.; Mao, Z.; et al. Neutrophil extracellular traps contribute to the pathogenesis of acid-aspiration-induced ALI/ARDS. Oncotarget 2018, 9, 1772–1784. [Google Scholar] [CrossRef]
  17. Shi, W. The medical research advanced on Periplaneta americana. Chin. J. Ethnomed. Ethnopharm. 2012, 21, 50–51. [Google Scholar]
  18. Zhao, Y.; Yang, A.; Tu, P.; Hu, Z. Anti-tumor effects of the American cockroach, Periplaneta americana. Chin. Med. 2017, 12, 26. [Google Scholar] [CrossRef] [PubMed]
  19. He, Z.; Peng, F.; Song, L.; Wang, X.; Hu, M.; Zhao, Y.; Liu, G. Advances in chemical constituents and pharmacological effects of Periplaneta americana. Chin. J. Chin. Mater. Med. 2007, 32, 2326–2330. [Google Scholar]
  20. Khan, T.; Hou, D.H.; Zhou, J.N.; Yang, Y.L.; Yu, H. Effect of Abiotic Factors on Fumosorinone Production from Cordyceps fumosorosea via Solid-State Fermentation. Mycobiology 2023, 51, 157–163. [Google Scholar] [CrossRef] [PubMed]
  21. Kepler, R.M.; Jennifer, L.A.J.; Hywel, J.N.L. A phylogenetically based nomenclature for Cordycipitaceae (Hypocreales). IMA Fungus 2017, 8, 335–353. [Google Scholar] [CrossRef]
  22. Ali, S.; Wu, J.H.; Huang, Z. Production and regulation of extracellular chitinase from the entomopathogenic fungus Isaria fumosorosea. Biocontrol Sci. Technol. 2010, 20, 723–738. [Google Scholar] [CrossRef]
  23. Ali, S.; Huang, Z.; Ren, S.X. Production of cuticle degrading enzymes by Isaria fumosorosea and their evaluation as a biocontrol agent against diamondback moth. J. Pest. Sci. 2010, 83, 361–370. [Google Scholar] [CrossRef]
  24. Banu, A.N.; Balasubramanian, C. Optimization synthesis of silver nanoparticles using Isaria fumosorosea against human vector mosquitoes. Parasitol. Res. 2014, 113, 3843–3851. [Google Scholar] [CrossRef]
  25. Pick, D.A.; Avery, P.B.; Hunter, W.B.; Powell, C.A.; Arthurs, S.P. Effect of Isaria fumosorosea (Hypocreales: Cordycipitaceae) and Lysiphlebus testaceipes, (Hymenoptera: Braconidae) on the brown citrus aphid: Preliminary assessment of a compatibility study. Fla. Entomol. 2012, 95, 764–766. [Google Scholar] [CrossRef]
  26. Huang, Z.; Ali, S.; Ren, S.X.; Wu, J.H. The effect of Isaria fumosorosea on mortality and fecundity of Bemisia tabaci and Plutella xylostella. Insect Sci. 2010, 17, 140–148. [Google Scholar] [CrossRef]
  27. Khan, T.; Dong-Hai, H.; Zhou, J.N.; Yang, Y.L.; Yu, H. Comprehensive analysis of metabolites in the mycelium of Cordyceps fumosorosea cultured on Periplaneta americana. Ann. Microbiol. 2024, 74, 9. [Google Scholar] [CrossRef]
  28. Wang, Y.; Liu, Y.-F.; Fan, Q.; Wang, Y.-B.; Yu, H. Cordycipitoid Fungi Powders Promote Mycelial Growth and Bioactive-Metabolite Production in Liquid Cultures of the Stout Camphor Medicinal Mushroom Taiwanofungus camphoratus (Agaricomycetes). Int. J. Med. Mushrooms 2020, 22, 615–626. [Google Scholar] [CrossRef] [PubMed]
  29. Zhou, J.; Pi, N.; Guo, Y.; He, X.; Wang, J.; Luo, R.; Wang, M.; Yu, H. The mechanism of action of Ophiocordyceps sinensis mycelia for prevention of acute lung injury based on non-targeted serum metabolomics. PLoS ONE 2023, 18, e0287331. [Google Scholar] [CrossRef]
  30. Matute-Bello, G.; Downey, G.; Moore, B.B.; Groshong, S.D.; Matthay, M.A.; Slutsky, A.S.; Kuebler, W.M. Acute lung injury in animals study g. An official american thoracic society workshop report: Features and measurements of experimental acute lung injury in animals. Am. J. Respir. Cell Mol. Biol. 2011, 44, 725–738. [Google Scholar] [CrossRef] [PubMed]
  31. Dunn, W.B.; Broadhurst, D.; Begley, P.; Zelena, E.; Francis-McIntyre, S.; Anderson, N.; Brown, M.; Knowles, J.D.; Halsall, A.; Haselden, J.N.; et al. Procedures for large-scale metabolic profiling of serum and plasma using gas chromatography and liquid chromatography coupled to mass spectrometry. Nat. Protoc. 2011, 6, 1060–1083. [Google Scholar] [CrossRef] [PubMed]
  32. Zhou, J.; Zou, W.; Wang, J.; Luo, R.; Wang, M.; Yu, H. Comparison of widely targeted metabolomics and untargeted metabolomics of wild Ophiocordyceps sinensis. Molecules 2022, 27, 3645. [Google Scholar] [CrossRef] [PubMed]
  33. Keshari, R.S.; Silasi-Mansat, R.; Zhu, H.; Popescu, N.I.; Peer, G.; Chaaban, H.; Lambris, J.D.; Polf, H.; Lupu, C.; Kinasewitz, G. Acute lung injury and fibrosis in a baboon model of Escherichia coli sepsis. Am. J. Respir. Cell Mol. Biol. 2014, 50, 439–450. [Google Scholar] [CrossRef]
  34. Cox, R.J.; Phillips, O.; Fukumoto, J.; Fukumoto, I.; Parthasarathy, P.T.; Arias, S. Enhanced Resolution of Hyperoxic Acute Lung Injury as a Result of Aspirin-Triggered Resolvin D1 Treatment. Am. J. Respir. Cell Mol. Biol. 2015, 53, 422–435. [Google Scholar] [CrossRef] [PubMed]
  35. Manjunathaiah, R.N.; Ramakrishna, K.; Sirisha, V.; Divya, P.; Venkateswara Rao, A. Computer aided discovery of potential anti-inflammatory (s)-naproxen analogs as COX-2 inhibitors. Med. Chem. 2013, 9, 553–559. [Google Scholar] [CrossRef]
  36. Hasan, D.; Shono, A.; van Kalken, C.K.; van der Spek, P.J.; Krenning, E.P.; Kotani, T. A novel definition and treatment of hyperinflammation in COVID-19 based on purinergic signalling. Purinergic Signal 2022, 18, 13–59. [Google Scholar] [CrossRef]
  37. Vollbracht, C.; Kraft, K. Oxidative stress and hyper-inflammation as major drivers of severe COVID-19 and long COVID: Implications for the benefit of high-dose intravenous vitamin C. Front. Pharmacol. 2022, 13, 899198. [Google Scholar] [CrossRef]
  38. Anwar, S.; Almatroudi, A.; Allemailem, K.S.; Jacob Joseph, R.; Khan, A.A.; Rahmani, A.H. Protective effects of ginger extract against glycation and oxidative stress-induced health complications: An in vitro study. Processes 2020, 8, 468. [Google Scholar] [CrossRef]
  39. Guida, D.R.; Engel, J.; Allwood, J.W.; Weber, R.J.; Jones, M.R.; Sommer, U.; Viant, M.R.; Dunn, W.B. Non-targeted UHPLC-MS metabolomic data processing methods: A comparative investigation of normalisation, missing value imputation, transformation and scaling. Metabolomics 2016, 12, 93. [Google Scholar] [CrossRef]
  40. Sureshbabu, A.; Syed, M.; Das, P.; Janer, C.; Pryhuber, G.; Rahman, A.; Andersson, S.; Homer, R.J.; Bhandari, V. Inhibition of Regulatory-Associated Protein of Mechanistic Target of Rapamycin Prevents Hyperoxia-Induced Lung Injury by Enhancing Autophagy and Reducing Apoptosis in Neonatal Mice. Am. J. Respir. Cell Mol. Biol. 2016, 55, 722–735. [Google Scholar] [CrossRef]
  41. Kasotakis, G.; Purves, J.T.; Agarwal, S.; Sullenger, B.A.; Kintsurashvili, E.; Galvan, M.D.; Graham, C.; Corcoran, D.L.; Palmer, S.M.; Remick, D.G. Histone Deacetylase 7 in Murine Gram-Negative Acute Lung Injury. Shock 2020, 53, 375–377. [Google Scholar] [CrossRef]
  42. Canadas, O.; Keough, K.M.; Casals, C. Bacterial lipopolysaccharide promotes destabilization of lung surfactant–like films. Biophys. J. 2011, 100, 108–116. [Google Scholar] [CrossRef]
  43. Hiansen, J.Q.; Keating, E.; Aspros, A.; Yao, L.J.; Bosma, K.J.; Yamashita, C.M.; Lewis, J.F.; Veldhuizen, R.A. Cholesterol–mediated surfactant dysfunction is mitigated by surfactant protein A. Biochim. Biophys. Acta 2015, 1848, 813–820. [Google Scholar] [CrossRef]
  44. Lau, C.; Abdelmalak, B.B.; Farver, C.F.; Culver, D.A. Whole lung lavage for lipoid pneumonia. Thorax 2016, 71, 1066–1067. [Google Scholar] [CrossRef]
  45. Ying, J.F.; Lu, Z.B.; Fu, L.Q.; Tong, Y.; Wang, Z.; Li, W.F.; Mou, X.Z. The role of iron homeostasis and iron-mediated ROS in cancer. Am. J. Cancer Res. 2021, 11, 1895–1912. [Google Scholar] [PubMed]
  46. Han, X.; Wu, Y.C.; Meng, M.; Sun, Q.S.; Gao, S.M.; Sun, H. Linarin prevents LPS-induced acute lung injury by suppressing oxidative stress and inflammation via inhibition of TXNIP/NLRP3 and NF-κB pathways. Int. J. Mol. Med. 2018, 42, 1460–1472. [Google Scholar] [CrossRef] [PubMed]
  47. Dietrich, U.; Durr, R.; Koch, J. Peptides as drugs: From screening to application. Curr. Pharm. Biotechnol. 2013, 14, 501–512. [Google Scholar] [CrossRef] [PubMed]
  48. Barabasi, A.L.; Gulbahce, N.; Loscalzo, J. Network medicine: A network-based approach to human disease. Nat. Rev. Genet. 2011, 12, 56–68. [Google Scholar] [CrossRef] [PubMed]
  49. Ray, N.B.; Durairaj, L.; Chen, B.B.; Mcverry, B.J.; Ryan, A.J.; Donahoe, M.; Waltenbaugh, A.K.; O’Donnell, C.P.; Henderson, F.C.; Etscheidt, C.A. Dynamic regulation of cardiolipin by the lipid pump Atp8b1 determines the severity of lung injury in experimental pneumonia. Nat. Med. 2010, 16, 1120–1127. [Google Scholar] [CrossRef]
  50. Dequin, P.F.; Meziani, F.; Quenot, J.P.; Kamel, T.; Ricard, J.D.; Badie, J. Hydrocortisone in Severe Community-Acquired Pneumonia. N. Engl. J. Med. 2023, 388, 1931–1941. [Google Scholar] [CrossRef]
  51. Clark, K.D.; Snashall, P.D. Endogenous Cortisol and Lung Damage in a Predominantly Smoking Population. Am. J. Respir. Crit. Care Med. 1999, 159, 755–759. [Google Scholar] [CrossRef]
  52. Aljada, A.; Assian, E.; Mohanty, P.; Hamouda, W.; Garg, R.; Dandona, P. Increased IkappaB expression and diminished nuclear NF-kappaB in human mononuclear cells following hydrocortisone injection. J. Clin. Endocrinol. Metab. 1999, 84, 3386–3389. [Google Scholar]
  53. Pols, T.W. TGR5 in inflammation and cardiovascular disease. Biochem. Soc. Trans. 2014, 42, 244–249. [Google Scholar] [CrossRef] [PubMed]
  54. Zhang, L.; Li, T.; Yu, D.; Forman, B.M.; Huang, W. FXR protects lung from lipopolysaccharide-induced acute injury. Mol. Endocrinol. 2012, 26, 27–36. [Google Scholar] [CrossRef] [PubMed]
  55. Chen, B.; Cai, H.R.; Xue, S.; You, W.J.; Liu, B.; Jiang, H.D. Bile acids induce activation of alveolar epithelial cells and lung fibroblasts through farnesoid X receptor-dependent and independent pathways. Respirology 2016, 21, 1075–1080. [Google Scholar] [CrossRef]
  56. Xu, L.; Li, Y.; Wan, S.; Wang, Y.; Yu, P. Protective effects of apocynin nitrone on acute lung injury induced by lipopolysaccharide in rats. Int. Immunopharmacol. 2014, 20, 377–382. [Google Scholar] [CrossRef] [PubMed]
  57. Gunther, A.; Siebert, C.; Schmidt, R.; Ziegler, S.; Grimminger, F.; Yabut, M.; Temmesfeld, B.; Walmrath, D.; Morr, H.; Seeger, W. Surfactant alterations in severe pneumonia, acute respiratory distress syndrome, and cardiogenic lung edema. Am. J. Respir. Crit. Care Med. 1996, 153, 176–184. [Google Scholar] [CrossRef]
  58. Spengler, D.; Winoto–Morbach, S.; Kupsch, S.; Vock, C.; Blochle, K.; Frank, S.; Rintz, N.; Diekotter, M.; Janga, H.; Weckmann, M. Novel therapeutic roles for surfactant–inositols and –phosphatidylglycerols in a neonatal piglet ARDS model: A translational study. Am. J. Physiol. Lung Cell Mol. Physiol. 2018, 314, L32–L53. [Google Scholar] [CrossRef]
Figure 1. Shows lung coefficients (n = 10). Comparisons were made as follows: LPS vs. NS, statistically significant at p < 0.001; LPS vs. MIX, statistically significant at p < 0.01; LPS vs. DXM, statistically significant at p < 0.01; NS vs. MIX, statistically significant at p < 0.05; NS vs. DXM, statistically significant at p < 0.05.
Separations 11 00074 g001
Figure 2. Hematoxylin and eosin-stained (HE) lung sections (n = 10) were obtained from a sample size 200× and 400× with a scale bar of 20 μm MIX (A), LPS (C), NS (E), COC (G), COR (I) and MIX (K). MIX (B), LPS (D), NS (F), COC (H), COR (J) and MIX (L).
Separations 11 00074 g002
Figure 3. Transmission electron microscopy (TEM) lung sections (n = 10) were obtained from a sample size of 15k. NS (A); MIX (B); DXM (C); COR (D); COC (E); LPS (F). Mitochondrial , Endoplasmic, reticulum, nuclei, and myeloid , fusion of microvilli .
Separations 11 00074 g003
Figure 4. Analysis of the overlap in total ion current (TIC) among different quality control (QC) samples, both negative and positive. The horizontal axis represents the retention time (in minutes) used for metabolite detection, whereas the vertical axis represents the relative abundance (cps: counts per minute).
Separations 11 00074 g004
Figure 5. Coefficient of variation (CV) distribution of compounds in each sample group.
Separations 11 00074 g005
Figure 6. Score diagram of PLS-DA analysis of LPS-MIX and LPS-NS.
Separations 11 00074 g006
Figure 7. Replacement test chart of the OPLS-DA analysis model.
Separations 11 00074 g007
Figure 8. (a) Metabolite classification bar chart. The x-axis represents the number of metabolites and the y-axis represents the classified metabolites. (b) Metabolite–donut charts. Different colors represent different metabolite classifications and the percentage of metabolites belonging to a particular classification of all metabolites.
Separations 11 00074 g008
Figure 9. (a,b) Metabolic pathway enrichment analysis abundance score plot.
Separations 11 00074 g009
Figure 10. Heat map representing hierarchical cluster analysis in LPS vs. NS. Red indicates upregulated metabolites and blue indicates relatively downregulated metabolites.
Separations 11 00074 g010
Figure 11. Venn diagram of differential metabolites: cyan represents LPS vs. NS metabolites, red represents LPS vs. MIX metabolites and cyan and red combined represent with metabolites.
Separations 11 00074 g011
Table 1. Summary of deferentially accumulated metabolites (DAMs) among LPS vs. MIX and LPS vs. NS.
GroupsTotal MetabolitesNumber Upregulated (%)Number Downregulated (%)
LPS vs. MIX617350 (56.72) vs. 389 (63.04)267 (43.27) vs. 228 (36.95)
LPS vs. NS617350 (56.72) vs. 263 (42.62)267 (43.27) vs. 354 (57.37)
Disclaimer/Publisher’s Note: The statements, opinions and data contained in all publications are solely those of the individual author(s) and contributor(s) and not of MDPI and/or the editor(s). MDPI and/or the editor(s) disclaim responsibility for any injury to people or property resulting from any ideas, methods, instructions or products referred to in the content.

