1. Introduction
Sample preparation is an important but often neglected step in chemical analysis [
1]. The importance of an efficient sample preparation technique becomes more inevitable when dealing with trace and ultra-trace levels of target analytes dispersed in complex sample matrices e.g., environmental, pharmaceutical, food, and biological samples. These samples are not generally suitable for direct injection into the analytical instrument. Three main factors may explain this unsuitability of direct instrumental injection. First, the matrix ingredients may exert detrimental effect on the performance of the analytical instrument, or they may interfere with the analysis of target analytes; second, the concentration of the target analytes in the sample matrix may be below the detection limit of the analytical instrument. Third, the sample matrix may be incompatible with the analytical instrument. As such, the primary objective of sample preparation is to isolate and concentrate the target analytes from various sample matrices to a new solvent/solvent system and to minimize matrix interference so that the cleaner analytes solution can be introduced into the analytical instrument for separation, identification, and quantification.
Classical sample preparation techniques such as liquid-liquid extraction (LLE) and solid phase extraction (SPE) are still among popular choices for analytical sample preparation [
2,
3,
4]. However, these procedures are time consuming, laborious, multi-step, generally utilize large volume of toxic and hazardous organic solvents, and often involve lengthy and error-prone post-extraction steps such as solvent evaporation and sample reconstitution in a suitable solvent. In order to mitigate some of these problems, solid-phase microextraction (SPME) was introduced by Pawliszyn and co-workers in 1987 [
5] as a solvent-free/solvent-minimized microextraction technique. Due to the substantial advantages over conventional sample preparation techniques, SPME has gained enormous popularity within a very short period of time. The broad spectrum applications of SPME have been extensively reviewed in a number of recent articles [
6,
7,
8].
However, some major shortcomings of SPME are yet to be addressed. Among these, one major shortcoming of SPME (fiber format) is the miniscule amount (typically ~0.5 μL) of sorbent loading that often results in poor extraction sensitivity [
9]. The low extraction sensitivity of fiber-SPME prompted the invention of a number of microextraction techniques with higher sorbent loading including in-tube SPME [
10], SBSE [
11], MEPS [
12], rotating-disk sorptive extraction (RDSE) [
13], and thin film microextraction (TFME) [
14]. A comprehensive list of different modifications of sorbent based sorptive microextraction techniques can be found elsewhere [
1].
SPME and its different formats, modifications, and implementations are generally governed by two principle criteria: (1) thermodynamics and (2) kinetics [
15]. Thermodynamic properties determine the maximum amount of analytes that can be extracted by unit mass of sorbent under a specific set of extraction conditions. Since higher sorbent loading allows the accumulation of a larger amount of target analytes by the sorbent when adequate time is allowed to reach the extraction equilibrium, sorbent loading is directly related to extraction efficiency. On the other hand, kinetics controls the rate of extraction and hence the time required to reach the extraction equilibrium. The faster the extraction equilibrium, the higher the throughput in the analytical lab. As a result, there is a pressing demand for developing new microextraction techniques that can simultaneously satisfy the required sensitivity (by increasing sorbent loading) and reduce the sample preparation time to its lowest level (by minimizing the extraction equilibrium time).
A critical evaluation of different microextraction systems revealed that the shortcomings of all contemporary microextraction systems originate from (1) coating technology used for immobilizing the sorbent on the substrate surface [
16] and (2) the physical format of the extraction system [
14] that determines the primary contact surface area (PCSA) of the device and consequently the extraction kinetics. PCSA is defined as the surface area of the extraction medium that can be accessed directly by the sample matrix containing the analytes during the extraction process. Therefore, if a sample preparation technique is to be highly sensitive as well as fast, both the coating technology and the PCSA have to be augmented.
One major challenging area of microextraction devices is the sorbent coating technology that often use a dilute solution of pristine polymer to form a thin surface film on the substrate followed by a free radical cross-linking reaction to immobilize the film [
17,
18]. The weak physical adhesion of the polymer to the substrate results in a number of the unwanted phenomena such as high phase bleeding, washing away of the polymer with organic solvent, long extraction equilibrium time, limited selectivity, poor extraction reproducibility, and swelling of the sorbent when exposed to organic solvents. The lack of chemical bonding between the polymeric sorbent and the substrate is believed to be the primary cause of these coating-related problems. A number of alternative coating techniques have also been proposed including physical deposition [
19,
20], electrochemical deposition of conducting polymers [
21,
22], gluing with adhesives [
23], and sol–gel column technology [
1,
16]. Nonetheless, sol–gel column technology pioneered by Malik and co-workers [
1,
16] have been proven to be the most convenient and versatile [
1]. In addition to the suitability of the coating process, sol–gel technology opens up the possibility of making multi-component materials that can be conveniently used to customize the surface morphology, selectivity, and affinity of the sorbent toward the target analytes. The sorbent coating created by sol–gel technology is highly porous and chemically bonded to the substrate. As an outcome, such coatings demonstrate remarkable thermal, solvent, and chemical stability. Due to its inherent porosity, a thin film of sol–gel coating can extend equivalent or higher sensitivity than commercially available thick SPME coatings. The high porosity of the sol–gel coating also makes it possible to reach extraction equilibrium in a fraction of the time that is often required by commercial SPME fibers.
Although tremendous efforts have been made to increase the sensitivity of the microextraction systems by merely increasing the sorbent loading on the same substrate (fused silica fiber/glass tube), little work has been done to increase the primary contact surface area (PCSA) of the extraction device. The increase in PCSA of the extraction device not only allows higher sorbent loading without increasing the coating thickness, but may also considerably reduce the extraction equilibrium time. TFME, SBSE, RDSE, etc. were developed to increase the PCSA, but the use of conventional sorbent immobilization approach did not offer much benefit in boosting the extraction sensitivity.
In addition to improving the coating technology and enhancing the PCSA of the microextraction device, some other important factors that may potentially improve the quality of sample preparation to a new height need further consideration: (1) the ability to preconcentrate target analytes directly from the unmodified samples without any clean-up exercises; (2) resistance to harsh chemical environments (i.e., highly acidic and basic) so that matrix pH can be adjusted to wider pH values; (3) the ability to use any organic solvent to elute the extracted analytes so that the final solution can be injected simultaneously into gas chromatograph (GC), high performance liquid chromatograph (HPLC), and/or capillary electrophoresis (CE) to obtain complementary information depending on the analytical need; (4) equal effectiveness in field sampling and sample preparation to eliminate the burden of sample collection, transportation, storage, and sample preparation in the laboratory; (5) ability to achieve a high preconcentration factor during the extraction so that solvent evaporation and sample reconstitution may be avoided; and (6) ability to reach extraction equilibrium fast enough so that field sampling and sample preparation do not become an inconvenient task.
Taking all of these challenges into consideration, a new green sample preparation approach fabric phase sorptive extraction (FPSE) has been developed [
24,
25], which creatively addresses the majority of the problems often encountered in contemporary sample preparation practices. In addition to the advanced material properties of sol–gel derived hybrid organic-inorganic sorbents, FPSE has successfully utilized flexibility, permeability, and the rich surface chemistry of natural/synthetic fabric substrates, resulting in a microextraction sorbent chemically bonded to the substrate with a very high, readily accessible active extraction surface for fast and high efficiency analytes extraction. FPSE has introduced major advantages in solvent-less/solvent-minimized sample preparation techniques including an extraordinarily high primary contact surface area (PCSA), and the ability to directly preconcentrate the target analytes even from excessively complicated sample matrices containing debris, cells, proteins, particulates, etc.
Although FPSE has emerged as a major analytical sample preparation technique [
25,
26,
27,
28,
29,
30,
31,
32,
33,
34,
35,
36], the theory and principle of this simple, innovative and environment friendly technique is yet to be fully studied and understood. As such, the primary objective of the current project is to thoroughly study the theory and principle of fabric phase sorptive extraction. In order to investigate different factors involved in fabric phase sorptive extraction, a polar sorbent sol–gel poly(ethylene glycol) (sol–gel PEG) coated on a hydrophilic cellulose substrate was used as the extraction device and a number of substituted phenols were used as the representative environmental pollutants. Substituted phenols, a class of important industrial raw materials, are known as highly toxic environmental pollutants. They are frequently found in the wastewater generated by wood processing and pharmaceutical industries, organic synthesis, and oil refineries [
37]. Substituted phenols have severe health implications for human kidneys, heart, lungs, and the central nervous system [
38,
39]. As a result, a rapid and efficient sample preparation strategy is warranted to monitor these pollutants.
2. Materials and Methods
2.1. Chemicals and Materials
All chemicals used in the study were of analytical grade or superior. 4-chlorophenol (≥99%), 3,5-dimethylphenol (98%), 2,6-dichlorophenol (99%), 2,4,6-trichlorophenol (98%), 2,4-diisopropyl phenol (98%), acetone (HPLC grade), dichloromethane (anhydrous), methyltrimethoxysilane (MTMS) (98%), and trifluoroacetic acid (TFA) (99%) were purchased from Sigma-Aldrich (St. Louis, MO, USA). Sodium hydroxide and hydrochloric acid were purchased from Thermo Fisher Scientific (Milwaukee, WI, USA). Polyethylene glycol was purchased from Alfa Aesar (Ward Hill, MA, USA). Fabric phase sorptive extraction vials (20 mL) and HPLC sample vials (2 mL) were purchased from Supelco (St. Lois, MO, USA). HPLC grade methanol and water were purchased from Fisher Scientific (Pittsburg, PA, USA). Unbleached Muslin 100% cotton cellulose fabrics were purchased from Jo-Ann Fabric (Miami, FL, USA).
2.2. Instrumentation
An Agilent 1100 series HPLC-UV system (Agilent Technologies, Santa Clara, CA, USA) equipped with G1311A quaternary pump, G1313A ALS auto sampler, tray holder, G1322A vacuum degasser, G1316A thermostated column compartment, G1314A variable wavelength detector was used for the separation, identification and quantification of substituted phenol compounds. The separation of substituted phenols was performed on a reversed phase Zorbax Extend-C18 HPLC column (5 μm, 150 mm, 4.6 mm; Agilent Technologies, Santa Clara, CA, USA). Extraction conditions: 5 cm2 FPSE media, sample volume 10 mL, stirring speed 1100 rpm, salt content 15%, extraction time 40 min, desorption time 5 min, and desorption solvent MeOH:ACN (50/50) followed by: high-performance liquid chromatographic analysis. HPLC conditions: isocratic elution 69/31 H2O/ACN, 1 mL/min flow rate, UV detection at 200 nm, ambient temperature. Gas chromatography-mass spectrometry (GC-MS) analysis was carried out in an Agilent 5973 GC-MS. GC-MS conditions: DB-5MS column, 30 m × 0.25 mm, 0.5 μm, splitless injection, Injector temperature 280 °C, GC oven temperature programmed from 40 °C for 1 min, increased temperature to 100 °C at 7 °C/min, stayed for 0 min, then increased the temperature to 250° at 25 °C/min. MS ion source temperature 230 °C, MS transfer line temperature 280 °C, Injection vol. 1 μL. Centrifugation of different solutions to obtain particle free solutions was carried out in an Eppendorf Centrifuge Model 5415 R (Eppendorf North America Inc., Hauppauge, NY, USA). A Fisher Scientific Digital Vortex Mixer (Fisher Scientific, Pittsburg, PA, USA) was employed to thoroughly mixing different solutions. On-line data collection and processing of chromatographic data was done using ChemStation software (Revision A.08.03) for Windows (Agilent Technologies, Santa Clara, CA, USA). A Philips XL30 scanning electron microscope equipped with an EDAX detector was used to obtain SEM images presented in the article. A Perkin Elmer Spectrum 100 FT-IR Spectrometer equipped with Universal ATR Sampling Accessory (Santa Clara, CA, USA) was used to perform FT-IR characterization of the substrates and FPSE media coated with sol–gel sorbents. A Barnstead NANOPure Diamond (model D11911) deionized water system (Dubuque, IA, USA) was employed to obtain high purity deionized water (18.2 MΩ) used in sol–gel synthesis and aqueous sample preparation for fabric phase sorptive extraction.
2.3. Preparation of Sol–gel PEG Coated FPSE Media
2.3.1. Surface Cleaning and Activation of Fabric Substrates
A 100 cm2 segment of the cellulose fabric was cleaned with a copious amount of deionized water, followed by soaking in 1 M NaOH solution for 1 h under continuous sonication. The base-treated fabrics were then washed several times with deionized water, followed by treating with 0.1 M HCl solution for 1 h under sonication. The treated fabric was then washed with copious amount of deionized water and finally dried in home-made drying chamber with continuous helium gas flow at 50 °C overnight. The dried fabric was stored in clean airtight glass container until they are coated with sol–gel sorbents.
2.3.2. Preparation of the Sol Solutions for Coating on the Substrate
The sol solutions for creating the sol–gel PEG coatings were prepared using a modified version of a previously described formulation [
25,
40]. Briefly, the sol solution for sol–gel PEG coating was prepared by dissolving 10 g of poly(ethylene glycol) polymer, 10 mL methyltrimethoxysilane sol–gel precursor (MTMS), 20 mL methylene chloride as the organic solvent, 4 mL trifluoroacetic acid (5% water) as the sol–gel catalyst. The mixture was then vortexed for 3 min, centrifuged for 5 min, and finally the clear supernatant of the sol solution was transferred to a clean 100 mL amber colored glass reaction bottle.
2.3.3. Creation of Sol–gel PEG Coatings on the Substrate
For the sol–gel PEG coatings, cellulose fabric was used as the substrate. The clean and treated fabrics were gently inserted into the reaction bottle containing the sol solution so that a three-dimensional network of sol–gel PEG could be formed on the surface of the substrate as well as throughout the porous matrix. The fabrics were kept inside the sol solution for 4 h. After completing the coating period, the sol solution was expelled from the reaction bottle and the coated fabrics were dried and aged in a home-made conditioning device built inside a gas chromatography oven with continuous helium gas flow at 50 °C for 24 h. Before using for extraction, the sol–gel PEG coated fabrics were rinsed sequentially with methylene chloride and methanol followed by drying at 50 °C under an inert atmosphere for 1 h. The fabric phase sorptive extraction media coated with sol–gel PEG were then cut into 2.5 cm × 2.0 cm pieces (area of each side, 5 cm2) and stored in a closed glass container to prevent contamination.
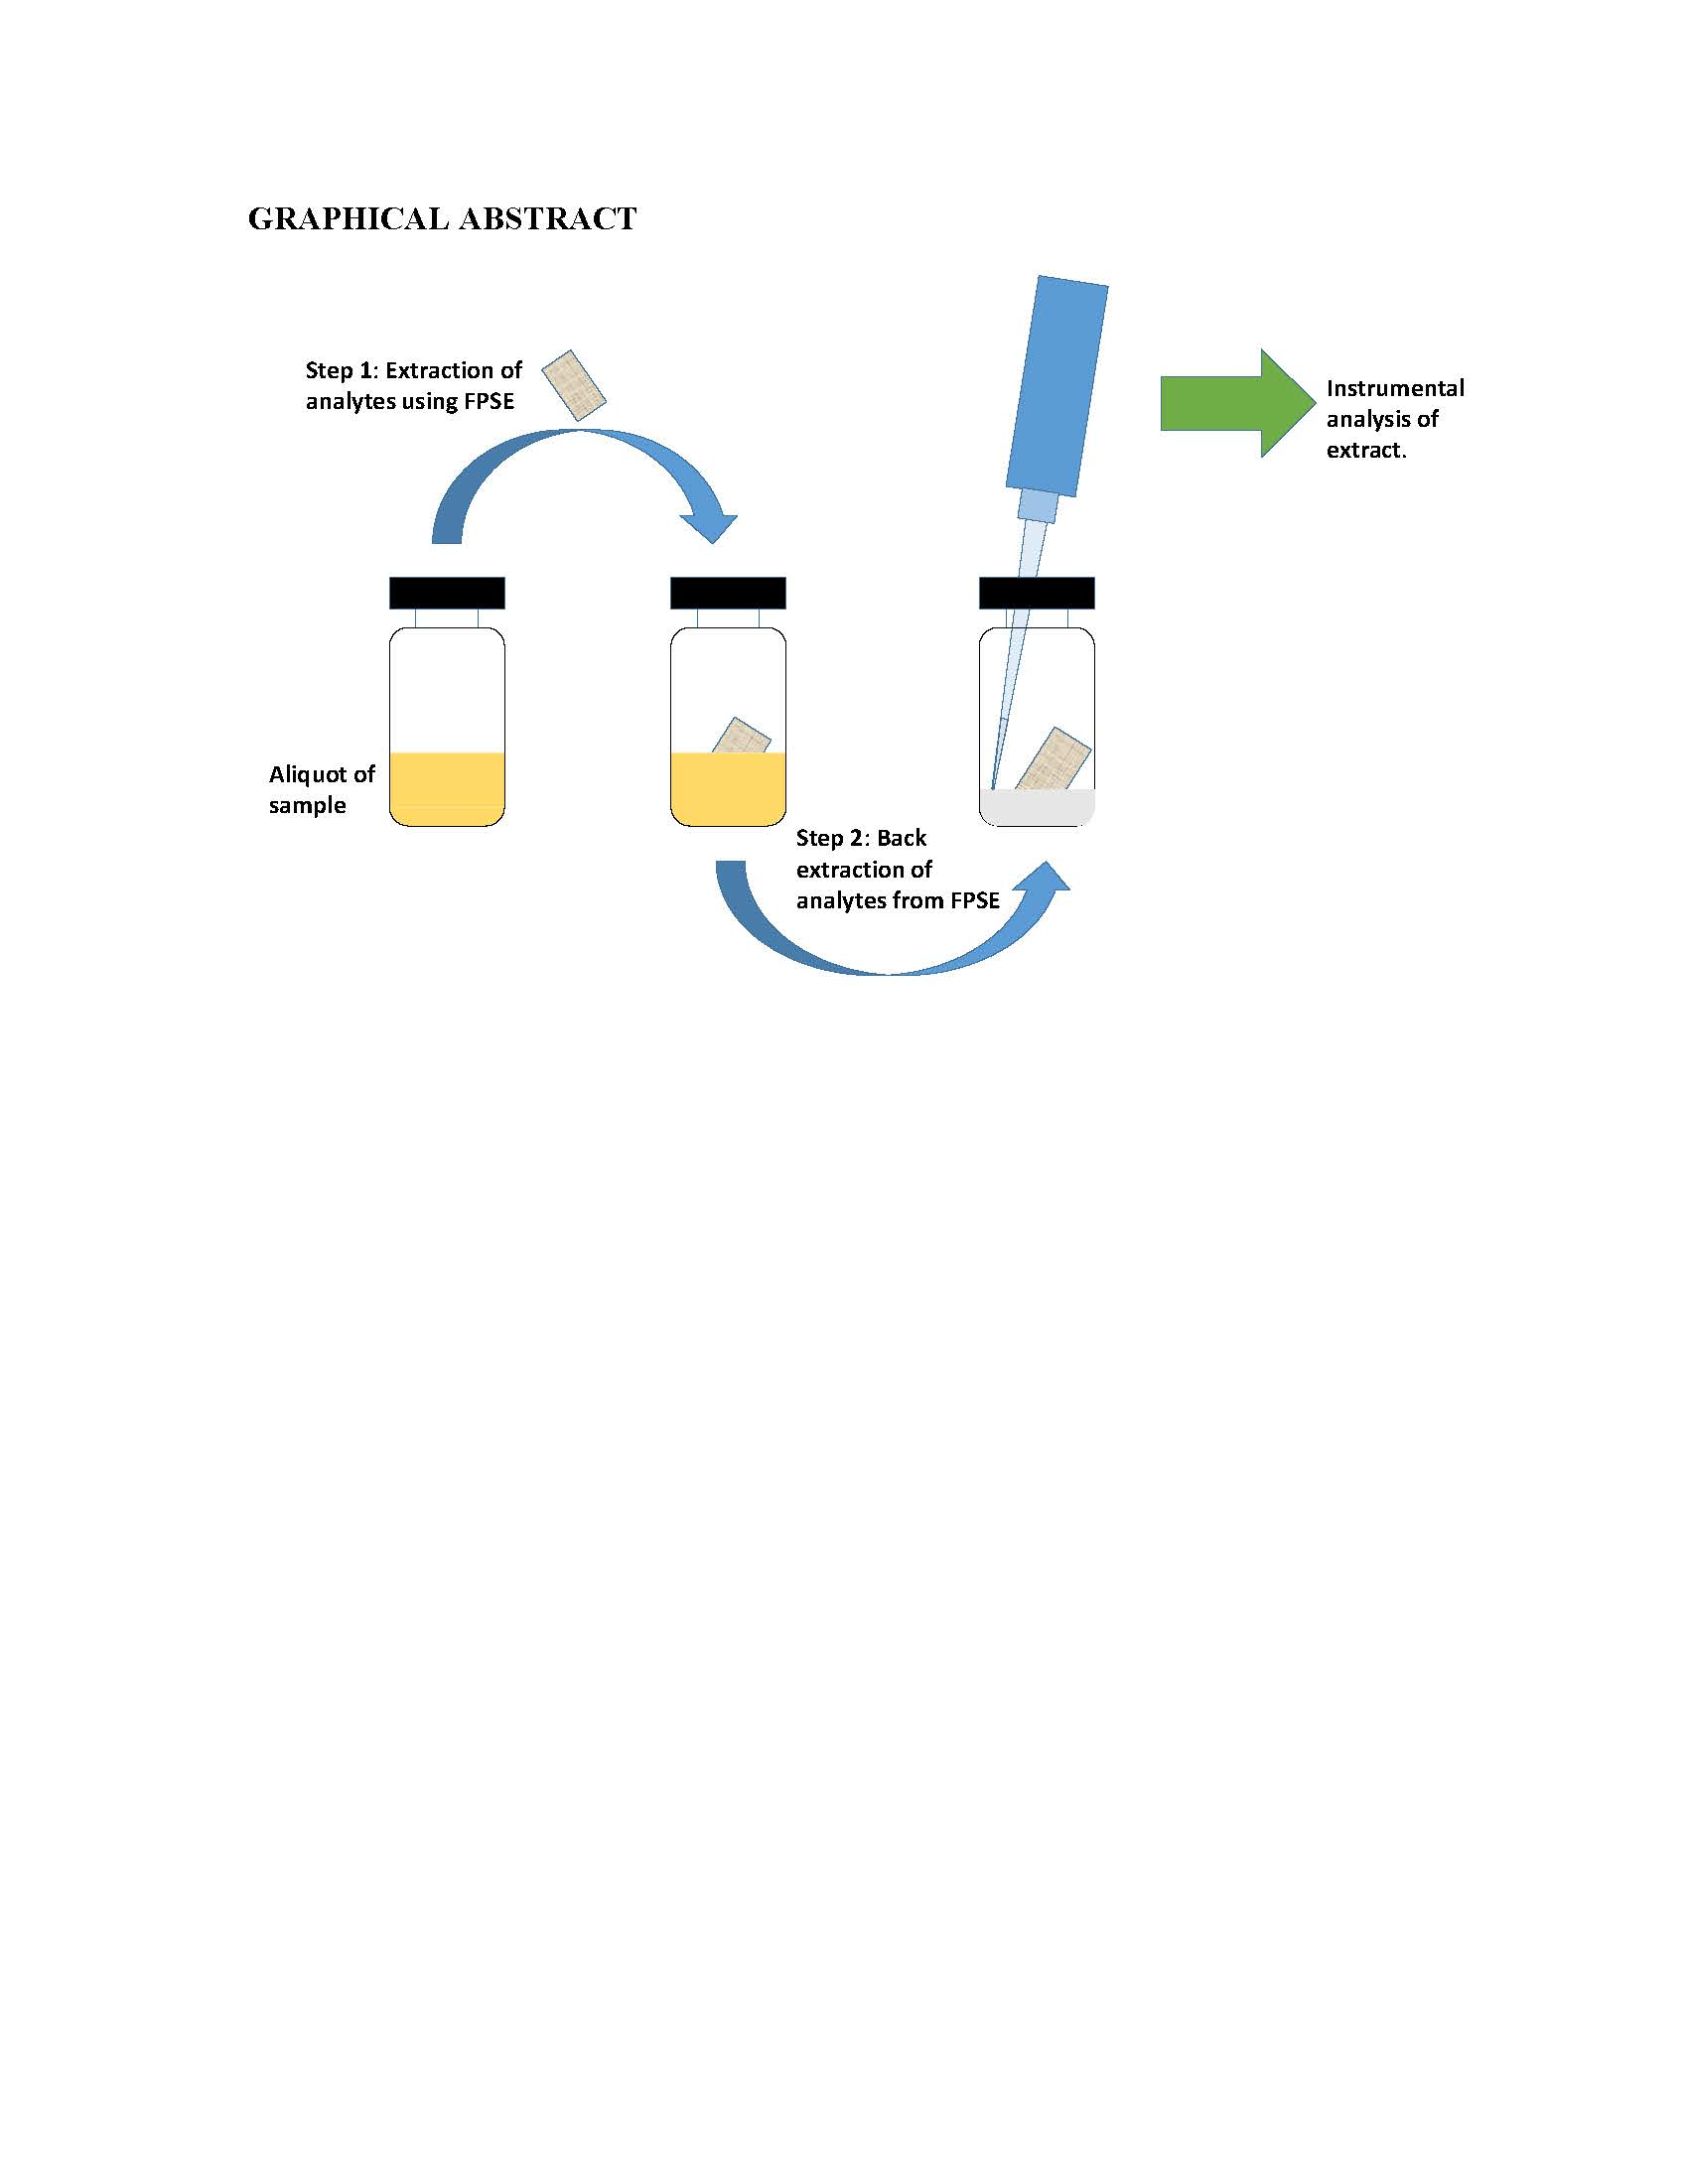
2.4. Fabric Phase Sorptive Extraction and Back-Extraction Procedure
2.4.1. Preparation of Standard Solutions for Fabric Phase Sorptive Extraction
All primary stock solutions (substituted phenols) were prepared by dissolving 100 mg of each analyte in 10 mL methanol in a 22 mL amber glass vial to obtain a solution concentration of 10 mg/mL. The intermediate stock solution was prepared by diluting the primary stock solution to 1.0 mg/mL in methanol. All working solutions were prepared by diluting intermediate stock solutions in HPLC grade water to reach the desired concentrations. FPSE method development and validation exercises were carried out using HPLC grade water impregnated with substituted phenols at different concentration levels.
2.4.2. Fabric phase Sorptive Extraction
A 5 cm2 piece (2.5 cm × 2.0 cm) of sol–gel PEG coated FPSE device was immersed in 1 mL methanol: acetonitrile (50:50, v/v) for 5 min to ensure cleanliness. The device was air dried to remove the residual organic solvent. The clean FPSE device was then immersed into the sampling vial (10 mL) containing the sample impregnated with the analytes of interest. A small Teflon coated magnet was placed into the vial. Finally, the vial was placed on top of a magnetic stirrer to promote diffusion of the analytes throughout sample for a predetermined period of time. After that, the FPSE device was removed from the sampling vial and was shaken off or dried with a Kim wipe. This is particularly important if the prepared sample is to be analyzed in gas chromatography.
2.4.3. Back-Extraction/Solvent Desorption
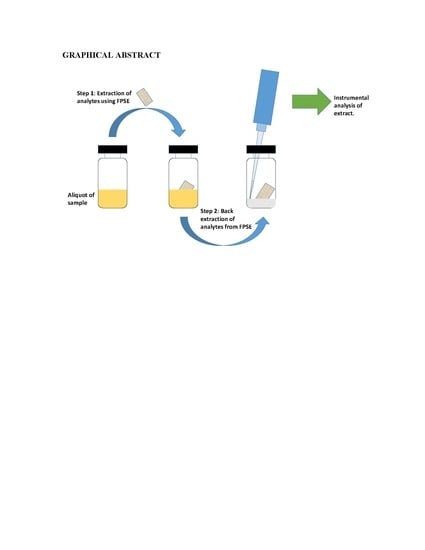
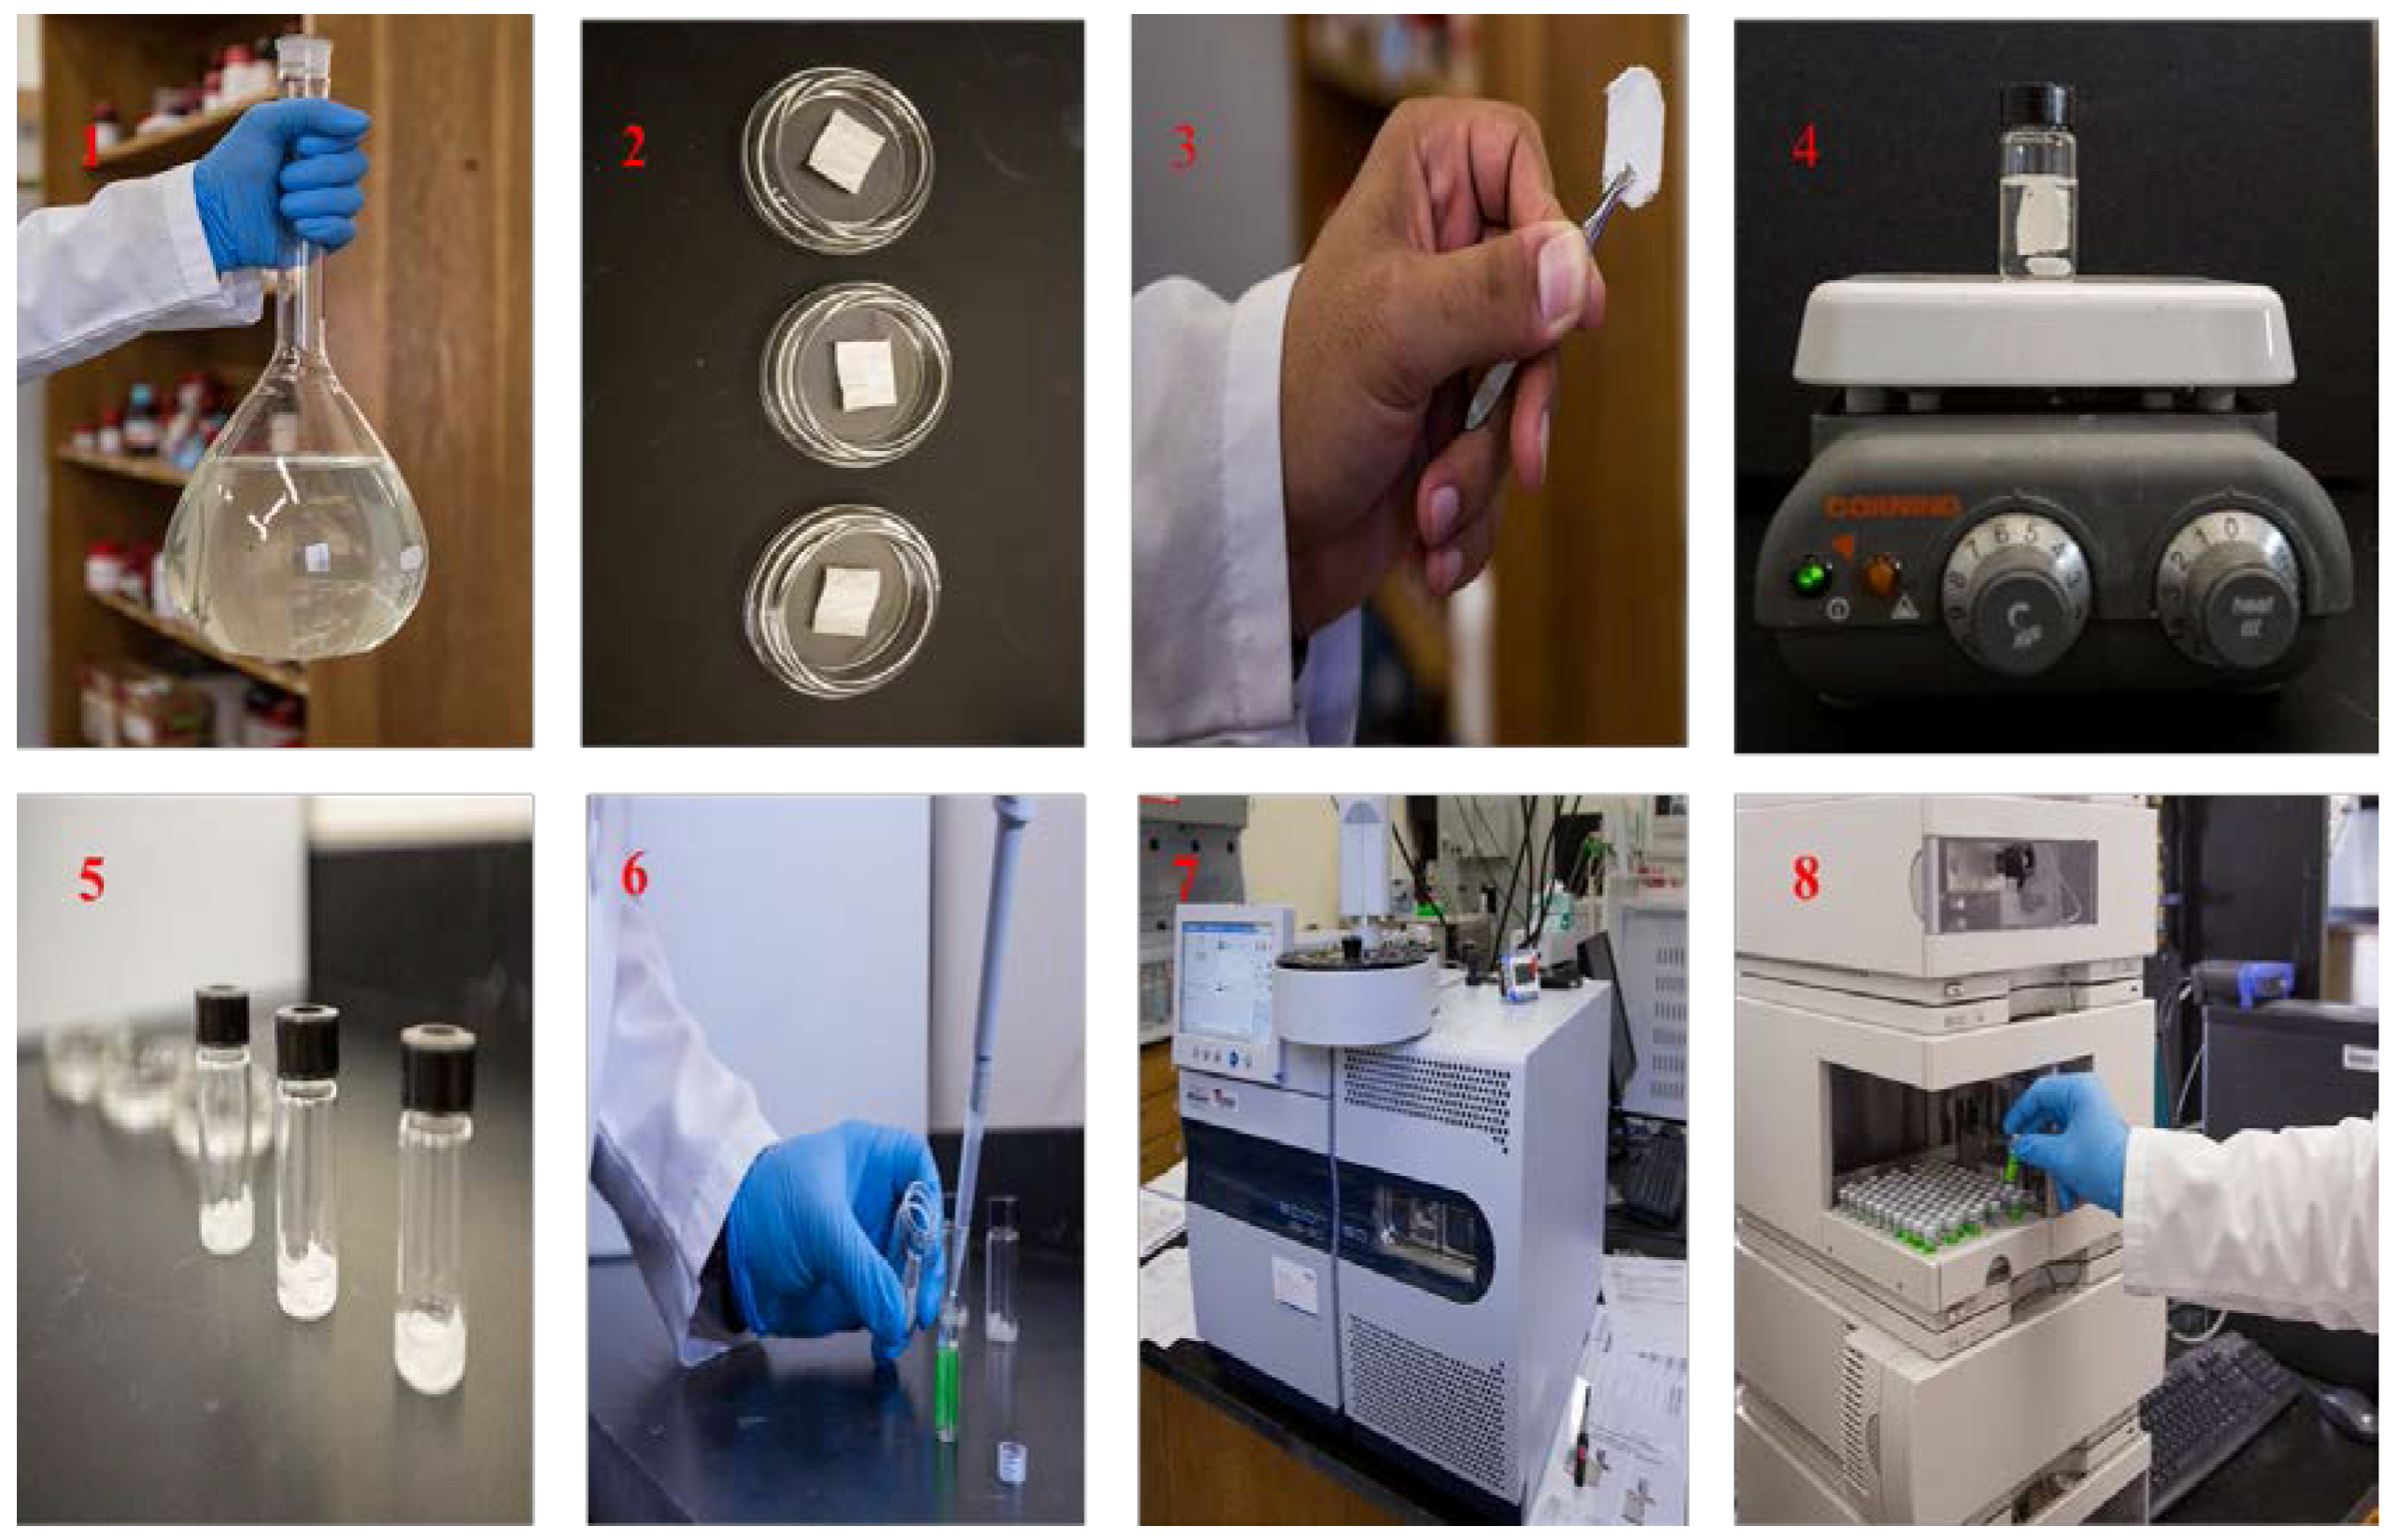
The analytes extracted on the FPSE device were back-extracted into a suitable solvent system. 500 μL of the solvent system was transferred into a 1 mL glass vial. The dry FPSE device containing the extracted analytes was immersed into the solvent mixture. The back-extraction was carried out by simply keeping the FPSE device immersed into solvent system for a predetermined period and no external diffusion mechanism (stirring/sonication) was imposed. The back-extraction solution containing the extracted analytes was then transferred into an Eppendorf tube for centrifugation to compel any remaining particulates to precipitate. Finally, the particle free preconcentrated solution of analytes was transferred into a HPLC/GC sample vial for chromatographic analysis. In order to reuse the FPSE medium in future, it was cleaned with 1 mL methanol: acetonitrile (50:50,
v/
v) for 5 min, dried on a watch-glass for 5 min and then stored in a clean glass container. A series of photographic images presented in
Figure 1 to demonstrate different steps involve in fabric phase sorptive extraction.
3. Results and Discussion
3.1. Theoretical Considerations
The principle of FPSE, similar to SPME and related equilibrium-driven sorptive microextraction techniques [
14,
41,
42], is based on the interactions between the analytes and the extraction sorbent. Under equilibrium extraction conditions, the amount of analyte extracted (
n) by FPSE medium is proportional to the partition coefficient between the extraction phase and the sample matrix (
Kes), volume of the extracting phase (
Ve), volume of the sample (
Vs), equilibrium extraction amount (
n) of the analytes, and the original concentration of the analyte (
C0) as expressed in Equation (1):
When the sample volume is large compared to the volume of the extraction sorbent,
KesVe <<
Vs, Equation (1) can be simplified to,
As Equation (2) suggests, the amount of the extracted analyte(s) is directly proportional to the volume of the extraction sorbent and hence can be increased by expanding the volume of the extraction sorbent if the analyte(s) concentration is kept constant.
However, according to the kinetic theory of extraction, expanding the volume of extraction sorbent by increasing the coating thickness of sorbent may result in long extraction equilibrium time as expressed in Equation (3). When the extraction sorbent is dispersed as a thin film on the substrate, the diffusion of analytes through the boundary layer controls the extraction kinetic (rate of extraction). As such, the time required to extract 95% of the equilibrium extraction amount of the analytes,
te,95% can be calculated as,
where
b is the extraction sorbent thickness,
δ is the boundary layer thickness,
Kes is the distribution constant of analyte between the extraction sorbent and the sample matrix,
Ds is the diffusion coefficient of the analyte in the sample matrix, and
B is a geometric factor referring to the geometry on which the extraction sorbent is coated.
As is evident from Equation (3), the equilibrium extraction time can be reduced by reducing the coating thickness (b), by increasing primary contact surface area of the extraction medium (smaller B value), or by increasing the analyte diffusion in the sample matrix by applying external stimuli e.g., stirring, sonication, shaking, etc.
The rate of extraction in sorptive microextraction is not linear. The extraction rate is very fast at the beginning of the extraction process and slows down as the extraction progresses toward equilibrium. The initial rate
of extraction is proportional to the surface area of the extraction phase, A as shown in Equation (4):
Therefore, it is obvious that in order to increase the sensitivity of the microextraction system, the loading of the sorbent has to be increased. On the other hand, to reduce the extraction equilibrium time, surface area of the extraction device has to be increased.
3.2. Significance of Porous Substrates for Microextraction Sorbent
The permeability of the microextraction substrate plays a pivotal role in the mass transfer rate from the sample matrix to the microextraction sorbent. A plausible model explaining the events that occur during the extraction process for both impermeable and permeable substrate is presented in
Figure 2. It is worthy to mention that among all contemporary sorbent based sorptive microextraction techniques, FPSE is the only technique that utilizes permeable substrate to expedite the extraction equilibrium.
Under the influence of external stimuli (stirring, sonication, etc.), a continuous flow of the sample moves toward the substrate holding the microextraction sorbent for interaction. When an impermeable substrate such as fused silica fiber is used, the flow bounces back and collides with the incoming flow, redirecting some of the incoming flow away from the substrate surface. As a consequence, only a fraction of the target analytes may interact with the sorbent. On the contrary, when the substrate is permeable, majority of the incoming flow of the sample penetrates the surface without being redirected. As a result, the mass transfer between the sorbent and sample occurs rapidly, within a fraction of the time required for similar interactions with impermeable substrates. This is consistent with the experimental result obtained by Alcudia-León et al. [
43]. In this study, the authors compared the extraction behavior of stir bars coated with impermeable PTFE of varying surface areas to a porous PTFE stir-membrane unit. The highest extraction sensitivity was obtained by the porous stir-membrane among all the test devices even though it had a low surface area relative to the impermeable units. This observation was a clear manifestation of the role of porous substrates as the hosts for microextraction sorbents.
3.3. Surface Chemistry of Cellulose Substrate
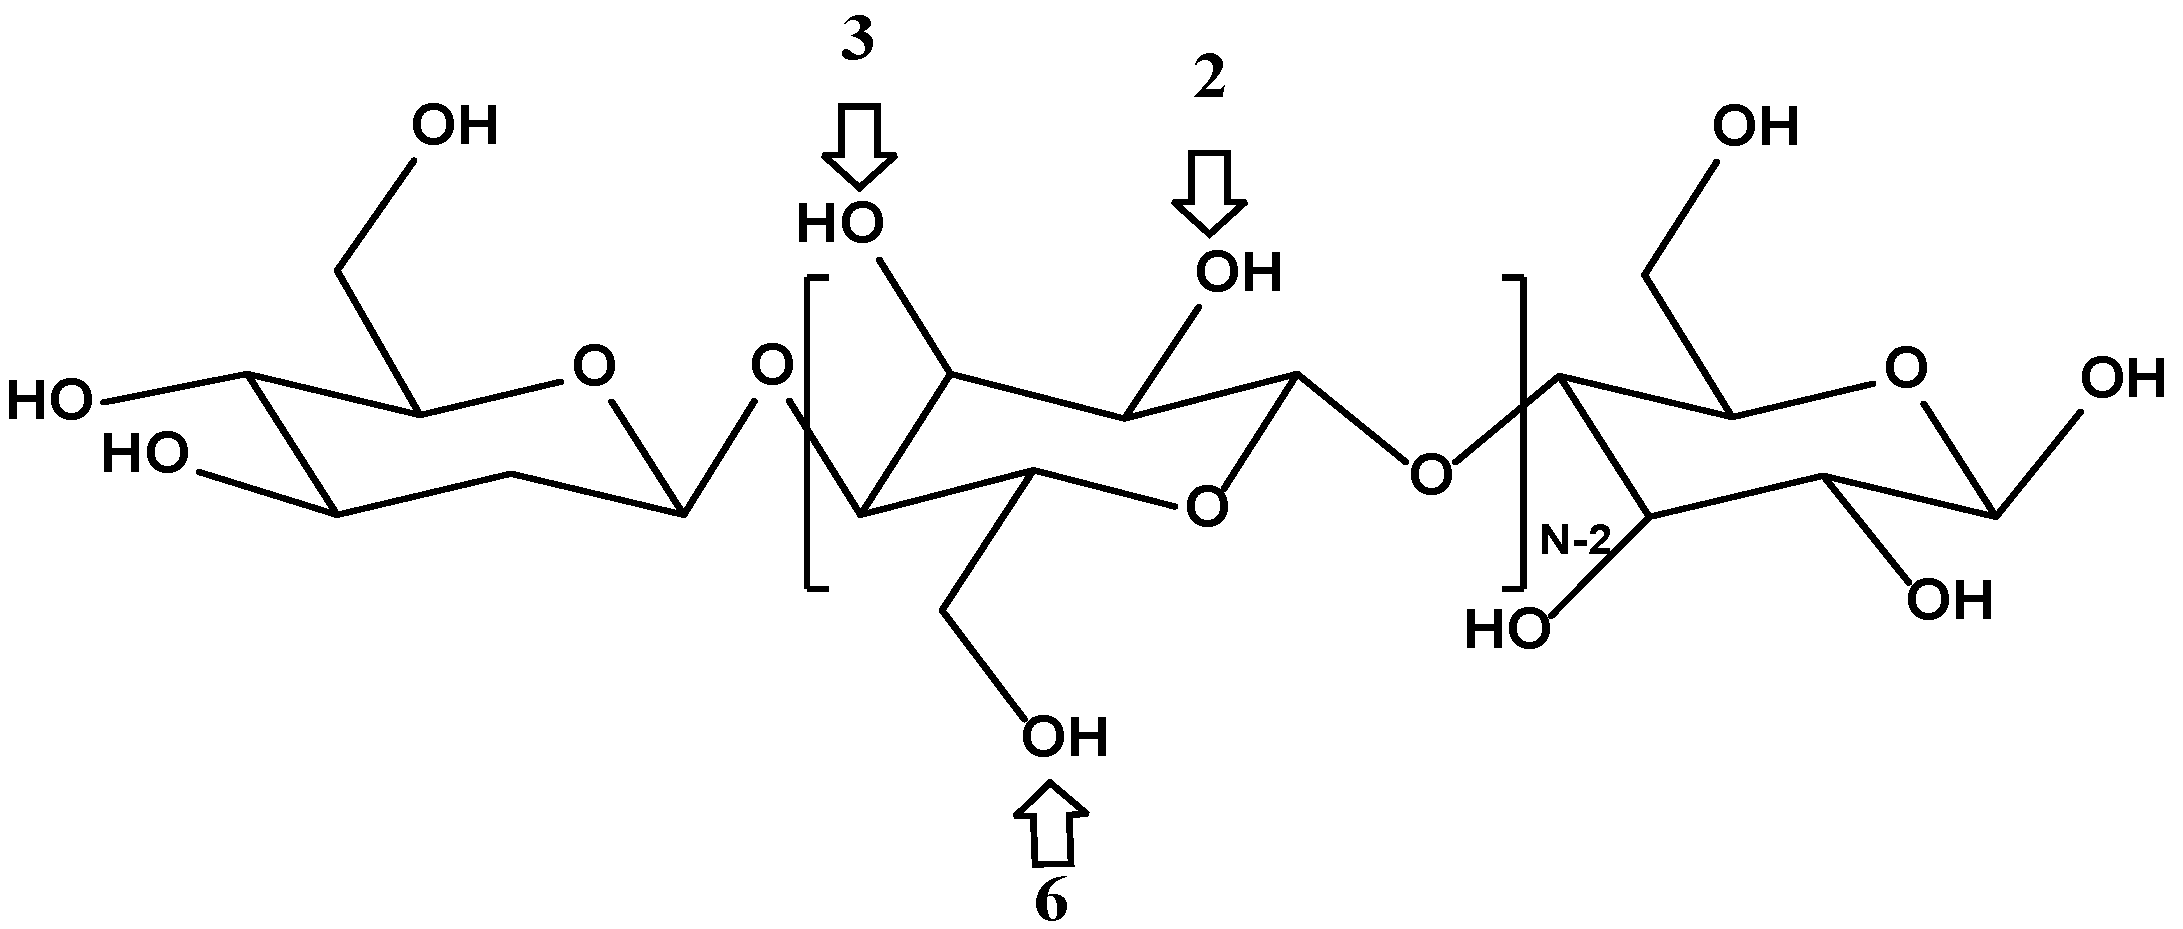
Cellulose is a hydrophilic linear polymer of β-
d-glucopyranose, whose structure is shown in
Figure 3. Each dimer of cellulose contains three hydroxyl functional groups in positions 2, 3, and 6 that can participate in polycondensation during the sol–gel coating process at a varying degree of reactivity [
44]. As such, cellulose seems to be an excellent candidate as a potential substrate for sol–gel sorbent coating.
The cellulose fabric used in this experiment was activated by treating it with 1 M NaOH solution for an hour under sonication. Swelling of cellulose, also known as mercerization, is an important treatment that improves its chemical reactivity and significantly increases the availability of all the hydroxyl groups for chemical reactions [
45].
3.4. Sol–gel Coating Process on Fabric Phase Sorptive Extraction Media
Sol–gel process in creating the sorbent coatings on cellulose substrate involves the following reactions:
- (i)
Catalytic hydrolysis of sol–gel precursor;
- (ii)
Polycondensation of hydrolyzed precursors leading to a growing sol–gel network;
- (iii)
Random incorporation of sol–gel active organic polymer into the growing sol–gel network;
- (iv)
Immobilization of the growing sol–gel network on the substrate surface via polycondensation.
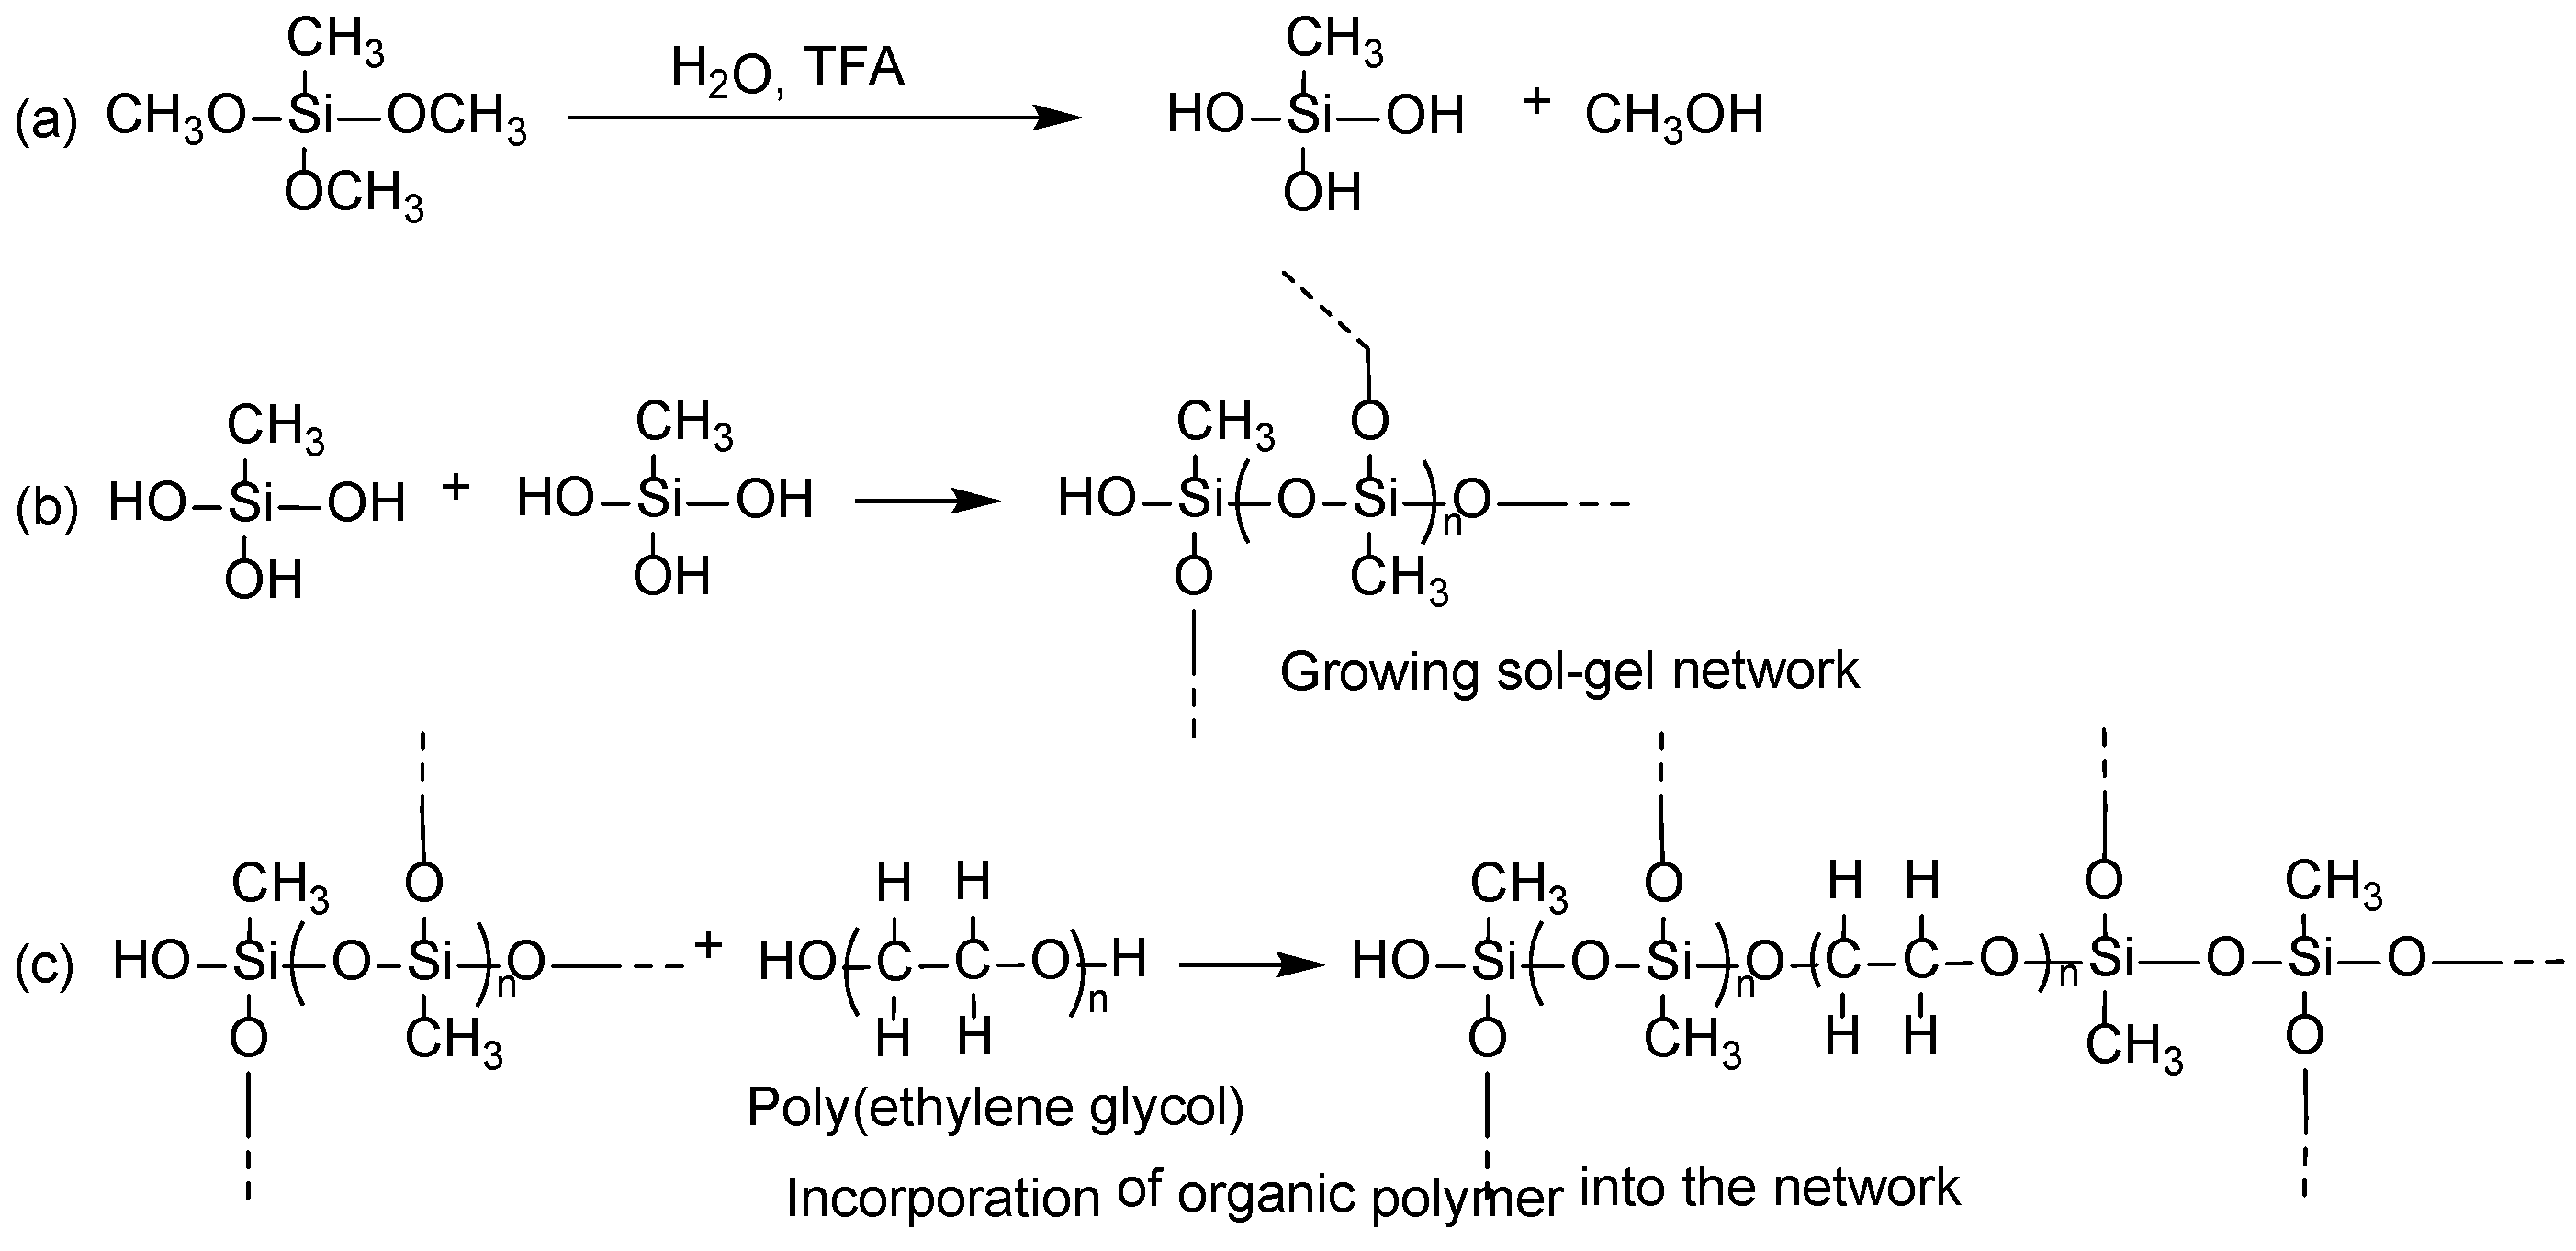
Under the appropriate experimental conditions, sol–gel precursor MTMS undergoes hydrolysis in the presence of sol–gel catalyst, trifluoroacetic acid (TFA). The hydrolyzed MTMS molecules then participate in polycondensation to create a sol–gel network. Sol–gel active organic polymer, poly(ethylene glycol) present in the respective sol solution enters randomly into the growing sol–gel network during this step. Polycondensation of the sol–gel network with the available hydroxyl functional groups of cellulose results in a thin, chemically bonded layer of sorbent wrapped on cellulose microfibrils.
A tentative reaction scheme of the sol–gel process is given in
Figure 4.
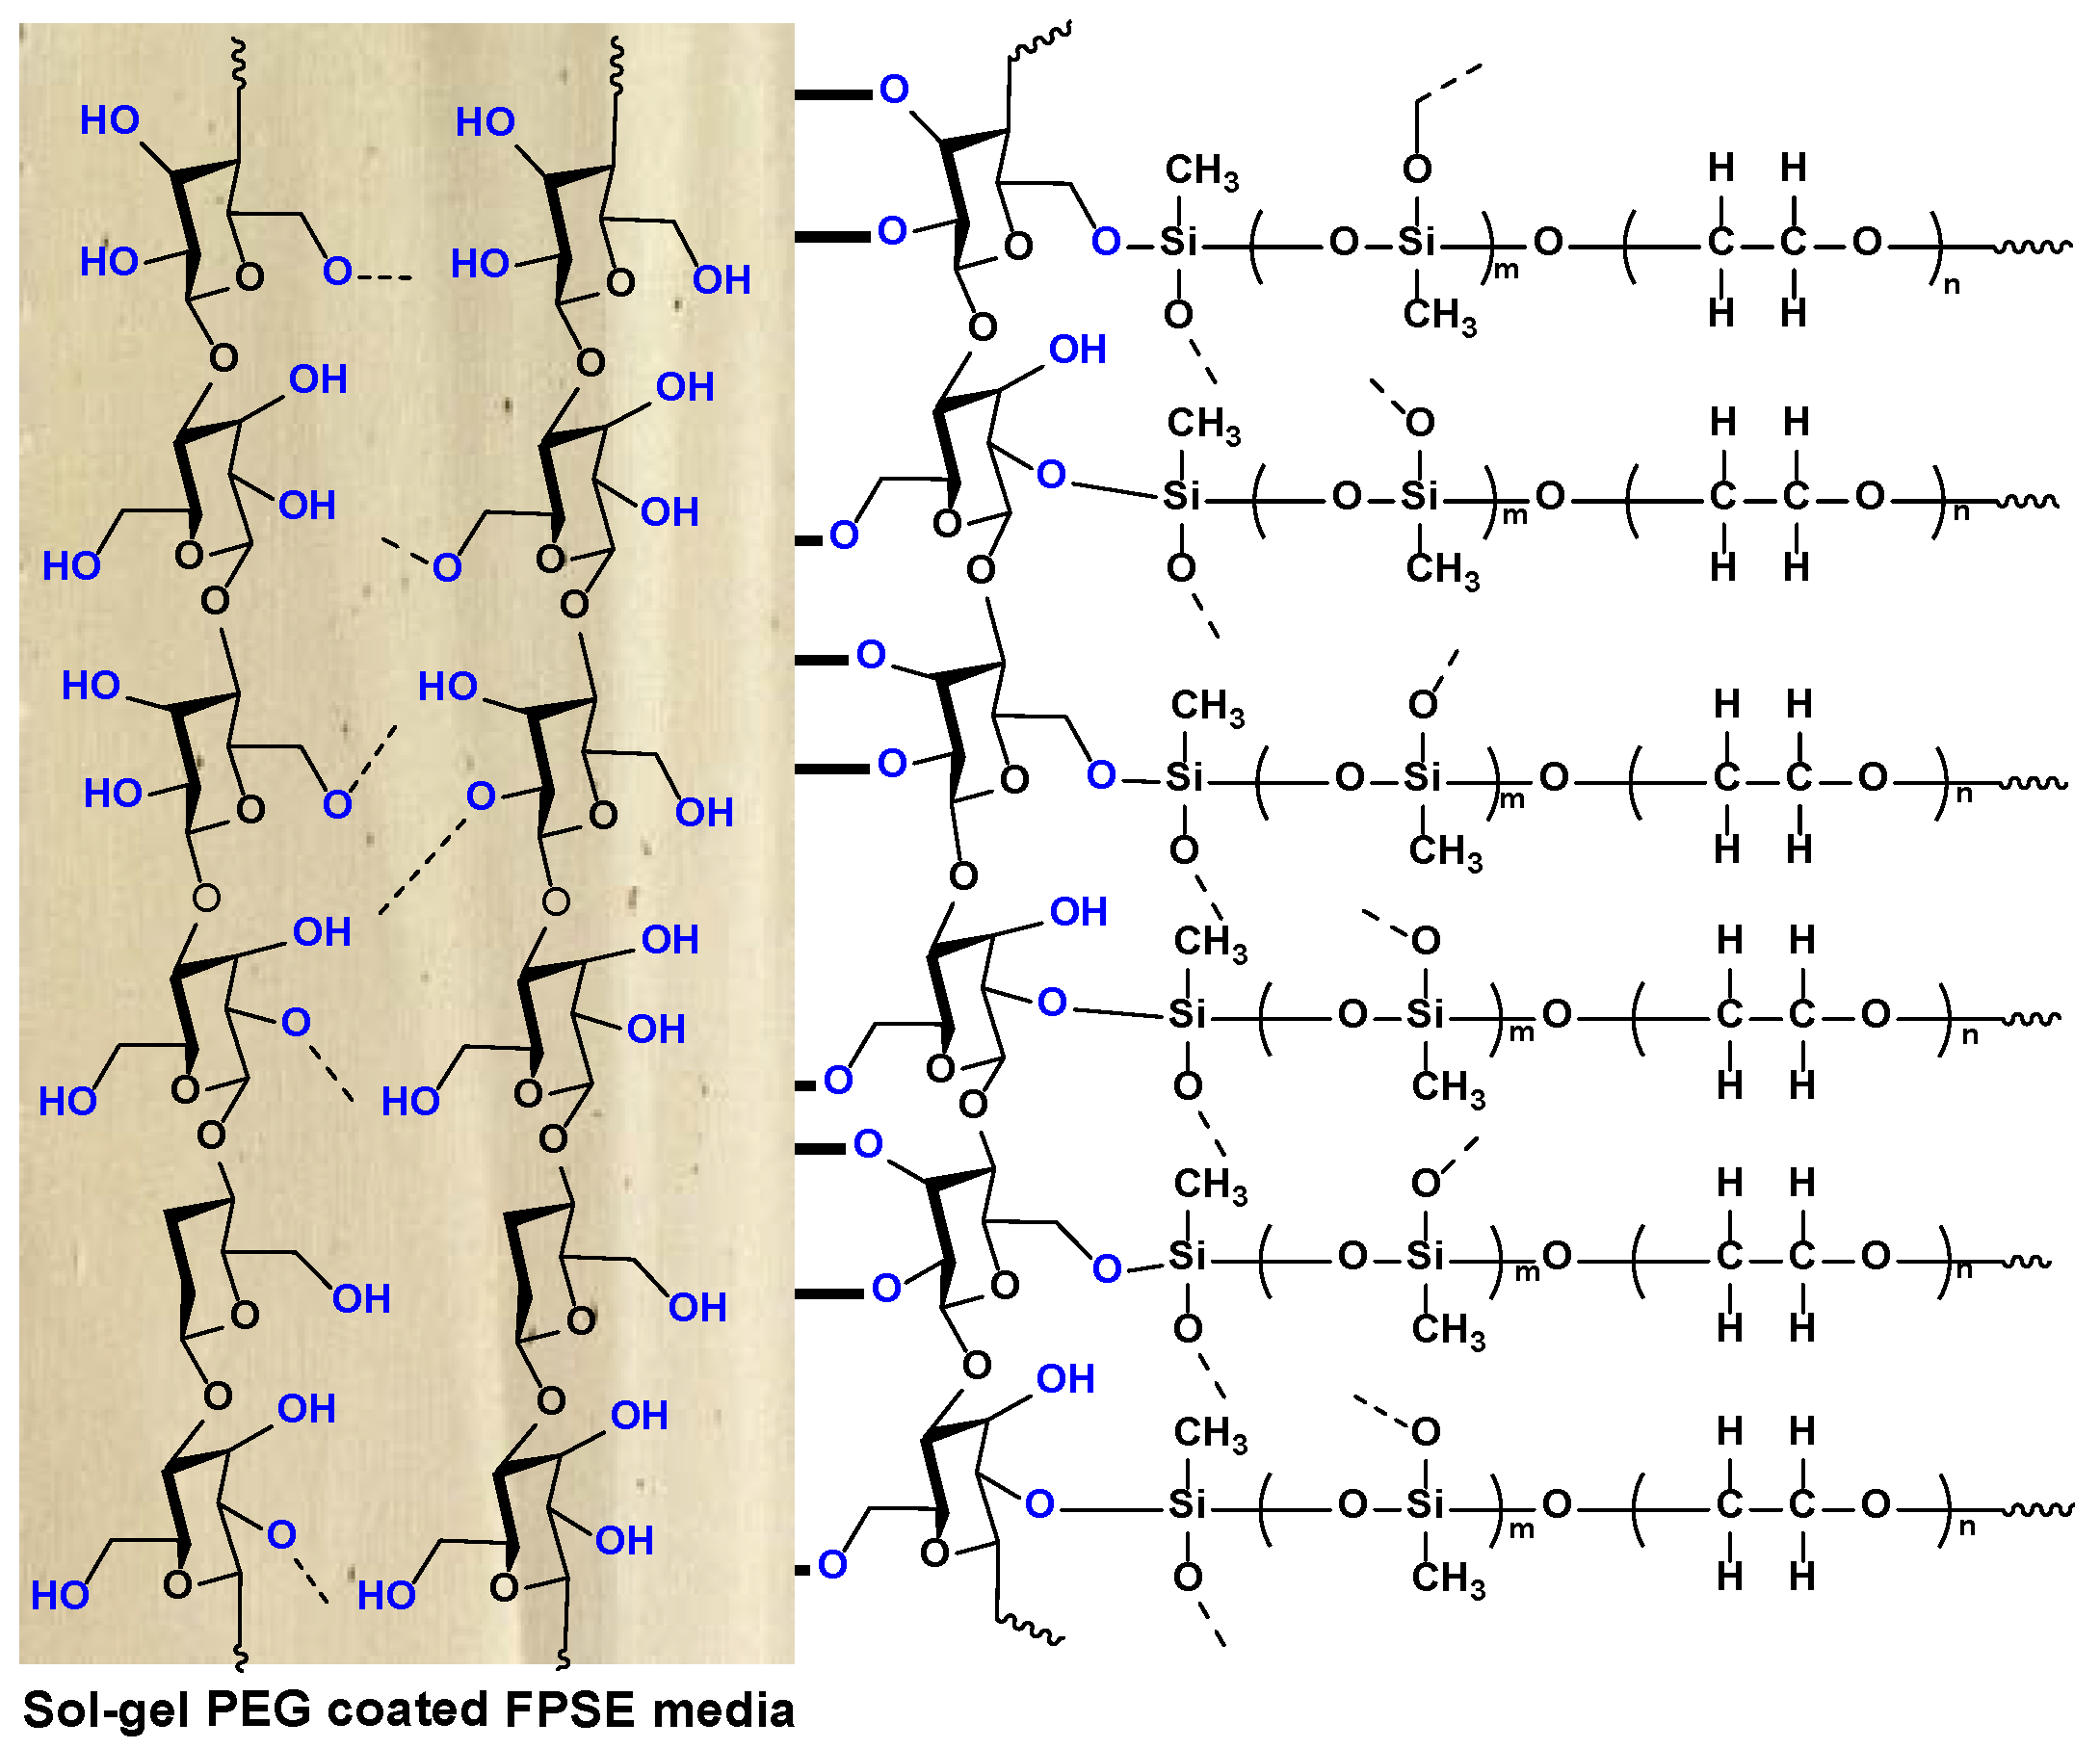
Figure 5 demonstrates the schematic representation of sol–gel PEG coated FPSE media. Although the sol–gel PEG coating on the fabric substrate can’t be seen in naked eye, the structure of the sorbent coating can be visualized at higher magnification in scanning electron microscopy or similar imaging instrument.
The sol–gel coating process results in a highly porous and uniformly distributed ultra-thin three-dimensional network of hybrid inorganic-organic sorbent chemically bonded to the substrate. As the coating occurs on individual cellulose microfibrils, the sorbent loading is relatively high with low coating thickness.
3.5. Characterization of FPSE Media
3.5.1. Characterization of FPSE Media Using FT-IR
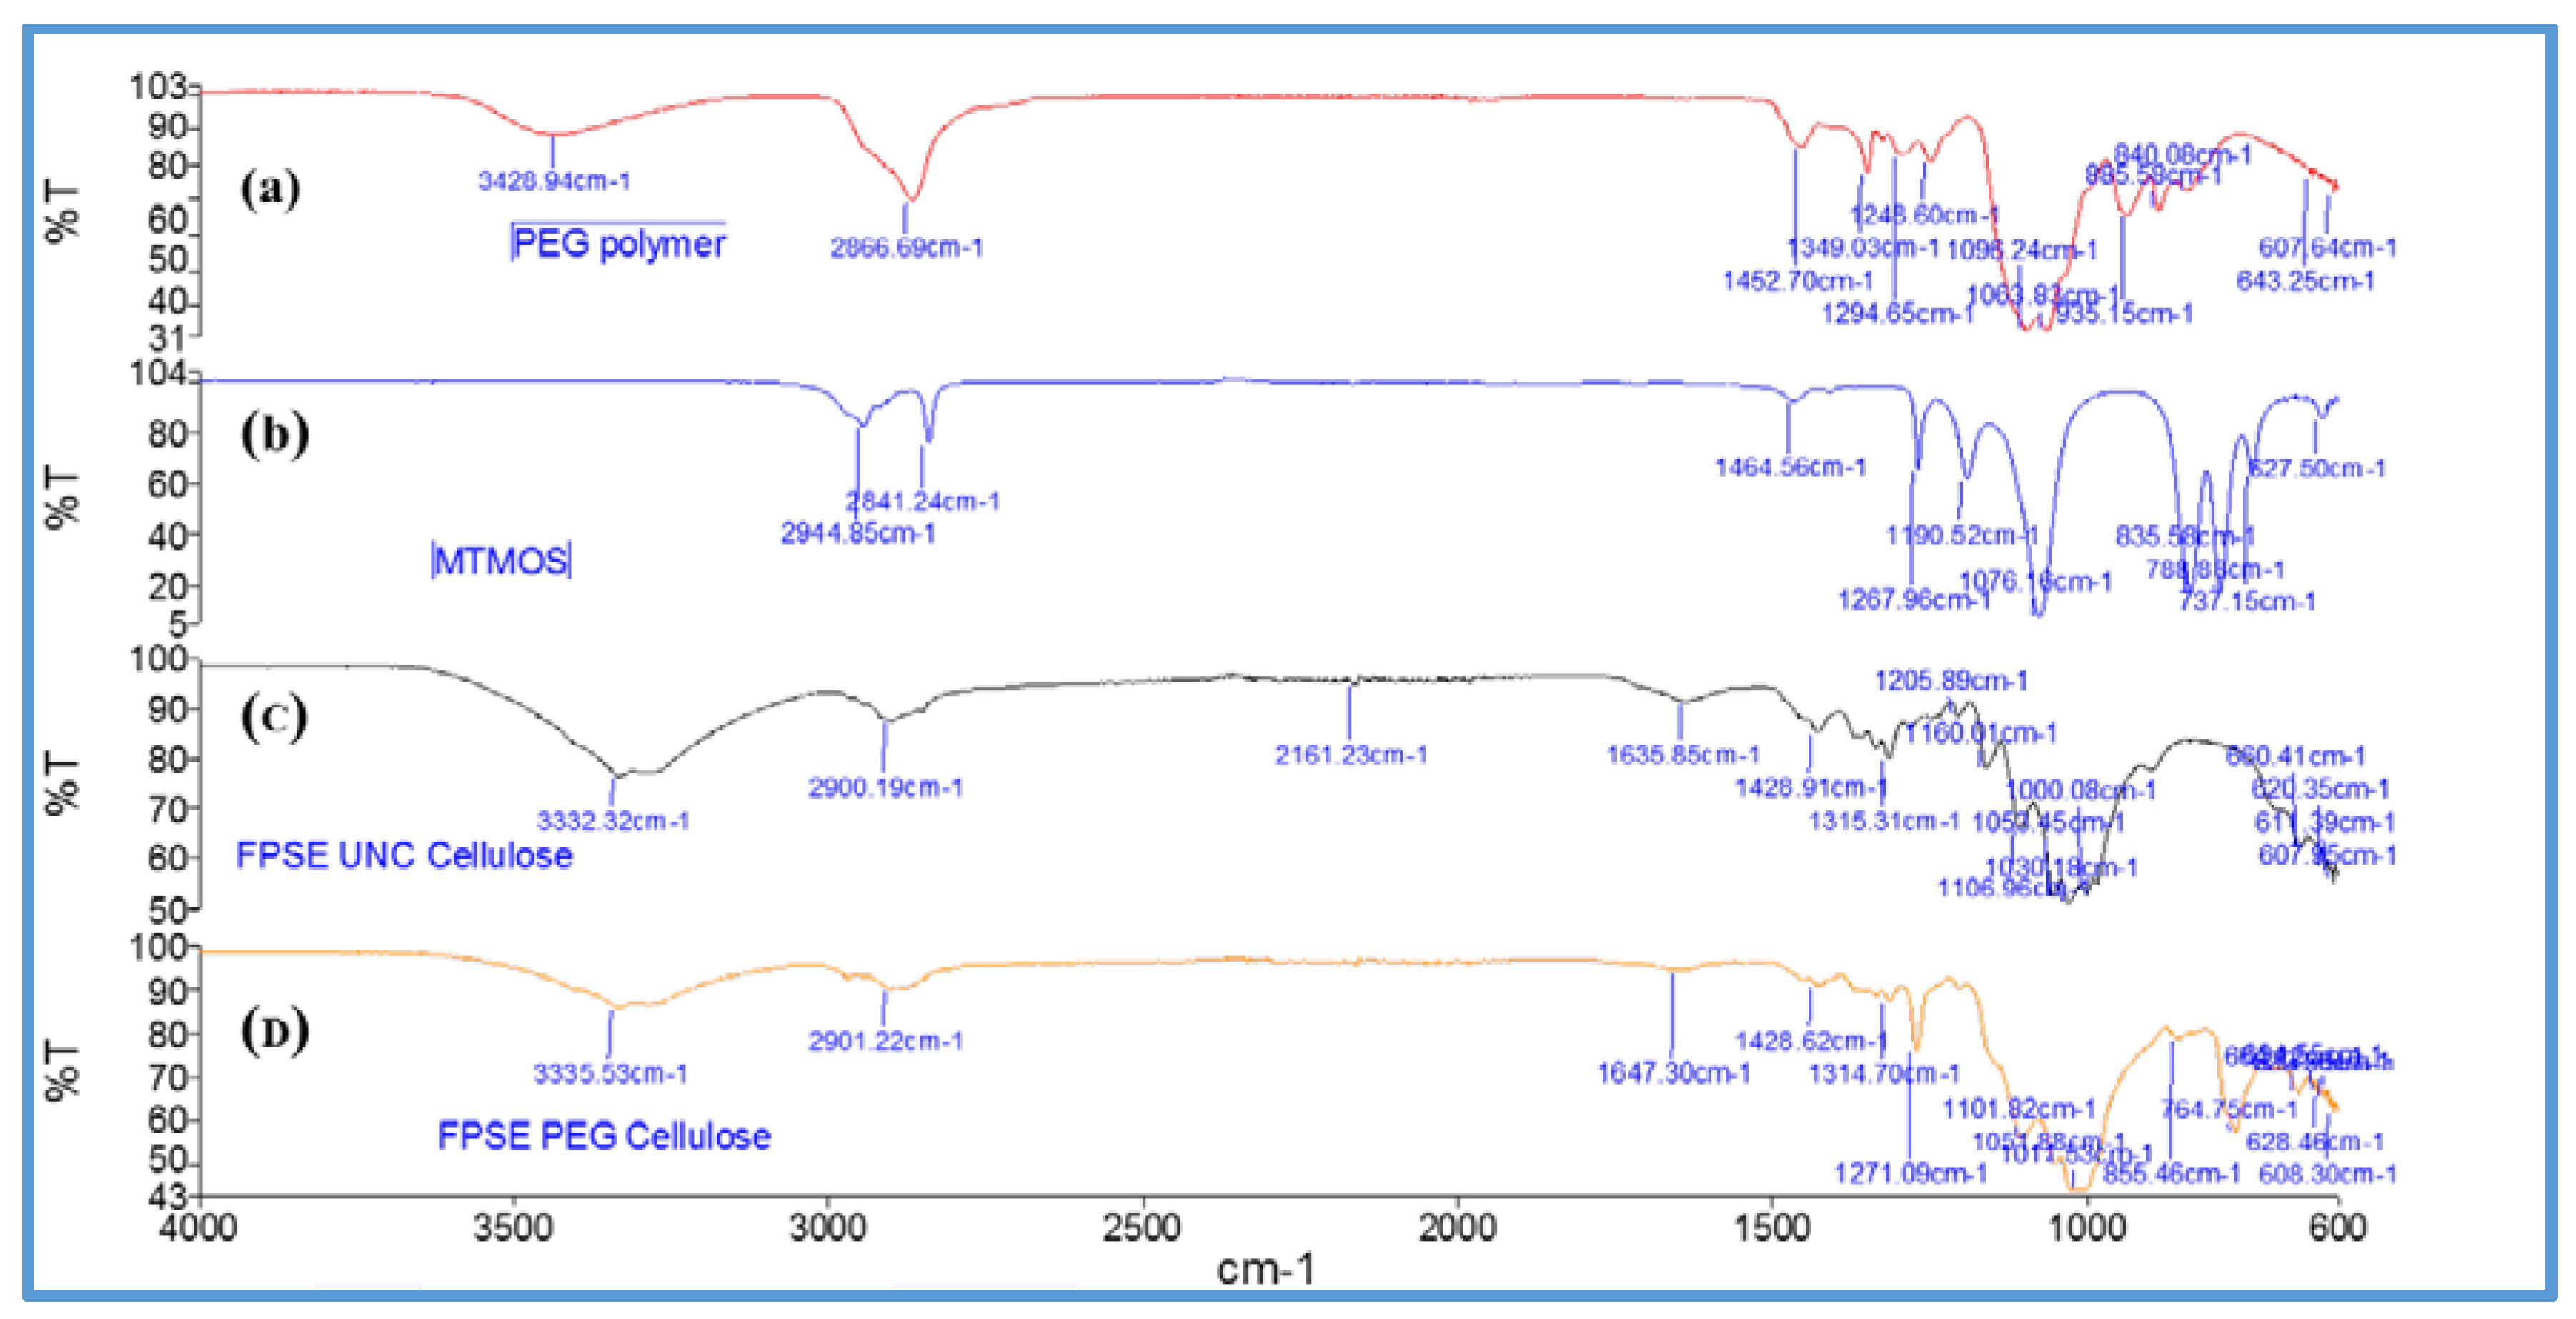
Figure 6 shows FT-IR spectra of uncoated cellulose, MTMS, poly(ethylene glycol), and sol–gel PEG coated FPSE media.
As can be seen from the FT-IR spectra, MTMS [
46] demonstrates characteristic Si–O–C–H band at 2944 cm
−1. Uncoated cellulose demonstrated characteristics peaks at 3332 cm
−1 and 2900 cm
−1, 1315 cm
−1, and at 1030 cm
−1 corresponding to O–H, C–H and C–O stretching and C–H bending vibration, respectively. In the fingerprint region between 1428 cm
−1 and 850 cm
−1, the characteristic peaks were recorded at 1105 cm
−1 (C–O–C) bridges, glycoside bonds; 1029 cm
−1 C–OH primary alcohols, 1052 cm
−1 C–OH secondary alcohols, 1000 cm
−1, 983 cm
−1 –CH-bonds [
47]. The characteristic peak of poly(ethylene glycol) include 2866 cm
−1, 1349 cm
−1 which represent different vibration modes of C–H bonds. The peak at 1294 cm
−1 and 1248 cm
−1 belong to C–C double bond [
48]. For sol–gel PEG coated FPSE devices, no additional signals of deposited sol–gel network were clearly visible due to the overlapping with characteristic absorption bands of uncoated fabrics. However, the sol–gel coated FPSE media demonstrated a decrease in the absorption bands, which is considered to be clear manifestation of the presence of the coating on the substrate [
49].
3.5.2. Sorbent Loading on FPSE Media and Coating Reproducibility
Reproducibility of the sol–gel coating process is an important factor that potentially causes significant impact on the overall error profile of FPSE process. In order to verify the reproducibility of sol–gel coating as well as to determine sorbent loading per square centimeter of FPSE media, four conditioned fabrics were coated under identical reaction conditions. The fabrics (with known area) were weighed before and after the sol–gel coating followed by cleaning and drying to determine the amount of sol–gel sorbent immobilized on the surface. FPSE media were found to host high mass of sol–gel sorbent. Average mass of sol–gel PEG sorbent on FPSE media were calculated as 8.63 mg/cm2 (~43.2 mg/FPSE unit).
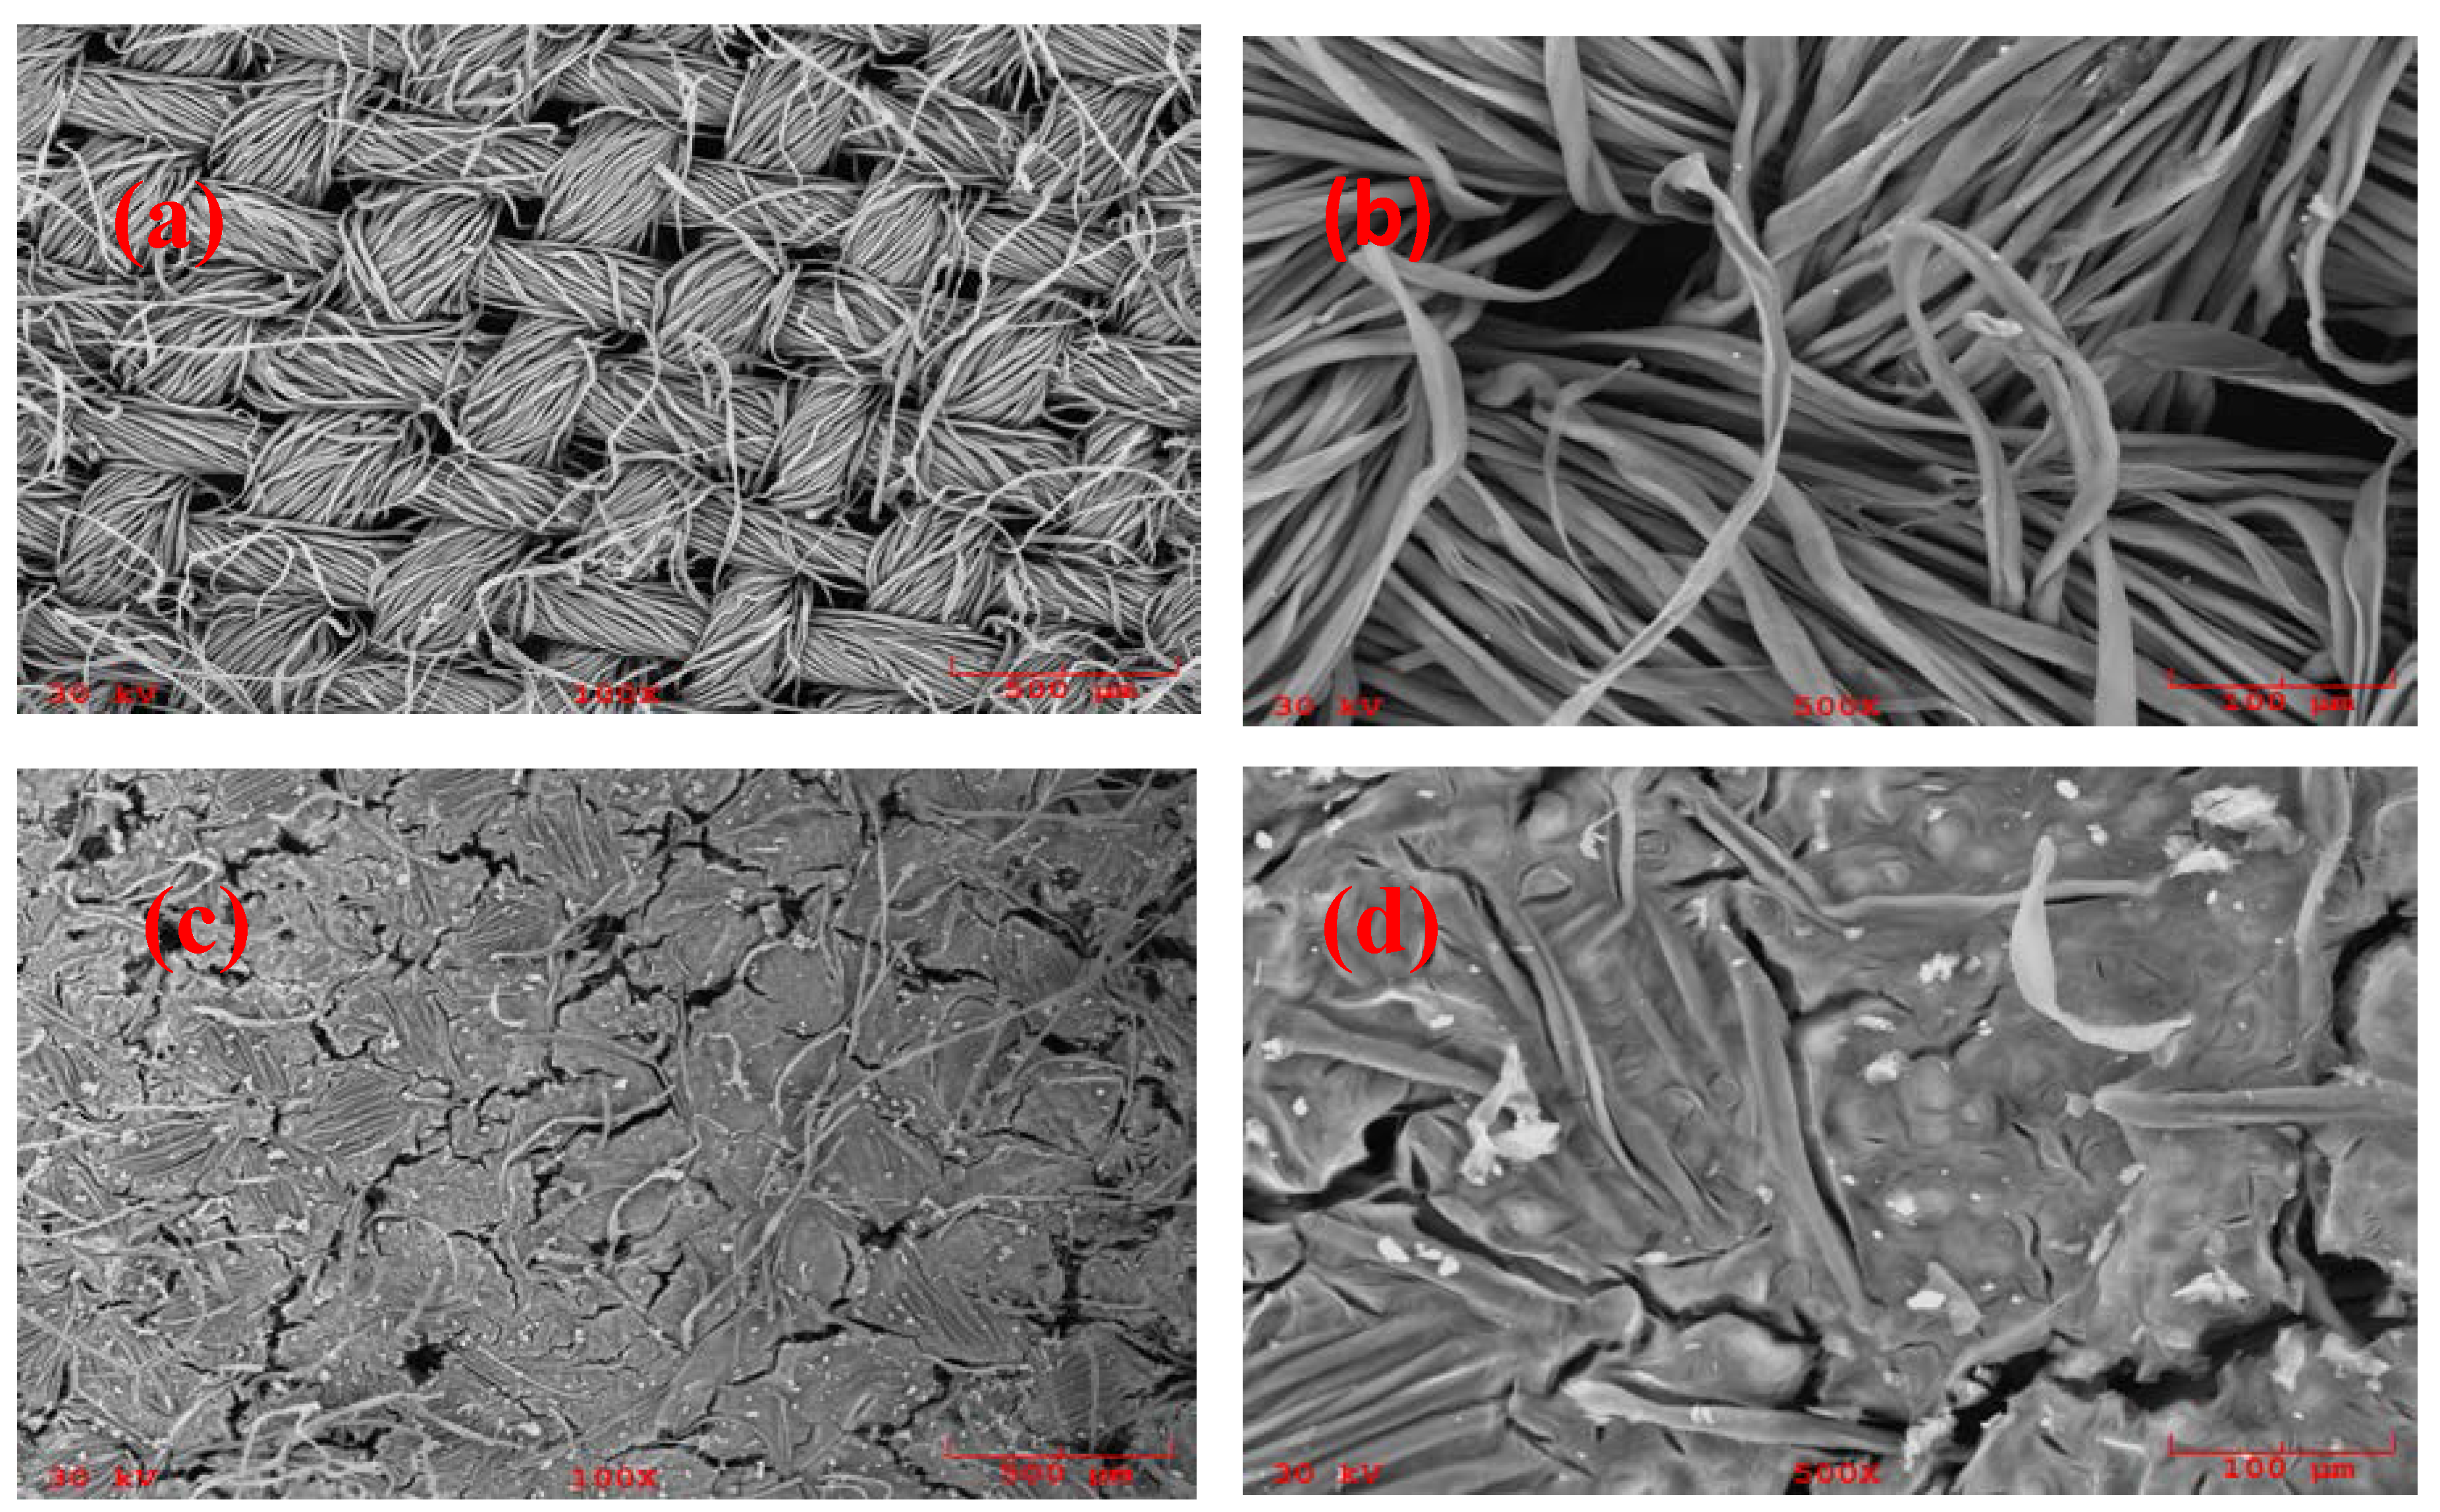
3.5.3. Scanning Electron Microscopy of FPSE Media
Figure 7 represents scanning electron micrographs (SEM) of uncoated, surface activated, and sol–gel PEG coated FPSE media.
As is evident from these micrographs, cellulose substrate is made up of microfibrils within the individual thread that are weaved to form the fabric. In addition to the inherent pores, capillaries, voids, and interstices, cellulose fibers are woven to contain well defined pores which are dependent upon their end usage. Low viscosity sol solution can easily permeate through the microfibrils and pores to create a uniform ultra-thin layer of sorbent coating on the surface. As such, sol–gel coating on FPSE media is not limited to only its outer surface. Instead, the coating is bonded throughout the three dimensional matrix of the substrate, resulting in a comparatively larger extraction surface with enhanced sorption capacity for the target analytes.
3.6. Optimization of Fabric Phase Sorptive Extraction (FPSE) Conditions
In order to maximize the extraction efficiency of FPSE as a novel new-generation microextraction technique, a number of factors that can impact extraction performance were evaluated including sample volume, extraction time, stirring speed, back-extraction solvent type and volume, and ionic strength.
3.6.1. Sample Volume
Although FPSE follows the general principle of sorption-based microextraction techniques, the high sorbent loading and extended primary contact surface area (10 cm2 for a typical 5 cm2 FPSE unit) have made this system different from other microextraction techniques. Therefore, it is important to study the impact of sample volume on the extraction behavior. The amount of analyte(s) extracted in any microextraction system is expected to increase with the increase in the sample volume up to a certain point, at which no further increase is expected. This optimum sample volume was determined by extracting substituted phenols at 5 ng/mL concentration from 10 mL, 15 mL, and 20 mL aqueous solutions for 40 min. The extraction results revealed that there is no statistically significant difference (p ≥ 0.05) in the extraction of 3,5-dimethyl phenol, 2,4,6-trichlorophenol, and 2,4-diisopropyl phenol between 10 mL, 15 mL, and 20 mL. However, a slight change (statistically significant, but practically insignificant) was observed for 4-chlorophenol and 2,6-dichlorophenol with different volumes. Based on these results, a 10 mL sample volume was used in all the subsequent experiments.
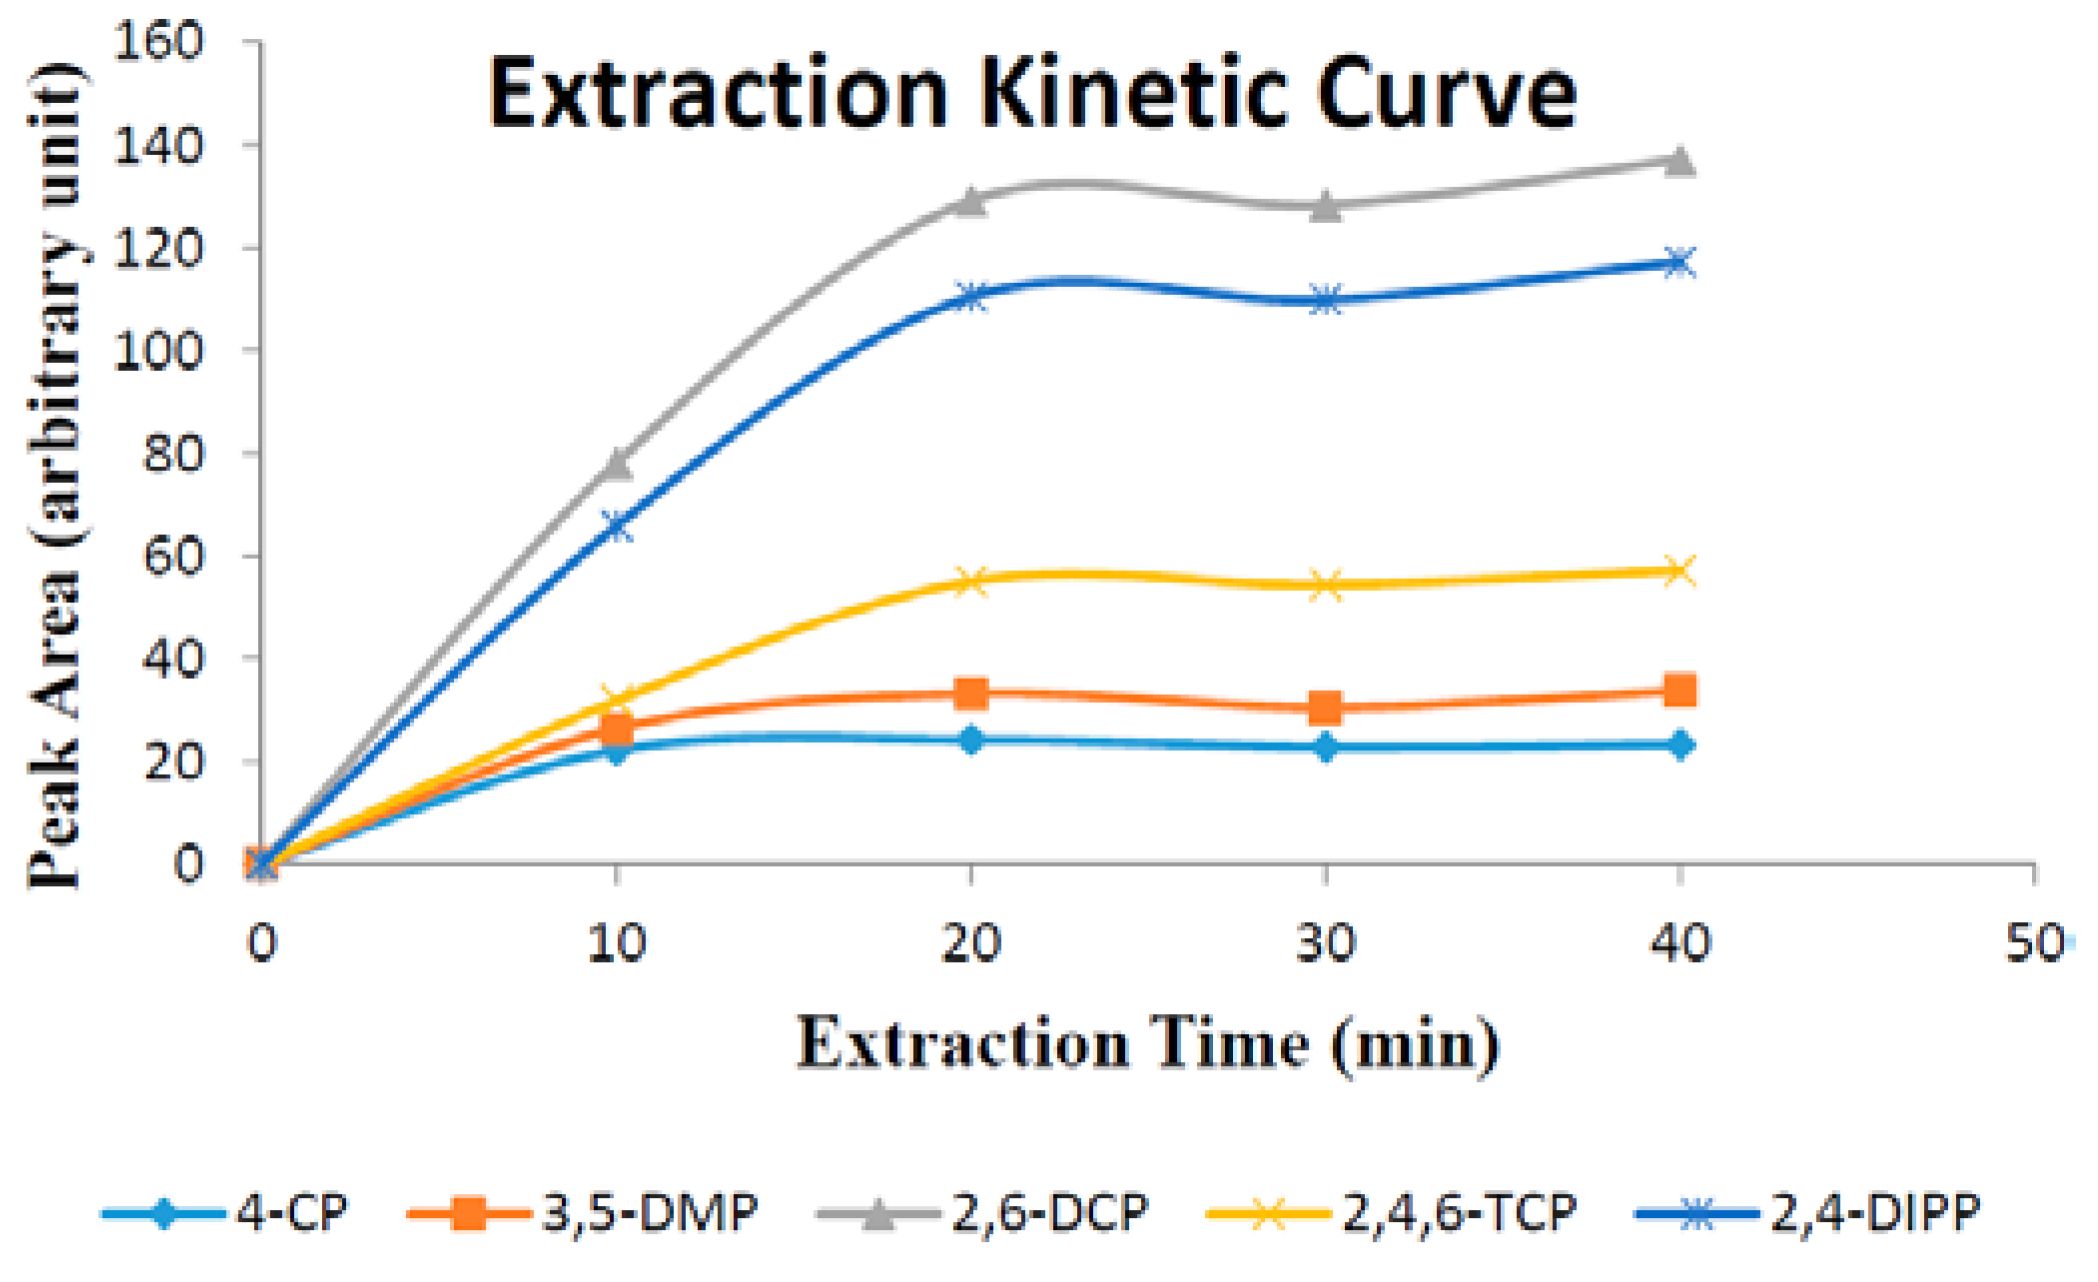
3.6.2. Extraction Time
Extraction time is one of the most important factors that influence extraction efficiency. In this work, the effect of extraction time on substituted phenols were investigated in over the span of 10–40 min. Experimental data (
Figure 8) demonstrate that the extraction equilibrium for all five phenols was reached in 40 min.
3.6.3. Stirring Speed
Diffusion of the analytes through the sample matrix increases mass transfer rate to the extraction phase, reduces the time required for reaching extraction equilibrium, and augments the extraction kinetics [
50,
51]. Diffusion of the analytes can be increased in a number of ways including sonication, heating the sample matrix, and stirring [
52,
53]. In the current study, different stirring speeds (0–1100 rpm) were studied to determine the impact of stirring on extraction sensitivity. Extraction sensitivity of all 5 analytes was increased with higher stirring speed. Based on the results obtained, a stirring speed of 1100 rpm was selected as optimum.
3.6.4. Effect of Salt Content
Adding salt to the sample matrix generally decreases the solubility of organic analytes in water and thus results in higher extraction efficiency. On the other hand, the presence of salt in the sample matrix increases the viscosity of the solution and consequently reduces the rate of diffusion of the analytes. Since both factors counter-balance each other, experimental determination of the impact of salt addition is recommended [
53]. The influence of salt was studied by adding different amounts of sodium chloride ranging from 0–20% (
w/
v) to the sample. Addition of salt in substituted phenols solution generally increased sensitivity up to 15% NaCl (
w/
v) (
Figure 9). Therefore, NaCl concentration at 15% (
w/
v) is considered optimum for extracting substituted phenols from aqueous solutions.
3.6.5. Optimization of Elution Solvent, Volume of Solvent, and Elution Time
Due to the polarity differences among all the substituted phenols (logKow 2.4–3.8), all back-extraction solvents may not be equally effective for quantitative solvent mediated desorption. Considering the high to medium polarity of the substituted phenols, 500 μL of methanol (MeOH) (relative polarity 0.762), acetonitrile (ACN) (relative polarity 0.46) or methanol-acetonitrile mixture (MeOH: ACN) (50:50 v/v) were used for elution/back-extraction of substituted phenols from FPSE media. MeOH was found better than MeOH: ACN mixture and ACN for back-extraction of 4-chlorophenol, while MeOH: ACN mixture performed better than MeOH or ACN for back-extraction of 2,6-dichlorophenol. The trend changes with the polarity of the analyte relative to the back-extraction solvents. The back-extraction of high polarity compound 4-chlorophenol (logKow 2.4) was favored by highest polarity solvent MeOH. 2,6-dichlorophenol (logKow 2.7), being relatively less polar, was better extracted by MeOH:ACN. However, other substituted phenols did not show preference for any specific solvents. Because the MeOH:ACN mixture provided better reproducibility in solvent back-extraction, it was considered optimum and was used as the back-extraction solvent in all subsequent experiments.
Due to the ultra-thin coating of sol–gel sorbent as well as well-preserved pores in the fabric substrate, it was expected that low viscosity organic solvent would easily penetrate the sorbent to quantitatively desorb the extracted analytes back very fast. Two desorption times, 5 min and 10 min, were investigated with the MeOH:ACN (50:50 v/v) mixture. No discernible difference in extraction sensitivity was observed between 5 min and 10 min desorption. Therefore, a 5 min back extraction was accepted as the optimum desorption time.
These experiments showed that 500 μL of the ACN: MeOH mixture is the minimum volume needed for complete immersion of the 5 cm2 FPSE unit and quantitative desorption of analytes without any carry over problem. The ultra-thin coating of highly porous sol–gel sorbent is easily accessible to organic solvent without any external stimuli (e.g., stirring, sonication), resulting in complete desorption within a very short period of time. A low volume of back-extraction solvent maintains the preconcentration achieved from the extraction, and therefore, reduces the time required for typically laborious and time consuming solvent elution and sample reconstitution steps.
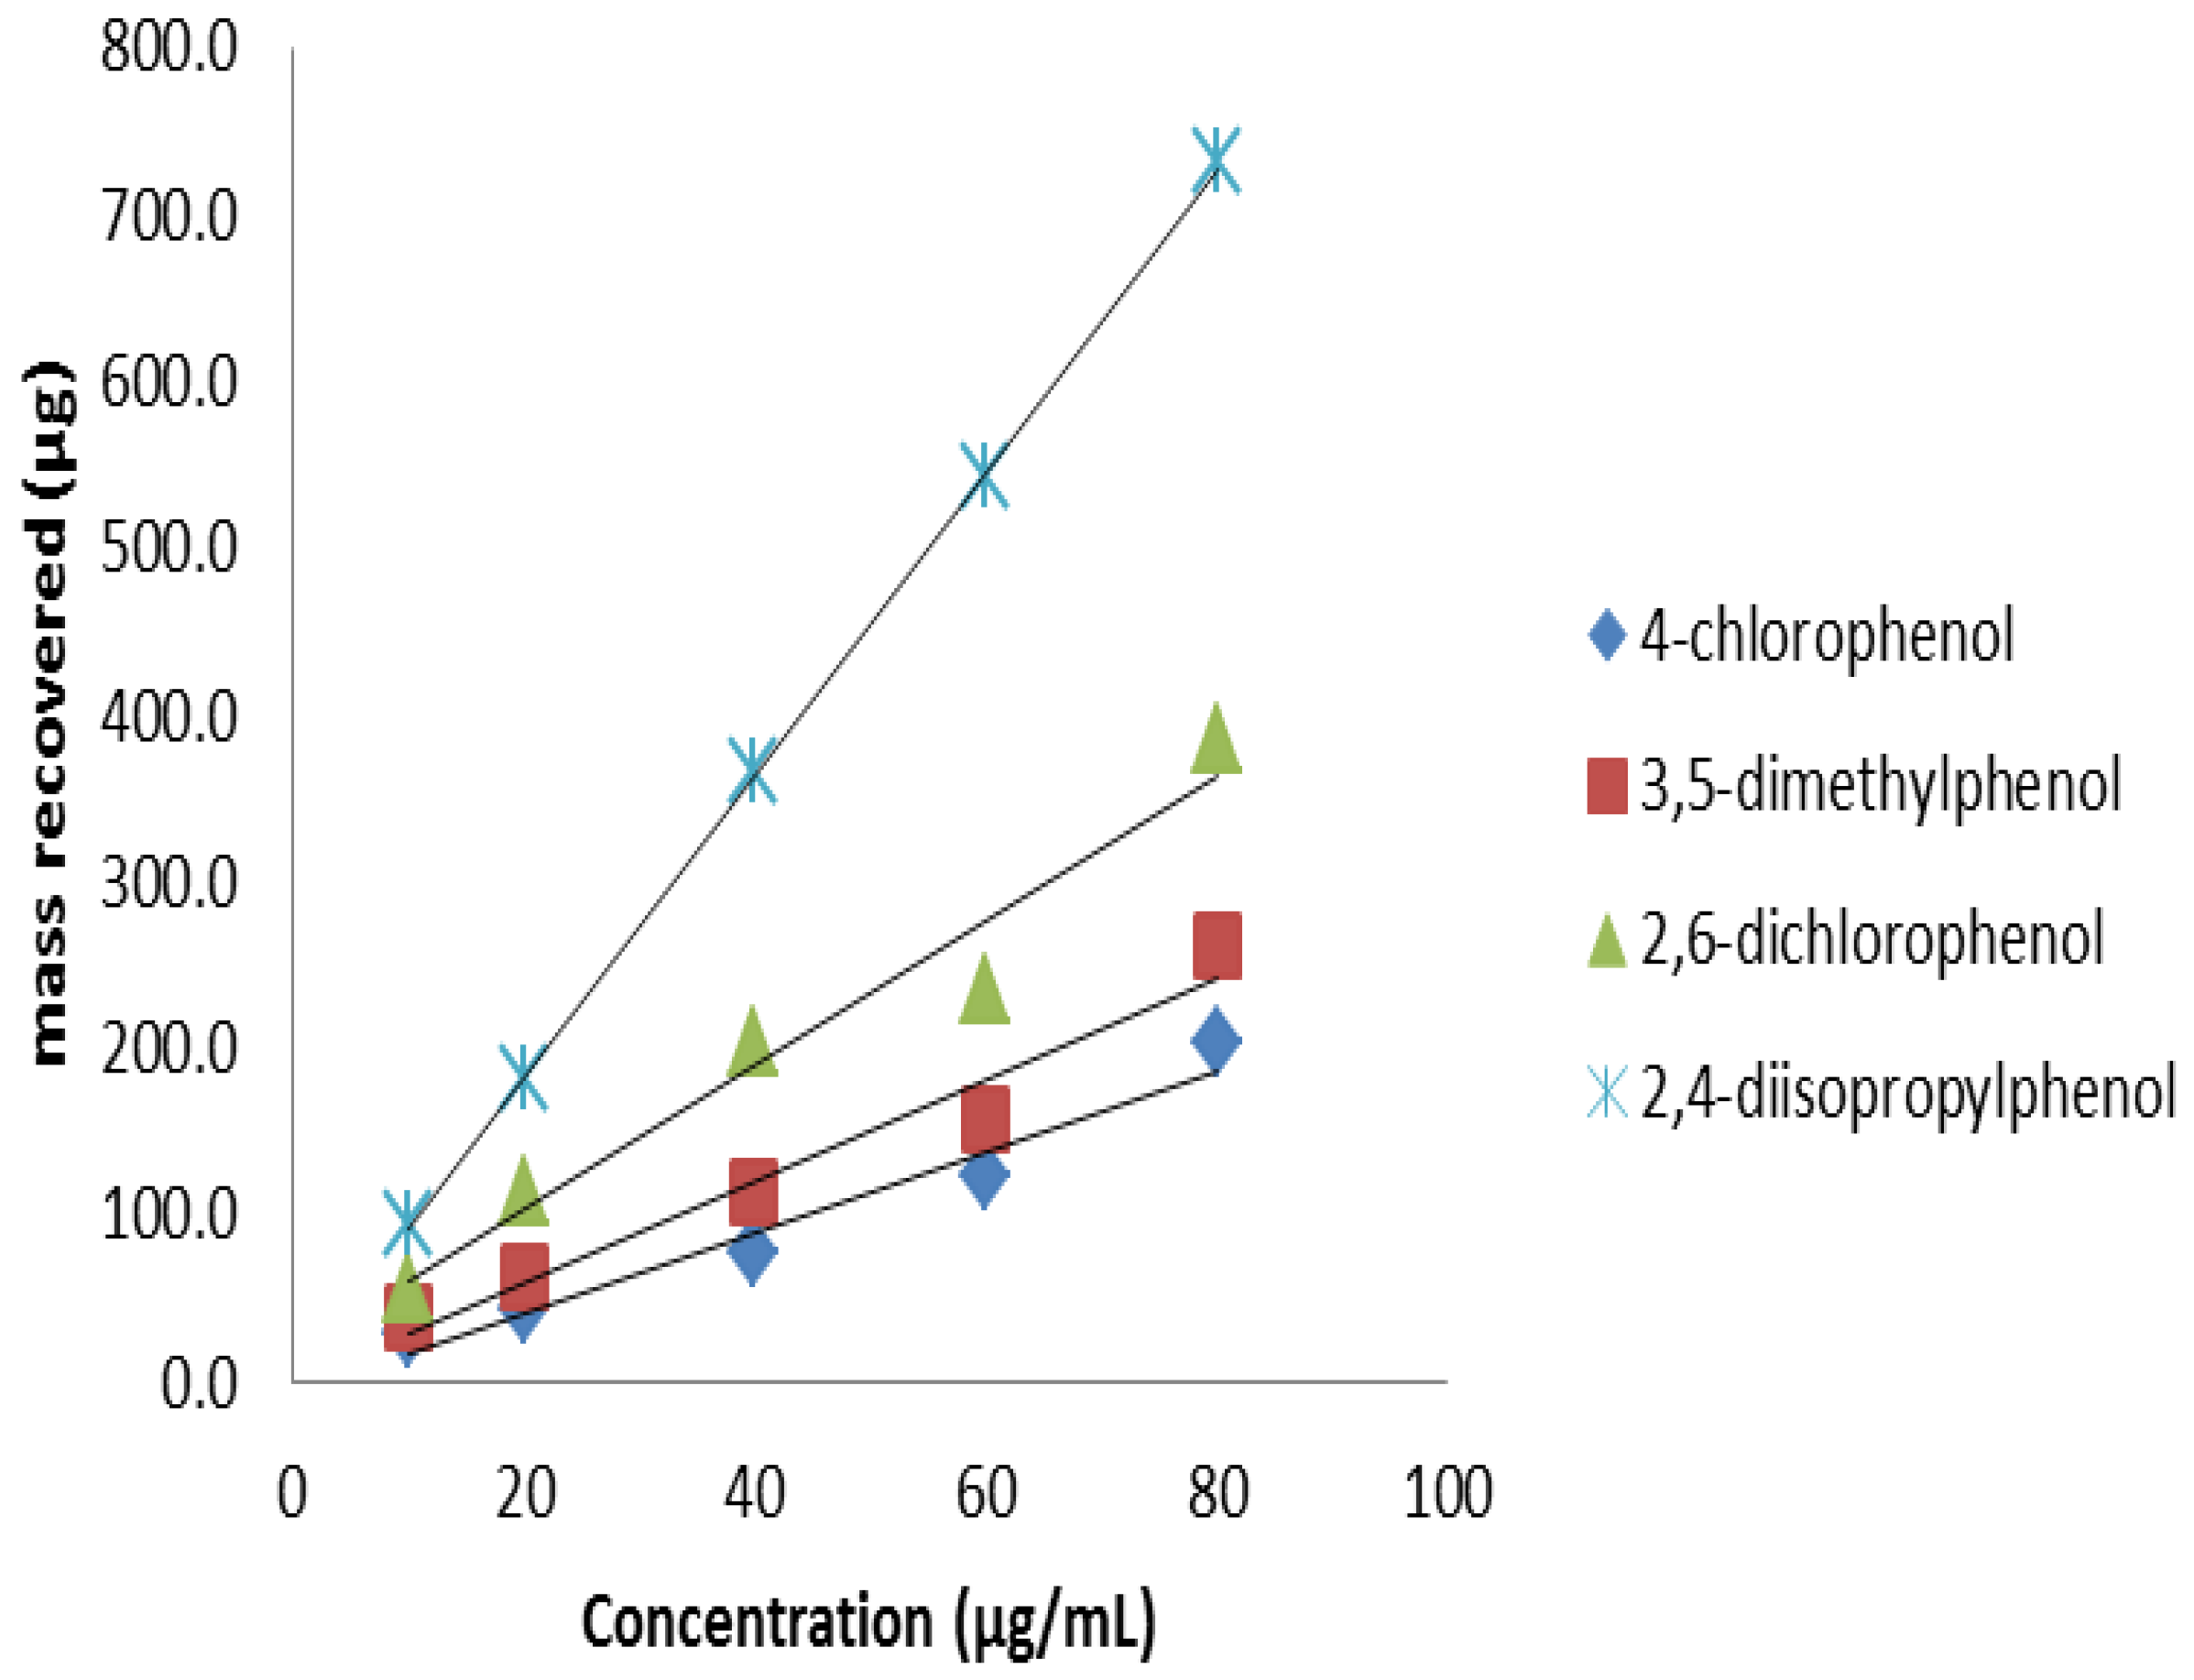
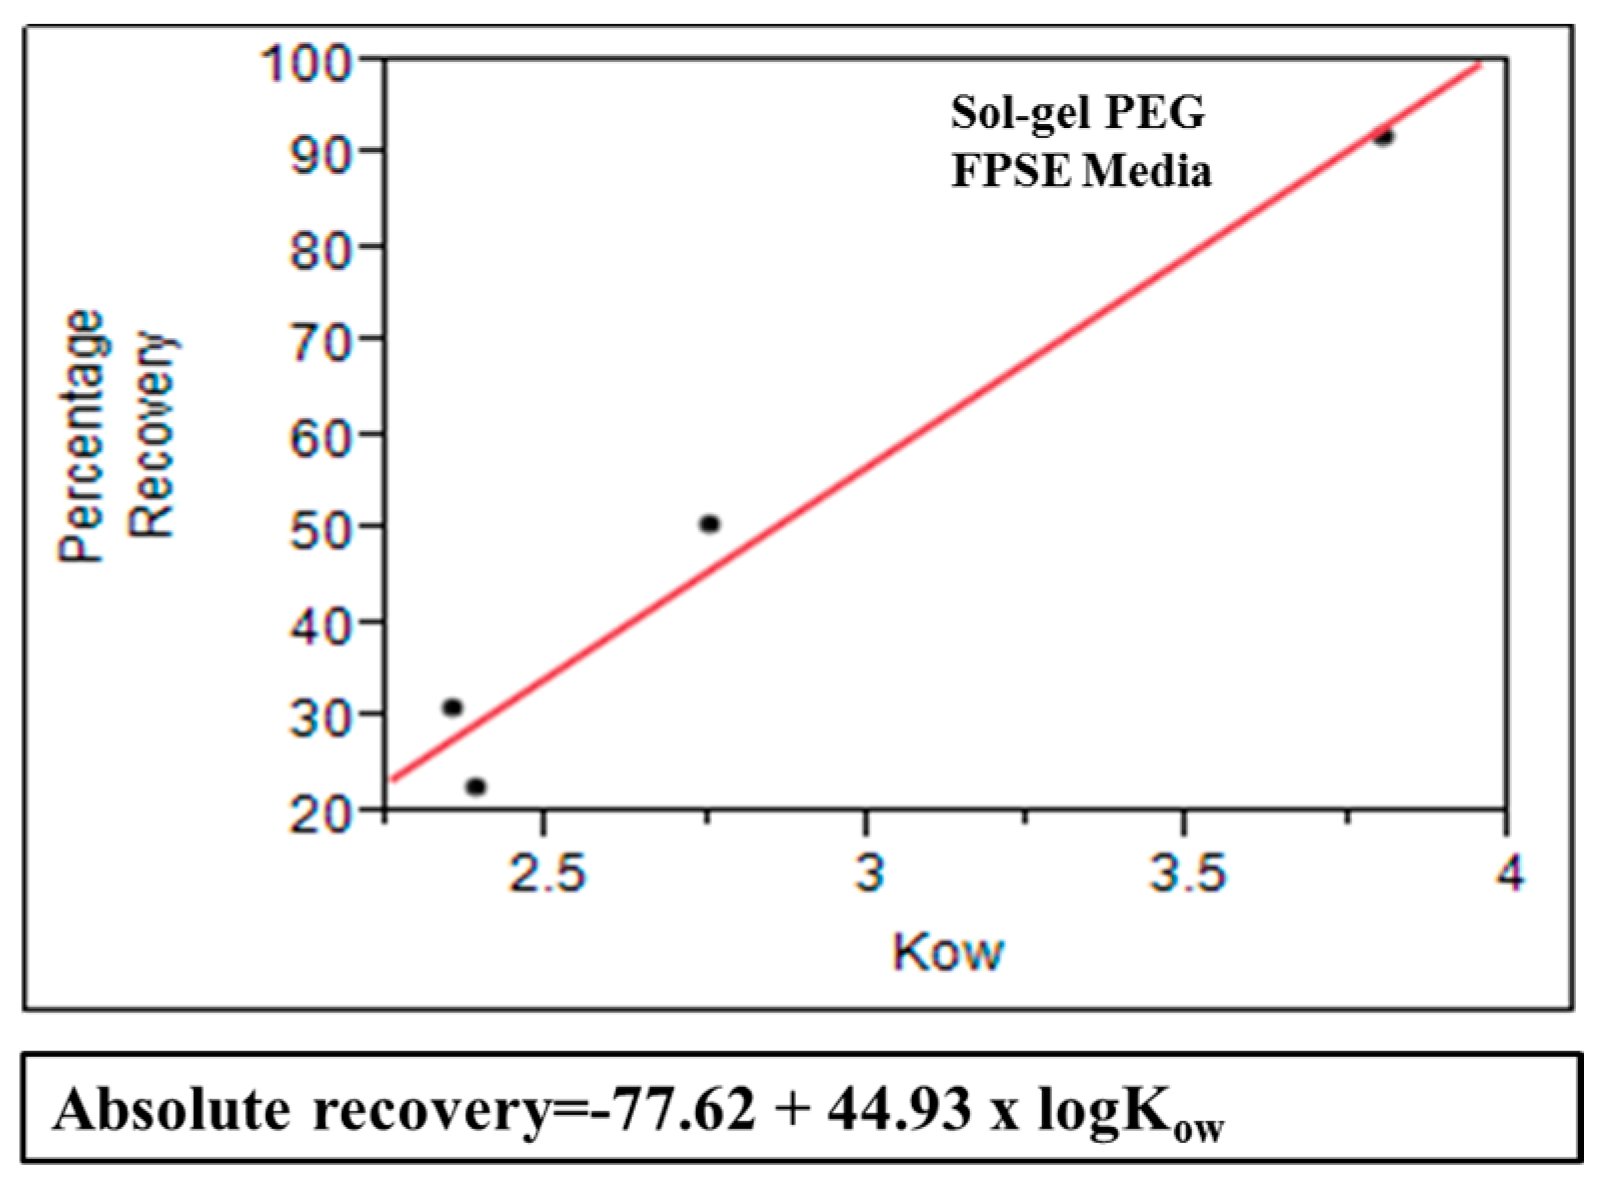
3.7. Model Correlating Octanol-Water Coefficient and Absolute Recovery in FPSE
Mathematical model was created for sol–gel PEG coated FPSE media that can be used as a predictive tool to estimate approximate absolute recovery of a given compound on the specific FPSE media using its octanol-water coefficient value. In order to develop this model, a series of substituted phenol solutions (10 ppm, 20 ppm, 40 ppm, 60 ppm, and 80 ppm) were prepared in DI water. For each compound, a calibration curve was developed using concentration and corresponding chromatographic peak area. All samples were analyzed in HPLC-UV before and after the fabric phase sorptive extraction in triplicate. The single and average absolute recovery of individual compounds across the concentration range was calculated. The average for an individual compound was plotted against its log
Kow value. Based on the data, absolute recovery of any analyte in sol-gel PEG can be calculated using its log
Kow value into the following equation:
Figure 10 shows that substituted phenols demonstrates excellent linear relationship between average absolute recovery and logarithm of octanol-water coefficient. This graphs can be used as a predictive tool to estimate absolute recovery of a compound using its log
Kow value and may assist in selecting the appropriate FPSE media suitable for a particular analytical problem.
3.8. Analyte Sorption Capacity of FPSE Media
As seen in
Section 3.5.2, FPSE media contained high volume of sorbents. This high sorbent loading should be translated into high sample loading capacity. In order to establish the maximum amount of analytes FPSE media can retain, the FPSE media were exposed to a series of increasingly higher concentration of analytes. An aliquot of each solution was injected before and after the extraction. Extraction of phenols up to 80 ppm (
Figure 11) without competing against each other. As such, a 5 cm
2 unit of sol–gel PEG coated FPSE media was able to retain approximately 2000 μg of phenols (combined), which is about 10% of the sorbent loading. This high sample capacity may open up a new application of FPSE media as a scavenger of environmental pollutants.
3.9. Operational Stability of Sol–gel Coated FPSE Media
Exposing FPSE media to different organic solvents for solvent mediated desorption is an integral part of the FPSE process if analytes are to be transferred to a suitable organic solvent for subsequent analysis. Unlike commercially available SPME fibers, due to the strong chemical bonding between the sorbent and the substrate of FPSE media, they can be exposed to any organic solvent. To verify that, a set of 3 FPSE media were used to extract phenols before and after exposing to acetone, methylene chloride, and acetone: methylene chloride (50:50 v/v) (for 8 h at room temperature). No significant changes were observed between the extraction sensitivity before and after the treatments.
Adjusting the pH of the sample matrix to maximize the ionizable analytes is a common practice routinely used by analytical chemists. The chemical stability of FPSE media were evaluated at both acidic (pH 1) and basic (pH 12) environment. Extractions were performed in triplicate before and after an 8 h exposure to an acidic or basic environment. Extraction sensitivity was similar for all fabrics before and after the acid/base treatment. Although both silica-based sorbent and cellulose substrate are vulnerable to highly acidic/basic environments, these experiment suggests that short exposure of FPSE media to highly acidic and basic environment does not have an impact on their performances. Thus, FPSE media coated with sol–gel PEG sorbents have demonstrated remarkable operational stability.
3.10. Analytical Performance
The analytical parameters including linear range, correlation coefficient (
r2), intra-day and inter-day repeatability, and limit of detection of substituted phenols were investigated under the optimized extraction conditions and are presented in
Table 1 (sample volume 10 mL, stirring speed 1100 rpm, salt content 15%, extraction time 40 min, desorption time 5 min, and desorption solvent MeOH: ACN (50/50
v/
v).
As can be seen in
Table 1, the FPSE-HPLC-UV method demonstrates a wide linear range for all the tested analytes with correlation coefficients of
r2 > 0.99. The repeatability (%RSD) of substituted phenols at 50 ppb level concentration within a day were between 1.3 and 5.1, whereas, the between days repeatability were found to be between 0.5–26.0. As such, the method can be conveniently used in routine environmental monitoring laboratories.
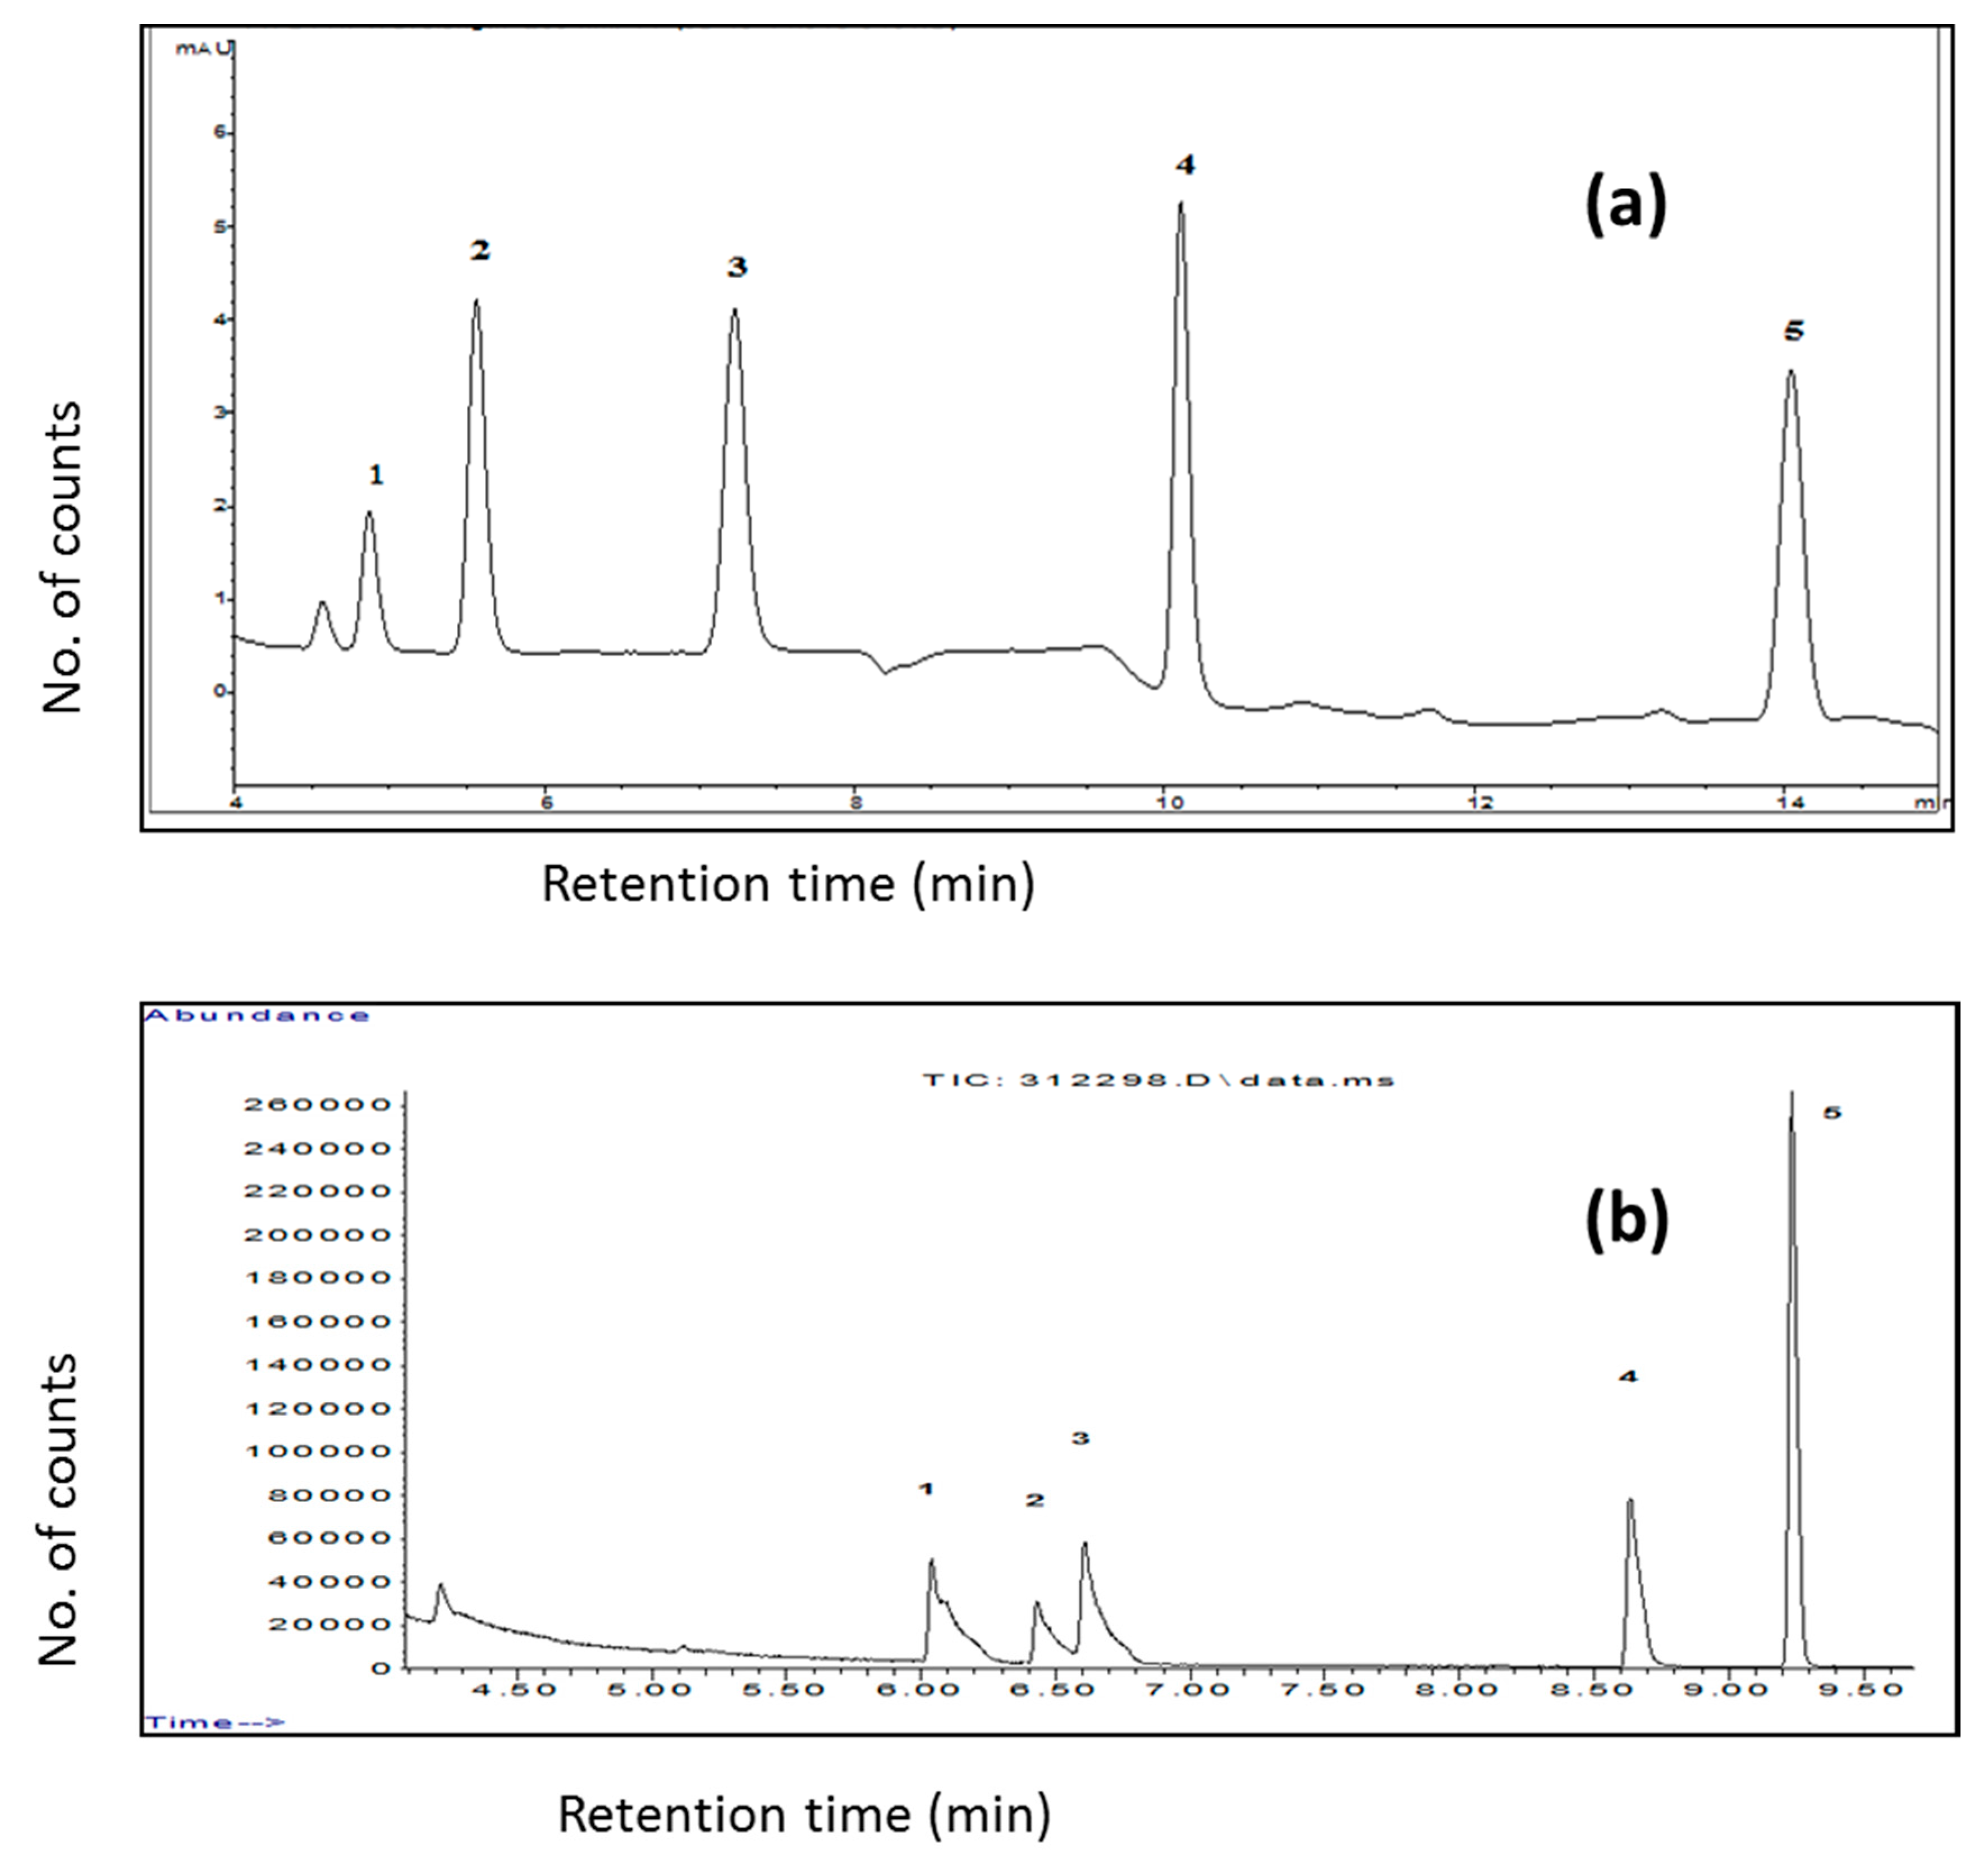
3.11. Analysis of Prepared Sample Using Multiple Analytical Systems
As different chromatographic systems have different advantages, e.g., GC favors the analysis of highly volatile, low molecular weight compounds, whereas the HPLC is suitable for medium to high molecular weight compounds. In some cases, the whole ranges of analytes are of interest. Samples are prepared differently for both the system which inflicts additional burden to the analyst. FPSE has ingeniously solved this problem. Selection of a solvent equally compatible to both the GC and HPLC as the FPSE back-extraction solution and injection of the eluent simultaneously into the GC and HPLC may offer complimentary information that cannot be obtained from either of the systems alone.
Figure 12 presents GC and HPLC chromatograms obtained from analyzing the same sample prepared by FPSE.
3.12. Method Comparison
A literature review of selected methods used for the determination of substituted phenols is presented in
Table 2. As evident from the
Table 2, the new FPSE method has unequivocally demonstrated superior extraction sensitivity, higher pre-concentration factor, precision and simplicity. Considering only a fraction of the eluent was injected for analysis, the sensitivity of FPSE method can be easily increased even further by evaporating 500 μL sample solution to dryness and reconstituting the sample in a smaller volume of organic solvent or by increasing injection volume.
3.13. Applications of the FPSE-HPLC-UV Methods for Environmental Sample Analysis
The optimized FPSE-HPLC-UV methods for substituted phenols were applied for the determination of these compounds in tap water, pond water and reclaimed water released from a sewerage treatment plant. The pond water and reclaimed water samples were visibly cloudy with high content of suspended soil particles and biomass. However, no filtration or other clean-up procedure was applied to these samples prior to FPSE procedure. Extraction recoveries of sol–gel PEG coated FPSE media were calculated by comparing the extraction efficiency obtained by extracting spiked environmental blank samples with 50 μg/L of substituted phenols compounds to that of the deionized water at the same concentration. The relative percentage recovery data of substituted phenols are shown in
Table 3.
The percentage recovery of substituted phenols in tap water, pond water, and reclaimed water were in the range of 19.7–91.0, 21.9–109.5, and 40.7–106.8, respectively. The probable cause of the low recovery of substituted phenols in environmental water may be attributed to the formation of complexes with numerous treatment chemicals and/or particulates. A holistic investigation is needed to understand the real cause behind the low recovery of substituted phenols from environmental water samples.
4. Conclusions
The theory and working principle of FPSE that candidly explains the uniquely superior performance of the new and emerging microextraction system have been presented. In a very short period of time, FPSE has found applications in a wide variety of sample matrices including pharmaceutical, environmental, food, biological, and toxicological samples. In all these applications, FPSE has established itself as an efficient, green, new-generation sample preparation technique. Unique integration of the sol–gel coating technology into highly porous fabric substrate resulted in an efficient sample preparation device capable of extracting target analytes from complex environmental samples with high efficiency. Strong chemical bonding between the sol–gel extraction sorbents and the host substrates provide excellent solvent and chemical stability to FPSE device. As a result, utilization of a back-extraction solvent equally compatible with both gas chromatography and liquid chromatography opens up the possibility of analyzing the same preconcentrated sample simultaneously in GC and LC to obtain complimentary information, if necessary. High chemical stability of FPSE media extends the ability of matrix pH adjustment between pH 1 to pH 12 that is often important to efficiently extract ionizable compounds (organic acids/bases) from an aqueous solution. High sorbent loading in FPSE media provided very high sample capacity. The inherently porous structure of the sol–gel sorbent and the permeability of fabric have significantly reduced the equilibrium extraction time from hours to minutes, making FPSE an excellent field-deployable sample preparation technique.
Parts per trillion level detection sensitivities were achieved for substituted phenols. Eliminating the necessity of sample clean-up prior to the extraction, FPSE presents a new possibility in analyzing complex samples such as environmental water, biological fluids, foods, and pharmaceuticals with high matrix interference leading to high quality analytical data that truly represents the sample of interest.


