Method Development of Phosphorus and Boron Determination in Fertilizers by ICP-AES


Abstract
:
1. Introduction
2. Experimental
2.1. Instrumentation
2.2. Reagents and Solutions
2.3. Fertilizer Samples
2.4. Preparation of Working Standard Solutions
2.5. Acid Digestion of Samples
3. Results and Discussion
3.1. Regression Analysis
3.2. Repeatability, Detectability and Recovery of Method
4. Application of the Method to Fertilizers Samples
5. Conclusions
Author Contributions
Funding
Conflicts of Interest
References
- Borges, A.R.; Becker, E.M.; Lequeux, C.; Vale, M.G.R.; Ferreira, S.L.C.; Welz, B. Method development for the determination of cadmium in fertilizers samples using high-resolution continuum source graphite furnace atomic absorption spectrometry and slurry sampling. Spectrochim. Acta B 2011, 66, 529–535. [Google Scholar] [CrossRef]
- Kane, P.F.; Hall, W.L., Jr. Determination of arsenic, cadmium, cobalt, chromium, lead, molybdenum, nickel, and selenium in fertilizers by microwave digestion and inductively coupled plasma-optical emission spectrometry detection: Collaborative study. J. AOAC Int. 2006, 89, 1447–1466. [Google Scholar] [PubMed]
- Soil Science Society of America. Glossary of Soil Science Terms. 2008. Available online: https://www.soils.org/publications/soils-glossary (accessed on 20 April 2018).
- Das, S.; Adhya, T.K. Effect of combine of inorganic manure and inorganic fertilizer on methane and nitrous oxide emissions from a tropical flooded soil planted to rice. Geoderma 2014, 213, 185–192. [Google Scholar] [CrossRef]
- Zhao, X.; Wang, D. Mercury in some chemical fertilizers and the effect of calcium superphosphate on mercury uptake by corn seedlings (Zea mays L.). J. Environ. Sci. 2010, 22, 1184–1188. [Google Scholar] [CrossRef]
- De Morais, C.P.; Barros, A.I.; Santos, J.D.; Ribeiro, C.A.; Crespi, M.S.; Sanesi, G.S.; Neto, J.A.G.; Ferreira, E.C. Calcium determination in biochar-based fertilizers by laser-induced. Microchem. J. 2007, 134, 370–373. [Google Scholar] [CrossRef]
- De Oliveira Souza, S.; Froncois, L.L.; Borges, A.R.; Vale, M.G.R.; Araujo, R.G.O. Determination of copper and mercury in phosphate fertilizers employing direct solid sampling analysis and high resolution continuum source graphite furnace atomic absorption spectrometry. Spectrochim. Acta Part B At. Spectrosc. 2015, 114, 58–64. [Google Scholar] [CrossRef]
- Borges, A.R.; Francois, L.L.; Becker, E.M.; Vale, M.G.R.; Welz, B. Method development for the determination of chromium and thallium in fertilizers samples using graphite furnace atomic absorption spectrometry and direct solid samples analysis. Microchem. J. 2015, 119, 169–175. [Google Scholar] [CrossRef]
- Bechlin, M.A.; Fortunato, F.M.; de Silva, R.M.; Ferreira, E.C.; Neto, J.A.G. A simple and fast method for assessment of the nitrogen-phosphorus-potassium rating of fertilizers using high-resolution continuum source atomic and molecular absorption spectrometry. Spectrochim. Acta Part B At. Spectrosc. 2014, 101, 240–244. [Google Scholar] [CrossRef]
- Nunes, L.C.; Gustinelli, C.; de Carvallo, A.; Santos, J.D.; Krug, F.J. Determination of Cd, Cr and Pb in phosphate fertilizers by laser- induced breakdown spectroscopy. Spectrochim. Acta Part B At. Spectrosc. 2014, 97, 42–48. [Google Scholar] [CrossRef]
- Nicolodelli, G.; Senesi, G.S.; Perazzoli, I.L.O.; Marangoni, B.S.; Benites, U.D.M.; Milari, D.M.B.P. Double pulse laser induced breakdown spectroscopy: A potential tool for the analysis of contaminants and macro/micronutrients in organic mineral fertilizers. Sci. Total Environ. 2016, 565, 1116–1123. [Google Scholar] [CrossRef] [PubMed]
- Resendes, L.V.; Nascentes, C.C. A simple method for the multi-elemental analysis of organic fertilizer by slurry sampling and total reflection X-ray fluorescence. Talanta 2016, 147, 485–492. [Google Scholar] [CrossRef] [PubMed]
- Nziguheba, G.; Smolders, E. Inputs of trace elements in agricultural soils via phosphate fertilizers in European countries. Sci. Total Environ. 2008, 390, 53–57. [Google Scholar] [CrossRef] [PubMed]
- Rui, Y.; Hao, J.; Rui, F. Determination of seven plant nutritional element in potassium dihydrogen phosphate fertilizers from northeastern China. J. Saudi Chem. Soc. 2012, 16, 89–90. [Google Scholar] [CrossRef]
- Santos, J.S.; Teixeira, L.S.G.; Araujo, R.G.O.; Fernandes, A.P.; Korn, M.G.A.; Ferreira, S.L.C. Optimization of the operating conditions using factorials design for determination of uranium by inductively plasma optical emission spectrometry. Microchem. J. 2011, 97, 113–117. [Google Scholar] [CrossRef]
- De Oliveira Souza, S.; de Costa, S.L.; Santos, D.M.; Pinto, J.D.S.; Garcia, C.A.B.; Alves, J.D.P.H.; Araujo, R.G.O. Simultaneous determination of macronutrients, micronutrients and trace elements in mineral fertilizers by inductively coupled plasma optical emission spectrometry. Spectrochim. Acta Part B At. Spectrosc. 2014, 96, 1–7. [Google Scholar] [CrossRef]
- Zachariadis, G. Inductively Coupled plasma atomic emission spectometry, A Model. In Multi-Elemental Technique for Modern Analytical Laboratory; Nova Science Publishers: New York, NY, USA, 2011; pp. 18–65. [Google Scholar]
- Bartos, J.M. Determination of Phosphorus and Potassium in Commercial Inorganic Fertilizers by Inductively Coupled Plasma-Optical Emission Spectrometry: Single-Laboratory Validation. J. AOAC Int. 2014, 97, 687–699. [Google Scholar] [CrossRef] [PubMed]
- Kimura, M. Testing Methods for Fertilizers; Food and Agricultural Materials Inspection Center (FAMIC): Saitama, Japan, 2016; pp. 92–111, 259–269.
- Faithfull, N.T. The analysis of fertilizers, Cp. 6. In Methods in Agricultural Chemical Analysis: A Practical Handbook; CABI Publishing: Oxon, UK, 2002; pp. 110–118. [Google Scholar]
- International Union of Pure and Applied Chemistry (IUPAC). Compendium in Chemical Terminology, Version 2014; Blackwell Scientific Publications: Oxford, UK, 1997; Available online: https://goldbook.iupac.org/html/L/L03540.html (accessed on 23 June 2018).


| Parameter | Value |
|---|---|
| RF generator | 40.68 MHz, free-running |
| RF incident power | 1350 W |
| Torch type | Fassel-type |
| Injector, id | Alumina 2.0 mm |
| Viewing mode | Axial |
| Auxiliary argon flow rate | 0.50 L min−1 |
| Nebulizer argon flow rate | 0.80 L min−1 |
| Plasma gas flow rate | 15 L min−1 |
| Spray chamber type | Scott |
| Sample uptake flow rate | 2 mL min−1 |
| Detector | Segment-array charge-coupled (SCD) |
| Element | Spectral Lines (nm) | ||
|---|---|---|---|
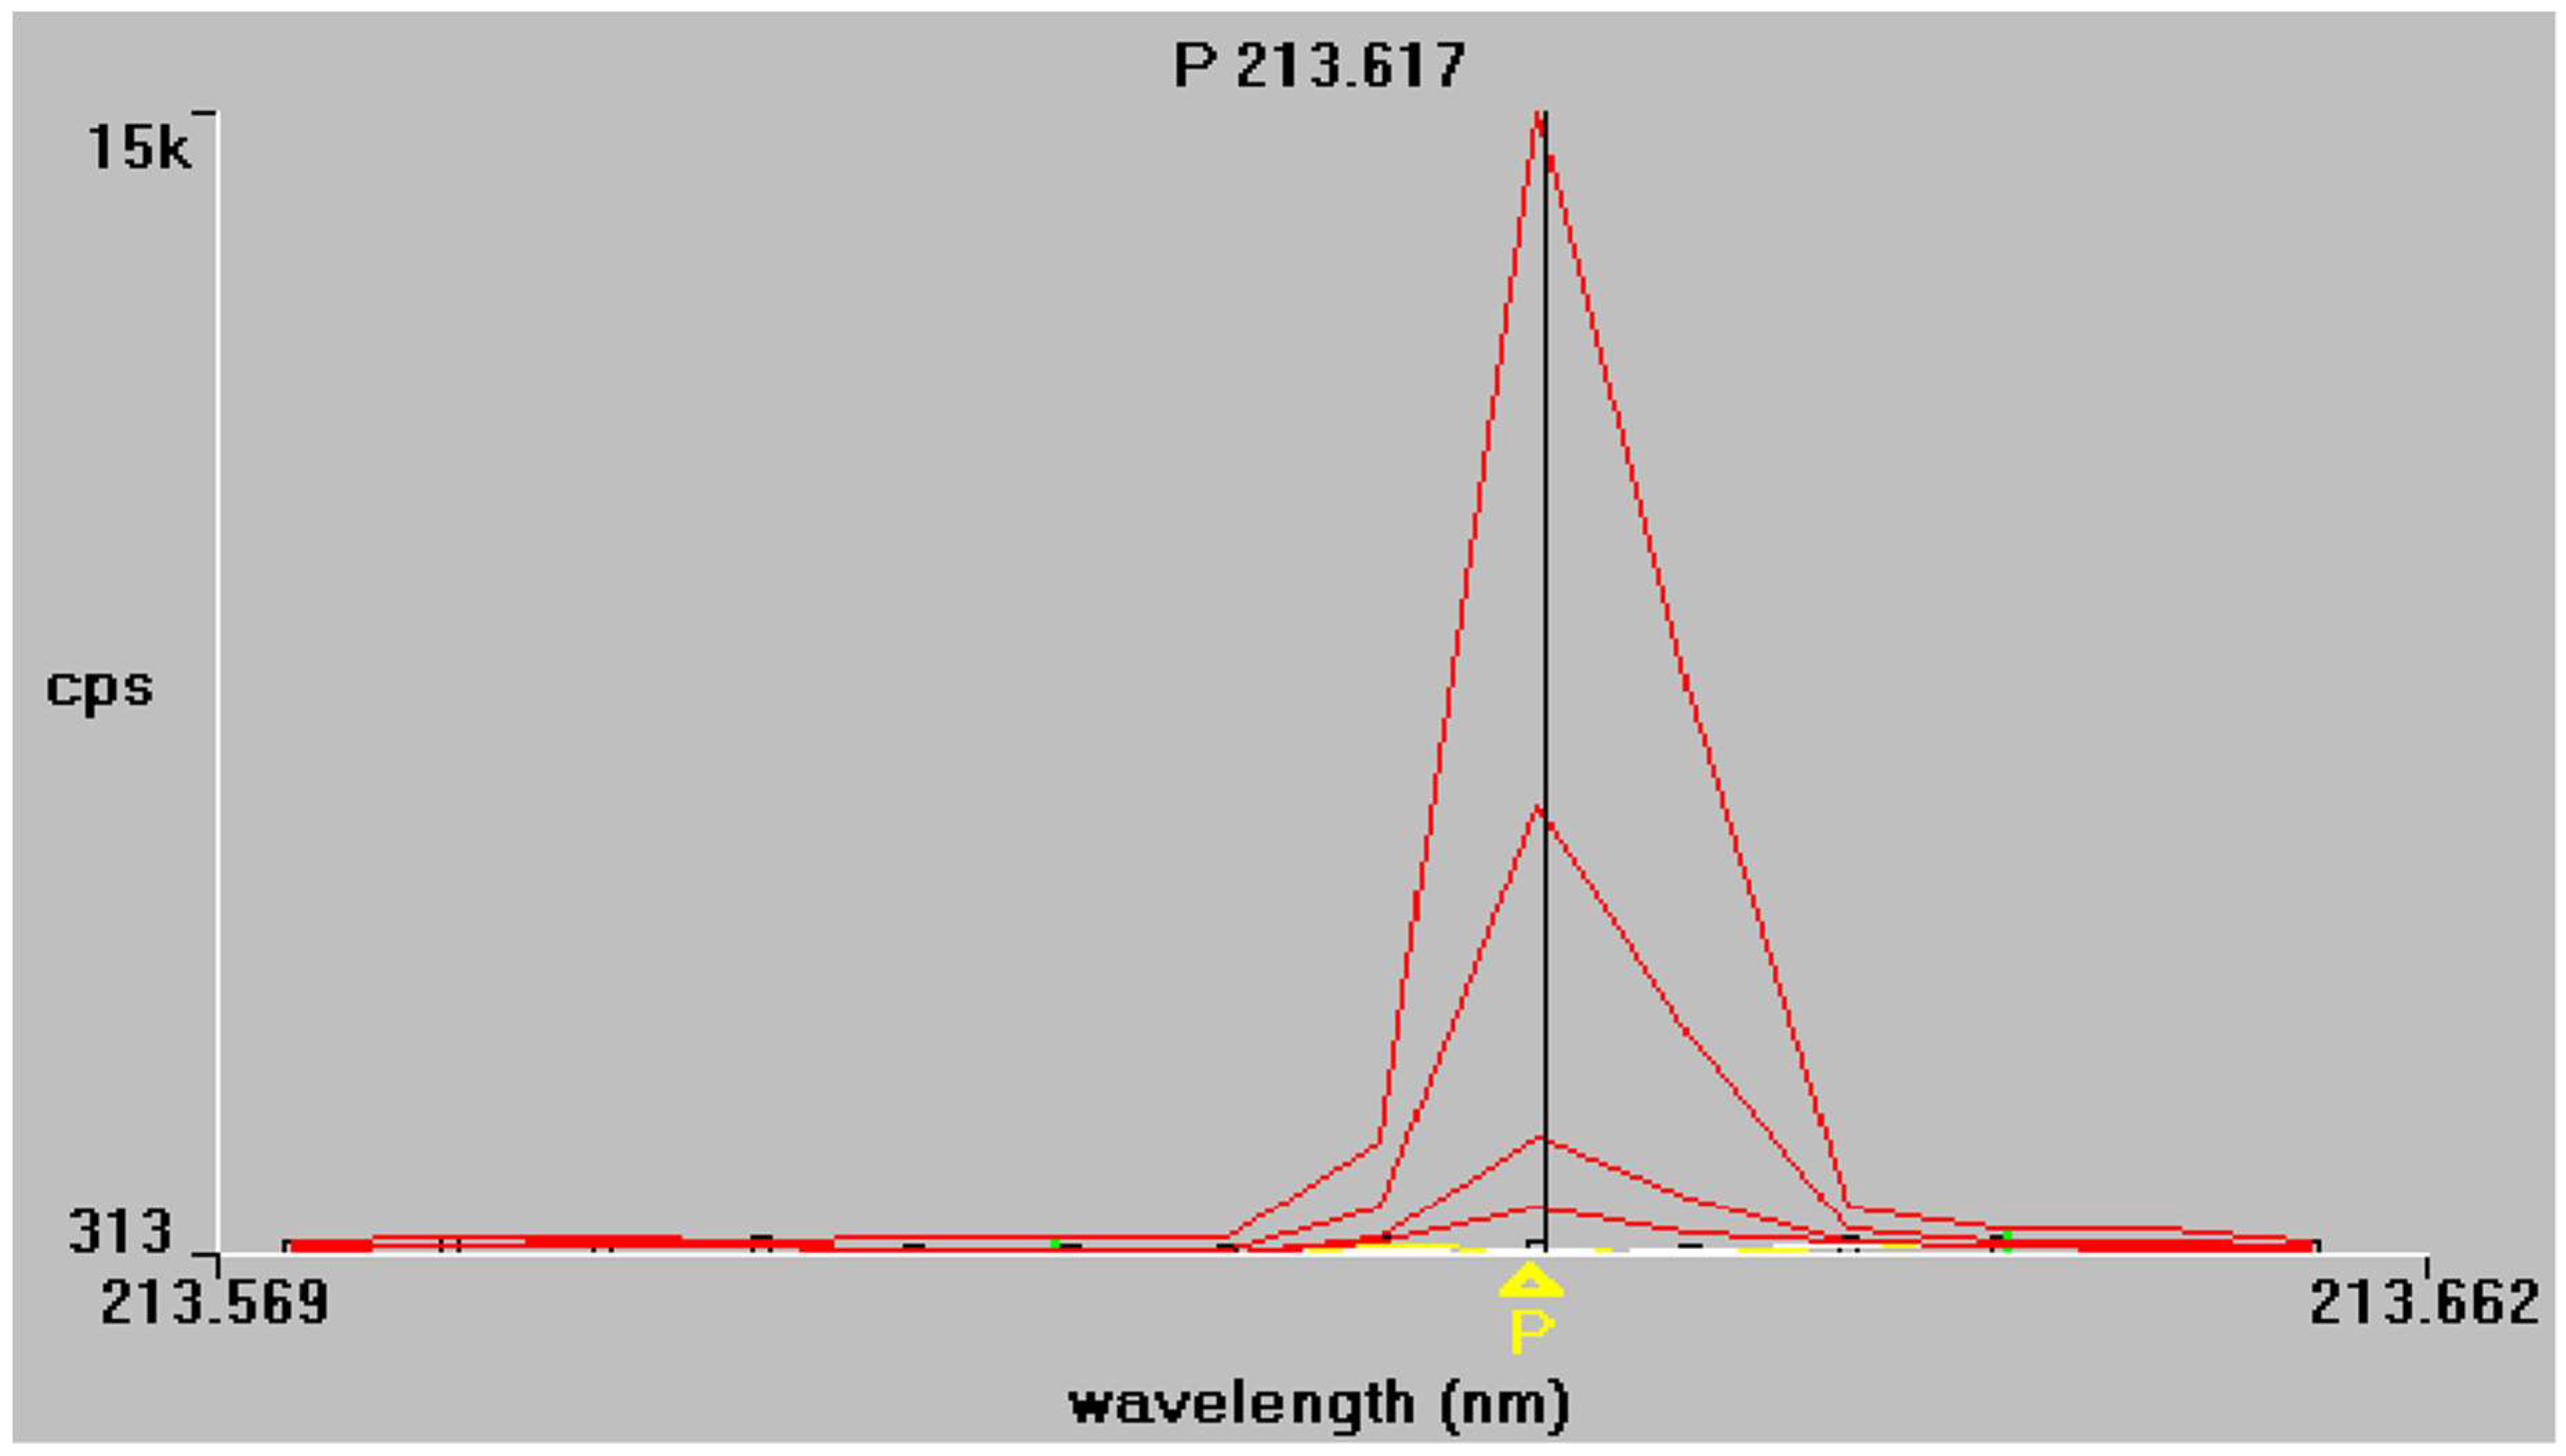
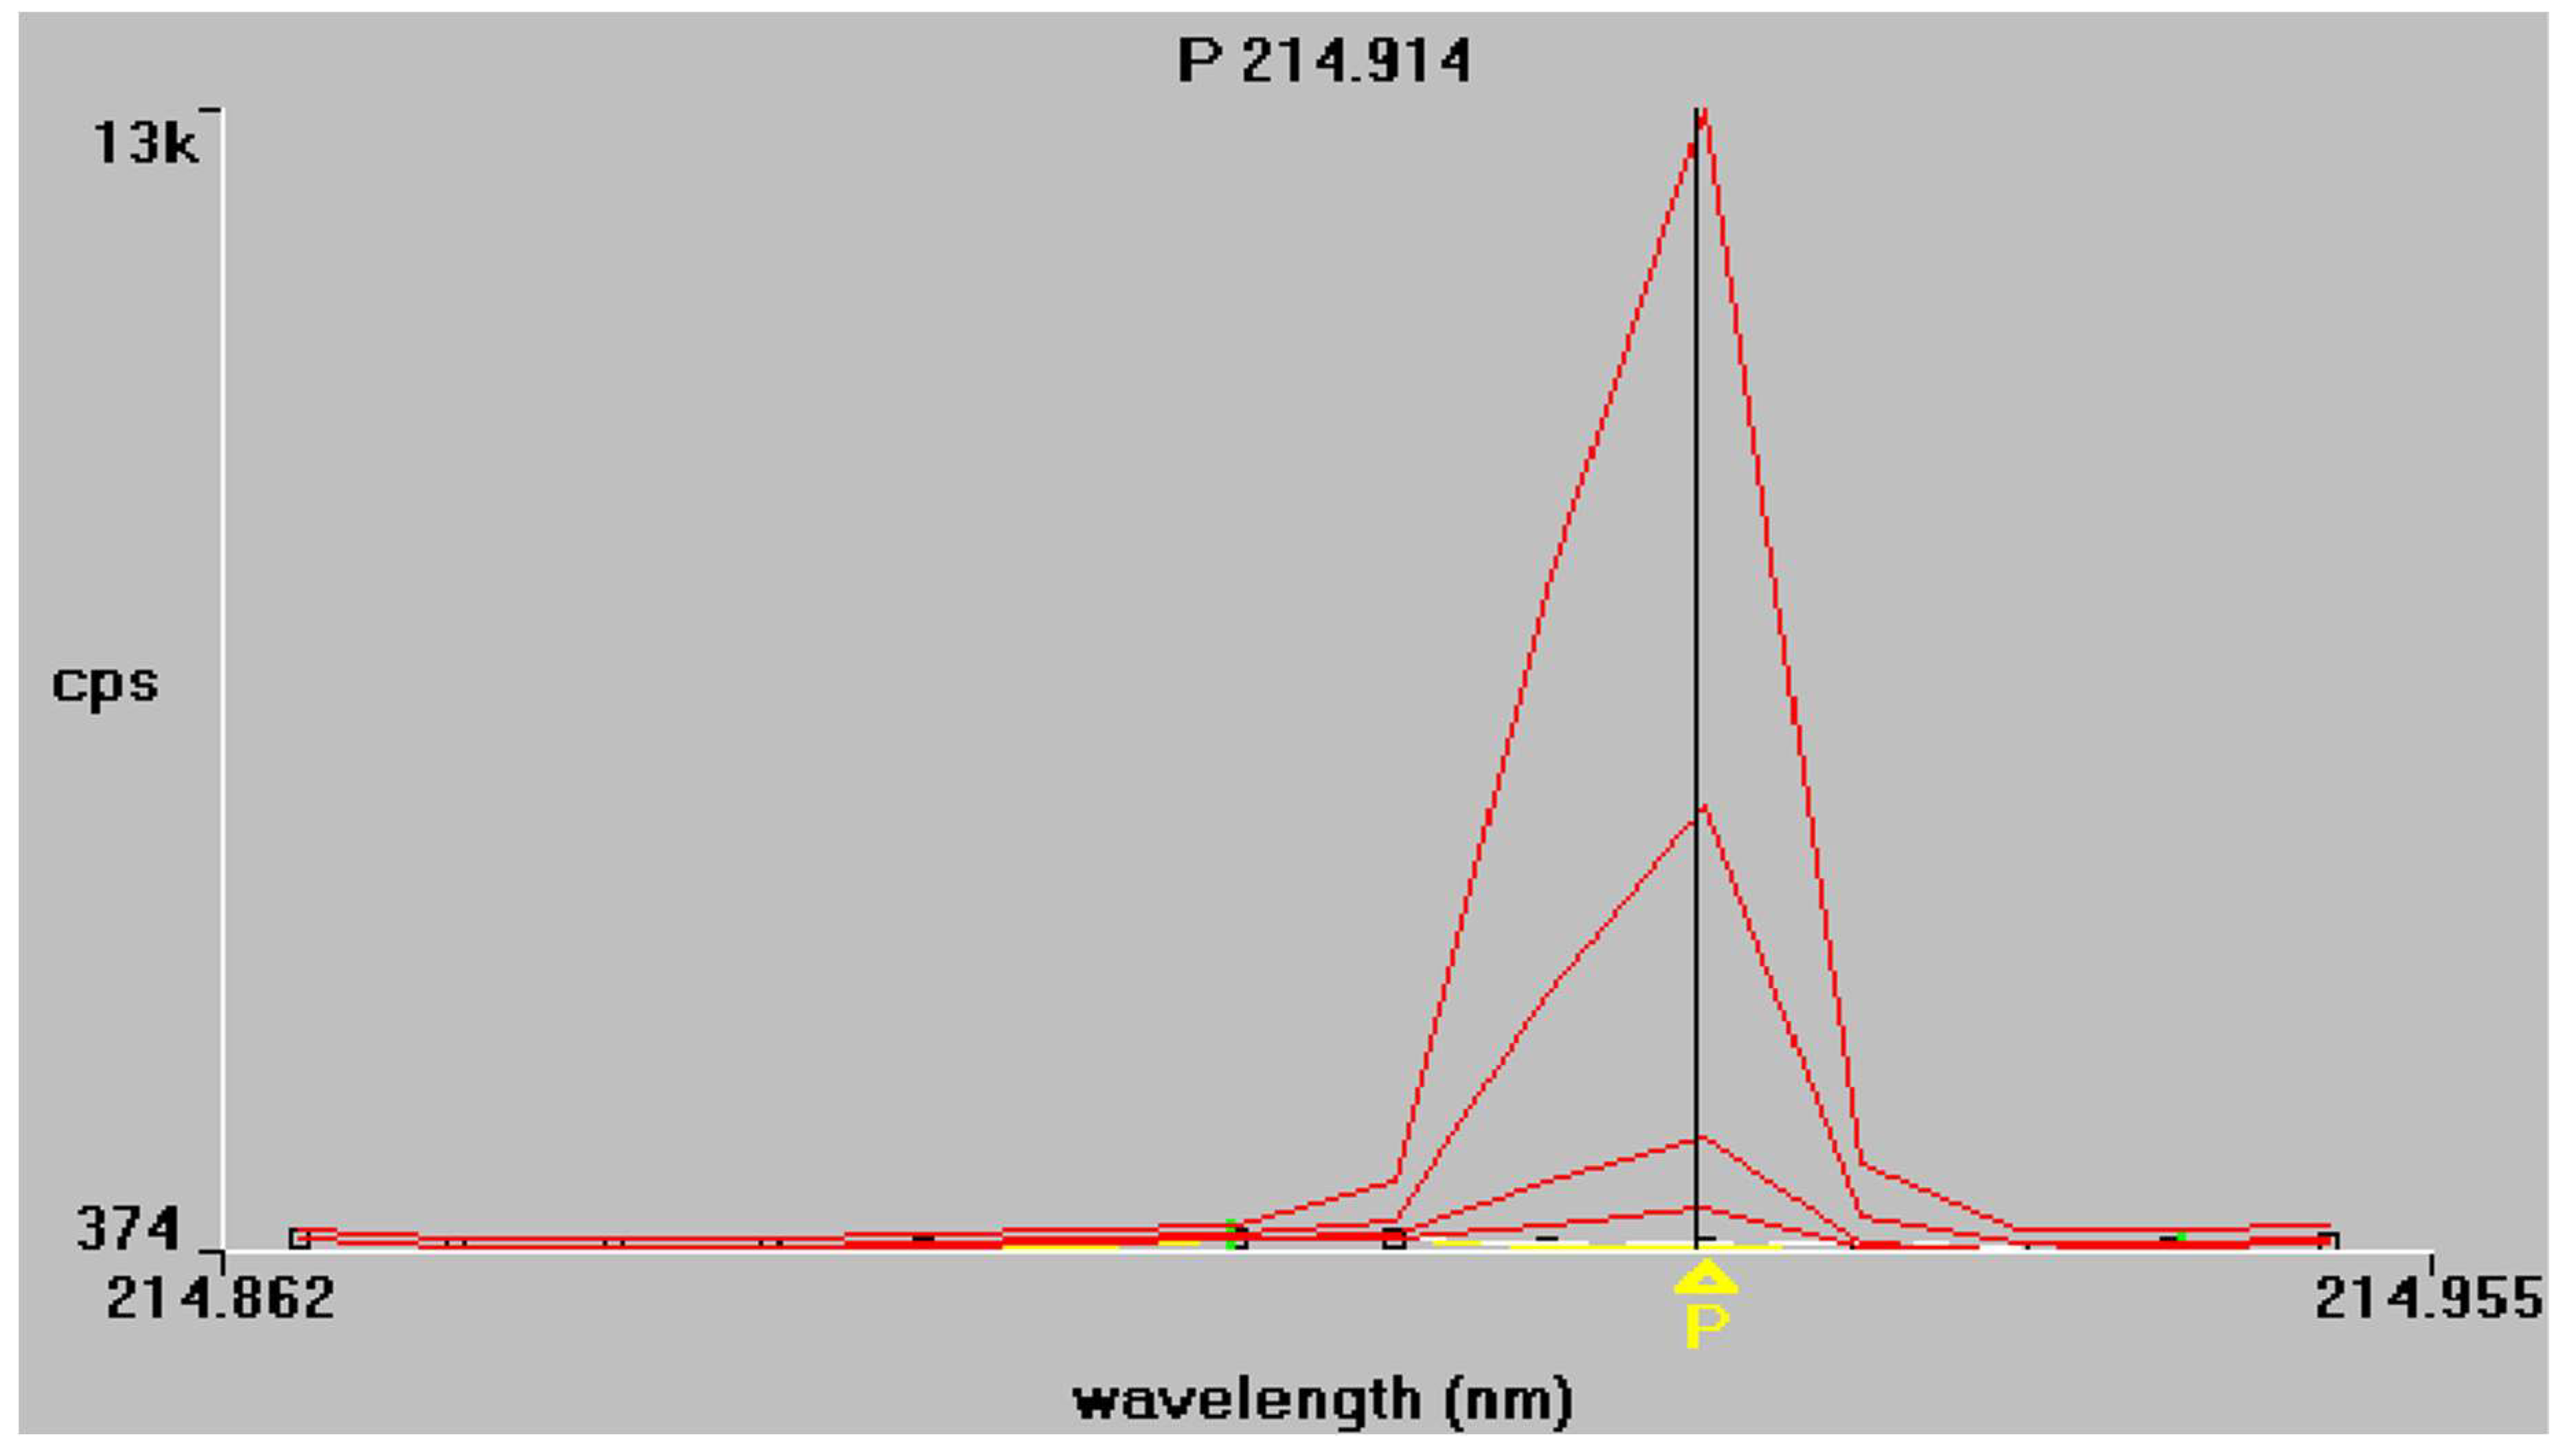
| P | 178.221 | 213.616 | 214.914 |
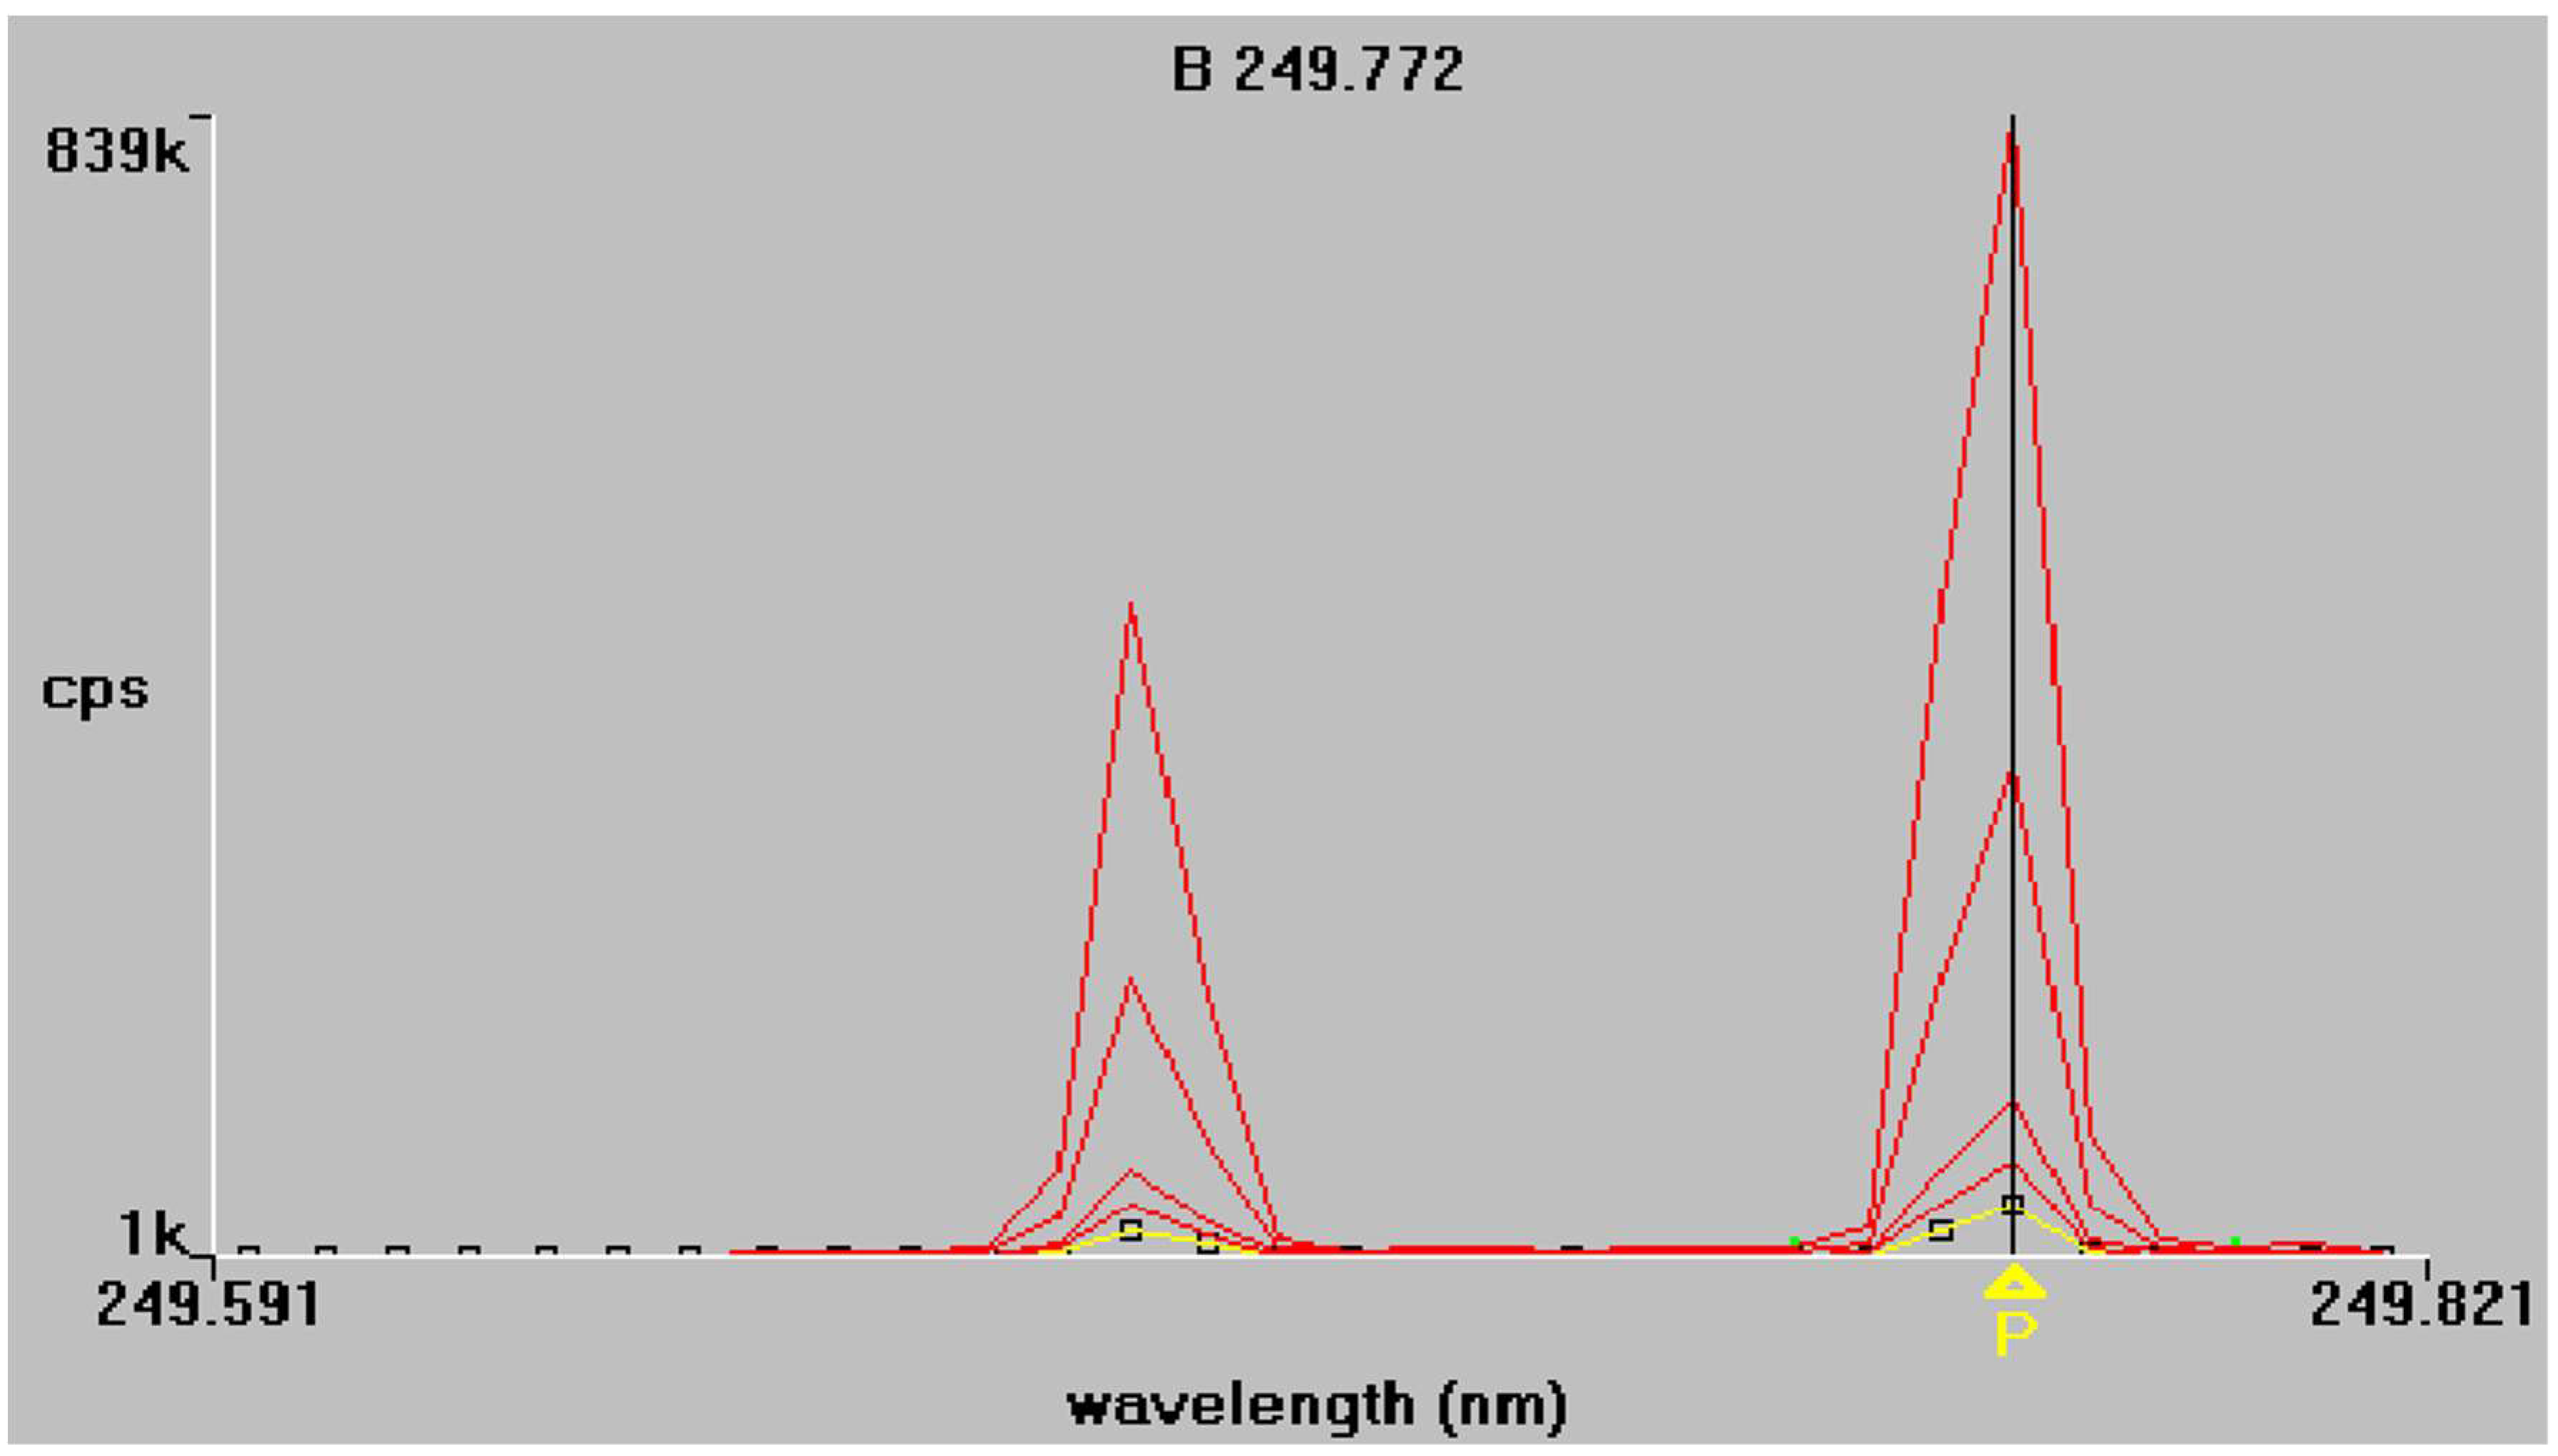
| B | 208.977 | 249.677 | 249.772 |
| Samples | Chemical Compositions | ||||||||||
|---|---|---|---|---|---|---|---|---|---|---|---|
| N % w/w | P (P2O5) % w/w | K (K2O) % w/w | Mg (MgO) % w/w | Fe mg/kg | Cu mg/kg | Mo mg/kg | B mg/kg | Mn mg/kg | Zn mg/kg | Co mg/kg | |
| 1st sample (inorganic) | 20 | 20 | 20 | 0.09 | 400 | 150 | 1 | 150 | 400 | 150 | 5 |
| 2nd sample (inorganic) | 5 | 10 | 42 | 4 | 500 | 100 | 100 | 100 | 100 | 500 | - |
| 3rd sample * (organic) | 4 | 30 | - | ||||||||
| Element | Mass Concentration g/kg | ||
|---|---|---|---|
| 1st Sample (Inorganic) | 2nd Sample (Inorganic) | 3rd Sample (Organic) | |
| P | 87 | 43 | 131 |
| B | 0.15 | 0.10 | - |
| Element | Spectral Line (nm) | Slope [cps/(mg/L)] | Standard Error | Correlation Coefficient R |
|---|---|---|---|---|
| P | 213.616 | 621 ± 19 | 61 | 0.9999 |
| 214.914 | 777 ± 38 | 123 | 0.9999 | |
| 178.221 | −0.5 ± 2 | 5 | 0.7171 | |
| B | 249.772 | 53,417 ±1644 | 5390 | 0.9999 |
| 249.677 | 19,771 ± 496 | 1627 | 0.9999 | |
| 208.977 | 5274 ± 161 | 530 | 0.9999 |
| Element | Spectral Line (nm) | RSD % | |||
|---|---|---|---|---|---|
| c = 1.00 mg/L | c = 2.50 mg/L | c = 10.0 mg/L | c = 25.0 mg/L | ||
| P | 213.616 | 14.8 | 4.9 | 0.9 | 2.3 |
| 214.914 | 17.0 | 6.2 | 1.3 | 2.9 | |
| B | 249.772 | 23.4 | 7.9 | 1.7 | 2.0 |
| 249.677 | 19.4 | 7.3 | 1.9 | 1.8 | |
| 208.977 | 18.6 | 6.5 | 1.9 | 2.2 | |
| Element | Spectral Line (nm) | LOD (mg/L) | LOD (mg/kg) | LOQ (mg/L) | LOQ (mg/kg) |
|---|---|---|---|---|---|
| P | 213.616 | 0.07 | 14 | 0.30 | 60 |
| 214.914 | 0.06 | 12 | 0.20 | 40 | |
| B | 249.772 | 0.10 | 20 | 0.50 | 100 |
| 249.677 | 0.10 | 20 | 0.40 | 80 | |
| 208.977 | 0.15 | 30 | 0.50 | 100 |
| Element | Spectral Line (nm) | LOD (mg/L) | LOD (mg/kg) | LOQ (mg/L) | LOQ (mg/kg) |
|---|---|---|---|---|---|
| P | 213.616 | 0.10 | 20 | 0.40 | 80 |
| 214.914 | 0.05 | 10 | 0.20 | 40 | |
| B | 249.772 | 0.10 | 20 | 0.40 | 80 |
| 249.677 | 0.06 | 12 | 0.20 | 40 | |
| 208.977 | 0.05 | 10 | 0.20 | 40 |
| Element | Spectral Line (nm) | Recovery R% |
|---|---|---|
| Adds: 228 g/kg P + 174 g/kg B (435 mg/L P + 0.75 mg/L B) | ||
| P | 213.616 | 97 |
| 214.914 | <88 | |
| B | 249.772 | 98 |
| 249.677 | >112 | |
| 208.977 | >112 |
| Element | Spectral Line (nm) | Concentration g/Kg | ||
|---|---|---|---|---|
| 1st Inorganic Fertilizer | 2nd Inorganic Fertilizer | 3rd Organic Fertilizer | ||
| P | 213.616 | 100 ± 40 | 34 ± 7 | 129 ± 9 |
| 214.914 | 65 ± 11 | 23 ± 5 | 101 ± 18 | |
| B | 249.772 | 0.10 ± 0.01 | 0.13 ± 0.03 | 0.12 ± 0.03 |
| 249.677 | 0.17 ± 0.01 | 0.21 ± 0.04 | 0.27 ± 0.02 | |
| 208.977 | 0.13 ± 0.01 | 0.16 ± 0.04 | 0.15 ± 0.02 | |
© 2018 by the authors. Licensee MDPI, Basel, Switzerland. This article is an open access article distributed under the terms and conditions of the Creative Commons Attribution (CC BY) license (http://creativecommons.org/licenses/by/4.0/).
Share and Cite
Viso, E.; Zachariadis, G. Method Development of Phosphorus and Boron Determination in Fertilizers by ICP-AES. Separations 2018, 5, 36. https://doi.org/10.3390/separations5030036
Viso E, Zachariadis G. Method Development of Phosphorus and Boron Determination in Fertilizers by ICP-AES. Separations. 2018; 5(3):36. https://doi.org/10.3390/separations5030036
Chicago/Turabian StyleViso, Emanouela, and George Zachariadis. 2018. "Method Development of Phosphorus and Boron Determination in Fertilizers by ICP-AES" Separations 5, no. 3: 36. https://doi.org/10.3390/separations5030036