1. Introduction
Non-steroidal anti-inflammatory drugs (NSAIDs) are acidic compounds with anti-inflammatory properties at high concentrations and several other properties at low concentrations (i.e., salicylic acid is used as anticoagulant drug) [
1]. These drugs exhibit toxicity in the upper concentration levels or after a long time of intake [
2,
3]. Some of the toxic side effects are related with gastrointestinal disorders, intestinal ulceration, aplastic anemia, myocardial infarction, cerebrovascular events, inhibition of platelet aggregation, and renal dysfunction [
4]. Especially, acetaminophen and nimesulide exhibit significant hepatotoxicity [
2,
5,
6,
7]. In addition, there are several cases of suicide attempts or crime commissions which are related with NSAIDs [
8].
There is a number of analytical methods which report NSAIDs’ determination in biological fluids, most of them related to pharmacokinetic studies or to the support of animal studies for the estimation of exposure and the investigation of potential risk after consumption [
4,
9].
There are reports of determinations of these analytes by immunoassays, Gas Chromatography-Flame Ionization Detection (GC-FID), High Performance Liquid Chromatography-UltraViolet/Diode Array Detection (HPLC-UV/DAD)/fluorimetric detector, spectrofluorimetry, thin layer chromatography-UV/fluorimetric detector, GC-MS, GC-MS/MS, capillary electrophoresis, LC-MS, and LC-MS/MS [
10,
11,
12,
13,
14]. Immunoassays suffer from low selectivity due to cross-reactions, while all other methods except LC-MS/MS include time-consuming sample pretreatment. There is a good number of published multi-analyte LC-MS/MS methods for measuring NSAIDs and their metabolites that provide sensitive and reliable concentration data from biological matrices [
5]. In particular, those methods are the most suitable for low concentrated salicylates originating from nutrition. However, GC-MS still represents an integral tool of a clinical and/or toxicological laboratory due to the fact that mass spectra databases are available aiding in the identification of unknowns, At the same time, latest instruments and materials hold the promise for better chromatographic separations and sensitivity, critically important for complex biological samples. Thus, GC-MS analysis provides advantages clearly important in such applications.
For thedetection of NSAID by GC-MS, various sample pretreatment protocols have been applied. Acidic liquid-liquid extraction is often used, however some researchers have also developed simple SPE protocols instead [
3,
11]. Furthermore, it has been shown that the selection of a suitable derivatization agent is a key factor for the sensitivity of their detection. Apart from this, there are several issues which are related with the stability of these compounds in the GC-MS conditions.
In this paper, a multi-analyte GC-MS method was developed for the simultaneous quantification of eight NSAIDs, based on a specific pro-analysis procedure. The optimum conditions were selected based on experiments focusing on the sample treatment, to obtain a method able to address the needs of a toxicological analysis for these challenging acidic analytes. The method provides a valuable tool for the determination of eight different NSAIDS by GC-MS, with the pros that the GC-MS technique offers, as stressed above, the additional potential of identification of metabolites, degradation products, or others.
2. Materials and Methods
2.1. Chemicals and Reagents
All solvents were of analytical or LC-MS grade. Acetonitrile (ACN) LC-MS was purchased from Chem Lab NV, (Zedelgem, Belgium). Nordiazepam-d5 solution 1 mg/mL in methanol reference, material reference standards (>99%) of acetaminophen (APAP), acetyl salicylic acid (ASA), salicylic acid (SA), ibuprofen (IBP), diclofenac (DCF), nimesulide (NI), niflumic acid (NFA), mefenamic acid (MFA), and naproxen (NAP) were purchased from Sigma-Aldrich (Saint Louis, MO, USA). Ethyl acetate (99%) was supplied from Penta (Livingston, NJ, USA). All derivatization reagents; N,O-Bis(trimethylsilyl)trifluoroacetamide with 1% trimethylchlorosilane (BSTFA & 1% TMCS), N-tert-Butyldimethylsilyl-N-methyltrifluoroacetamide (MTBSTFA), Pentafluoropropionic anhydride (PFPA), 2,2,3,3,3-Pentafluoro-1-propanol (PFPOH), Trifluoroacetic anhydride (TFAA), Heptafluorobutyric anhydride (HFBA), were for GC derivatization ≥ 99% grade and were purchased from Sigma-Aldrich (Saint Louis, MO, USA). Serum samples were obtained from 4 cases that arrived in AHEPA University General Hospital and were suspected for intoxication. Drug-free human serum was obtained from healthy donors and before its use it was screened by GC/MS for the presence of the NSAIDs.
2.2. Preparation of the Standard Solutions
Stock solutions of all compounds were prepared in ACN at 10,000 μg/mL. From these, a mix solution containing all nine drugs was prepared and diluted to the following concentrations: 1000 μg/mL, 200 μg/mL, 100 μg/mL, 40 μg/mL, 20 μg/mL, 4 μg/mL, and 2 μg/mL.
2.3. Sample Preparation
For the selection of the optimum pH conditions, 200 μL of spiked human serum at 200 μg/mL was adjusted at pH of 3.7, 4.7, and 5.7 with the addition of 100 μL of HCOOH/HCOONa buffer solutions prepared at these pH values (by mixing appropriate values of 0.2 M solutions of HCOOH and HCOONa). Then 1 mL of ethyl acetate was added and the mixture was shaken for 10 min. After centrifugation for 5 min at 6300×
g the organic phase was collected and dried under gentle nitrogen stream at room temperature. The obtained residue was redissolved either in 50 μL of ethyl acetate or in 50 μL of derivatization reagents, as described in
Section 2.5. In any case, 1 μL of the extract was injected in the GC-MS system.
2.4. Derivatization Procedure
For the selection of the optimum derivatization procedure, five different reagents were used: (a) BSTFA with 1% TMCS, (b) MTBSTFA, (c) HFBA, (d) PFPA with PFPOH, and (e)TFAA. The procedure followed for silylation was as follows; addition of 50 μL BSTFA, 1% TMCS, or 50 μL MTBSTFA in the dry residue and after vortexing the mixture was heated for 20 min at 70 °C, finally 1 μL was injected in the system. Acetylation was performed with the addition of either 50 μL of HFBA, or of 30 μL PFPA with 20 μL PFPOH, or of 50 μL of TFAA. The mixture was heated for 20 min at 70 °C and then after cooling down was evaporated and the residue was dissolved in 50 μL of ethyl acetate. From this extract, 1 μL was injected to GC-MS.
2.5. GC/MS Analysis
GC-MS analysis was performed on an Agilent Technologies 7890A GC, equipped with a CTC autosampler and combined with a 5975C inert XL EI/CI MSD with Triple-Axis Detector (Agilent Technologies, Santa Clara, CA, USA). GC separations were performed on a 30 m Agilent J&W HP-5ms UI capillary column, with a film thickness of 0.25 μm and an i.d. of 0.25 μm. Back-flash was performed with a 1.5 m deactivated Agilent column with a film thickness of 0.18 mm. The method had a duration of 15 min with the following temperature program: Initial oven temperature at 120 °C, hold for 1 min, and then increase to 300 °C with a 15 °C/min rate. A back-flash step followed, at 300 °C for 10 min. Injection of 1 μL of sample was made on a PTV injector operating from 200 °C to 320 °C. The mass spectrometer (MS) was operated at electron impact ionization mode (EI, 70 eV) and the mass scan range was from 40 to 500 amu.
3. Results
The majority of the studied drugs are categorized in the acidic class of compounds as they contain carboxyl moieties, except from APAP and NI. Their chemical structures, together with their pKa values, can be seen in
Table 1. These are expected to be extracted more efficiently by the organic solvent under acidic conditions, where the ionization of their carboxyl group is suppressed. However, as their physicochemical properties are varying due to their structure and the presence of different substitution groups, the optimum pH for their extraction is needed to be examined.
3.1. Extraction pH
Under three different pH conditions, extraction of the eight NSAIDs from a serum sample spiked at 200 μg/mL was performed, and the extracts were thereafter analyzed without any derivatization. As expected, detection sensitivity of the underivatized drugs is low, however it was acceptable for comparative purposes. Apart from the eight drugs, two more peaks were considered: (1) The peak which corresponds to salicylic acid, a product occurring from ASA in the sample, and (2) the diclofenac-lactam peak, which is obtained by DCF partial conversion during GC analysis.
Table 2 provided the peak areas of the studied drugs at three different pHs tested for their extraction. As can be seen, more acidic pH conditions favor the extraction of the majority of the drugs resulting in higher detected peak areas. NI, however, provides higher signal under pH 4.7. For the case of diclofenac, its lactam is detected in higher proportion under all three pH conditions. Apart from that, the methylester of dichlofenac (DCF-ME) is also detected with relatively high signal. Salicylic acid is detected with higher amount under the more acidic pHs compared to acetyl salicylic acid.
3.2. Analysis Without Derivatization
When the extracted NSAIDs were analyzed directly without prior derivatization, the detection sensitivity was not satisfactory for the majority of the eight drugs. The chromatographic peaks were broad with excessive tailing, which was attributed to intramolecular interactions and the interaction of polar carboxylic groups of drugs with the column’s supporting material. Detection of such compounds can be challenging as several transformation products of the drugs were also detected. During GC/MS analysis, NFA, MFA, and NAP were not found stable without derivatization, as their decarboxylated compounds (-CO
2) were also detected. This has also been reported in previous studies [
15]. As an example, together with NAP detected at 9.86 min, its NAP-CO
2 degradation product is also detected at 7.04 min with characteristic ions at
m/
z 184 and 141. Another issue is that ASA is converted to SA over time in both aqueous and organic solutions, thus it can also be detected due to that reason. This can mislead its determination, due to the fact that SA is always detected in serum after administration as it is the active metabolite of ASA. Because of that, freshly prepared solutions of ASA should always be used, and SA should also be determined when ASA is present in serum.
In addition, for the cases of ASA, SA, MFA, NFA, IBP, NAP, and DCF, their methyl ester products were also detected in the spiked extract.
As it concerns DCF, it was observed that when the analysis was performed directly in the serum extract without prior derivatization, only a small amount of DCF could be detected, whereas the highest amount was detected as diclofenac lactam. This was firstly reported by El Haj et al. in 1999, who studied the methanolic solutions of DCF [
15]. The authors attributed the formation of lactam to the high temperatures applied in the inlet during the GC-MS analysis. Here, in order to investigate this phenomenon, various analyses were conducted and the findings are discussed below.
3.3. Derivatization Study
In order to enhance the chromatographic peak characteristics of the compounds and the detection sensitivity, the derivatization procedure was performed with different reagents. The aim was to select the optimum procedure and facilitate the simultaneous determination of the eight NSAIDs. In spiked serum samples at 200 μg/mL the derivatization procedures were conducted as described in
Section 2.4, and the obtained chromatographic traces with the five reagents are summarized in
Table 3. The chromatographic peaks were assigned based on the GC-MS libraries used [NIST v11 and Mass Spectral Library of Drugs, Poisons, Pesticides, Pollutants, and Their Metabolites, 3th Edition (PMW_Tox3.l)]. All the obtained peaks could be identified, apart from the acetyl derivatives, the spectra of which didn’t exist in any of the used MS libraries, web-based libraries, or in the literature. In
Table 3, the retention time and the characteristic ions of each drug or drug derivative are juxtaposed for the five derivatization procedures and that without any derivatization. As can be seen, AS and ASA, could not be detected at all with HFBA, TFA, or PFPA-PFPOH derivatization. In some cases, more than one derivative was detected, for example for APAP with MTBSTFA, while for others the underivatized drug was also detected, such as for NI with silylation reagents. In the case of PFPA-PFPOH, derivatization of NFA gives two peaks which cannot be assigned based on their spectra, as acetyl-derivatives are not registered in the MS spectral libraries used. The major peak is that at 6.9 min, which was attributed to NFA-pfp, while the other peak at 8 min can be another derivative of NFA. Ideally, the optimum procedure should lead to a sole derivative, whereas when the underivatized compound or more than one derivative is detected, the complexity of the detection is increased and the reproducibility of the obtained results is hindered. Based on the obtained results, HFBA, TFA, and PFPA-PFPOH are not considered to be the most appropriate for the simultaneous detection and determination of the eight NSAIDs for the above mentioned reasons.
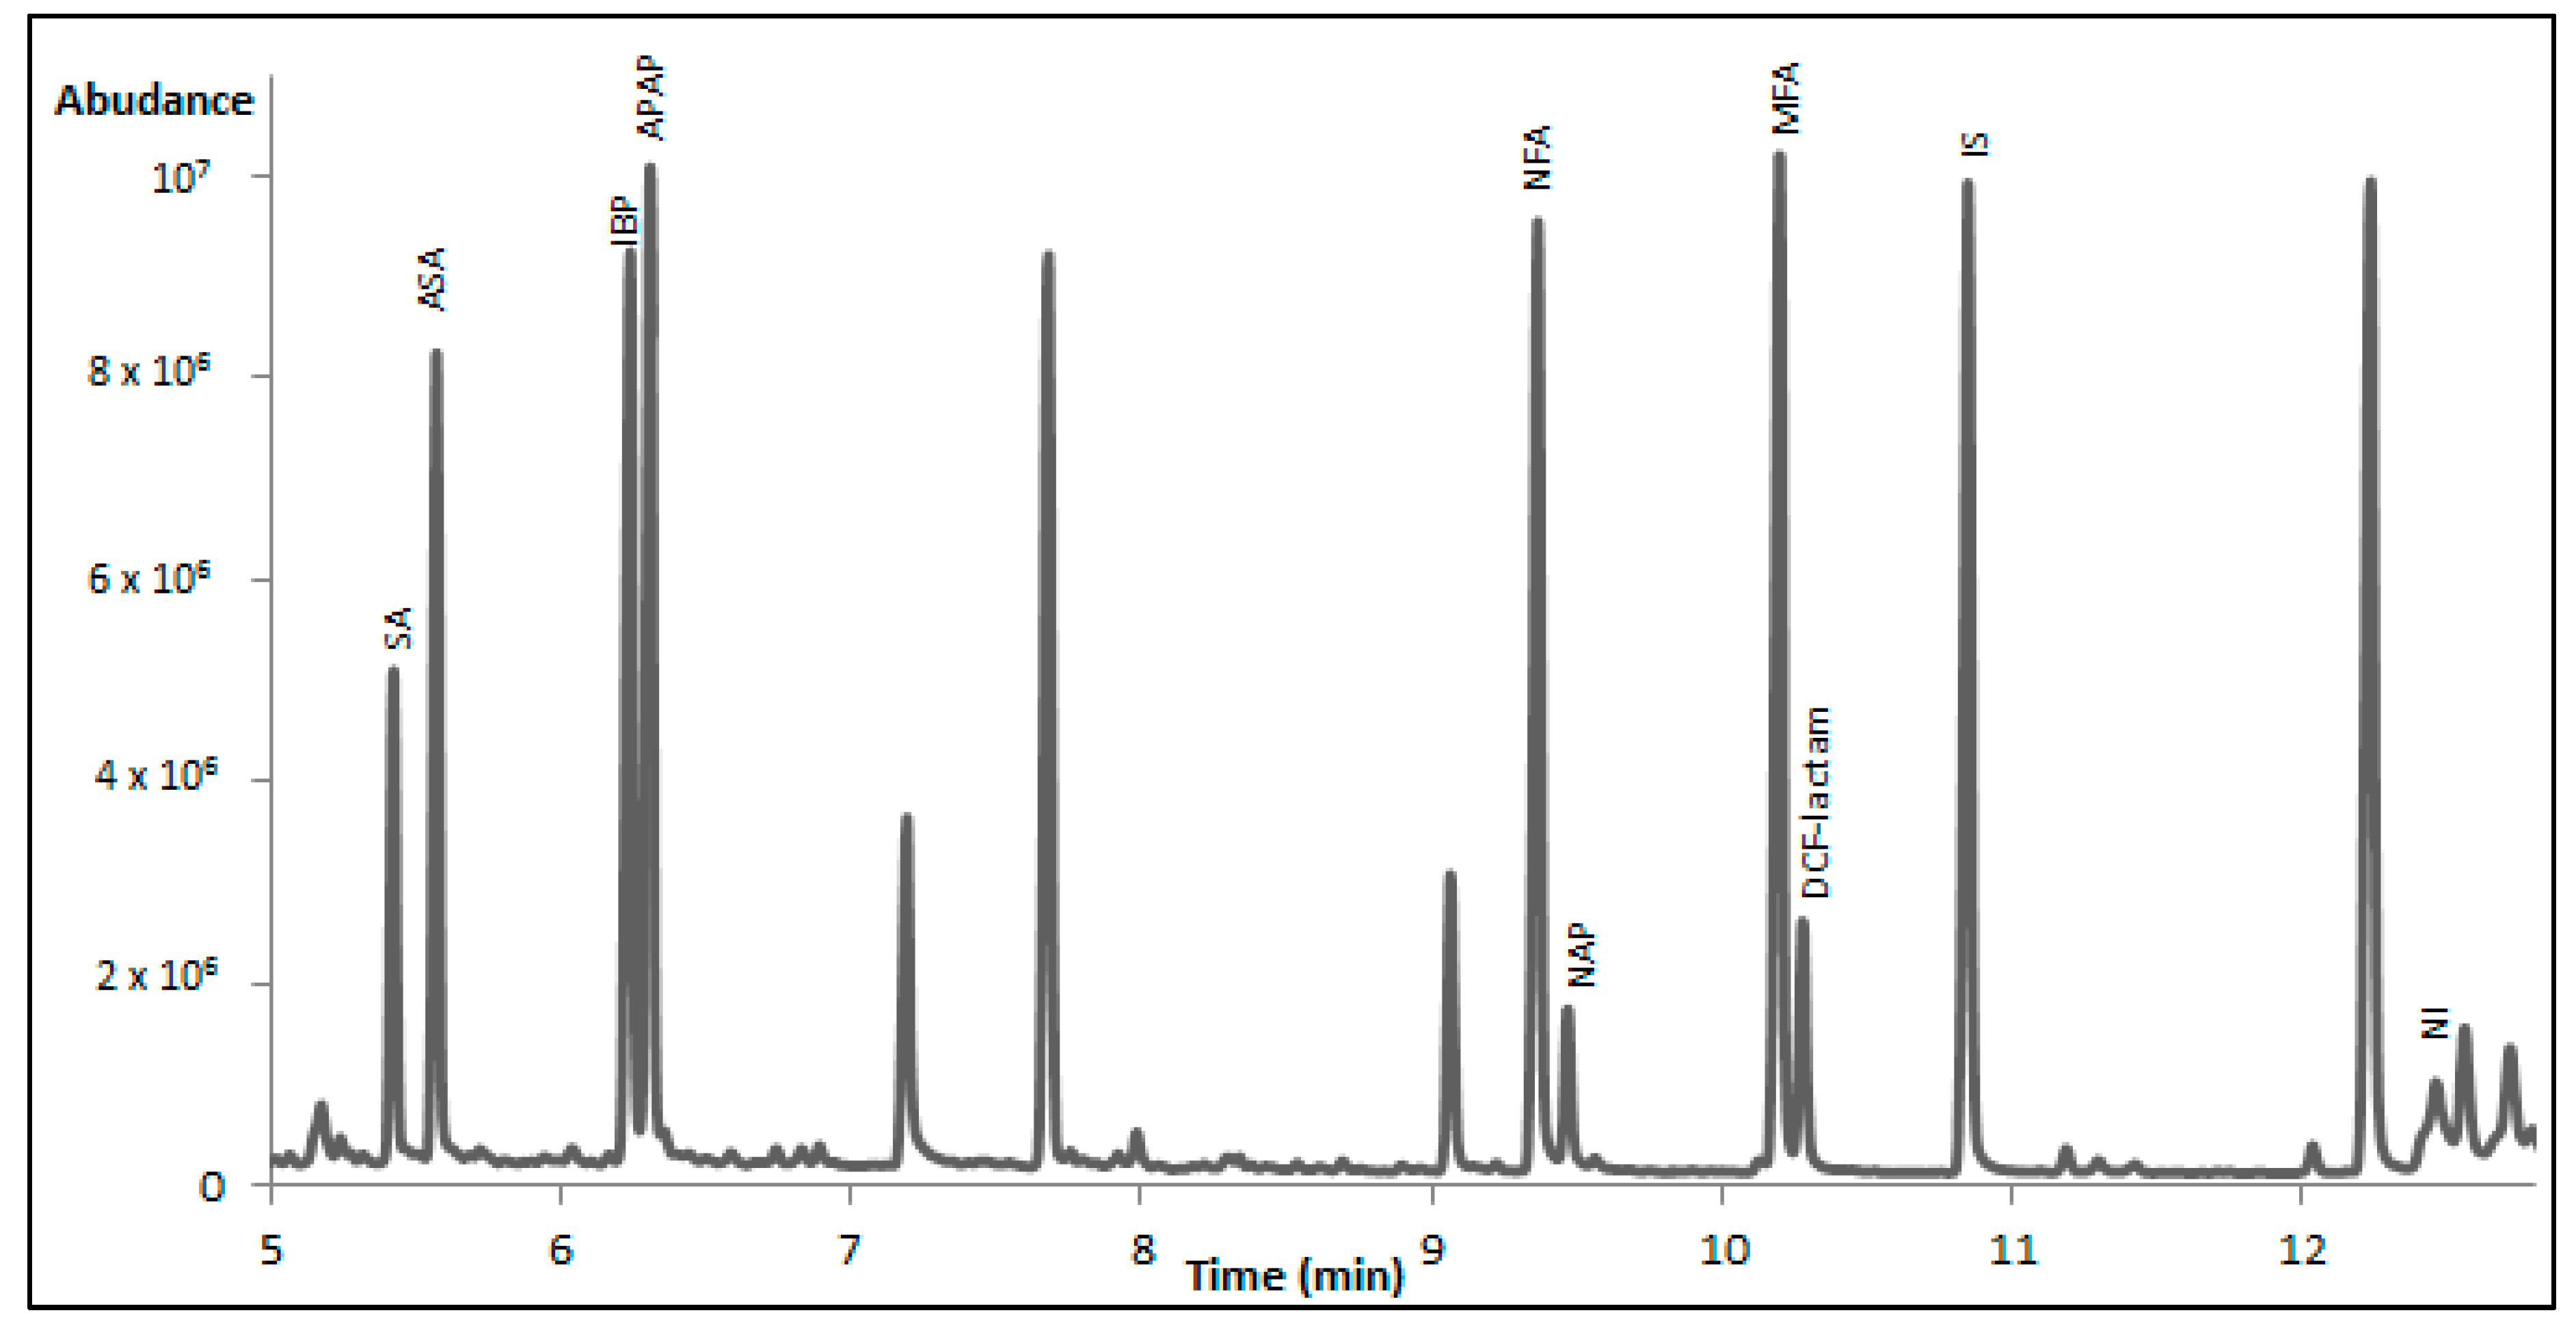
As it concerns the detection sensitivity of the tested derivatization protocols, silylation provided better results in comparison to the other reagents for all NSAIDs except from IBP. The latter formed a derivative with PFPA/PFPOH which exhibited higher peak area when compared to the BSTFA and MTBSTFA derivatives. Between the two silylation reagents, BSTFA was selected as the best one. In
Figure 1, a characteristic total ion chromatogram of serum sample spiked with the studied NSAIDs is presented. The selection was based on the fact that the majority of the peaks had higher peak areas and that MTBSTFA, in the case of APAP, forms two derivatives at the same peak height. Only NI derivatization with BSTFA seems to have low yield, as it gives a small peak of the derivative and the largest peak as NI. However, this is observed for the other silylation reagent as well, whereas NI does not derivatized at all with HFBA, PFPA/PFPOH, and TFA. This means that NI will finally be determined by considering the peak of the underivatized drug. In
Table 4, the obtained peak areas are given for the eight drugs, where the higher peak areas can be seen for the silyl-derivatives. In the cases where the peak of the underivatized drug is detected this is noted by an asterisk.
3.4. Application of the Method
With the aim to apply the method to real clinical human samples, recovery of the optimum procedure was examined and linearity and limits of detection and quantification of the method was assessed. Recovery (R%) was experimentally calculated and expressed as the percentage ratio of the peak areas of the serum spiked before extraction at 10 μg/mL to the peak areas of the serum extract spiked after extraction. The R% ranged from 51.50% for ASA to 85.81% for NAP. The R% for all the studied drugs are presented in
Table 5.
Linearity of the method was evaluated by analyzing human serum samples spiked with a mixture of NSAIDs at concentrations of 0.5, 1, 5, 10, 25, and 50 μg/mL using as internal standard 20 μL nordiazepm-D
5 (C = 5 μg/mL). BSTFA derivatization was applied with 1% TMCS as described in
Section 2.3 and
Section 2.4, and the peak areas ratios were considered for quantitation. For the case of NI, the peak of underivatized drug was considered, as in low concentrations the derivative is not detected at all. The limits of quantitation (LOQ) were experimentally calculated as signal to noise ratio 10:1 and the limits of detection, and limits of detection (LOD) as signal to noise 3:1. The equations of calibration curves based on linear regression, LOQs, and LODs for all drugs are given in
Table 6.
Selectivity was determined on the drug-free blood serum samples obtained from six different healthy volunteers from the laboratory staff. No traces of the studied NSAIDs or other interferences could be detected.
Here it should be noted that freshly prepared ASA solutions in ACN were used for the determination of ASA, as it was observed that ASA transforms to SA. This has been observed to proceed faster in methanol than in ACN [
16]. As SA is also present in real samples, its co-determination is required for both reasons.
The accuracy and precision of the method was evaluated within a day (
n = 4) and over a period of a week (
n = 3) at low, medium, and high concentration levels (1, 10, 50 μg/mL). The intra-day accuracy and precision were found to be between 1.03%–9.79% and 88%–110%, respectively, while the inter-day accuracy and precision were between 1.87%–10.79% and 91%–113%. In
Table 7, the data from accuracy and precision assays are presented.
The method was then applied to four clinical cases where exposure to NSAIDs was suspected. The findings are presented in
Table 8. S1 and S2 correspond to serum samples which were taken 12 h after APAP ingestion, and they were found below toxic levels (below 50 μg/mL, Rumack-Matthew nomogram). S3 corresponds to a case of a 13 year old girl claiming a suicide attempt with DCF, however the concentration after 3 h at 2.31 μg/mL was at the therapeutic levels. S4 corresponds to a patient treated with ASA (the sample was taken 40 min after ingestion) and the concentration was found to be below the therapeutic levels. The extracted ion chromatograms of S2 and S3 are presented in
Figure 2a,b.
4. Discussion
According to our findings, more efficient extraction of the studied drugs was performed under an acidic pH of 3.7. NI showed also high extraction recovery in higher pH as well.
For most of the studied drugs, derivatization was required for their sensitive detection, however NI provided high, sharp peak in the initial extract and can be best determined without any derivatization.
Some of our findings lead us to the conclusion that determination of these drugs needs cautious sample treatment and data interpretation. We have observed, like previous findings [
16], that ASA is not stable in solution and it is hydrolysed into SA, and finally over time both compounds are in equilibrium in the solution. Degradation of ASA has been studied thoroughly [
16,
17,
18], however there are recent studies where the authors overlook this parameter [
1,
19]. In order to overcome this transformation, freshly prepared solution should be used for ASA.
Without derivatization, the majority of the NSAIDs seem to be unstable under the high temperature conditions in GC-MS, and a variety of different derivatives are also detected.
The decarboxylated products of NAP, MFA, and NFA are detected to elute some minutes earlier than the parent compound peaks. The formation of these compounds have been reported by others [
15] and most probably is due to the fact that the underivatized compounds are labile compared to their derivatives under the same high temperature conditions in GC-MS.
In addition, for almost all the studied drugs, their methylesters were also detected. The esterification process seems to take place at the high temperature conditions in GC-MS, especially in methanolic solutions, whereas this doesn’t seem to happen for the derivatives. For this, ACN was used as a solvent.
What is most interesting is that DCF transformed to its dehydrated product, the lactam. To investigate this, a series of experiments was conducted. First, a solution of DCF was analyzed directly with GC-MS, and it was observed that almost all of the diclofenac was transformed to its lactam form. When the same solution was analyzed after derivatization with BSTFA + 1% TMCS only diclofenac-tms was determined, indicating stability of the molecule with derivatization. Then a real human serum sample positive to DCF and a human serum sample spiked with DCF were analyzed after derivatization with BSTFA + 1% TMCS. In both cases, and in contrast to the previous finding, DCF-lactam-tms was mainly detected. Contrastingly, in an aqueous solution of DCF, which was analyzed after extraction and derivatization, similarly to a real sample, only DCF-tms could be detected. This could mean that diclofenac-tms is more stable than the underivatized drug, which is dehydrated under high temperatures in the GC-MS. However, it seems that the serum matrix under acidic conditions enhances the full conversion of DCF to lactam, as DCF-lactam-tms is the sole peak detected in this case, whereas in the absence of serum matrix DCF-tms is detected. The transformation of DCF to DCF-lactam in water samples, pharmaceutical dosage forms, and urine was reported previously but it hasn’t been thoroughly studied [
11,
16]. In a study, DCF-lactam was falsely reported as DCF [
20], and in another study DCF-lactam-tms wasn’t detected at all [
21].
5. Conclusions
Based on our findings, the most efficient sample preparation protocol for the accurate determination of the studied commonly prescribed NSAIDs is derivatization, more specifically with BSTFA, except from NI where no derivatization step is needed, after acidic extraction.
For some of these drugs, cautious handling is needed, as ASA hydrolyses quickly in solution and DCF is converted to its lactam form in the serum matrix under acidic pH. This conversion is enhanced at high temperatures when its carboxyl group is not protected.
The method needs only 200 μL of blood serum and can determine even trace amounts of the studied compounds.
Author Contributions
Conceptualization, A.K. and H.G.; Methodology, A.K. and N.R.; Validation, A.K. and E.T.; Formal Analysis, A.K. and E.M.; Resources, N.R.; Data Curation, A.K. and E.M.; Writing-Original Draft Preparation, A.K. and H.G.; Writing-Review & Editing, G.T.; Supervision, G.T. and H.G.
Conflicts of Interest
The authors declare no conflict of interest.
Abbreviations
| ASA | Acetyl salicylic acid |
| SA | Salicylic acid |
| NAP | Naproxen |
| IBP | Ibuprofen |
| APAP | Acetaminophen |
| NFA | Niflumic acid |
| MFA | Mefenamic acid |
| NI | Nimesulide |
| DCF | Diclofenac |
References
- Sirok, D.; Pátfalusi, M.; Szeleczky, G.; Somorjai, G.; Greskovits, D.; Monostory, K. Robust and sensitive LC/MS-MS method for simultaneous detection of acetylsalicylic acid and salicylic acid in human plasma. Microchem. J. 2018, 136, 200–208. [Google Scholar] [CrossRef]
- Bylda, C.; Thiele, R.; Kobold, U.; Volmer, D.A. Simultaneous quantification of acetaminophen and structurally related compounds in human serum and plasma. Drug Test. Anal. 2014, 6, 451–460. [Google Scholar] [CrossRef] [PubMed]
- Yilmaz, B.; Sahin, H.; Erdem, A.F. Determination of naproxen in human plasma by GC-MS. J. Sep. Sci. 2014, 37, 997–1003. [Google Scholar] [CrossRef] [PubMed]
- Vinci, F.; Fabbrocino, S.; Fiori, M.; Serpe, L.; Gallo, P. Determination of fourteen non-steroidal anti-inflammatory drugs in animal serum and plasma by liquid chromatography/mass spectrometry. Rapid Commun. Mass Spectrom. 2006, 20, 3412–3420. [Google Scholar] [CrossRef] [PubMed]
- Sun, X.; Xue, K.L.; Jiao, X.Y.; Chen, Q.; Xu, L.; Zheng, H.; Ding, Y.F. Simultaneous determination of nimesulide and its four possible metabolites in human plasma by LC-MS/MS and its application in a study of pharmacokinetics. J. Chromatogr. B 2016, 1027, 139–148. [Google Scholar] [CrossRef] [PubMed]
- Taylor, R.R.; Hoffman, K.L.; Schniedewind, B.; Clavijo, C.; Galinkin, J.L.; Christians, U. Comparison of the quantification of acetaminophen in plasma, cerebrospinal fluid and dried blood spots using high-performance liquid chromatography-tandem mass spectrometry. J. Pharm. Biomed. Anal. 2013, 83, 1–9. [Google Scholar] [CrossRef] [PubMed]
- Chhonker, Y.S.; Pandey, C.P.; Chandasana, H.; Laxman, T.S.; Prasad, Y.D.; Narain, V.S.; Dikshit, M.; Bhatta, R.S. Simultaneous quantitation of acetylsalicylic acid and clopidogrel along with their metabolites in human plasma using liquid chromatography tandem mass spectrometry. Biomed. Chromatogr. 2016, 30, 466–473. [Google Scholar] [CrossRef] [PubMed]
- Hložek, T.; Bursová, M.; Čabala, R. Fast ibuprofen, ketoprofen and naproxen simultaneous determination in human serum for clinical toxicology by GC–FID. Clin. Biochem. 2014, 47, 109–111. [Google Scholar] [CrossRef] [PubMed]
- Chang, K.C.; Lin, J.S.; Cheng, C. Online eluent-switching technique coupled anion-exchange liquid chromatography–ion trap tandem mass spectrometry for analysis of non-steroidal anti-inflammatory drugs in pig serum. J. Chromatogr. A 2015, 1422, 222–229. [Google Scholar] [CrossRef] [PubMed]
- Elsinghorst, P.W.; Kinzig, M.; Rodamer, M.; Holzgrabe, U.; Sörgel, F. An LC-MS/MS procedure for the quantification of naproxen in human plasma: Development, validation, comparison with other methods, and application to a pharmacokinetic study. J. Chromatogr. B 2011, 879, 1686–1696. [Google Scholar] [CrossRef] [PubMed]
- Ding, Y.; Garcia, C.D. Determination of Nonsteroidal Anti-inflammatory Drugs in Serum by Microchip Capillary Electrophoresis with Electrochemical Detection. Electroanalysis 2006, 18, 2202–2209. [Google Scholar] [CrossRef]
- Payán, M.R.; López, M.Á.B.; Fernández-Torres, R.; Bernal, J.L.P.; Mochón, M.C. HPLC determination of ibuprofen, diclofenac and salicylic acid using hollow fiber-based liquid phase microextraction (HF-LPME). Anal. Chim. Acta 2009, 653, 184–190. [Google Scholar]
- Way, B.A.; Wilhite, T.R.; Smith, C.H.; Landt, M. Measurement of plasma ibuprofen by gas chromatography-mass spectrometry. J. Clin. Lab. Anal. 1997, 11, 336–339. [Google Scholar] [CrossRef]
- Bhushan, R.; Joshi, S.; Arora, M.; Gupta, M. Study of the liquid chromatographic separation and determination of NSAID. JPC J. Planar Chromatogr. Mod. TLC 2005, 18, 164–166. [Google Scholar] [CrossRef]
- El Haj, B.M.; Al Ainri, A.M.; Hassan, M.H.; Bin Khadem, R.K.; Marzouq, M.S. The GC/MS analysis of some commonly used non-steriodal anti-inflammatory drugs (NSAIDs) in pharmaceutical dosage forms and in urine. Forensic Sci. Int. 1999, 105, 141–153. [Google Scholar] [CrossRef]
- Skibinski, R.; Komsta, L. The stability and degradation kinetics of acetylsalicylic acid in different organic solutions revisited—An UHPLC-ESI-QTOF spectrometry study. Curr. Issues Pharm. Med. Sci. 2016, 29, 39–41. [Google Scholar] [CrossRef]
- Marra, M.C.; Cunha, R.R.; Vidal, D.T.; Munoz, R.A.; do Lago, C.L.; Richter, E.M. Ultra-fast determination of caffeine, dipyrone, and acetylsalicylic acid by capillary electrophoresis with capacitively coupled contactless conductivity detection and identification of degradation products. J. Chromatogr. A 2014, 1327, 149–154. [Google Scholar] [CrossRef] [PubMed]
- Abuirjeie, M.A.; Abdel-hamid, M.E.; Ibrahim, E.-S.A. Simultaneous High-Performance Liquid Chromatographic Assay of Acetaminophen, Acetylsalicylic Acid, Caffeine, and D-Propoxyphene Hydrochloride. Anal. Lett. 1989, 22, 365–375. [Google Scholar] [CrossRef]
- Kees, F.; Jehnich, D.; Grobecker, H. Simultaneous determination of acetylsalicylic acid and salicylic acid in human plasma by high-performance liquid chromatography. J. Chromatogr. B 1996, 677, 172–177. [Google Scholar] [CrossRef]
- Yilmaz, B.; Ciltas, U. Determination of diclofenac in pharmaceutical preparations by voltammetry and gas chromatography methods. J. Pharm. Anal. 2015, 5, 153–160. [Google Scholar] [CrossRef] [PubMed]
- Yilmaz, B. GC-MS Determination of Diclofenac in Human Plasma. Chromatographia 2010, 71, 549–551. [Google Scholar] [CrossRef]
© 2018 by the authors. Licensee MDPI, Basel, Switzerland. This article is an open access article distributed under the terms and conditions of the Creative Commons Attribution (CC BY) license (http://creativecommons.org/licenses/by/4.0/).

 ,
, 


