CFD Investigation of the Effect of the Feed Spacer on Hydrodynamics in Spiral Wound Membrane Modules


1
Faculty of Environmental Engineering, The University of Kitakyushu, Kitakyushu 808-0135, Japan
2
School of Municipal and Environmental Engineering, Shandong Jianzhu University, Jinan 250101, China
*
Author to whom correspondence should be addressed.
Math. Comput. Appl. 2018, 23(4), 80; https://doi.org/10.3390/mca23040080
Submission received: 4 November 2018
/
Revised: 5 December 2018
/
Accepted: 13 December 2018
/
Published: 13 December 2018
(This article belongs to the Section Engineering)
Abstract
:Spacers are designed to create a feed channel, but they are also obstacles to the flow in spiral wound membrane modules. The geometry of the feed spacer influences the flow pattern, which was investigated by using a three-dimensional Computational Fluid Dynamics (CFD) model. For the conventional feed spacer, unavoidable disadvantages were caused by its line contact with the membrane. The pillar-like feed spacer was designed to achieve area contact, which made it possible to enhance the porosity and minimize the adverse effects from the dead zone caused by the transverse filament. Through reductions in the connecting filament’s diameter, the channel porosity reached 0.979. Regarding the maximum porosity, the dimensionless power number was reduced by 47.31% at Reynolds number 150 in comparison with a previously studied commercial spacer. Furthermore, a modified friction factor, as a dimensionless parameter, was employed to investigate the shear stress at the membrane’s surface. At dimensionless power number 106, the enhancement of the modified friction factor increased by approximately 22.27% in comparison with the results of a previous study. Based on the numerical prediction, the homogenization of shear stress distribution, which changed the flow profile near the membrane, was featured through contour plots.
1. Introduction
In the reverse osmosis (RO) process, membrane fouling occurs because the solute separation process is a significant challenge to reliable membrane performance. In addition to the membrane wall flow pattern, the solute separation process is vital to the feed spacer’s design. To enhance the mass transport characteristics and to mitigate fouling and concentration polarization phenomena, different feed spacer geometries have been considered for the optimization of hydrodynamic characteristics in several numerical and experimental studies [1,2,3]. Schwinge et al. [4] reported, in detail, the effects of feed spacer geometry on the flux and pressure loss. Compared to other factors, previous studies have focused on the effect of feed spacers on fouling and performance. Using a numerical model, the experimental results of Vrouwenvelder et al. [5] confirmed that feed spacer fouling was more important than membrane fouling. Karabelas et al. [6] focused on the feed spacers’ compressive stress effect on the characteristics of spacer-filled membrane channels. The authors’ work focused on the effect of compressive stresses from the net-type spacers on the spiral wound module’s operating parameters and on the overall performance of the RO process. In recent years, the use of three-dimensional (3D) print technology in feed spacer fabrication has also been applied to enhance the membrane module’s design [7,8]. Owing to biofouling and particulate fouling, the fouling of feed spacers in the membrane elements was noted as a vital problem during the RO operation. Cornelissen et al. [9] showed strategies to reduce biofouling linked to feed spacers with periodic air/water flushing. Araujo et al. [10] found that a decrease in pressure due to biofouling was generated by an increase in the spacer thickness. Particle Image Velocimetry (PIV) was applied to visually investigate the flow patterns determined by the feed spacer; PIV is considered to be a non-invasive and high-resolution experimental method [11]. The pressure decrease along the channel and the flux improvement are closely related to the flow pattern, especially the eddy promotion from the feed spacer. Radu et al. [12] reported that substrates rejection due to concentration polarization increased with biofilm thickness, and that biofilm removal depended on the velocity variation and shear stress. To achieve further economic improvements to the operation, the consideration of flow pattern has led to the study of feed spacer geometry.
Extensive experimental and theoretical studies have sought a better understanding of spiral wound (SW) membrane mechanisms and the optimization of feed spacer geometric parameters. The studies have found the advantages of geometric configuration in the development of the feed spacer to promote high shear stresses and mass transfer rates. However, in the stagnant zone, which is behind the line contact filaments, a low flow velocity means fewer shear stresses, lower mass transfer rates, and a quicker membrane flux decline, which are caused by a simultaneous increase in fouling [13]. In early work, Pervov et al. [14] pointed out the influence of the feed spacer on the scale formation process in the SW membrane model, and details of the mineral precipitation in the contact zone of the spacer and membrane were described in this work. It was found that the transverse filaments determined the flow structure, as reported by Da Costa et al. [15] and Santos et al. [16]. In the current study, a pillar-like spacer was designed to optimize feed spacer geometry. Compared with the conventional spacer, the contact method of the pillar-like spacer with the membrane changed with the area contact. Hence, it was possible that the diameter of the connecting filaments (transverse filament) had decreased to maximize the channel porosity. The energy consumption and shear stress were analyzed using a numerical method, and the results were compared to those of commercial spacers studied in previous works.
2. Materials and Methods
2.1. Characterization of the Pillar-Like Spacer
2.1.1 Feed Spacer Design-Related Problem
Optimizing the feed spacer’s design is the key way to improve SW membrane performance in a pressure-driven membrane process. In the feed channel, spacer use is essential to mass transfer; however, the feed spacer geometry determines the hydrodynamics at the same time. Changes in the flow direction and spacer filaments drag cause hydrodynamic resistance, which generates more power consumption in the membrane’s operation. Compared to an empty channel, a spacer-filled channel has a higher pressure drop and 3–5 times more flux enhancement. However, beyond the critical Reynolds number of 60, the flow becomes unstable [17], notably when the cylinder is inserted in the middle of the channel. This is important to both the periodic and symmetric geometry in the feed spacer’s design. The SW membrane parameter variables (i.e., the diameter of the filament, element size, channel height, channel porosity, etc.) influence the flow patterns linked to the shear stress distribution on the membrane and feed spacer surface. The hydrodynamic boundary layer must be considered for the permeate flux and fouling process in most of the hydrodynamic analysis.
In conventional designs, the transverse filaments (perpendicular to the cross flow) of the woven and unwoven feed spacer are important to the phenomenon of concentration polarization, which is closely related to membrane fouling near to the membrane surface. The region adjacent to the transverse filaments wall has much higher concentrations [18]. Boram et al. [19] compared the water flux in four classic types of feed spacer configurations, which included nonwoven, partially woven, middle-layer, and fully woven spacers, and showed concentration contours near the transverse filaments using COMSOL Multiphysics. Van Gauwbergen et al. [20] reported the same situation using potassium and calcium chloride as tracers in the experimental research. In the present design, transverse filaments were set as the submerged spacer, where the intersection of the filaments lowered the feed spacer effect owing to its cross-section design.
2.1.2. Selection of Feed Spacer Design Parameter Values
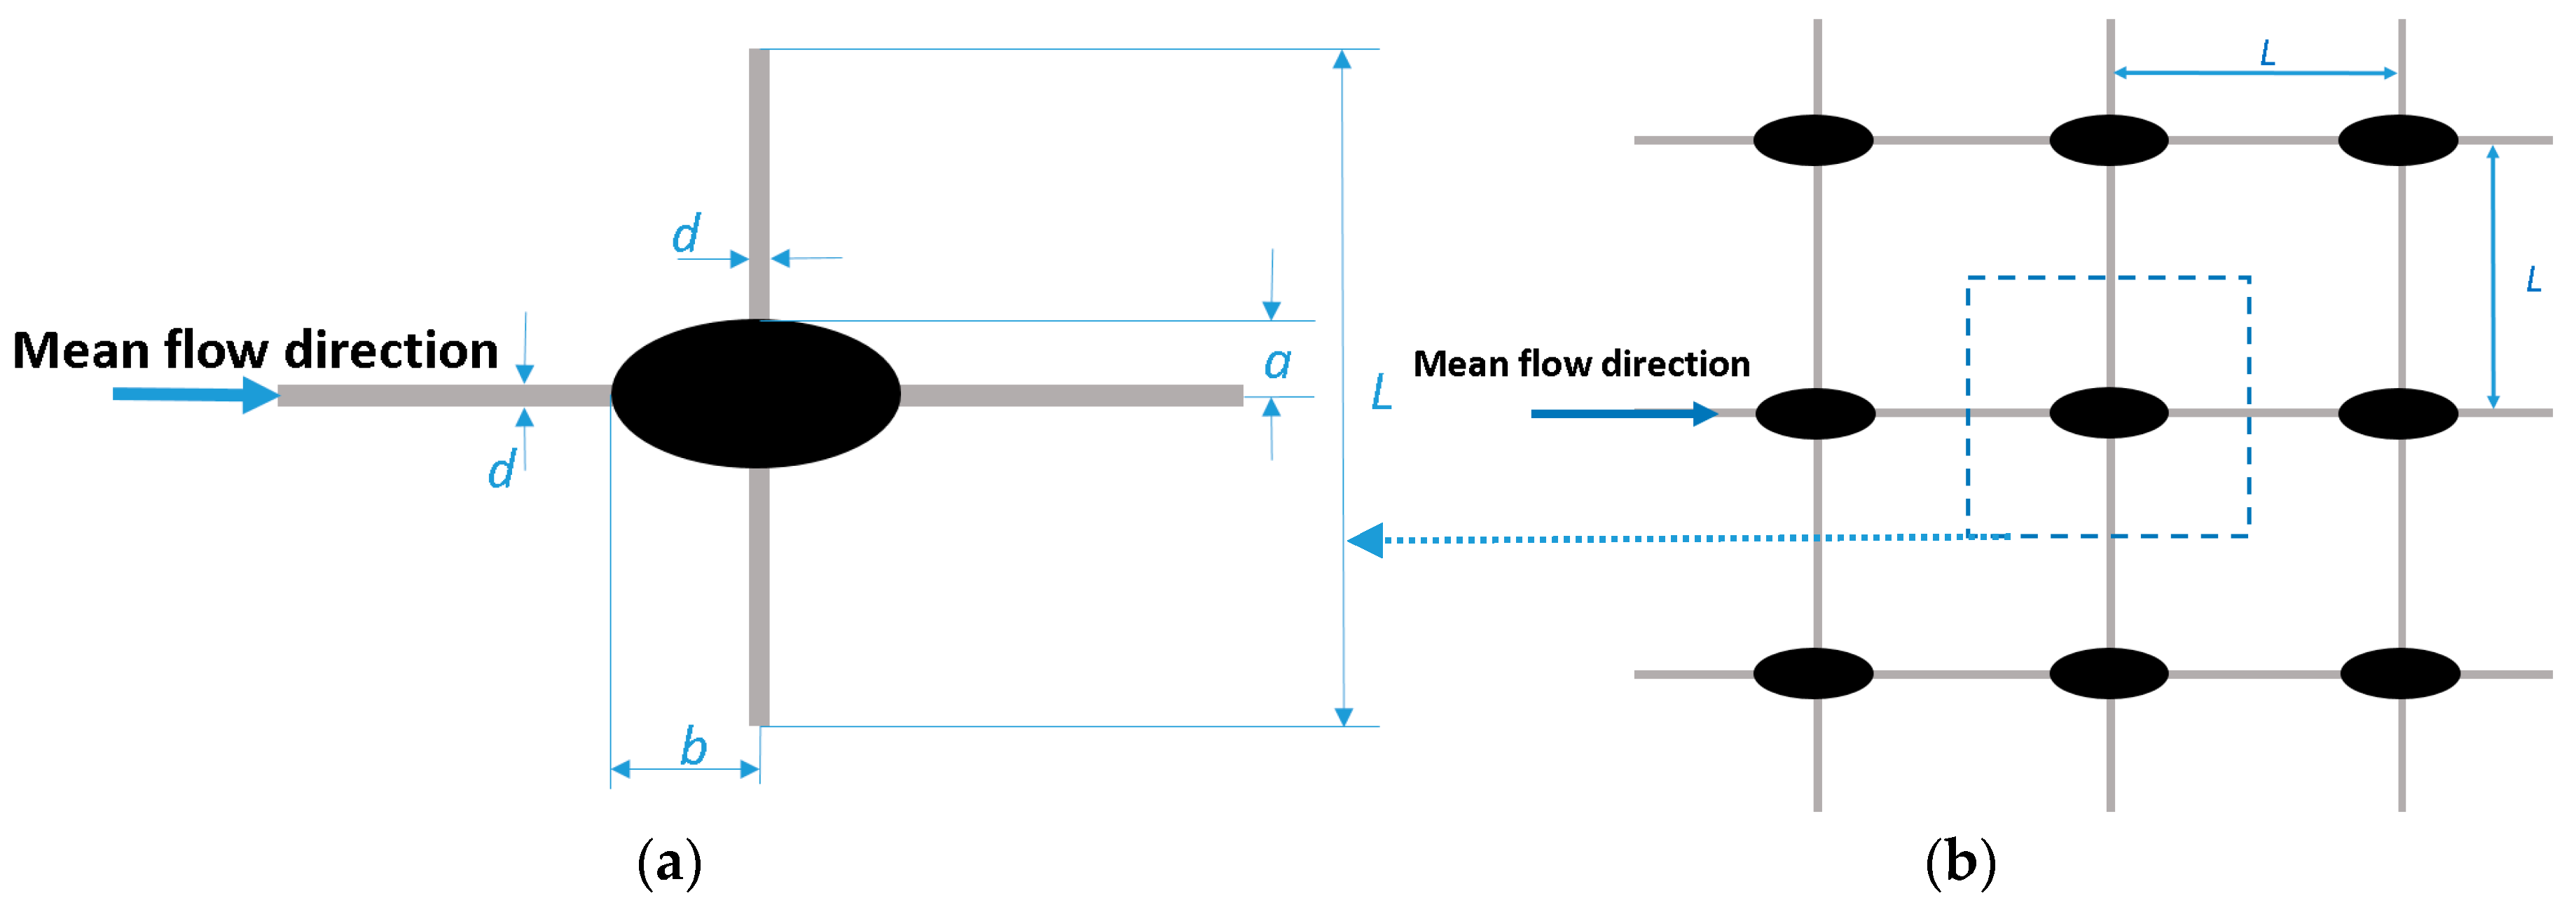
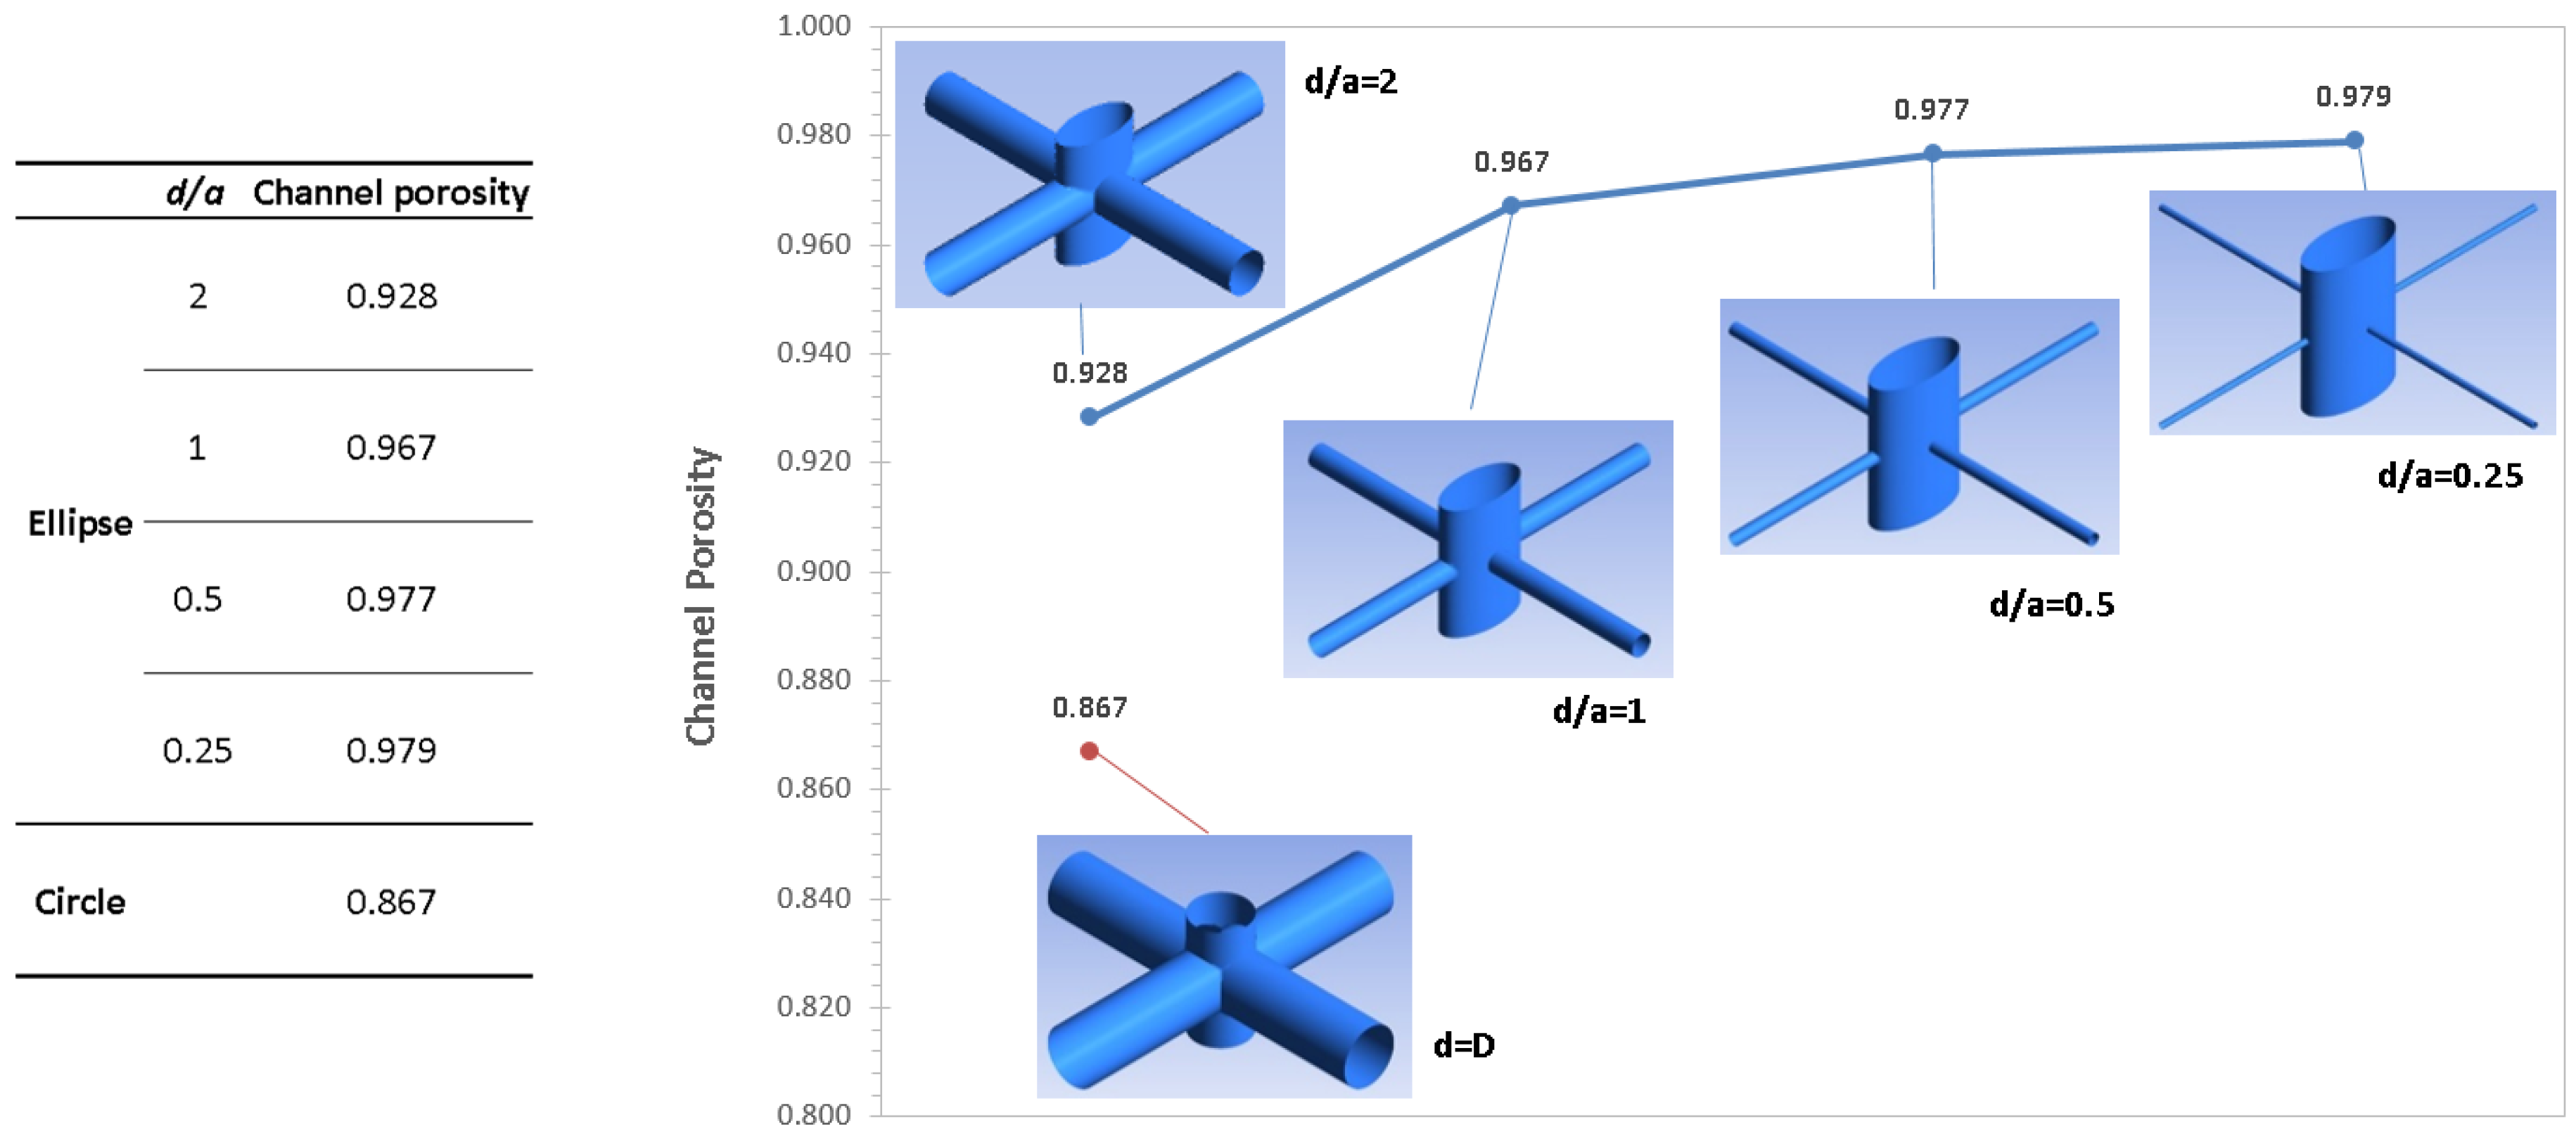
Typical net-like feed spacers are composed of woven and nonwoven feed spacers to enhance mass transfer in the membrane modules. Filaments contact the membrane with the line; so, in the downstream, there is a dead-flow zone behind the transverse filaments. In these dead-flow zones, velocity is close to zero, shear stress and mass transfer are low, and biofouling cultivates easily. The location and inter-filament distance of the feed spacers constrain the shear stress distribution, mass transfer coefficients, and the pressure inside the channel [21]. Koutsou et al. [22] designed a novel spacer to eliminate the adverse effects from the dead-flow zone. However, the nodes of the design were spherical and contacted the membrane with points, which was unstable and made it difficult to optimize the transverse filament. In the current study, a pillar-like spacer was designed, and it was composed of two sets of the intersection and the connecting filaments. A schematic diagram of the pillar-like feed spacer is illustrated in Figure 1 (shown by an elliptic intersection) and Figure 4. The intersection that was perpendicular to the membrane surface was fixed by the transverse and longitudinal connecting filaments. Furthermore, its cross-section was designed as ellipse and circular for comparison; hence, the intersection contacted the membrane with a small elliptic or circular area. The area contact was more stable than points or line contact. Additionally, the connecting filament was in the middle of the feed channel. The adverse effects on the dead-flow zone were eliminated. The geometry of this pillar-like feed spacer was described by the feed channel height, hf, the element length (the distance between the filaments), ΔL, the diameter of the connecting filament, d, the semi-major axis and semi-minor axis of the intersection elliptic cross-section, a and b, respectively (as shown in Figure 2 left), and the diameter of the intersection circular cross-section, D (shown in Figure 4 right). The feed spacer was also characterized by the hydraulic diameter, DH, and the feed channel porosity or voidage, ε.
The basic geometrical characteristics were the ratio of the distance between the parallel connecting filaments to the diameter of the cylinder intersection (L/D) and the ratio of the diameter of the circular intersections to the diameter of the cylinder connecting filaments (D/d), or the diameter of the cylinder connecting filaments to the ellipse semi-minor axis for the elliptic cross-section (d/a), as shown on the right of Figure 4. The main flow direction was vertical to the cylinder connecting filaments, as shown in Figure 2. From a Computational Fluid Dynamics (CFD) viewpoint, it was convenient to define every simulated unit cell and simulate the respective flow field in detail. A higher pressure drop was caused by the feed spacer as reported by Haidari et al. [11]. The diameter of the cylinder connecting the filaments decreased to enhance the channel porosity. Lanxess AG (LXS-ASD) has done the same work, although it alternated the strand thickness to reduce the pressure drop [23]. Filament spacing is a key parameter for the pressure drop, mass transport, and fouling propensity [24,25]. In a commercial spacer, the ratio L/D usually varies between 7 and 9; however, in most studies, this ratio varies between 6 and 12 [26,27]. For consideration of the mechanical strength in this design, a high density was applied or a minor L/D ratio = 6 was applied. For area contact, D = hf/2 = 1 mm [4] was employed in the present parameters setting.
2.2. Computational Model
Along with the experimental techniques, the time, cost, and risks were reduced by the computational techniques. As a reliable and efficient numerical analysis tool, CFD has been extensively applied to the flow conditions of the SW membrane modules as described in Reference [28]. The interaction of the many different processes could be assessed through computational simulation. Without building spacers, CFD simulation can investigate hydrodynamics under various feed spacer geometry parameters. In the present work, the model of the pillar-like feed spacer was constructed to simulate a membrane system to analyze the role of the pillar-like feed spacer in the feed channel in terms of improving the hydraulic behavior and the decreasing pressure drop. In the current work, a double-sided membrane was implemented, and the consideration of the feed spacer’s impact was based on the fluid dynamics and also the through flow.
A 3D Computational Fluid Dynamics (CFD) model was constructed to study the impact of the pillar-like feed spacer in relation to hydraulics in the feed channel. There were two steps to the model. The geometry was constructed by comparison with conventional geometries. Therefore, the incompressible flow in the laminar flow regime was calculated using commonly employed parameters (i.e., friction factor, the dimensionless power number, and the modified friction factor).
2.2.1. Model Construction
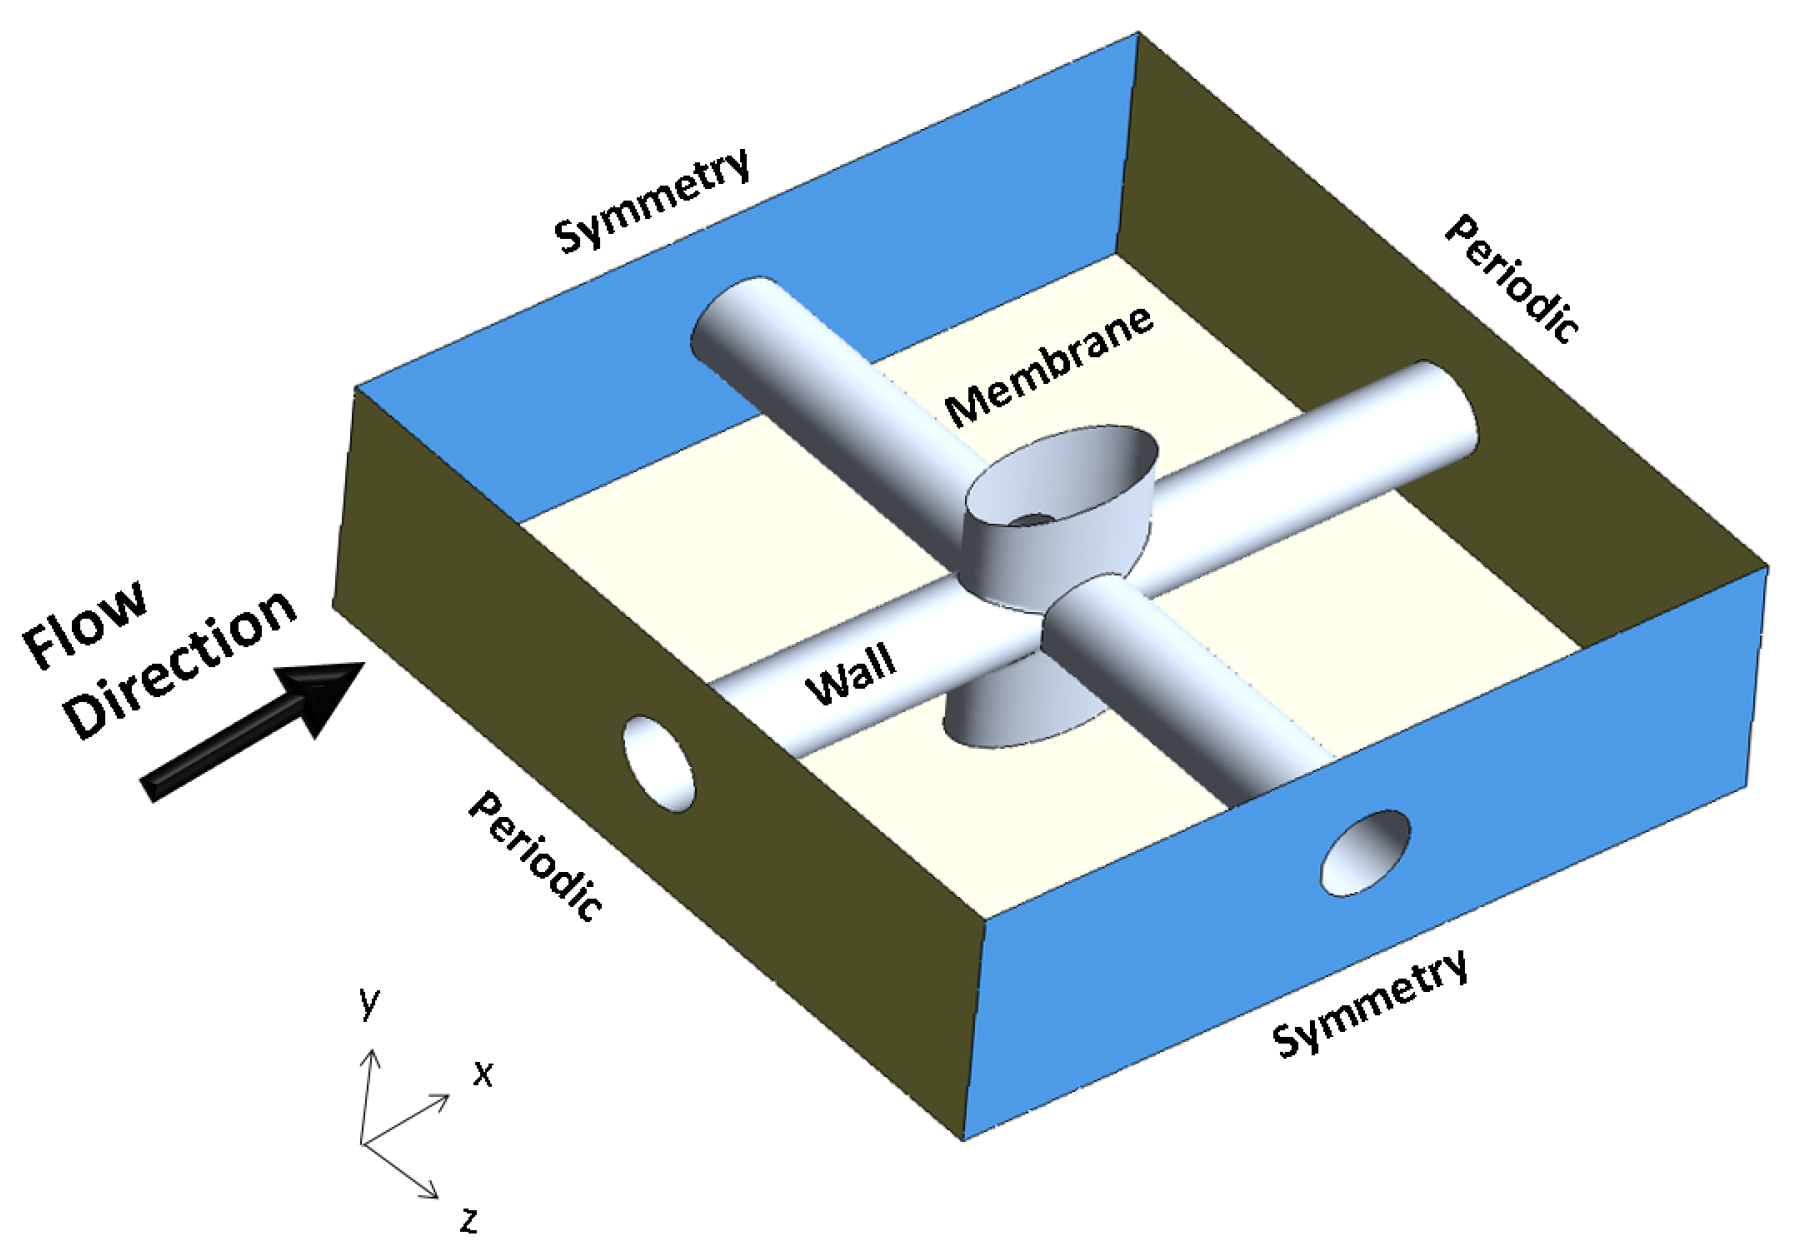
The middle region was chosen for the sake of simplicity as the study region (as shown in Figure 2). In most RO applications, the permeation velocity has no significant effect on the flow structure in the channel, and in industrial membrane processes, the permeate rate is no more than 0.5% of the total cross-flow velocity in the feed channel. For this reason, the membrane and feed spacer surface were set as a no-slip boundary condition and the assumption of a non-permeable wall was adopted; also, the velocity of the fluid on the surface was specified as zero in the CFD model. Thus, the spacer was explicitly defined as a solid object. The inlet and outlet cross-section were set as the periodic boundary as described in References [17,29]. The cross-section between two near elements was set as the symmetrical boundary as in Reference [30] (shown in Figure 3). The cylinder hydraulics diameter of the cross-section was fixed to compare the circle cross-section and the elliptic cross-section as outlined in Reference [31]. To enhance the porosity, the diameter of the connecting filament was decreased, and five kinds of geometry were considered in this study (as shown in Figure 4). In most real cases, the flow through the spacer-filled modules falls in the Reynolds number category where the flow is steady and laminar [32]. The standard laminar model was applied following the literature recommendation to simulate flows below a Reynolds number of 300 in the laminar flow regime through the solution of continuity, as in Reference [33]. Given the simplified simulation, fluid was assumed to be Newtonian and incompressible, and, therefore, no salt source was considered.
2.2.2. Simulation of Flow Patterns
The flow of a Newtonian fluid in the spacer-filled channel was modelled by Navier–Stokes and continuity equations. The simulation equations are listed below:
The channel porosity is
where VSpacer is the feed spacer volume, and VTotal is the channel space volume in which the mean flow was separated. The hydraulic channel Reynolds number as in Reference [2] is
where ρ is the water density, Uave is the average velocity that flows in the spacer-filled channel, where Uave is calculated by dividing the superficial velocity (for the empty channel) by the porosity, (Uave = Usup/ε). μ is the water kinematic viscosity. The definition of the Reynolds number was used in the results of friction factor and dimensionless power number. The channel hydraulic diameter, as a geometrical parameter that is dependent on the d/a ratio and is close to the filament drag, can be defined as in Reference [2]
where the computational volume is the total volume of the element cell. Wet surface area was included in the surface of the spacer and the membrane. Pressure drop can be expressed via the friction factor described in References [34,35].
where Δp is the pressure drop in the channel and ΔL is the element length.
Shear stress on the membrane’s surface is important to lower the concentration polarization and enhance the mass transfer. The modified friction factor employed to select the best feed spacer for mass transfer efficiency was used as the method to analyze shear stress on the membrane in comparing five group data as in Reference [16].
The modified friction factor for the area average shear stress is represented as in Reference [16]
where τwall is the average shear stress on the membrane surface. All other quantities in the equations are known and constant quantities.
2.2.3. Model Solution
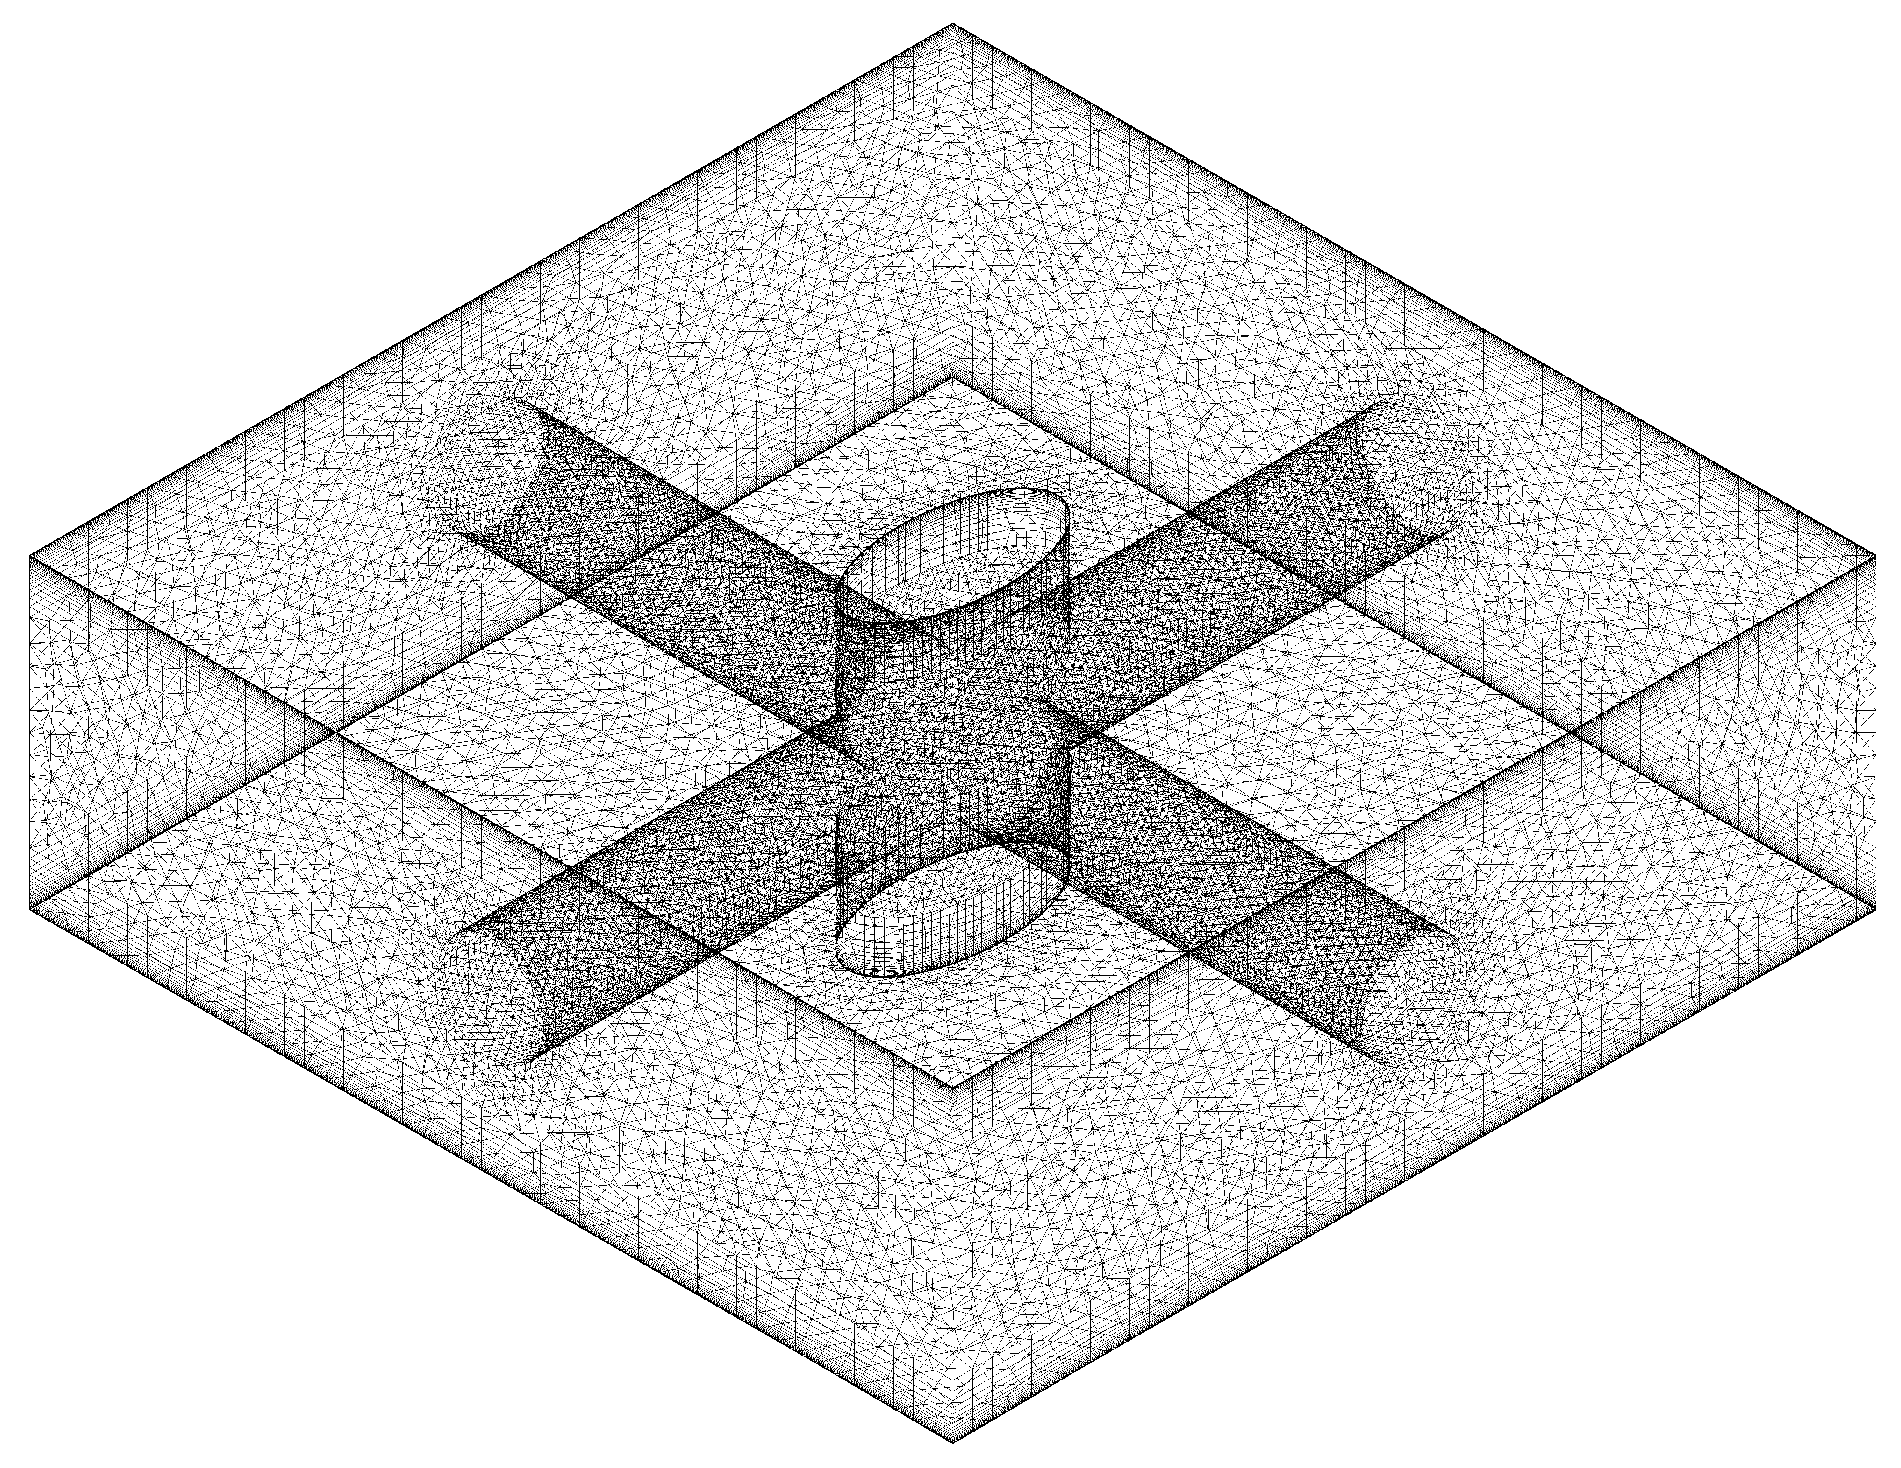
Navier–Stokes equations (REF) were solved in ANSYS-CFX (v18.1, ANSYS, Inc. Cecil Township, Pennsylvania, United States, www.ansys.com), with the finite volume method on the tetrahedral mesh (shown in Figure 5) being generated by the ANSYS-CFX automatic mesh generator. Tetrahedral elements were the main elements of the fluid simulation, where Haaksman et al. also generated the same kind of mesh in a simulation [23,28]. Picioreanu et al. [37] also used tetrahedral elements for the finite element solution in three-dimensional application modes. In Figure 5, the mesh quality of the boundary layer is illustrated. The grid sizes varied from 89,823 to 134,003 min nodes for the different channel porosities. The mesh was refined near the membrane surface of the boundary layer simulation, and the mesh was expanded away from the membrane. The near-wall node on the membrane was at a distance of 0.2 mm. The thickness of the first mesh element layer was below 1% of the channel height as in Reference [38]. The mesh independence of the solution was checked to ensure that there were sufficient cells in the boundary layer.
3. Results
Significant quantitative characteristics of the pillar-like feed spacer are presented herein. The results of this study were obtained from direct numerical simulation techniques. To investigate the flow pattern, water was taken as a bulk flow in this study. The Reynolds number up to 200 and the filament spacing 4 resulted in a moderate pressure drop and higher values of the mass transfer coefficient as reported by Asim Saeed et al. [35]. Ranade et al. [39] indicated that, in most of the spacer-filled channels, the transition from the laminar to turbulent flow regime occurred at Reynolds numbers of 300–400 for packed beds. In Shakaib et al. [40], the simulation for the onset of unsteady flow took Reynolds numbers from 100 to 300. Haaksman et al. [23] observed differences in the experiment and model results, where the Reynolds number was from 125 to 200. In the current study, four different flow rates were relayed with average inlet velocities of 0.01 m·s−1, 0.02 m·s−1, 0.04 m·s−1, and 0.06 m·s−1, yielding a Reynolds number ranging from 30 to 250 when running the CFD simulation. To validate the present work for simulating the character of the pillar-like feed spacer, the results of the basic dimensionless parameters friction factor, the dimensionless power number, and the modified friction factor, which have been used in other studies, were compared with the results of previous studies on the empty channel and conventional spacers. From Equation (3), the Reynolds number depends on the hydraulic diameter, which is related to the filament surface defined by the ratio d/a. Therefore, the Reynolds number was selected by comparing the energy consumption. The comparison of the shear stress was performed by selecting the same energy consumption, where the dimensionless power number was equal to 106, and commercial spacers were added to compare the inclination of the modified friction factor. Two types of commercial spacers were used (Conwed Plastics, Minneapolis USA), as mentioned in Haaksman et al. [23], for comparative purposes.
3.1. Porosity
Channel porosity is the ratio of the empty volume to total volume. Channel porosity can be applied to estimate filament dimension and feed spacer mesh size. Feed spacer volume can be measured by the feed spacer weight or feed spacer density using the experimental method. However, the geometry parameters of the feed spacer have been measured using a microscope in most of the experimental studies [41]. The channel porosity can be calculated using Equation (2). In the present work, a different element length meant a different porosity of the feed channel, and the value was higher than in other feed spacer studies, where the maximum value of the porosity measurement was 0.906 as reported by Siddiqui et al. [42]. In this study, the porosity value of the elliptic cross-section was from 0.928 to 0.979, as shown in Figure 4.
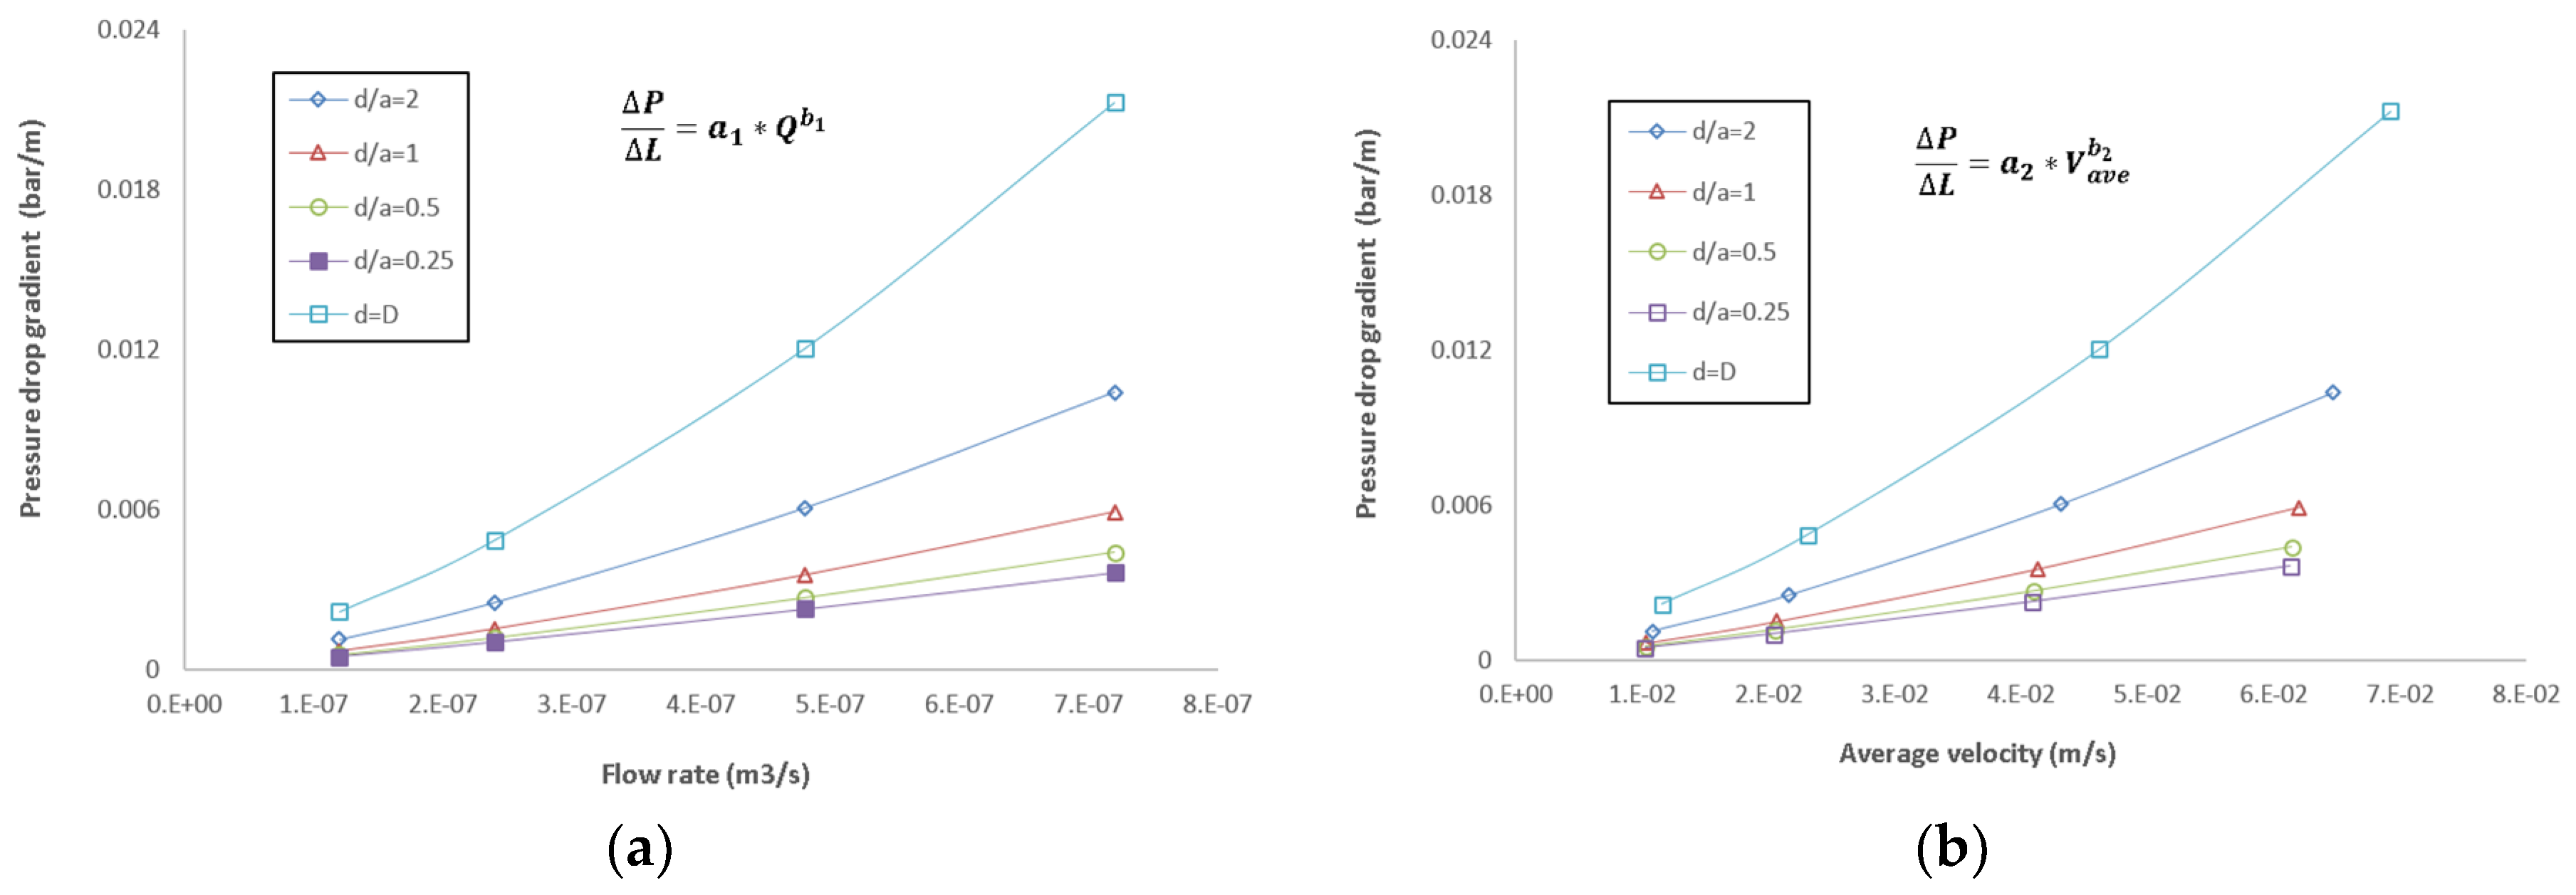
The viscous drag on the feed channel walls and the feed spacer form the drag of the feed spacer, and the kinetic losses determine the pressure drop through directional flow change in a spacer-filled channel [43]. The average velocity influences the flow change, where Da Costa et al. [44] reported on the relationship between pressure and average velocity and gave the parameter “m” result in the laminar and turbulent flow.
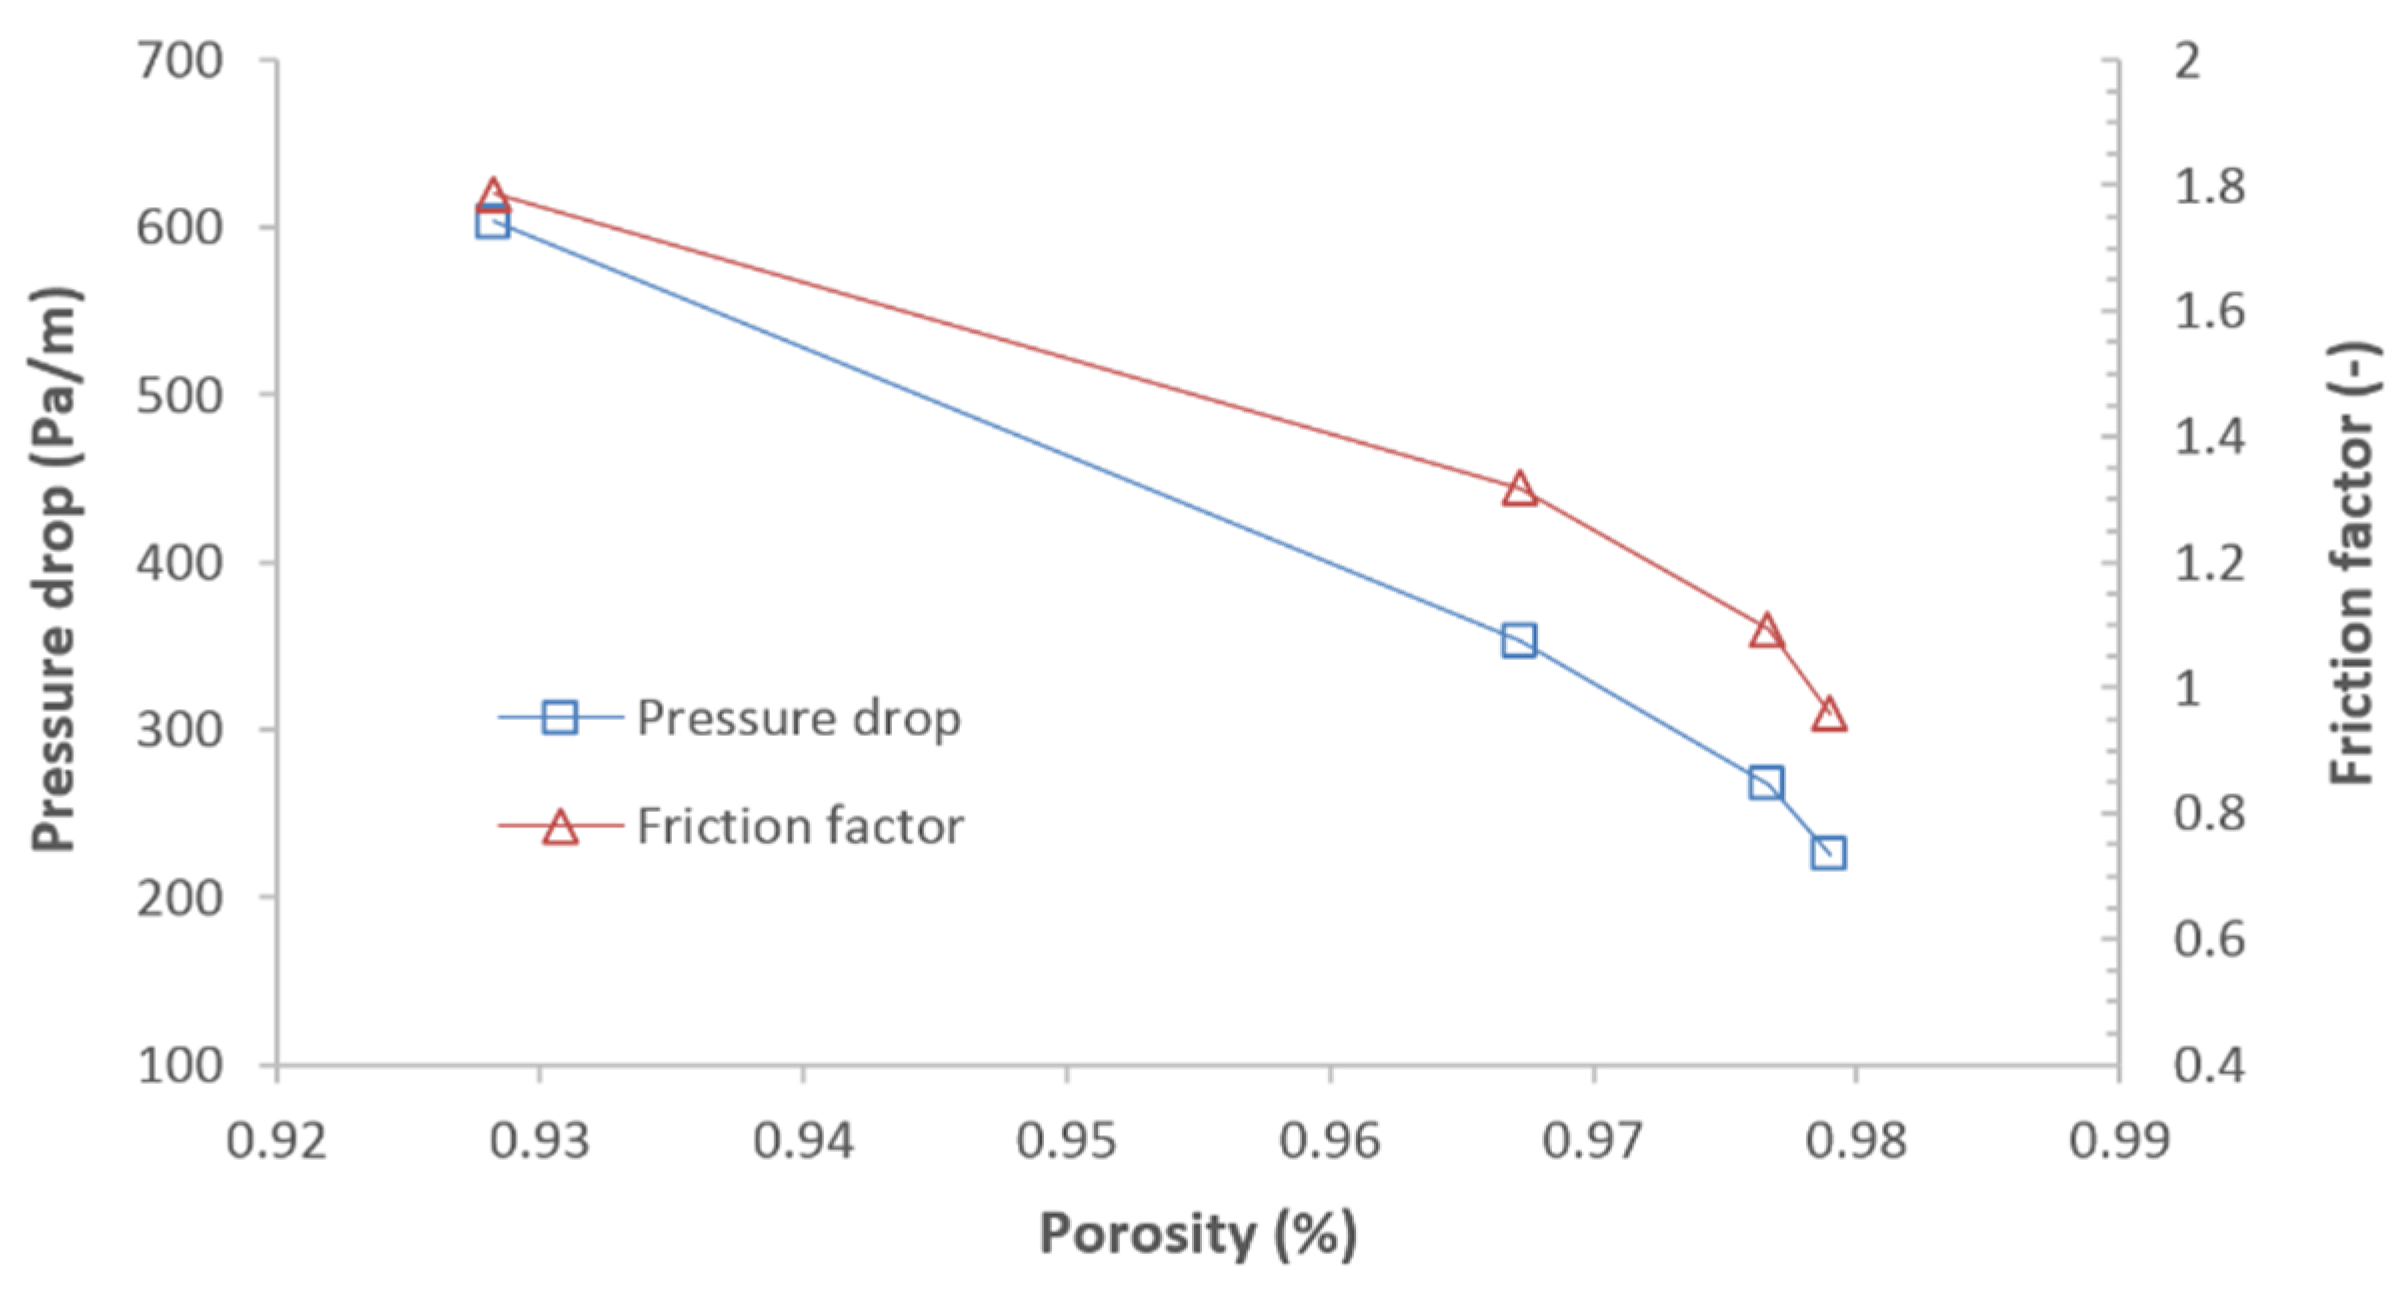
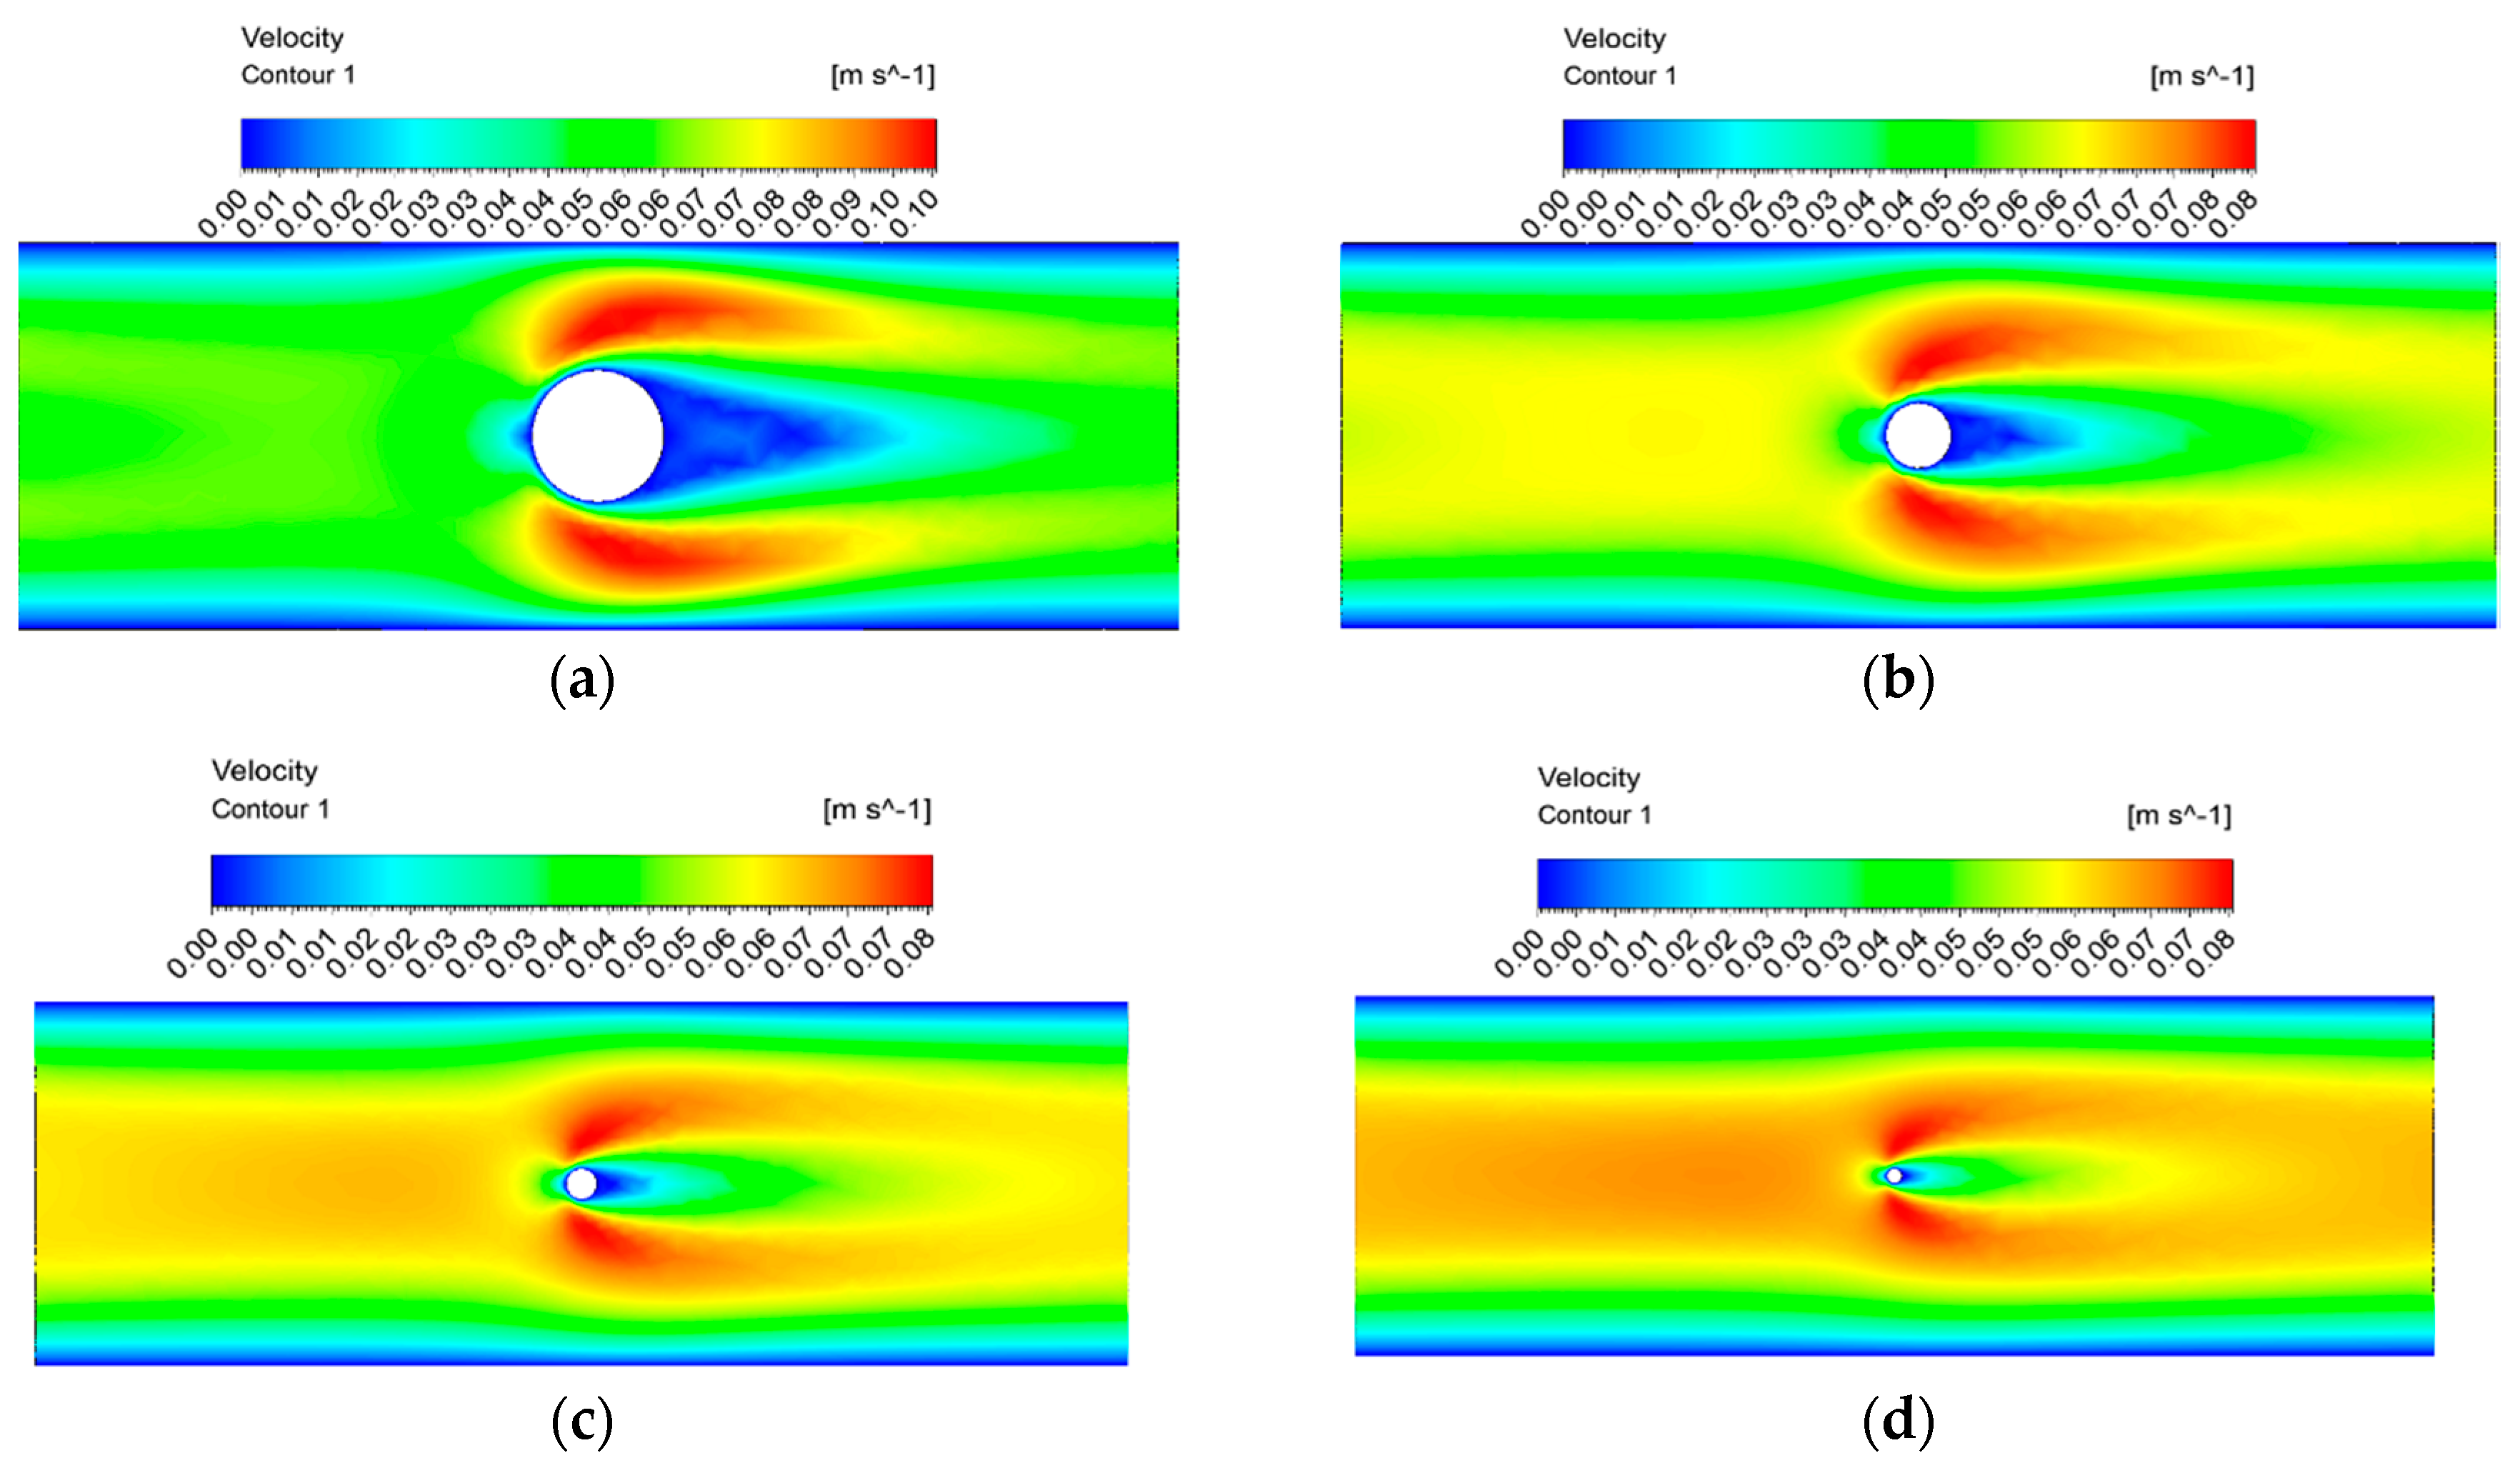
In this study, the pressure drop per unit of channel length, affected by the flow rate () and average velocity, increased as deduced in Figure 6. Haidari et al. compared the pressure drop in the spacer-filled and empty channels, and the results are listed in Table 1 [11]. The changing inclinations of the pressure drop gradient were simulated in the results by Haidari et al. The equation parameter values were between the spacer-filled channel and the empty channel. The lower porosity was accelerated with the gradual increase of the pressure drop. In Figure 7, the inlet velocity was set at 0.04 m/s (a constant flow rate was selected to clarify the inclination of the pressure drop and friction factor), and the pressure drop decreased with the increase in porosity, and this inclination was in agreement with previous studies [42,43]. In comparison, the channel porosity increased by 5% and the pressure drop reduced by 62.56%. At a high channel porosity, the pressure drop approached that of the empty channel. As shown in Figure 8, a higher diameter of the connecting filament or a lower channel porosity generated a bigger shadow region behind the transverse filament. It is important to note that the friction had a closer relationship with the filament drag from the feed spacer than the surface of the membrane. Furthermore, the pressure drop depended on the friction in the middle of the channel. That was the reason for the decrease in the connecting filament diameter generated by the lower pressure drop.
3.2. Friction Factor and the Dimensionless Power Number
The pressure drop in the SW membrane channel directly reduces the total transmembrane pressure that acts on the membrane surface. A driven pump has to maintain the transmembrane pressure; so, in the separation process, higher energy is required to compensate for the energy loss influenced by the pressure losses. To make comparisons across different feed spacer situations, the pressure drop can be expressed in terms of the friction factor. The friction factor is commonly employed as a dimensionless parameter to find the changing inclination for different Reynolds numbers. The relationship is presented as the following equation,
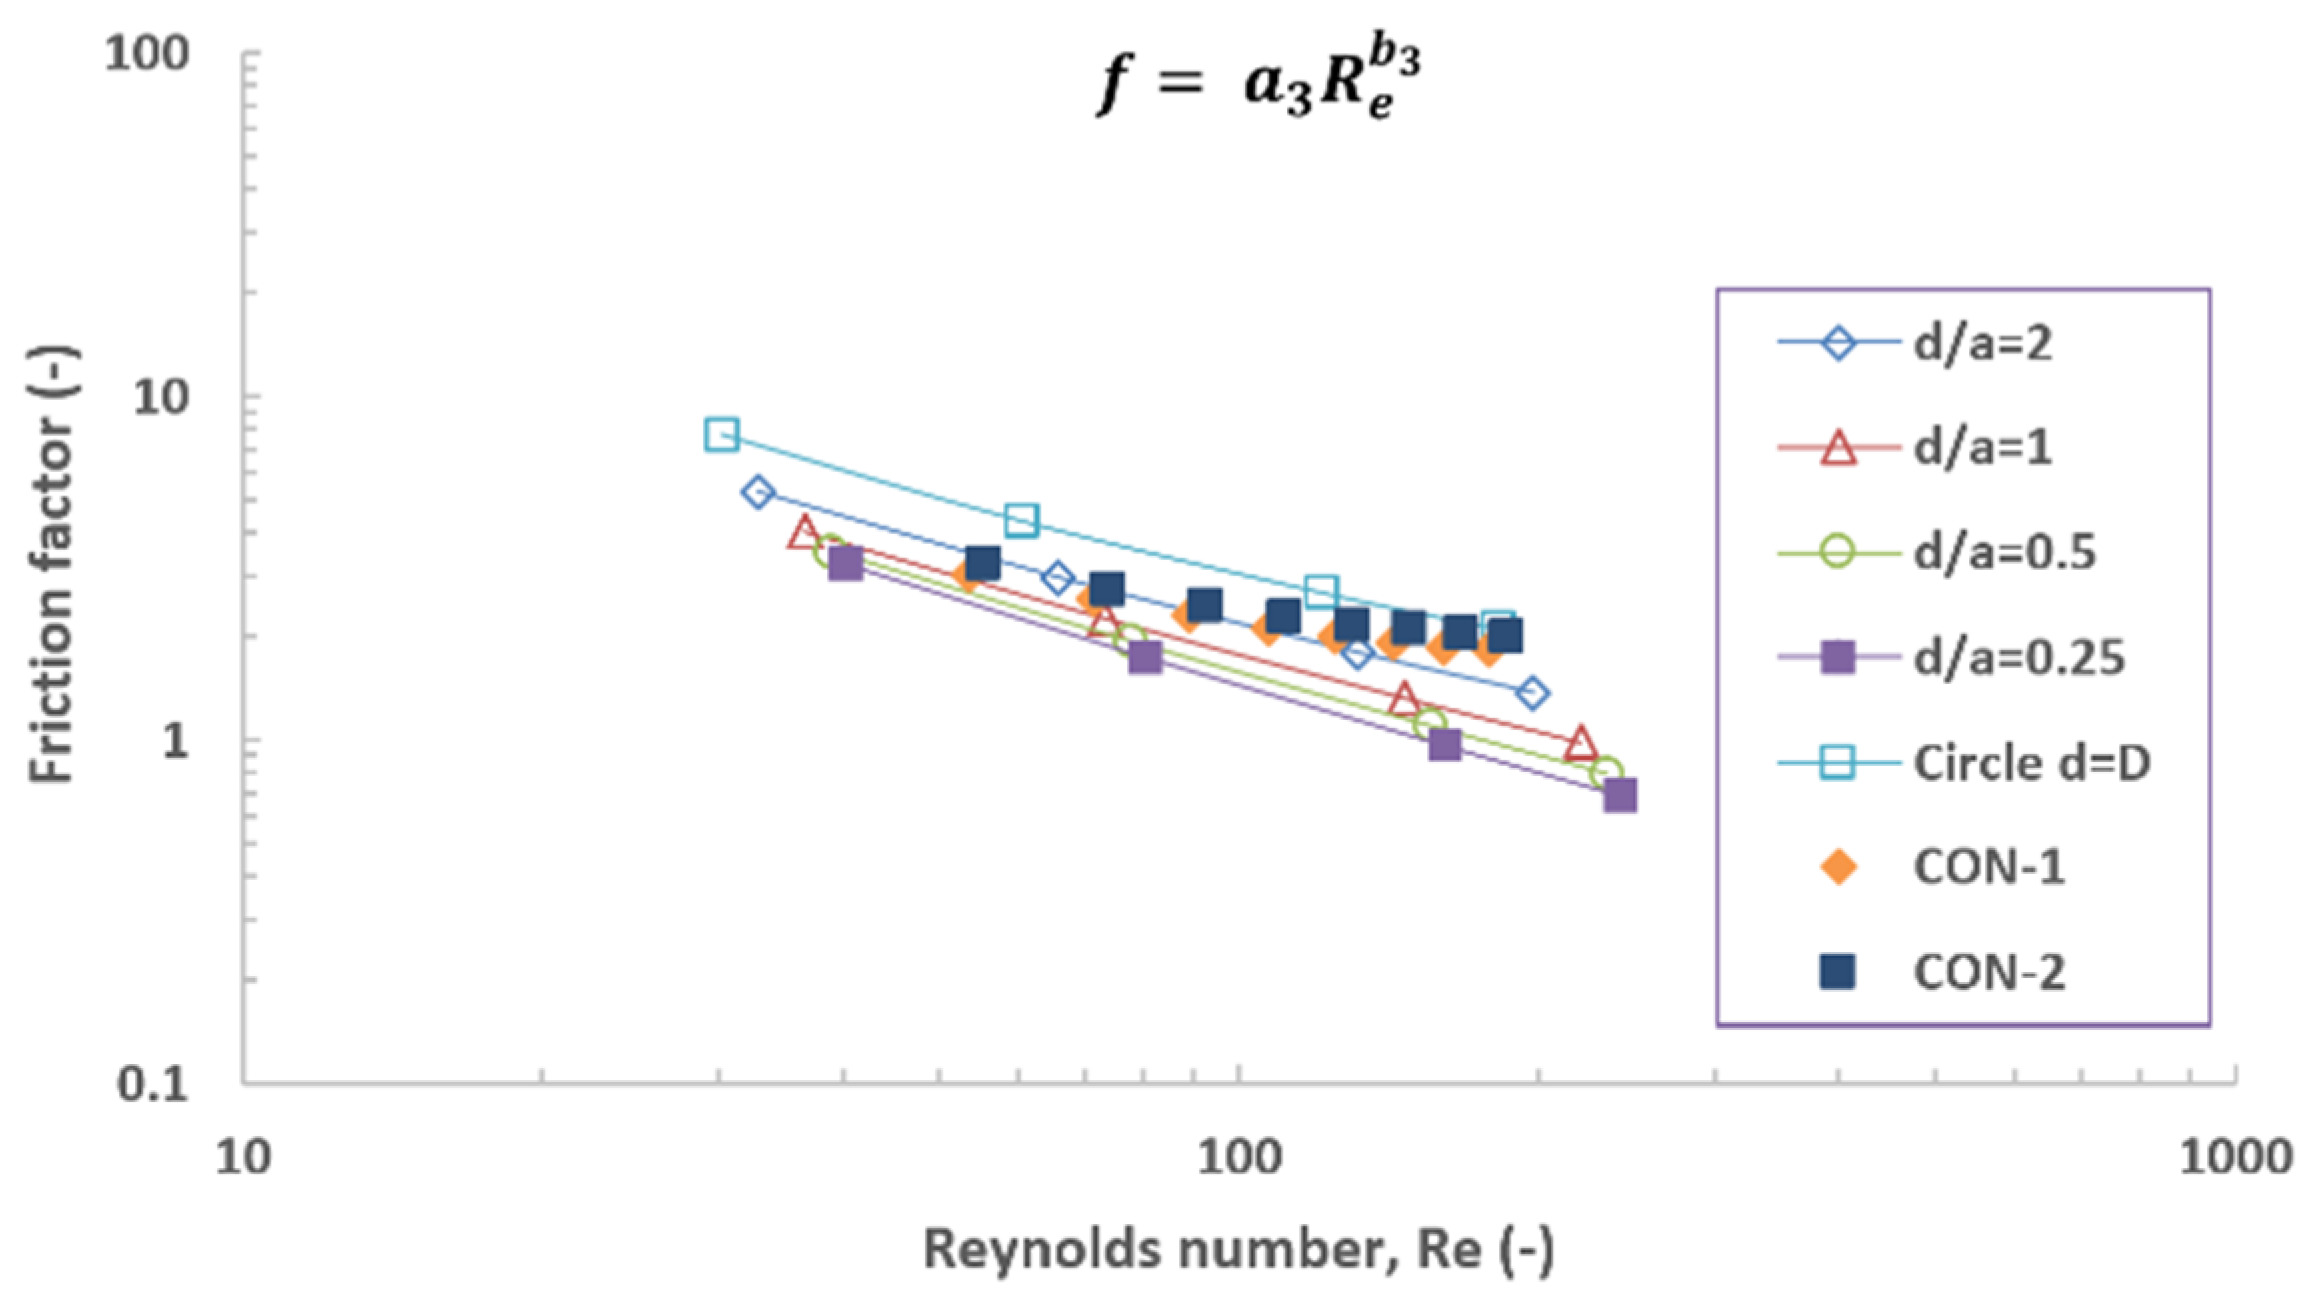
Figure 9 shows the friction factor generated by the feed spacer with different connecting filament diameters and different Reynolds numbers. Table 2 lists the results reported in the study by Schock et al. [2]. The pressure drop increased when the Reynolds number increased, but the friction factor decreased when the Reynolds number increased. As the connecting filament diameter decreased (the channel porosity was increased), the flow cross-section of the channel obstructed by the feed spacer decreased. The pressure drop and friction factor values were higher when the porosity was low. The friction factor decreased when the porosity increased; however, the amplitude gradually became smaller, as shown in Figure 7. Moreover, from the contours of total pressure shown in Figure 10, the higher filament diameter generated a higher friction factor linked to the filament drag, and this was described as the drag coefficient in previous studies [45,46]. Moreover, the Haaksman et al. experimental friction factor results for the commercial spacers were added to Figure 9 [23]. The results of the current study tended to agree with results from the study by Haaksman et al. At the Reynolds number of 150, the pillar-like feed spacer d/a = 0.25 reduced by almost 43.63% compared to the commercial spacer CON-1. In the same group, the friction factor was lower than the commercial spacer CON-2 by almost 49.23% at the same Reynolds number.
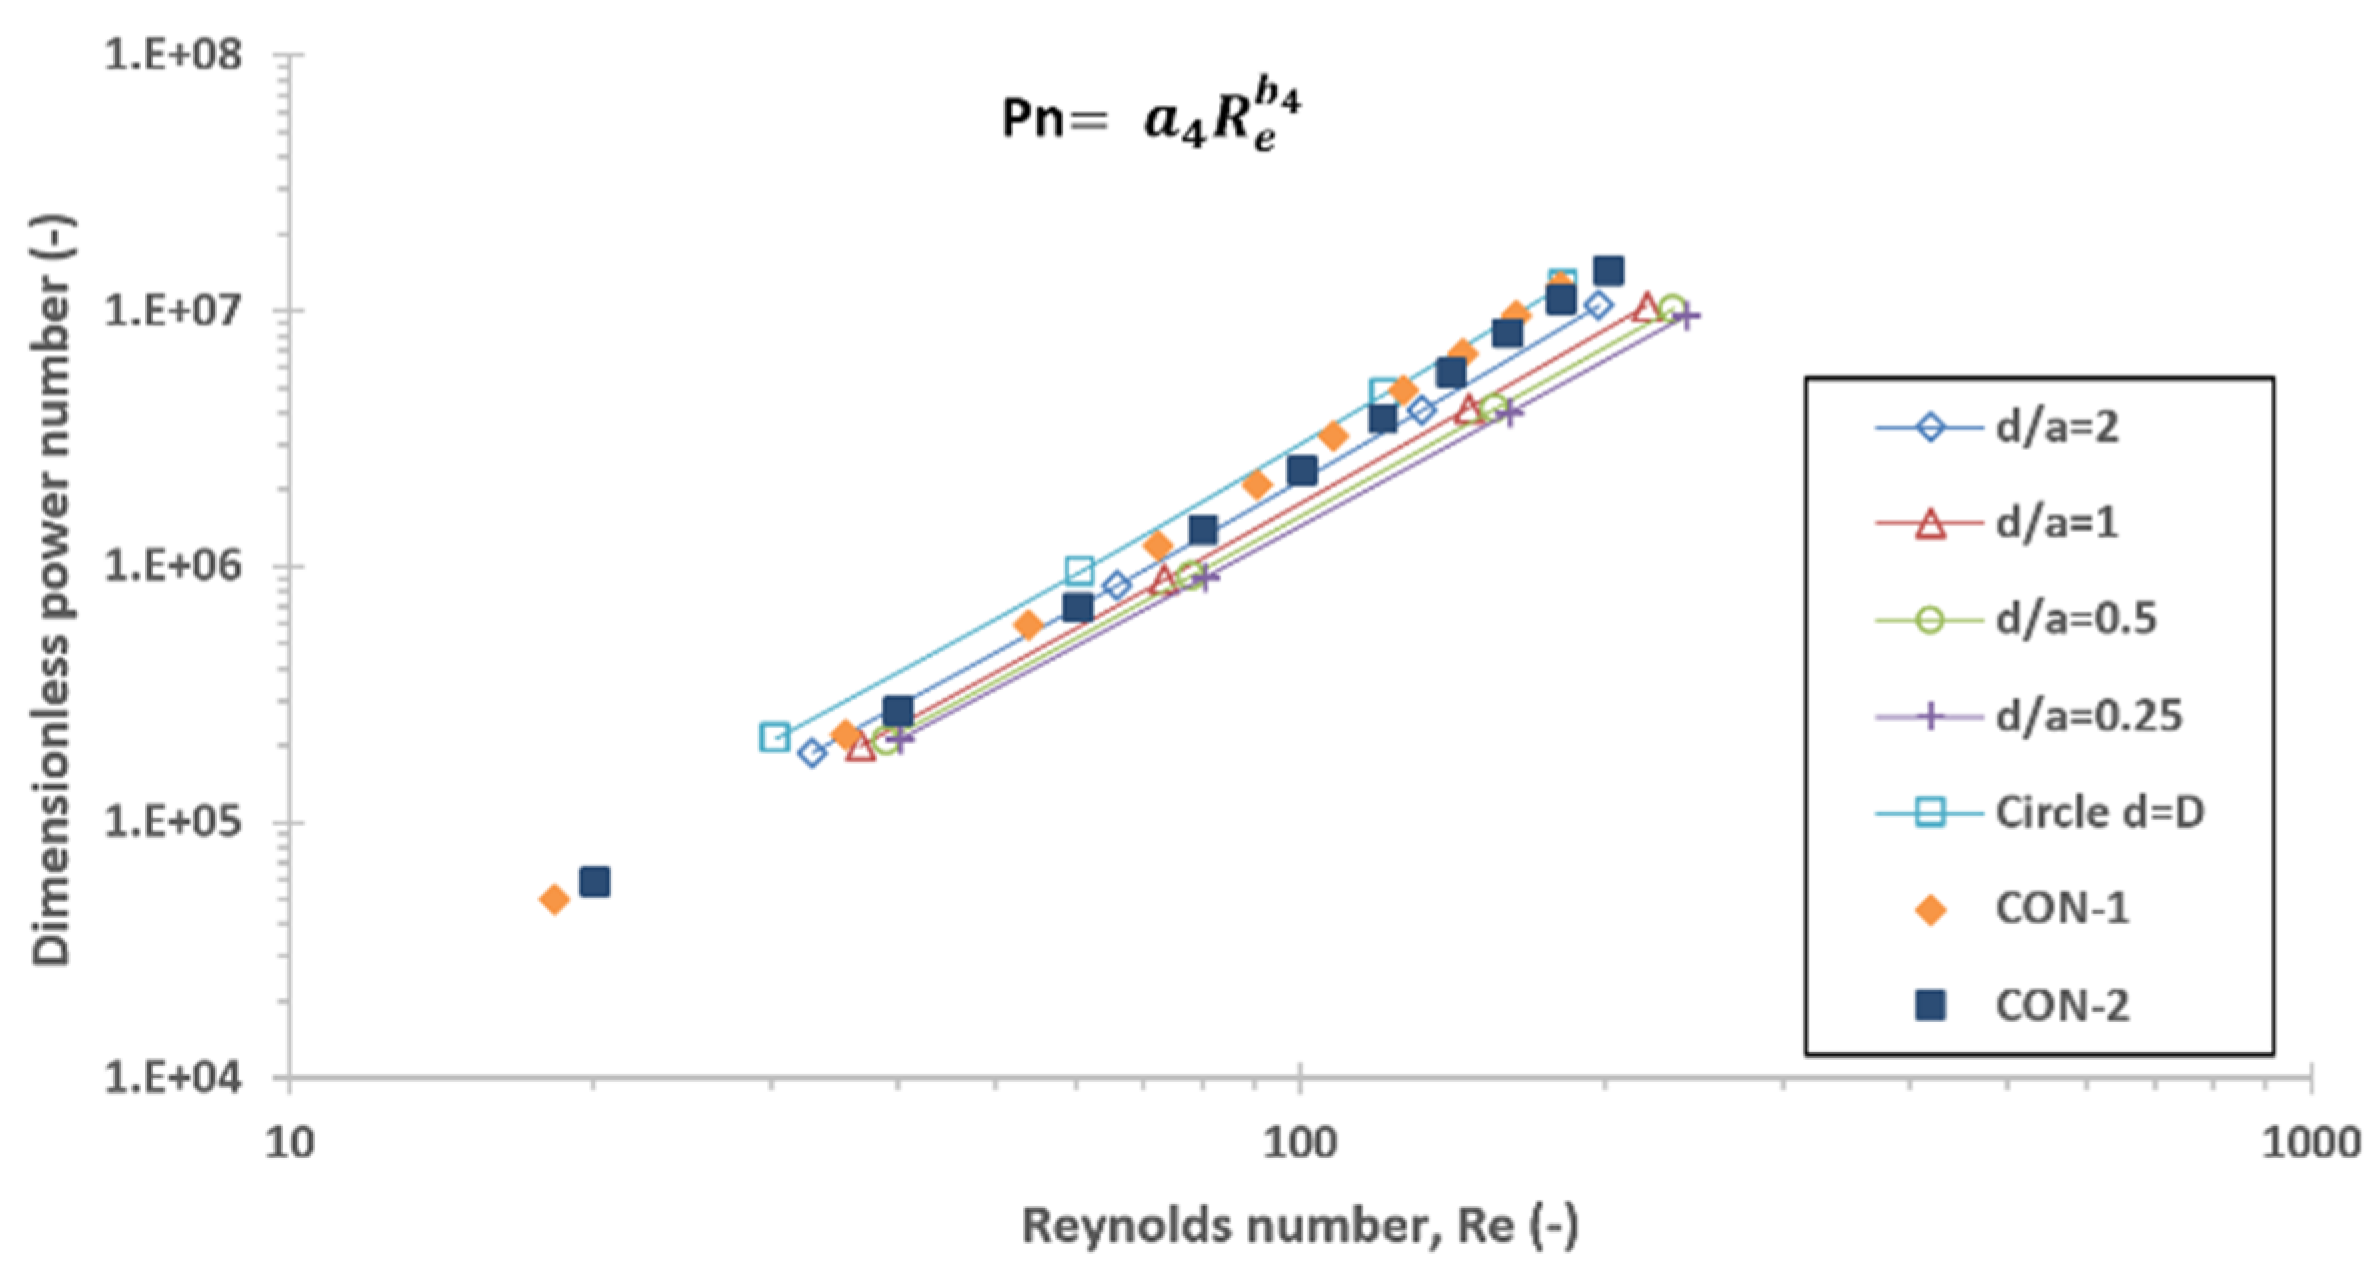
Besides the friction factor, the dimensionless power number has also been commonly employed to simulate the pressure drop through energy consumption. The dimensionless power number increased when the Reynolds number increased. However, like the friction factor, the dimensionless power number was stable versus the channel porosity. In the work by Koutsou et al. [27], the dimensionless power number reached 107 when the Reynolds number equaled 200. Figure 11 shows that for the feed spacer d/a = 2, the dimensionless power number value was in agreement with the value in the numerical simulation results of Koutsou et al. [27]. However, the dimensionless power number was lower as the d/a decreased, and the dimensionless power number was also lower with low porosity. The relationship between the dimensionless power number and the Reynolds number is presented as the following equation,
Figure 11 shows the dimensionless power number generated by the feed spacer with different connecting filament diameters for different Reynolds numbers. From Equation (6) and Equation (10), the parameter a3 = a4, b4 = 3 + b3. Li et al. reported experimental empty channel results on this relationship [47]. The pillar-like feed spacer results were compared with the results from Li et al. (which are listed in Table 3). The a4 and b4 were higher than the empty channel due to the hydraulic resistance from the spacer filament drag.
The results of Haaksman et al. [23] on the dimensionless power number of the commercial spacer were also added for comparison in Figure 11. The results of the current study tended to agree with the results of Haaksman et al., where the friction factor decreased when the Reynolds number increased, although more quickly, and the dimension power number increased when the Reynolds number increased, although more slowly. The minimum group d/a = 0.25 friction factor was lower than the commercial spacer CON-1 by almost 52.93% at the Reynolds number of 150. In the same group, the dimensionless power number was lower than the commercial spacer CON-2 by almost 47.31% at the same Reynolds number.
The porosities of CON-1 and CON-2 were 0.855 and 0.866, respectively [23], and for the group filament conjunction with the circular cross-section d = D, the porosity was 0.867. The value of the friction factor and the dimensionless power number approached those of CON-1 and CON-2 at a higher Reynolds number. This inclination indicated the effect of the filament drag on the energy consumption shown as channel porosity.
3.3. The Modified Friction Factor
RO membrane fouling relates to the hydrodynamics adjacent to the membrane surface. Even a new biomass attachment is dependent on the distribution of shear stress on the walls. An analysis of the wall shear stress was key to understanding the effect of hydrodynamics in the membrane wall region. Wall shear stress, τ, was indicated by the relation of the velocity shear rate τ = μdu/dy at the laminar flow. In this study, the wall shear stress simulation comparison for the different feed spacer structures was considered by comparisons of the wall shear stress contours and the modified friction factor’s application.
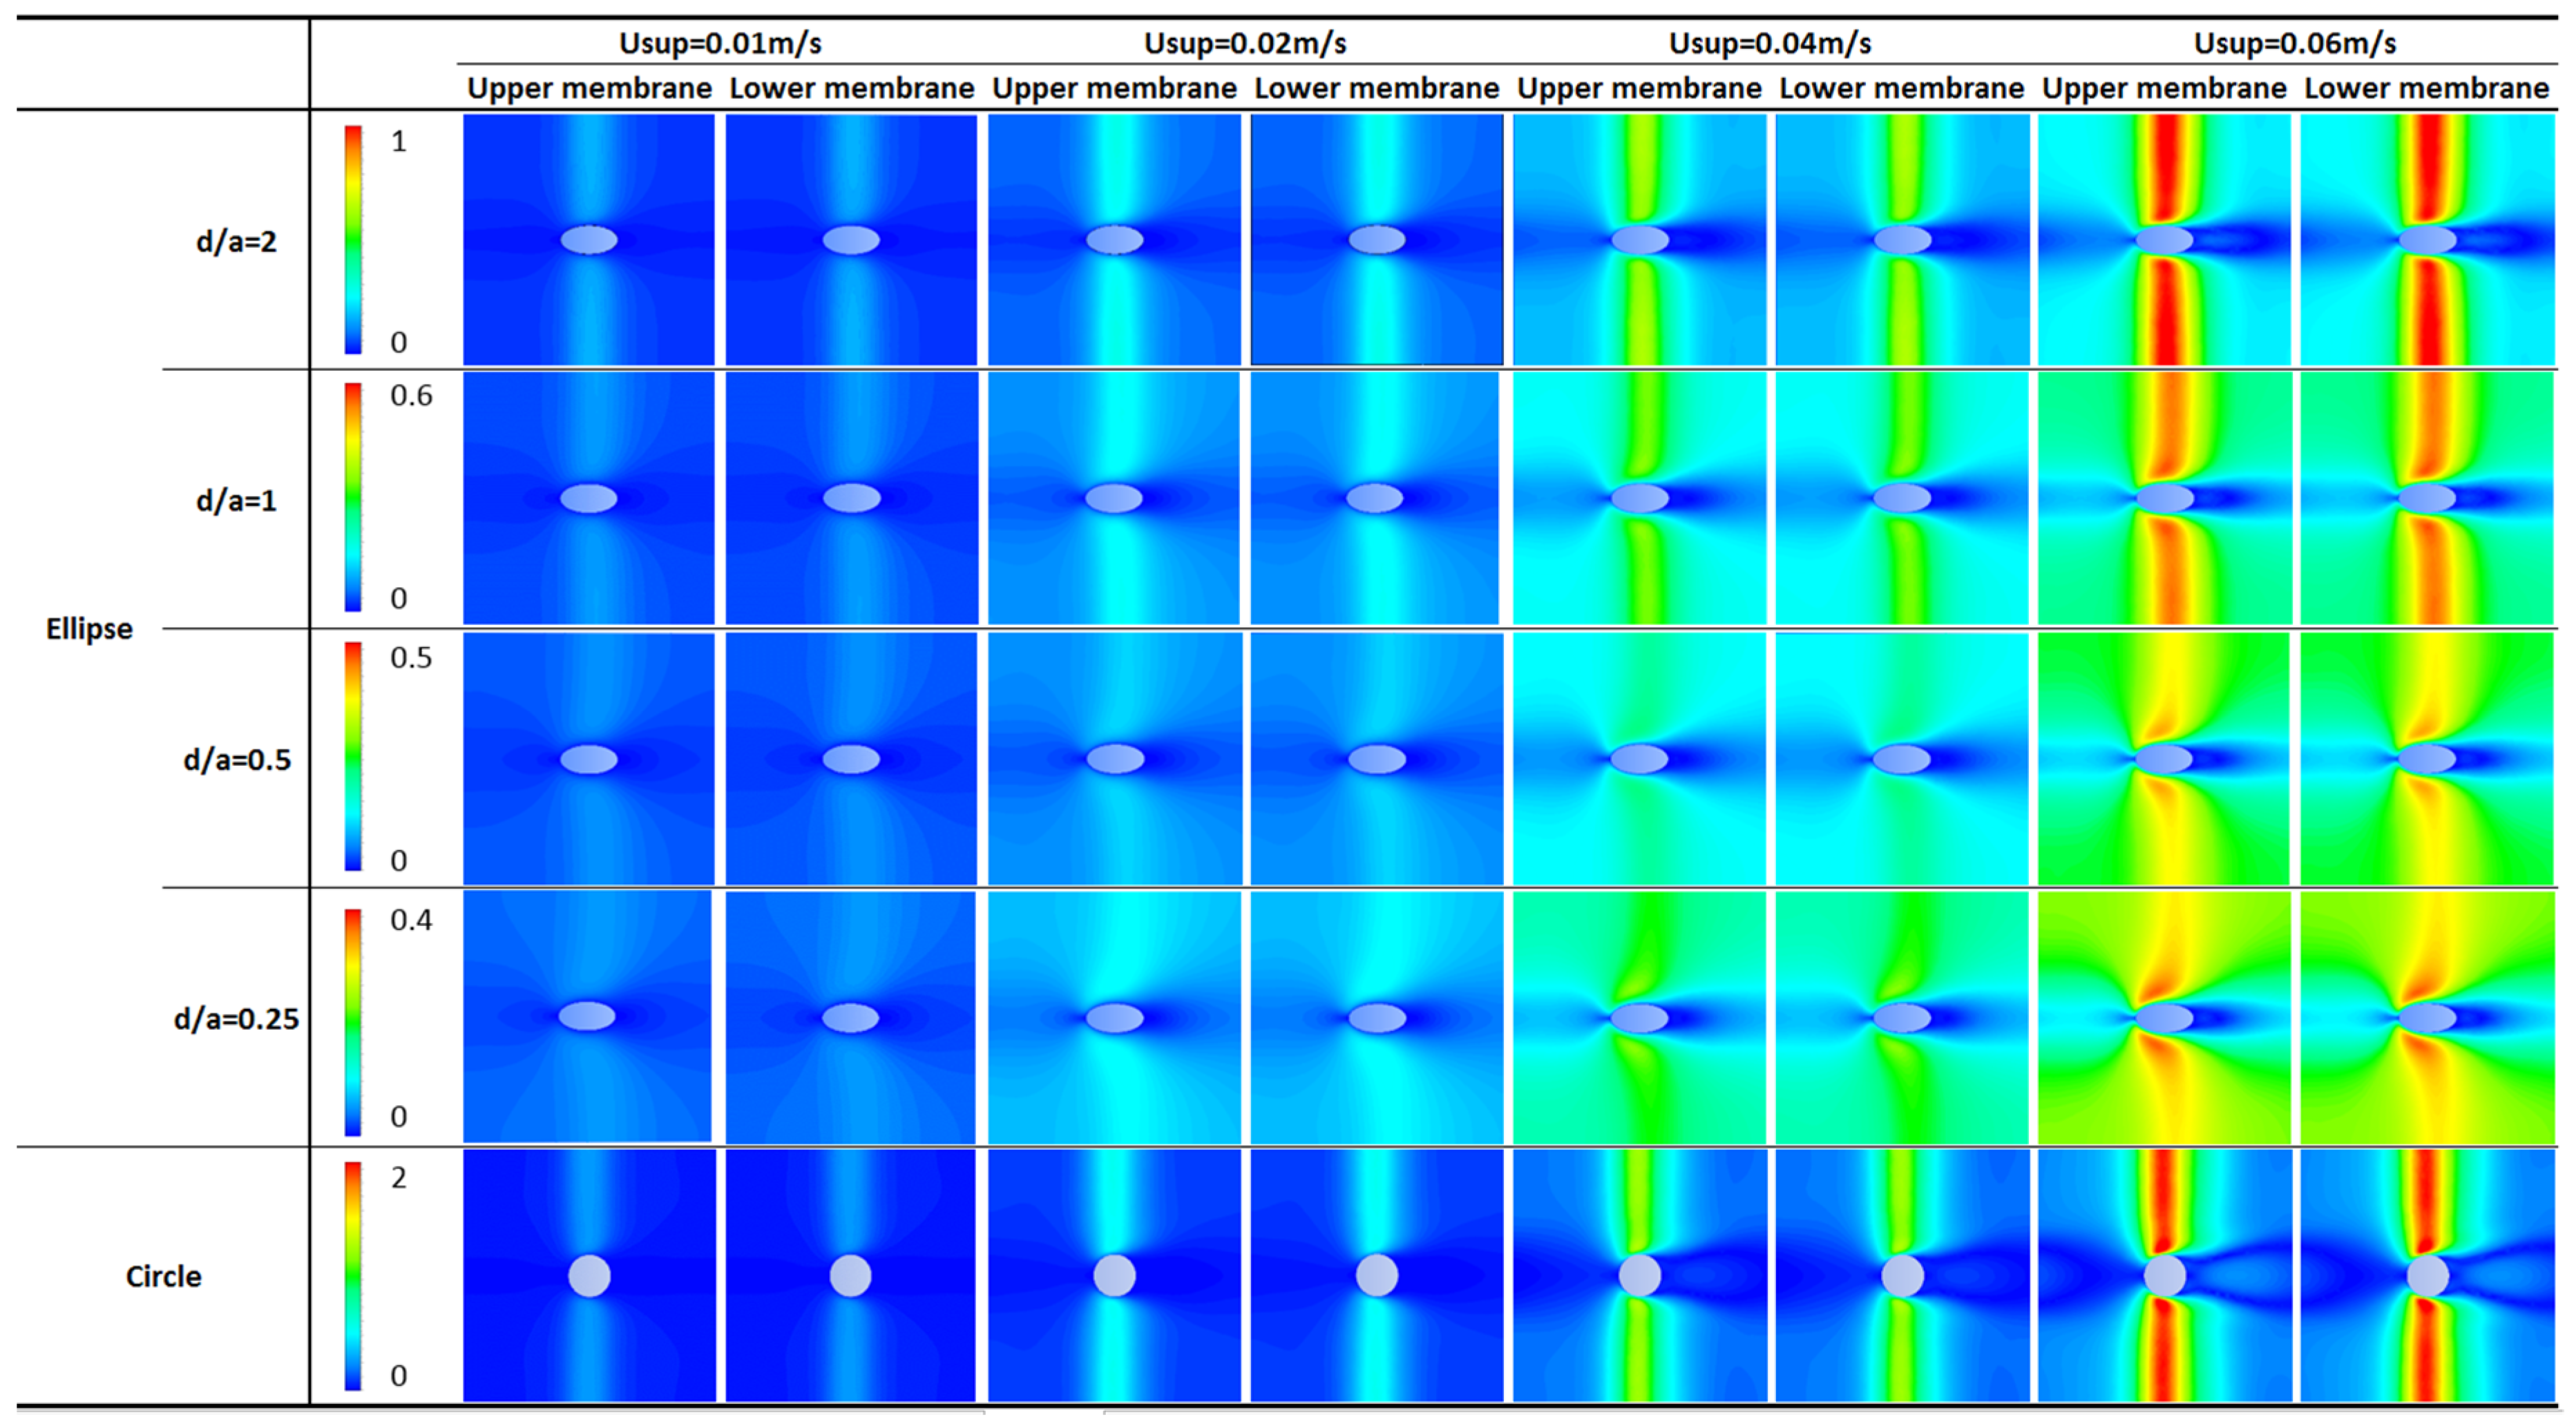
The area average wall shear stress profiles were visualized by a two-dimensional (2D) contour plot from the 3D model. Figure 12 depicts the 2D contour plot of the wall shear stress on the upper membrane and lower membrane for the super velocities 0.01 m·s−1, 0.02 m·s−1, 0.04 m·s−1, and 0.06 m·s−1 at different diameters of connecting filament. As a tool for statistical validity, the distribution of shear stress was shown under different super velocities and porosities, as shown in Figure 12. Changes in the different Reynolds numbers and different porosities were concluded as follows:
- Based on the contour plot, the upper membrane and the lower membrane exhibited small differences in the wall shear stress profiles of the symmetric structure of the pillar-like feed spacer.
- From the color of the wall shear stress contours with a high Reynolds number, the wall shear stress was higher than with a low Reynolds number.
- It was obvious that a high channel porosity generated a low area average wall shear stress.
- High connecting filament diameters generated high wall shear stress focused on the membrane surface region above and below the connecting filament through its compression.
- The existence of high hydrodynamics on the upper membrane and lower membrane walls with an increasing Reynolds number enhanced the concentration reduction ability.
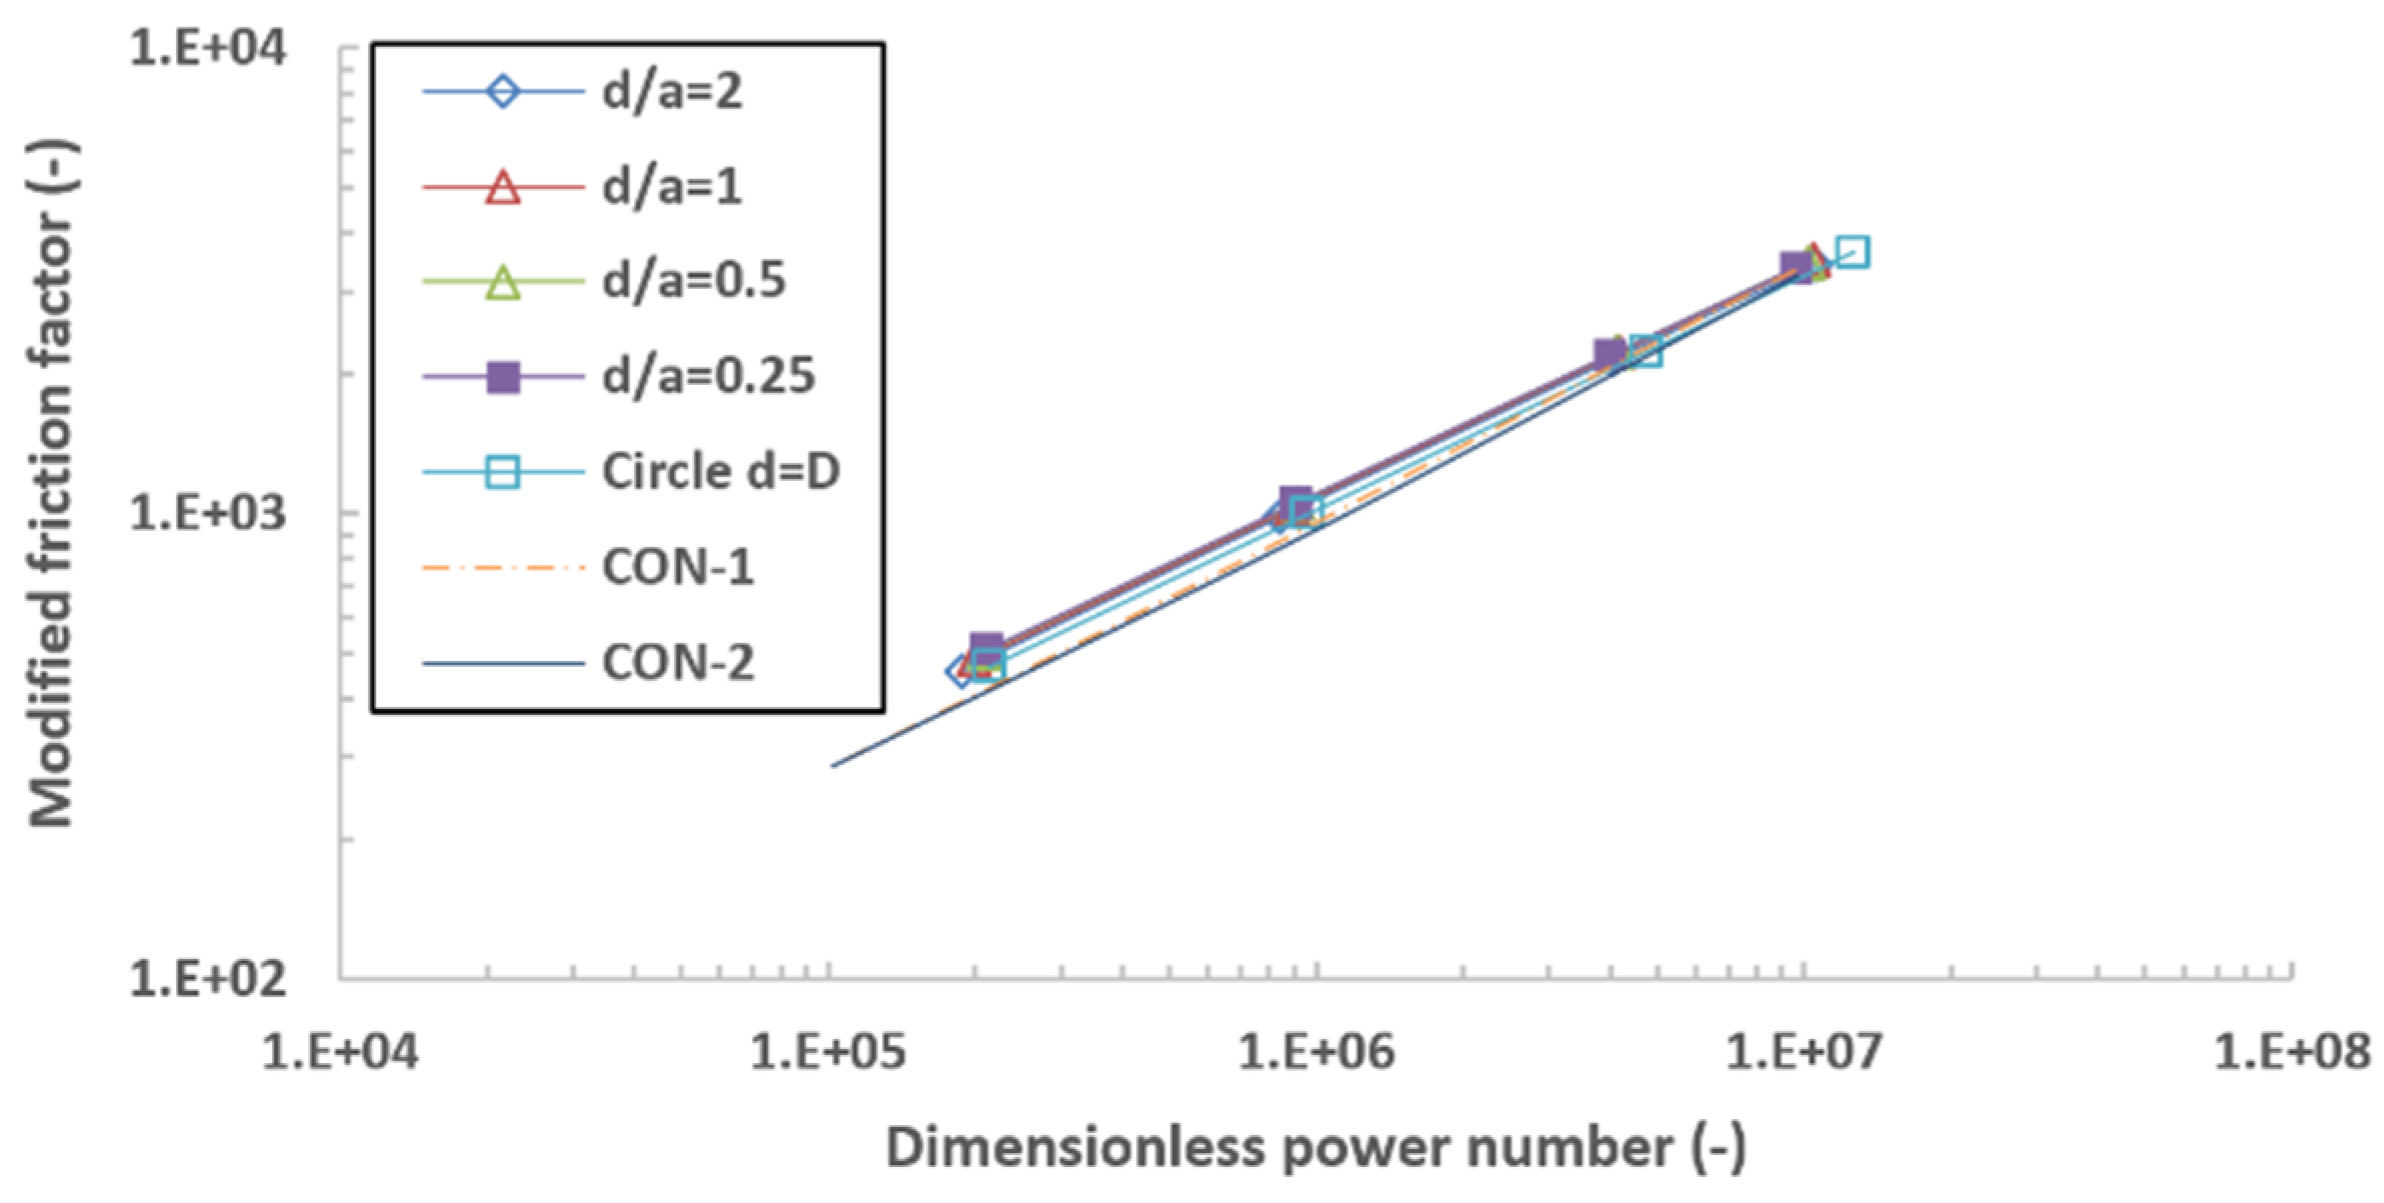
The modified friction factor was computed under the plot in Figure 12. As a function of the dimensionless power number, the modified friction factor was illustrated in Equation (7). Santos et al. [4,16] reported that the modified friction factor was slightly higher than 103 when the dimensionless power number approached 106. Vicktor et al. [23] issued a similar report detailing that, when the dimensionless power number was close to 106, the modified friction factor was approximately 103. Additionally, compared to the Haaksman et al. results that were added in Figure 13, the current study’s results on the modified friction factor agreed with the results of Haaksman et al.; however, the value of the modified friction factor was higher. As the dimensionless power number reached 106, the modified friction factor was enhanced by almost 20.40% and 22.27% compared to the commercial spacers CON-1 and CON-2, respectively.
4. Conclusions
- -
- To lower the obstacle effect from the feed spacer in the SW Membrane feed channel, the support from the high porosity of the feed spacer structures with a small filament diameter was indispensable. The pillar-like feed spacer was introduced as a new template to manipulate energy consumption. Under laminar flow conditions, the element of the feed spacer between membrane envelopes was simulated using the CFD method. Subsequently, the simulation parameters were compared and validated with previous works. The main research findings revealed that, regarding the pressure drop, the decline in the connecting filament diameter of the pillar-like spacer and the rise in channel porosity reached 0.979. The inlet velocity was set at 0.04 m/s (at a constant flow rate), the channel porosity increased by 5%, and the pressure drop reduced by 62.56%. Compared with the results of previous works on conventional spacers and an empty channel, the current study’s results on the pressure drop tended to be in agreement with them.
- -
- For the friction factor, based on the numerical predictions, the results for the dimensionless power number and the modified factor agreed with previous conventional spacer results. At the Reynolds number of 150, the group d/a = 0.25 friction factor reduced by almost 43.63% and 49.23% compared with the commercial spacers CON-1 and CON-2, respectively, and the dimensionless power number was lower than the commercial spacer CON-2 by almost 47.31% at the same Reynolds number for the same group.
- -
- Regarding the shear stress, homogenization of distribution changed the flow profile close to the membrane. At the dimensionless power number 106, the modified friction factor was enhanced by almost 20.40% and 22.27% compared to the commercial spacers CON-1 and CON-2, respectively.
Future studies are needed to assess the impact of fouling on the optimal filament cross-section selection, and to also validate the robustness and rigidity of the pillar-like spacer.
Author Contributions
Conceptualization, Z.H.; Methodology, Z.H. and M.T.; Software, Z.H.; Validation, Z.H., M.T. and H.Y.; Formal Analysis, Z.H.; Investigation, Z.H.; Resources, M.T. and H.Y.; Data Curation, Z.H., M.T., B.L. and H.Y.; Writing-Original Draft Preparation, Z.H.; Writing-Review & Editing, Z.H. and B.L.; Visualization, Z.H.; Supervision, M.T. and H.Y.
Conflicts of Interest
The authors declare no conflict of interest.
Nomenclature
| a, b | the semi-major axis and the semi-minor axis of the intersection elliptic cross-section (m) (shown in Figure 2) |
| a1, a2, a3, a4, b1, b2, b3, b4 | the parameter in function (-) (shown in Figure 6, Figure 9 and Figure 11) |
| d | diameter of feed spacer filaments/cylinders (m) |
| D | circular intersection diameter (m) |
| DH | the channel hydraulic diameter (m) (defined in Equation (3)) |
| f | friction factor (-) (defined in Equation (4)) |
| fwall | the modified friction factor (-) (defined in Equation (6)) |
| hf | height of feed channel (m) |
| ΔL | the element length (m) |
| P | pressure (Pa) |
| Δp | the pressure drop (Pa) |
| Pn | the dimensionless power number (-) (defined in Equation (5)) |
| Q | flow rate |
| Re | Reynolds number (-) (defined in Equation (2)) |
| Recyl | cylinder Reynolds number (-) (defined in Equation (1)) |
| Uave | average velocity (m·s−1) |
| Usup | superficial velocity (m·s−1) |
| VSpacer | feed spacer volume (m3) |
| VTotal | channel space volume (m3) |
Greek Letters
| ε | feed spacer porosity/voidage |
| µ | fluid viscosity (Pa·s) |
| v | the kinematic viscosity (-) |
| ρ | fluid density (kg·m−3) |
| τwall | average shear stress (Pa) |
Subscripts
| ave | average |
| sup | super |
References
- Van der Waal, M.J.; Racz, I.G. Mass transfer in corrugated-plate membrane modules. I. Hyperfiltration experiments. J. Memb. Sci. 1989, 40, 243–260. [Google Scholar] [CrossRef] [Green Version]
- Schock, G.; Miquel, A. Mass transfer and pressure loss in spiral wound modules. Desalination 1987, 64, 339–352. [Google Scholar] [CrossRef]
- Winograd, Y.; Solan, A.; Toren, M. Mass transfer in narrow channels in the presence of turbulence promoters. Desalination 1973, 13, 171–186. [Google Scholar] [CrossRef]
- Schwinge, J.; Wiley, D.E.; Fane, A.G. Novel spacer design improves observed flux. J. Memb. Sci. 2004, 229, 53–61. [Google Scholar] [CrossRef]
- Vrouwenvelder, J.S.; Picioreanu, C.; Kruithof, J.C.; van Loosdrecht, M.C.M. Biofouling in spiral wound membrane systems: Three-dimensional CFD model based evaluation of experimental data. J. Memb. Sci. 2010, 346, 71–85. [Google Scholar] [CrossRef]
- Karabelas, A.J.; Koutsou, C.P.; Sioutopoulos, D.C. Comprehensive performance assessment of spacers in spiral-wound membrane modules accounting for compressibility effects. J. Memb. Sci. 2018, 549, 602–615. [Google Scholar] [CrossRef]
- Lee, J.Y.; Tan, W.S.; An, J.; Chua, C.K.; Tang, C.Y.; Fane, A.G.; Chong, T.H. The potential to enhance membrane module design with 3D printing technology. J. Memb. Sci. 2016, 499, 480–490. [Google Scholar] [CrossRef]
- Siddiqui, A.; Farhat, N.; Bucs, S.S.; Linares, R.V.; Picioreanu, C.; Kruithof, J.C.; van Loosdrecht, M.C.M.; Kidwell, J.; Vrouwenvelder, J.S. Development and characterization of 3D-printed feed spacers for spiral wound membrane systems. Water Res. 2016, 91, 55–67. [Google Scholar] [CrossRef] [Green Version]
- Cornelissen, E.R.; Vrouwenvelder, J.S.; Heijman, S.G.J.; Viallefont, X.D.; van Der Kooij, D.; Wessels, L.P. Periodic air/water cleaning for control of biofouling in spiral wound membrane elements. J. Memb. Sci. 2007, 287, 94–101. [Google Scholar] [CrossRef]
- Araújo, P.A.; Kruithof, J.C.; van Loosdrecht, M.C.M.; Vrouwenvelder, J.S. The potential of standard and modified feed spacers for biofouling control. J. Memb. Sci. 2012, 403, 58–70. [Google Scholar] [CrossRef]
- Haidari, A.H.; Heijman, S.G.J.; van der Meer, W.G.J. Visualization of hydraulic conditions inside the feed channel of Reverse Osmosis: A practical comparison of velocity between empty and spacer-filled channel. Water Res. 2016, 106, 232–241. [Google Scholar] [CrossRef] [PubMed]
- Radu, A.I.; Vrouwenvelder, J.S.; van Loosdrecht, M.C.M.; Picioreanu, C. Effect of flow velocity, substrate concentration and hydraulic cleaning on biofouling of reverse osmosis feed channels. Chem. Eng. J. 2012, 188, 30–39. [Google Scholar] [CrossRef]
- Radu, A.I.; Bergwerff, L.; van Loosdrecht, M.C.M.; Picioreanu, C. Combined biofouling and scaling in membrane feed channels: a new modeling approach. Biofouling 2015, 31, 83–100. [Google Scholar] [CrossRef] [PubMed]
- Pervov, A.G. Scale formation prognosis and cleaning procedure schedules in reverse osmosis systems operation. Desalination 1991, 83, 77–118. [Google Scholar] [CrossRef]
- Da Costa, A.R.; Fane, A.G. Net-Type Spacers: Effect of Configuration on Fluid Flow Path and Ultrafiltration Flux. Ind. Eng. Chem. Res. 1994, 33, 1845–1851. [Google Scholar] [CrossRef]
- Santos, J.L.C.; Geraldes, V.; Velizarov, S.; Crespo, J.G. Investigation of flow patterns and mass transfer in membrane module channels filled with flow-aligned spacers using computational fluid dynamics (CFD). J. Memb. Sci. 2007, 305, 103–117. [Google Scholar] [CrossRef]
- Koutsou, C.P.; Yiantsios, S.G.; Karabelas, A.J. Numerical simulation of the flow in a plane-channel containing a periodic array of cylindrical turbulence promoters. J. Memb. Sci. 2004, 231, 81–90. [Google Scholar] [CrossRef]
- Song, L.; Ma, S. Numerical studies of the impact of spacer geometry on concentration polarization in spiral wound membrane modules. Ind. Eng. Chem. Res. 2005, 44, 7638–7645. [Google Scholar] [CrossRef]
- Gu, B.; Adjiman, C.S.; Xu, X.Y. The effect of feed spacer geometry on membrane performance and concentration polarisation based on 3D CFD simulations. J. Memb. Sci. 2017, 527, 78–91. [Google Scholar] [CrossRef] [Green Version]
- Van Gauwbergen, D.; Baeyens, J. Macroscopic fluid flow conditions in spiral-wound membrane elements. Desalination 1997, 110, 287–299. [Google Scholar] [CrossRef]
- Cao, Z.; Wiley, D.E.; Fane, A.G. CFD simulations of net-type turbulence promoters in a narrow channel. J. Memb. Sci. 2001, 185, 157–176. [Google Scholar] [CrossRef]
- Koutsou, C.P.; Karabelas, A.J. A novel retentate spacer geometry for improved spiral wound membrane (SWM) module performance. J. Memb. Sci. 2015, 488, 129–142. [Google Scholar] [CrossRef]
- Haaksman, V.A.; Siddiqui, A.; Schellenberg, C.; Kidwell, J.; Vrouwenvelder, J.S.; Picioreanu, C. Characterization of feed channel spacer performance using geometries obtained by X-ray computed tomography. J. Memb. Sci. 2017, 522, 124–139. [Google Scholar] [CrossRef]
- Lau, K.K.; Abu Bakar, M.Z.; Ahmad, A.L.; Murugesan, T. Effect of feed spacer mesh length ratio on unsteady hydrodynamics in 2d spiral wound membrane (swm) channel. Ind. Eng. Chem. Res. 2010, 49, 5834–5845. [Google Scholar] [CrossRef]
- Saeed, A.; Vuthaluru, R.; Vuthaluru, H.B. Impact of Feed Spacer Filament Spacing on Mass Transport and Fouling Propensities of RO Membrane Surfaces. Chem. Eng. Commun. 2015, 202, 634–646. [Google Scholar] [CrossRef]
- Koutsou, C.P.; Karabelas, A.J. Towards optimization of spacer geometrical characteristics for spiral wound membrane modules. Desalin. Water Treat. 2010, 18, 139–150. [Google Scholar] [CrossRef]
- Koutsou, C.P.; Yiantsios, S.G.; Karabelas, A.J. Direct numerical simulation of flow in spacer-filled channels: Effect of spacer geometrical characteristics. J. Memb. Sci. 2007, 291, 53–69. [Google Scholar] [CrossRef]
- Versteeg, H.; Malalasekera, W. An introduction to computational fluid dynamics: the finite volume method. 2007. [Google Scholar]
- Yuan, Z.X.; Tao, W.Q.; Wang, Q.W. Numerical prediction for laminar forced convection heat transfer in parallel-plate channels with streamwise-periodic rod disturbances. Int. J. Numer. Methods Fluids 1998, 28, 1371–1387. [Google Scholar] [CrossRef] [Green Version]
- Fimbres-Weihs, G.A.; Wiley, D.E. Review of 3D CFD modeling of flow and mass transfer in narrow spacer-filled channels in membrane modules. Chem. Eng. Process. Process Intensif. 2010, 49, 759–781. [Google Scholar] [CrossRef]
- Schwinge, J.; Wiley, D.E.; Fletcher, D.F. A CFD study of unsteady flow in narrow spacer-filled channels for spiral-wound membrane modules. Desalination 2002, 146, 195–201. [Google Scholar] [CrossRef]
- Fimbres-Weihs, G.A.; Wiley, D.E. Numerical study of mass transfer in three-dimensional spacer-filled narrow channels with steady flow. J. Memb. Sci. 2007, 306, 228–243. [Google Scholar] [CrossRef]
- Hayes, R.E. Computational Flow Modeling for Chemical Reactor Engineering; Elsevier: Amsterdam, The Netherlands, 2002; Volume 80, ISBN 0125769601. [Google Scholar]
- Geraldes, V.; Semião, V.; de Pinho, M.N. Flow management in nanofiltration spiral wound modules with ladder-type spacers. J. Memb. Sci. 2002, 203, 87–102. [Google Scholar] [CrossRef]
- Saeed, A.; Vuthaluru, R.; Vuthaluru, H.B. Investigations into the effects of mass transport and flow dynamics of spacer filled membrane modules using CFD. Chem. Eng. Res. Des. 2015, 93, 79–99. [Google Scholar] [CrossRef]
- Koutsou, C.P.; Yiantsios, S.G.; Karabelas, A.J. A numerical and experimental study of mass transfer in spacer-filled channels: Effects of spacer geometrical characteristics and Schmidt number. J. Memb. Sci. 2009, 326, 234–251. [Google Scholar] [CrossRef]
- Picioreanu, C.; Vrouwenvelder, J.S.; van Loosdrecht, M.C.M. Three-dimensional modeling of biofouling and fluid dynamics in feed spacer channels of membrane devices. J. Memb. Sci. 2009, 345, 340–354. [Google Scholar] [CrossRef]
- Lim, S.Y.; Liang, Y.Y.; Fimbres Weihs, G.A.; Wiley, D.E.; Fletcher, D.F. A CFD study on the effect of membrane permeance on permeate flux enhancement generated by unsteady slip velocity. J. Memb. Sci. 2018, 556, 138–145. [Google Scholar] [CrossRef]
- Ranade, V.V.; Kumar, A. Fluid dynamics of spacer filled rectangular and curvilinear channels. J. Memb. Sci. 2006, 271, 1–15. [Google Scholar] [CrossRef] [Green Version]
- Shakaib, M.; Hasani, S.M.F.; Mahmood, M. Study on the effects of spacer geometry in membrane feed channels using three-dimensional computational flow modeling. J. Memb. Sci. 2007, 297, 74–89. [Google Scholar] [CrossRef]
- Horstmeyer, N.; Lippert, T.; Schön, D.; Schlederer, F.; Picioreanu, C.; Achterhold, K.; Pfeiffer, F.; Drewes, J.E. CT scanning of membrane feed spacers—Impact of spacer model accuracy on hydrodynamic and solute transport modeling in membrane feed channels. J. Memb. Sci. 2018, 564, 133–145. [Google Scholar] [CrossRef]
- Siddiqui, A.; Lehmann, S.; Haaksman, V.; Ogier, J.; Schellenberg, C.; van Loosdrecht, M.C.M.; Kruithof, J.C.; Vrouwenvelder, J.S. Porosity of spacer-filled channels in spiral-wound membrane systems: Quantification methods and impact on hydraulic characterization. Water Res. 2017, 119, 304–311. [Google Scholar] [CrossRef]
- Da Costa, A.R.; Fane, A.G.; Wiley, D.E. Spacer characterization and pressure drop modeling in spacer-filled channels for ultrafiltration. J. Memb. Sci. 1994, 87, 79–98. [Google Scholar] [CrossRef]
- Da Costa, A.R.; Fane, A.G.; Fell, C.J.D.; Franken, A.C.M. Optimal channel spacer design for ultrafiltration. J. Memb. Sci. 1991, 62, 275–291. [Google Scholar] [CrossRef]
- Dendukuri, D.; Karode, S.K.; Kumar, A. Flow visualization through spacer filled channels by computational fluid dynamics-II: Improved feed spacer designs. J. Memb. Sci. 2005, 249, 41–49. [Google Scholar] [CrossRef]
- Taamneh, Y.; Bataineh, K. Improving the performance of direct contact membrane distillation utilizing spacer-filled channel. Desalination 2017, 408, 25–35. [Google Scholar] [CrossRef]
- Li, F.; Meindersma, W.; de Haan, A.B.; Reith, T. Experimental validation of CFD mass transfer simulations in flat channels with non-woven net spacers. J. Memb. Sci. 2004, 232, 19–30. [Google Scholar] [CrossRef]
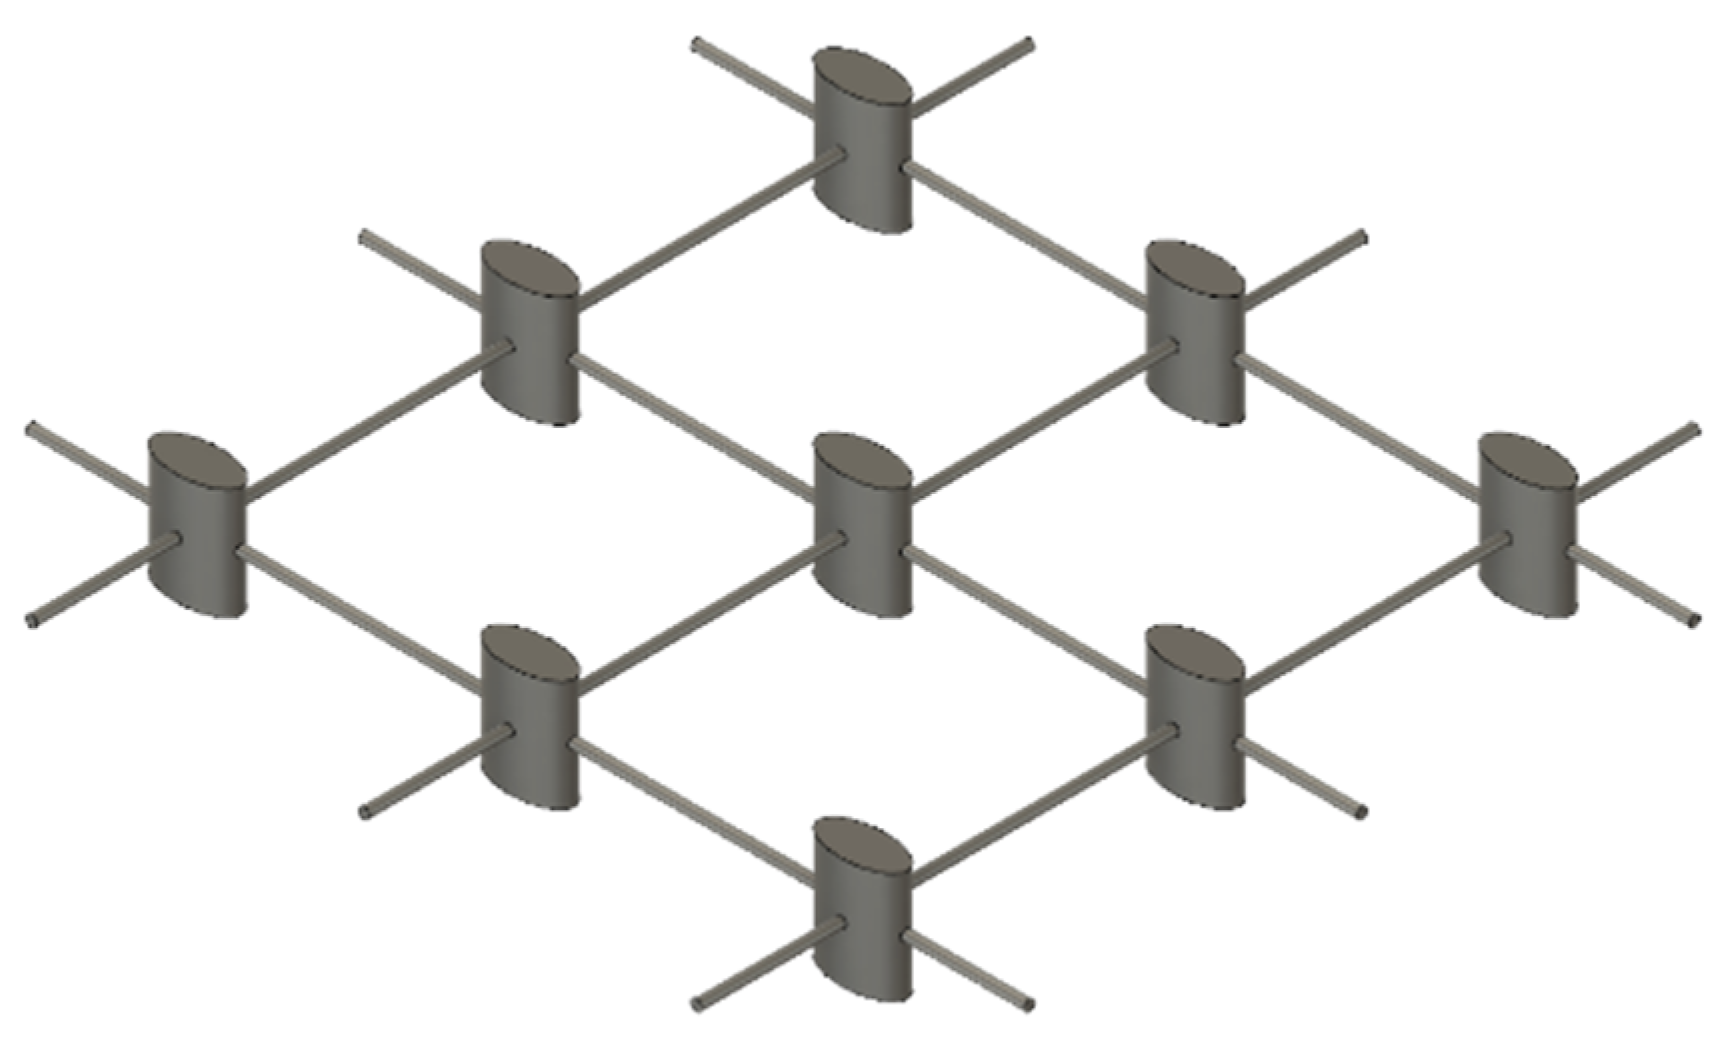
Figure 1.
A view of the morphology of the pillar-like feed spacer.

Figure 2.
The geometrical characteristics of the pillar-like feed spacer.

Figure 3.
Computational Fluid Dynamics (CFD) model setting.

Figure 4.
The pillar-like feed spacer’s porosity.

Figure 5.
The computational grid for the pillar-like feed spacer.

Figure 6.
The pressure drop, associated with the connecting filament diameter, as a function of (a) the flow rate and (b) the average velocity.
Figure 6.
The pressure drop, associated with the connecting filament diameter, as a function of (a) the flow rate and (b) the average velocity.

Figure 7.
The pressure drop and friction factor as a function of channel porosity for the inlet velocity at 0.04 m/s (at a constant flow rate).
Figure 7.
The pressure drop and friction factor as a function of channel porosity for the inlet velocity at 0.04 m/s (at a constant flow rate).

Figure 8.
Contours of velocity in the main flow direction for the super velocity of 0.04 m/s (red: high, blue: low). (a) d/a = 2; (b) d/a = 1; (c) d/a = 0.5; (d) d/a = 0.25.
Figure 8.
Contours of velocity in the main flow direction for the super velocity of 0.04 m/s (red: high, blue: low). (a) d/a = 2; (b) d/a = 1; (c) d/a = 0.5; (d) d/a = 0.25.

Figure 9.
The friction factor, associated with the connecting filament diameter, as a function of the Reynolds number. A comparison was made with the friction factor results of Haaksman et al. [23].
Figure 9.
The friction factor, associated with the connecting filament diameter, as a function of the Reynolds number. A comparison was made with the friction factor results of Haaksman et al. [23].

Figure 10.
The contours of total pressure in the main flow direction for the super velocity of 0.04 m/s (red: high, blue: low). (a) d/a = 2; (b) d/a = 1; (c) d/a = 0.5; (d) d/a = 0.25.
Figure 10.
The contours of total pressure in the main flow direction for the super velocity of 0.04 m/s (red: high, blue: low). (a) d/a = 2; (b) d/a = 1; (c) d/a = 0.5; (d) d/a = 0.25.
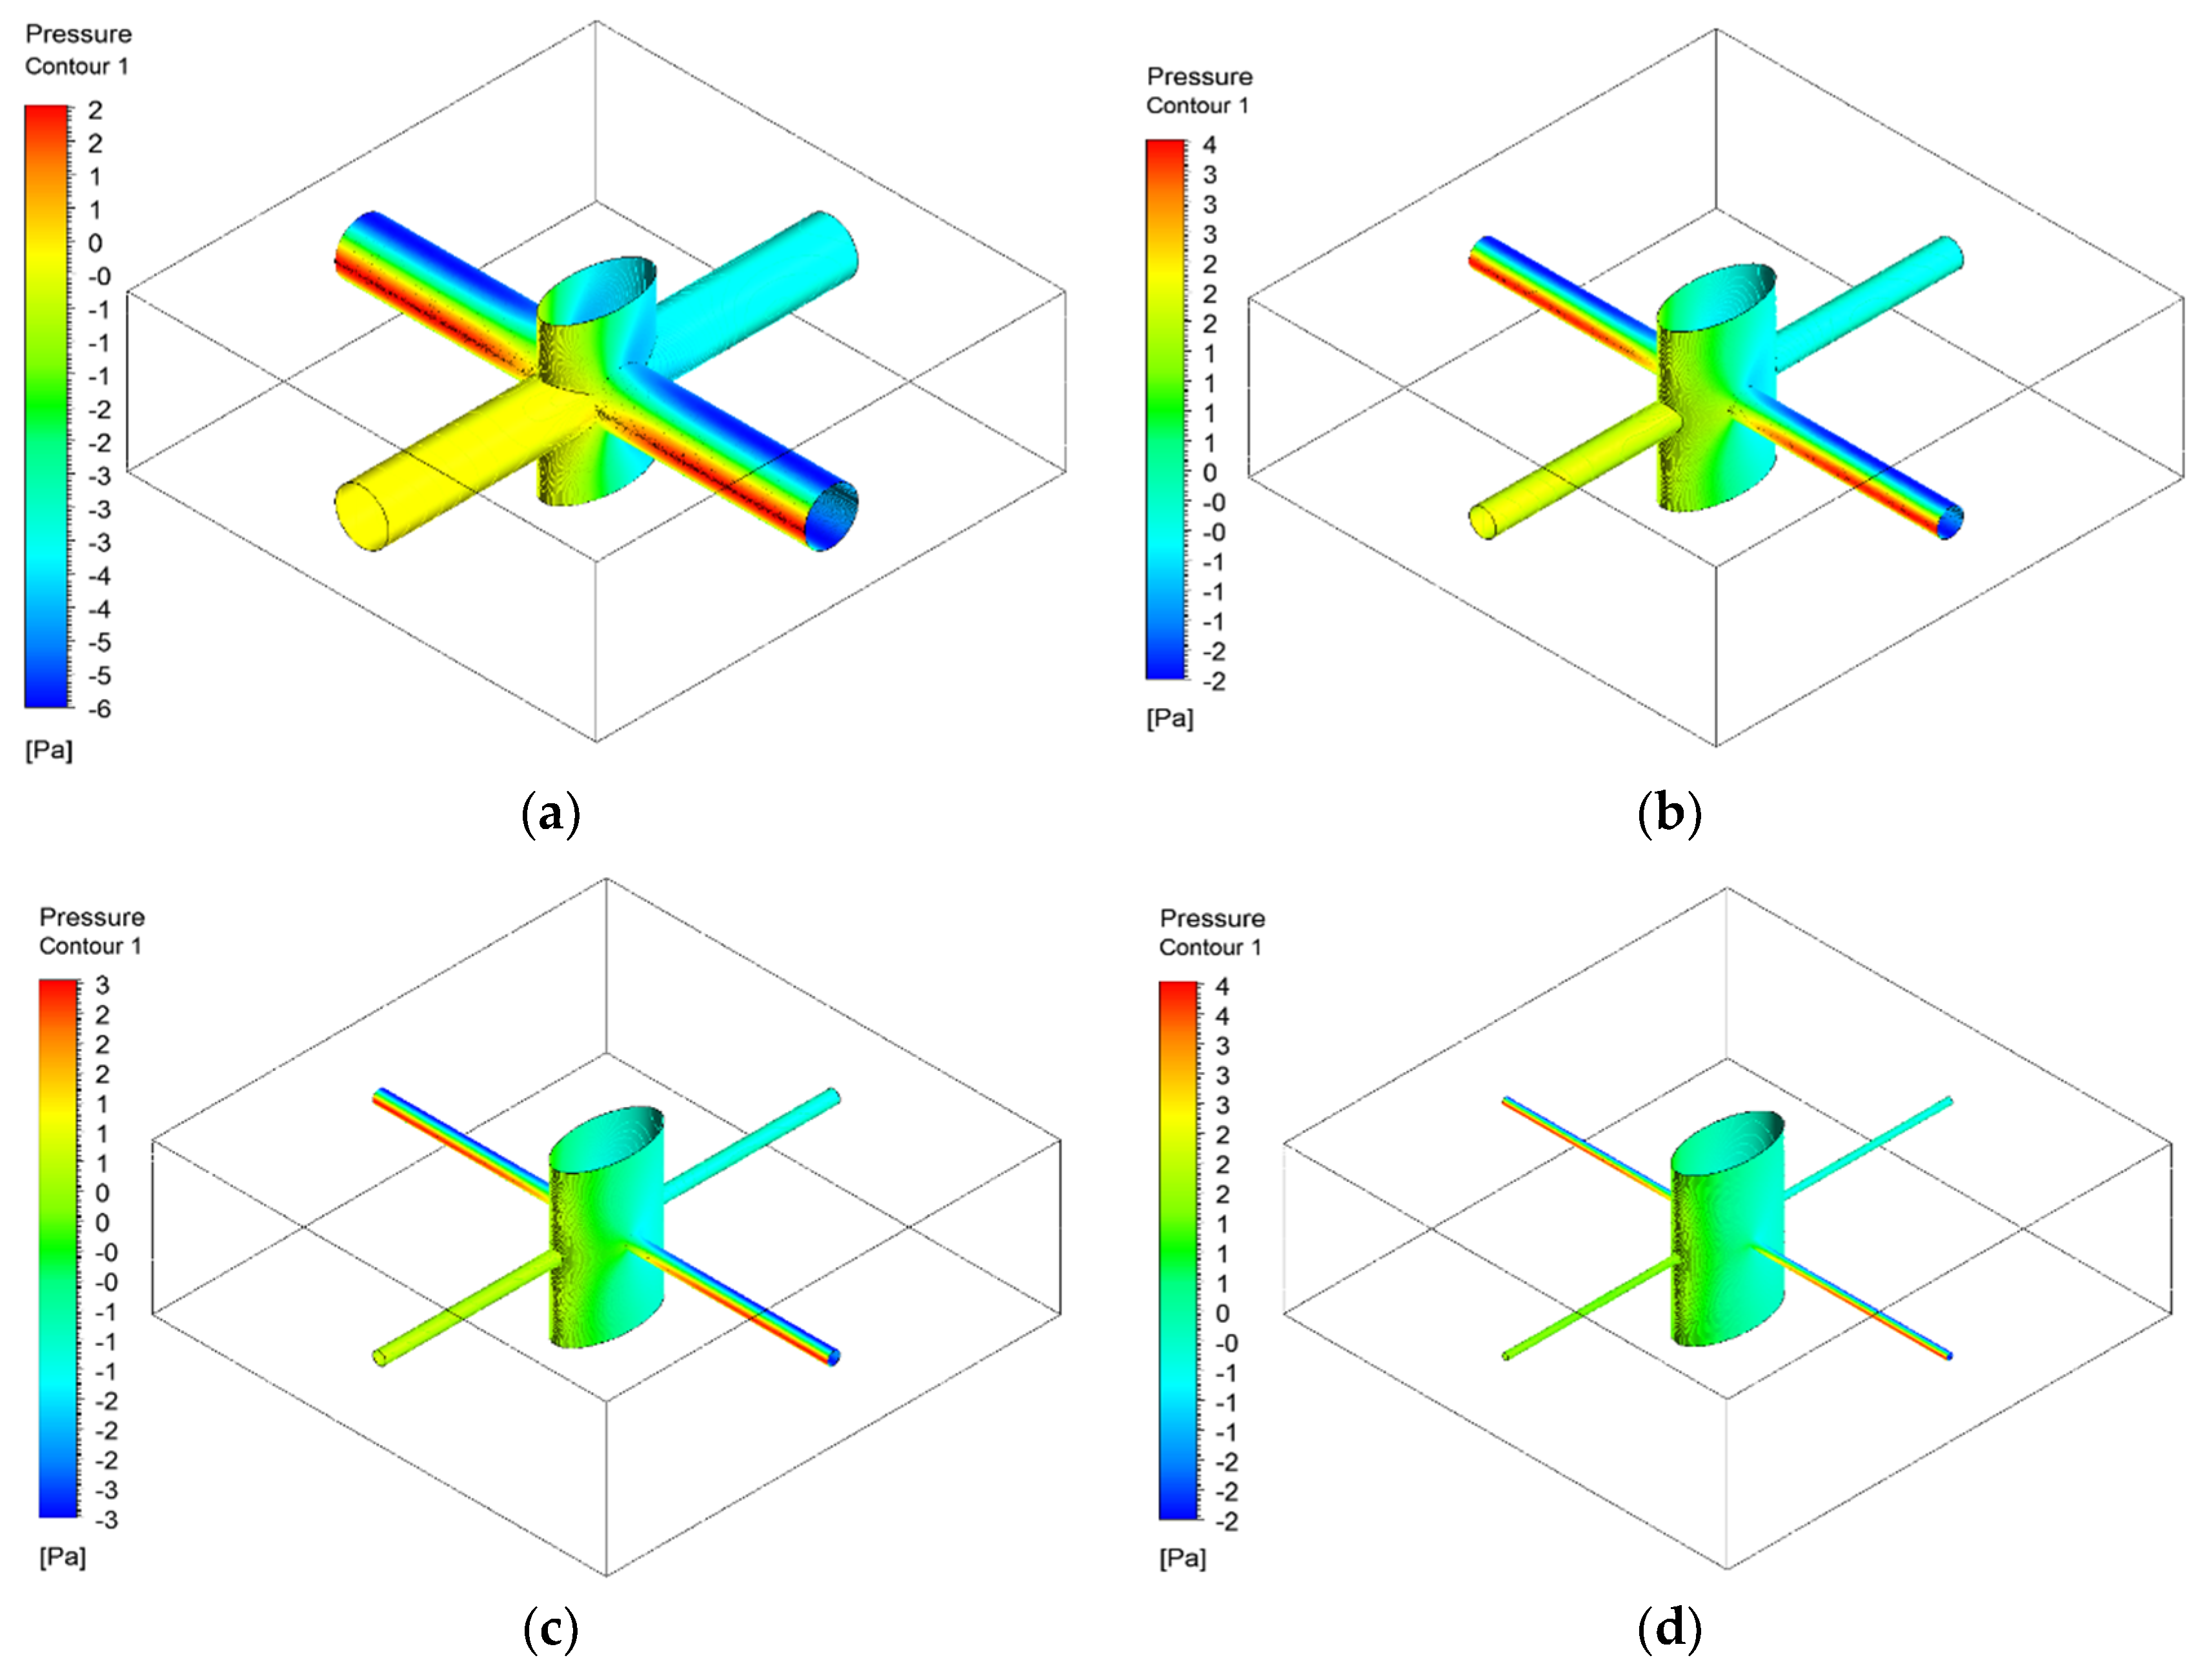
Figure 11.
The dimensionless power number, associated with the connecting filament diameter, as a function of the Reynolds number. A comparison was made with the dimensionless results of Haaksman et al. [23].
Figure 11.
The dimensionless power number, associated with the connecting filament diameter, as a function of the Reynolds number. A comparison was made with the dimensionless results of Haaksman et al. [23].

Figure 12.
The contour plots of the wall shear stress (τ) profile on the upper membrane and the lower membrane generated by the pillar-like feed spacer.
Figure 12.
The contour plots of the wall shear stress (τ) profile on the upper membrane and the lower membrane generated by the pillar-like feed spacer.

Figure 13.
The modified friction factor, associated with the connecting filament diameter, as a function of the dimensionless power number. A comparison was made with the modified friction factor of Haaksman et al. [23].
Figure 13.
The modified friction factor, associated with the connecting filament diameter, as a function of the dimensionless power number. A comparison was made with the modified friction factor of Haaksman et al. [23].


Table 1.
The pressure drop function parameters.
| - | a1 | b1 | a2 | b2 |
|---|---|---|---|---|
| d/a = 0.25 | 3.26 × 10⁴ | 1.13 | 0.09 | 1.13 |
| d/a = 0.5 | 6.45 × 10⁴ | 1.17 | 0.11 | 1.17 |
| d/a = 1 | 1.59 × 10⁵ | 1.21 | 0.17 | 1.21 |
| d/a = 2 | 4.62 × 10⁵ | 1.25 | 0.31 | 1.25 |
| d = D | 1.00 × 10⁶ | 1.28 | 0.62 | 1.28 |
| Haidar Spacer [11] | 1.77 × 10⁸ | 1.63 | 7.91 | 1.63 |
| Haidar Channel [11] | 5384 | 0.97 | 0.23 | 0.97 |
Table 2.
The friction factor function parameters.
| - | a3 | b3 | |
|---|---|---|---|
| d/a = 0.25 | 79.215 | −0.867 | |
| d/a = 0.5 | 73.599 | −0.832 | |
| d/a = 1 | 68.338 | −0.79 | |
| d/a = 2 | 71.529 | −0.753 | |
| d = D | 88.172 | −0.724 | |
| Schock et al. [2] | Film Tec | 105 | −0.8 |
| Toray PEC1000 | 13 | −0.8 | |
| HP Tricot | 46 | −0.8 | |
| Desal RO | 105 | −0.8 | |
Table 3.
The dimensionless power number function parameters.
| - | a4 | b4 |
|---|---|---|
| d/a = 0.25 | 79.215 | 2.1326 |
| d/a = 0.5 | 73.599 | 2.1678 |
| d/a = 1 | 68.338 | 2.2105 |
| d/a = 2 | 71.529 | 2.2467 |
| d = D | 88.172 | 2.2756 |
| Li empty channel [47] | 12 | 2 |
© 2018 by the authors. Licensee MDPI, Basel, Switzerland. This article is an open access article distributed under the terms and conditions of the Creative Commons Attribution (CC BY) license (http://creativecommons.org/licenses/by/4.0/).
Share and Cite
MDPI and ACS Style
Han, Z.; Terashima, M.; Liu, B.; Yasui, H. CFD Investigation of the Effect of the Feed Spacer on Hydrodynamics in Spiral Wound Membrane Modules. Math. Comput. Appl. 2018, 23, 80. https://doi.org/10.3390/mca23040080
AMA Style
Han Z, Terashima M, Liu B, Yasui H. CFD Investigation of the Effect of the Feed Spacer on Hydrodynamics in Spiral Wound Membrane Modules. Mathematical and Computational Applications. 2018; 23(4):80. https://doi.org/10.3390/mca23040080
Chicago/Turabian StyleHan, Zhiming, Mitsuharu Terashima, Bing Liu, and Hidenari Yasui. 2018. "CFD Investigation of the Effect of the Feed Spacer on Hydrodynamics in Spiral Wound Membrane Modules" Mathematical and Computational Applications 23, no. 4: 80. https://doi.org/10.3390/mca23040080