
Stress Reduction of a V-Based BCC Metal Hydride Bed Using Silicone Oil as a Glidant
by
 and
and
Xin Zheng
1,†,
Hanyang Kong
2,†,
Desheng Chu
1,
Faping Hu
1,
Yao Wang
2,
Yigang Yan
2 and
Chaoling Wu
2,3,* 1
Electrical Science Institute of Yunnan Power Grid Co., Ltd., Kunming 650214, China
2
Institute of New Energy and Low-Carbon Technology, Sichuan University, Chengdu 610207, China
3
College of Materials Science and Engineering, Sichuan University, Chengdu 610065, China
*
Author to whom correspondence should be addressed.
†
These authors contributed equally to this work.
Inorganics 2022, 10(10), 167; https://doi.org/10.3390/inorganics10100167
Submission received: 17 September 2022
/
Revised: 28 September 2022
/
Accepted: 29 September 2022
/
Published: 9 October 2022
(This article belongs to the Special Issue State-of-the-Art and Progress in Metal-Hydrogen Systems)
Abstract
:The large volume expansion and self-locking phenomenon of metal hydride particles during hydrogen sorption often leads to a high stress concentration on the walls of a container, which may cause the collapse of the container. In present study, silicone oil was investigated as a glidant for a V-based BCC metal hydride bed to alleviate the stress concentration during hydrogen sorption. The results indicated that the addition of 5 wt% silicone oil slightly reduced the initial hydrogen storage capacity of V40Ti26Cr26Fe8 (particle size: ~325 μm) but improved the absorption reversibility, regardless of the oil viscosity. It was observed that silicone oil formed a thin oil layer of 320~460 nm in thickness on the surface of the V40Ti26Cr26Fe8 particles, which might improve the fluidity of the powder, reduce the self-locking phenomenon and alleviate the stress concentration on the container walls. Consequently, the maximum strain on the surface of the hydrogen storage container decreased by ≥22.5% after adding 5 wt% silicone oil with a viscosity of 1000 cSt.
1. Introduction
With the growing energy demand and the concerns of environmental pollution, the development of emission-free energy carriers based on abundant resources such as hydrogen is arousing great interest [1,2]. Hydrogen can be used in internal combustion engines to produce mechanical energy or in fuel cells to convert chemical energy to electrical energy [3]. However, before the large-scale utilization of hydrogen as an energy carrier, the development of technologies to safely and efficiently store hydrogen, hydrogen storage being the bridge between its production and consumption, is essential [4,5]. To date, three main methods have been reported, i.e., hydrogen can be physically stored as a compressed gas, a cryogenic liquid, or in metal hydrides [6]. Among them, metal hydrides, which could potentially allow reversible hydrogen absorption and desorption at ambient conditions, are considered an ideal mean for hydrogen storage [7,8].
However, a large volume expansion occurs during the hydrogen absorption process due to the insertion of hydrogen atoms into the lattices [9,10,11]. For example, an expansion of 20% was observed for LaNi5 during the absorption of hydrogen [12,13], of about 30% for Mg-based alloys [14], and of 9–23% for a Ti–Cr–Mn-based alloy [11,15]. A body-centered cubic (BCC) alloy showed a much higher expansion of more than 40% during the first hydrogen absorption, with the lattice parameters growing from 3.0327 Å for the BCC lattice to 4.2714 Å for the FCC lattice [16]. During the expansion of metal hydrides, the particles are gradually reduced in size, e.g., from 150 μm to 5 μm for the Ti–Zr–Mn-based alloy after 180 cycles [17], and meanwhile, lattice expansion leads to the concentration of stress on the walls of the hydrogen storage container, especially on the bottom of the container, due to the flow of the alloy particles under gravity and the interlock of irregular particles [9,18,19]. It is critical to ensure that the design of the hydrogen storage container allows it to withstand the expansion of metal hydrides. The stress concentration on the surface of a hydrogen storage container depends on the type, particle shape, and loading fraction of the hydrogen storage materials [12,13,20,21,22], as well as on how the hydrogen storage container is placed, e.g., horizontally or vertically [12,18].
To alleviate the stress concentration on the container walls, approaches focusing on the container or the metal hydride (MH) bed have been proposed. As regards the container, leaving enough free expansion space for the hydrogen alloy is a common method [23]. C. K. Lin [20] reported a structural design of the hydrogen storage container, in which the container is divided into three layers to release the stress concentration. For the MH bed, hinders or glidants are generally applied to reduce the stress concentration [24,25,26,27,28]. The addition of hinders, such as expanded graphite, could limit the free moving of metal hydride powders [28]. Glidants, such as silicone oil, MoS2 nanopowders, and carbon black, can improve the fluidity of metal hydride powders and reduce the self-locking phenomenon between powders [24,25,26,27].
Vanadium-based hydrogen storage alloys have a BCC crystal structure with a hydrogen storage capacity of ~3.8 wt % and a fast hydrogen sorption kinetics at room temperature. By using a FeV80 master alloy to replace the pure vanadium metal, the cost of V-based BCC alloys has been significantly reduced [29]. However, the large volume expansion, of ~40%, during the first hydrogen absorption cycle, may cause a serious stress concentration on the container walls. In the present study, silicone oil with low cost and high temperature stability, which ranges from −50 to 200 °C during long-term use [30], was applied as a glidant for a V-based BCC alloy powder bed. The influence of silicone oil on the hydrogen storage properties of the V-based BCC alloy was systematically investigated. Furthermore, the effect of silicone oil addition on stress concentration during the first hydrogen sorption was evaluated using a swelling stress measurement system.
2. Results
2.1. Hydrogen Storage Properties
Initially, the contact angle between silicone oils with different viscosity and the V40Ti26Cr26Fe8 alloy (s1) was determined, as shown in Figure 1. The contact angle increased from 9.006° for a silicone oil of 50 cSt to 17.719° for a silicone oil of 10,000 cSt. Smaller contact angles indicate a good infiltration of the investigated silicone oil in the V40Ti26Cr26Fe8 alloy. Hence, 5 wt% silicones oil of 50 cSt (s2), 1000 cSt (s3) and 10,000 cSt (s4), respectively, were mixed with the V40Ti26Cr26Fe8 powder, and hydrogen sorption was measured.
Figure 2a compares the hydrogen absorption kinetics in the first cycle of sample s1 and samples containing 5 wt% silicone oils of 50 cSt (s2), 1000 cSt (s3) and 10,000 cSt (s4). Sample s1, the pristine V40Ti26Cr26Fe8 alloy, started to absorb hydrogen immediately without incubation at 298 K and 7 MPa H2, with a fast absorption >3 wt% H in the first 5 min and a full capacity of 3.43 wt% H. Samples s2, s3 and s4 showed incubation periods of 0.5, 0.3 and 0.1 min, respectively. The incubation period decreased for samples containing silicone oil with higher viscosity. The hydrogen absorption rates also declined for samples s2, s3 and s4, which showed hydrogen absorption amounts of 2.29, 2.42 and 2.62 wt% H, respectively, in the first 5 min. The full capacities of samples s2, s3 and s4 decreased to 3.231, 3.362 and 3.325 wt%, respectively. In the PCT curves of the first dehydrogenation process (Figure 2b), the samples s1 to s4 showed a similar plateau pressure of ~0.4 MPa, but the hydrogen desorption amount decreased from 2.20 wt% for s1 to 1.95 wt% for s2, 2.06 wt% for s3 and 2.04 wt% for s4, within the pressure range of 0.01–7 MPa.
To further investigate the cycling stability, samples s1 to s4 were evacuated after dehydrogenation at RT for 30 min and were then hydrogenated under 7 MPa H2 at RT. Figure 3a,d show the hydrogen absorption kinetics of samples s1 to s4 up from the 2nd to the 20th cycle. Starting from the second cycle, all samples could absorb hydrogen immediately without incubation and absorbed the maximum hydrogen amount within 5 min. Moreover, hydrogen absorption sped up within the first minute as the number of cycles increased for all samples (Figure 3e). For samples s2, s3 and s4, the amounts of hydrogen absorbed within the first minute were almost the same at each cycle and reached 1.7 wt% at the 20th cycle (Figure 3e), which was slightly lower than the amount of 1.87 wt% measured for sample s1.
Figure 3f compares the reversibly absorbed amounts of samples s1 to s4. The reversibly absorbed hydrogen amounts of the four samples showed a fast decay in the first 10 cycles and became relatively steady afterwards. Sample s1 showed a reversible hydrogen amount of 2.42 wt%, which decreased to 2.12 at the 10th cycle, corresponding to a capacity retention of 87.6%, and to 2.06 wt% at the 20th cycle, with a capacity retention of 85.1%. Interestingly, samples s2–s4 showed a lower initial reversible hydrogen storage capacity but a higher capacity retention of 90%, 87.3% and 87%, respectively. That is, the initial reversibly absorbed hydrogen amounts were 2.23, 2.36 and 2.32 wt% for samples s2–s4, which decreased to 2.0, 2.06 and 2.02 wt% at the 20th cycle, respectively.
Figure 4a shows the XRD pattern of the pristine V40Ti26Cr26Fe8 alloy (s1), which was composed of a BCC phase as the major phase and CeO2 as the minor phase. After 20 ab/de-sorption cycles, sample s1 contained mainly a BCT phase and minor FCC and CeO2 phases. The formation of the BCT phase, a monohydride of the V-based BCC alloy, was due to the dehydrogenation of the dihydride (FCC phase) at room temperature [31]. Note that after 20 ab/desorption cycles, the BCT phase of samples s1 to s4 showed very broad reflections (Figure 4b–e), implying the presence of large microstrains. The initial microstrain of sample s1 was around 0.36% and increased to 1.282% after 20 ab/desorption cycles. Compared to sample s1, samples s2–s4 showed very similar microstrains of around 1.3% (Figure 5f) after 20 ab/desorption cycles.
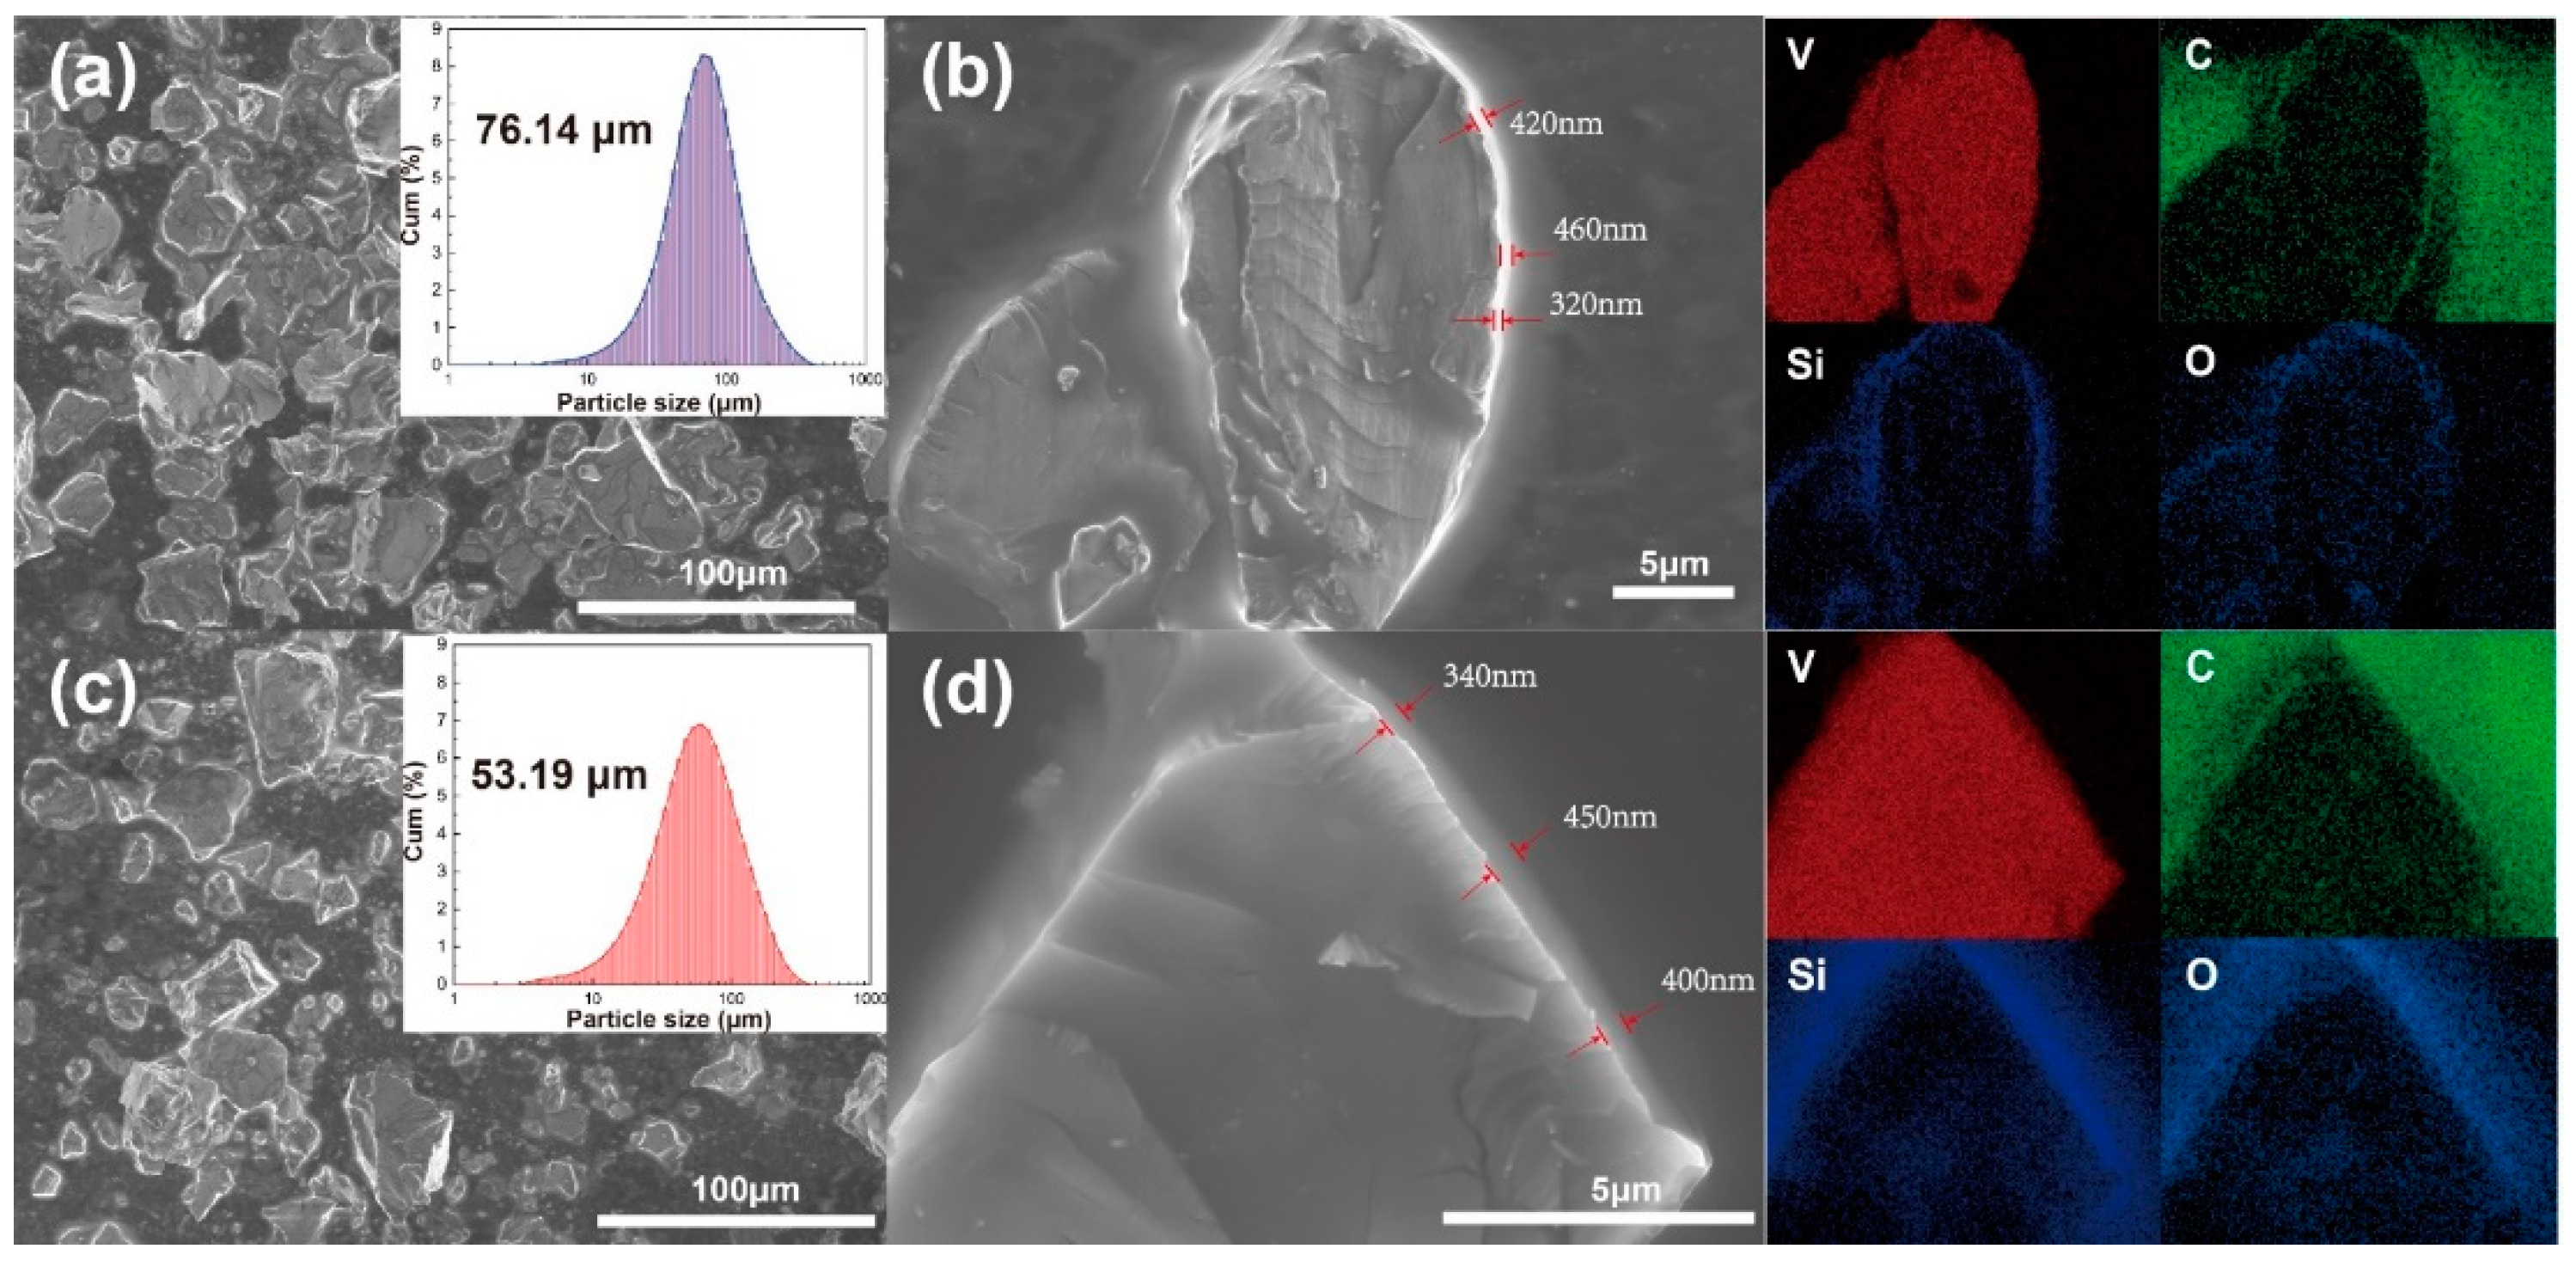
Sample s3 was chosen to further investigate the morphology evolution during the hydrogen ab/desorption cycles by SEM and EDS, as shown in Figure 5. The average particle size after the first ab/desorption cycle was 76.14 μm (Figure 5a) and decreased to 53.19 μm after 20 cycles (Figure 5c). With the decrease in the particle size of sample s3, a larger fresh surface was generated, improving the hydrogen absorption dynamics (Figure 3e). The presence of silicone oil on the surface of the alloy particles of sample s3 was confirmed by EDS elemental mapping, which allowed observing C, Si and O elements on the surface of the alloy particles, as shown in Figure 5b,d. Furthermore, the thickness of the silicone oil film was approximately 320–460 nm after the 1st cycle (Figure 5b) and slightly decreased to 340–450 nm after the 20th cycle (Figure 5d).
2.2. Influence of the Silicone Oil on Strain Distribution
To investigate whether the addition of silicone oil could lower the strain on the container walls during the hydrogen absorption process of the BCC alloy, three kinds of samples were loaded into a home-made MH reactor (Scheme 1), including V40Ti26Cr26Fe8 powders with particle size of 2~3 mm (s5), pre-hydrogenated V40Ti26Cr26Fe8 powder with particle size of 325 μm (s6) and a mixture of s6 and silicone oil of 1000 cSt (s7). Four strain gauges at positions 3a to 3d were used to measure the distribution of the circumferential strain on the container walls during the first hydrogen absorption by sample s5, s6 and s7.
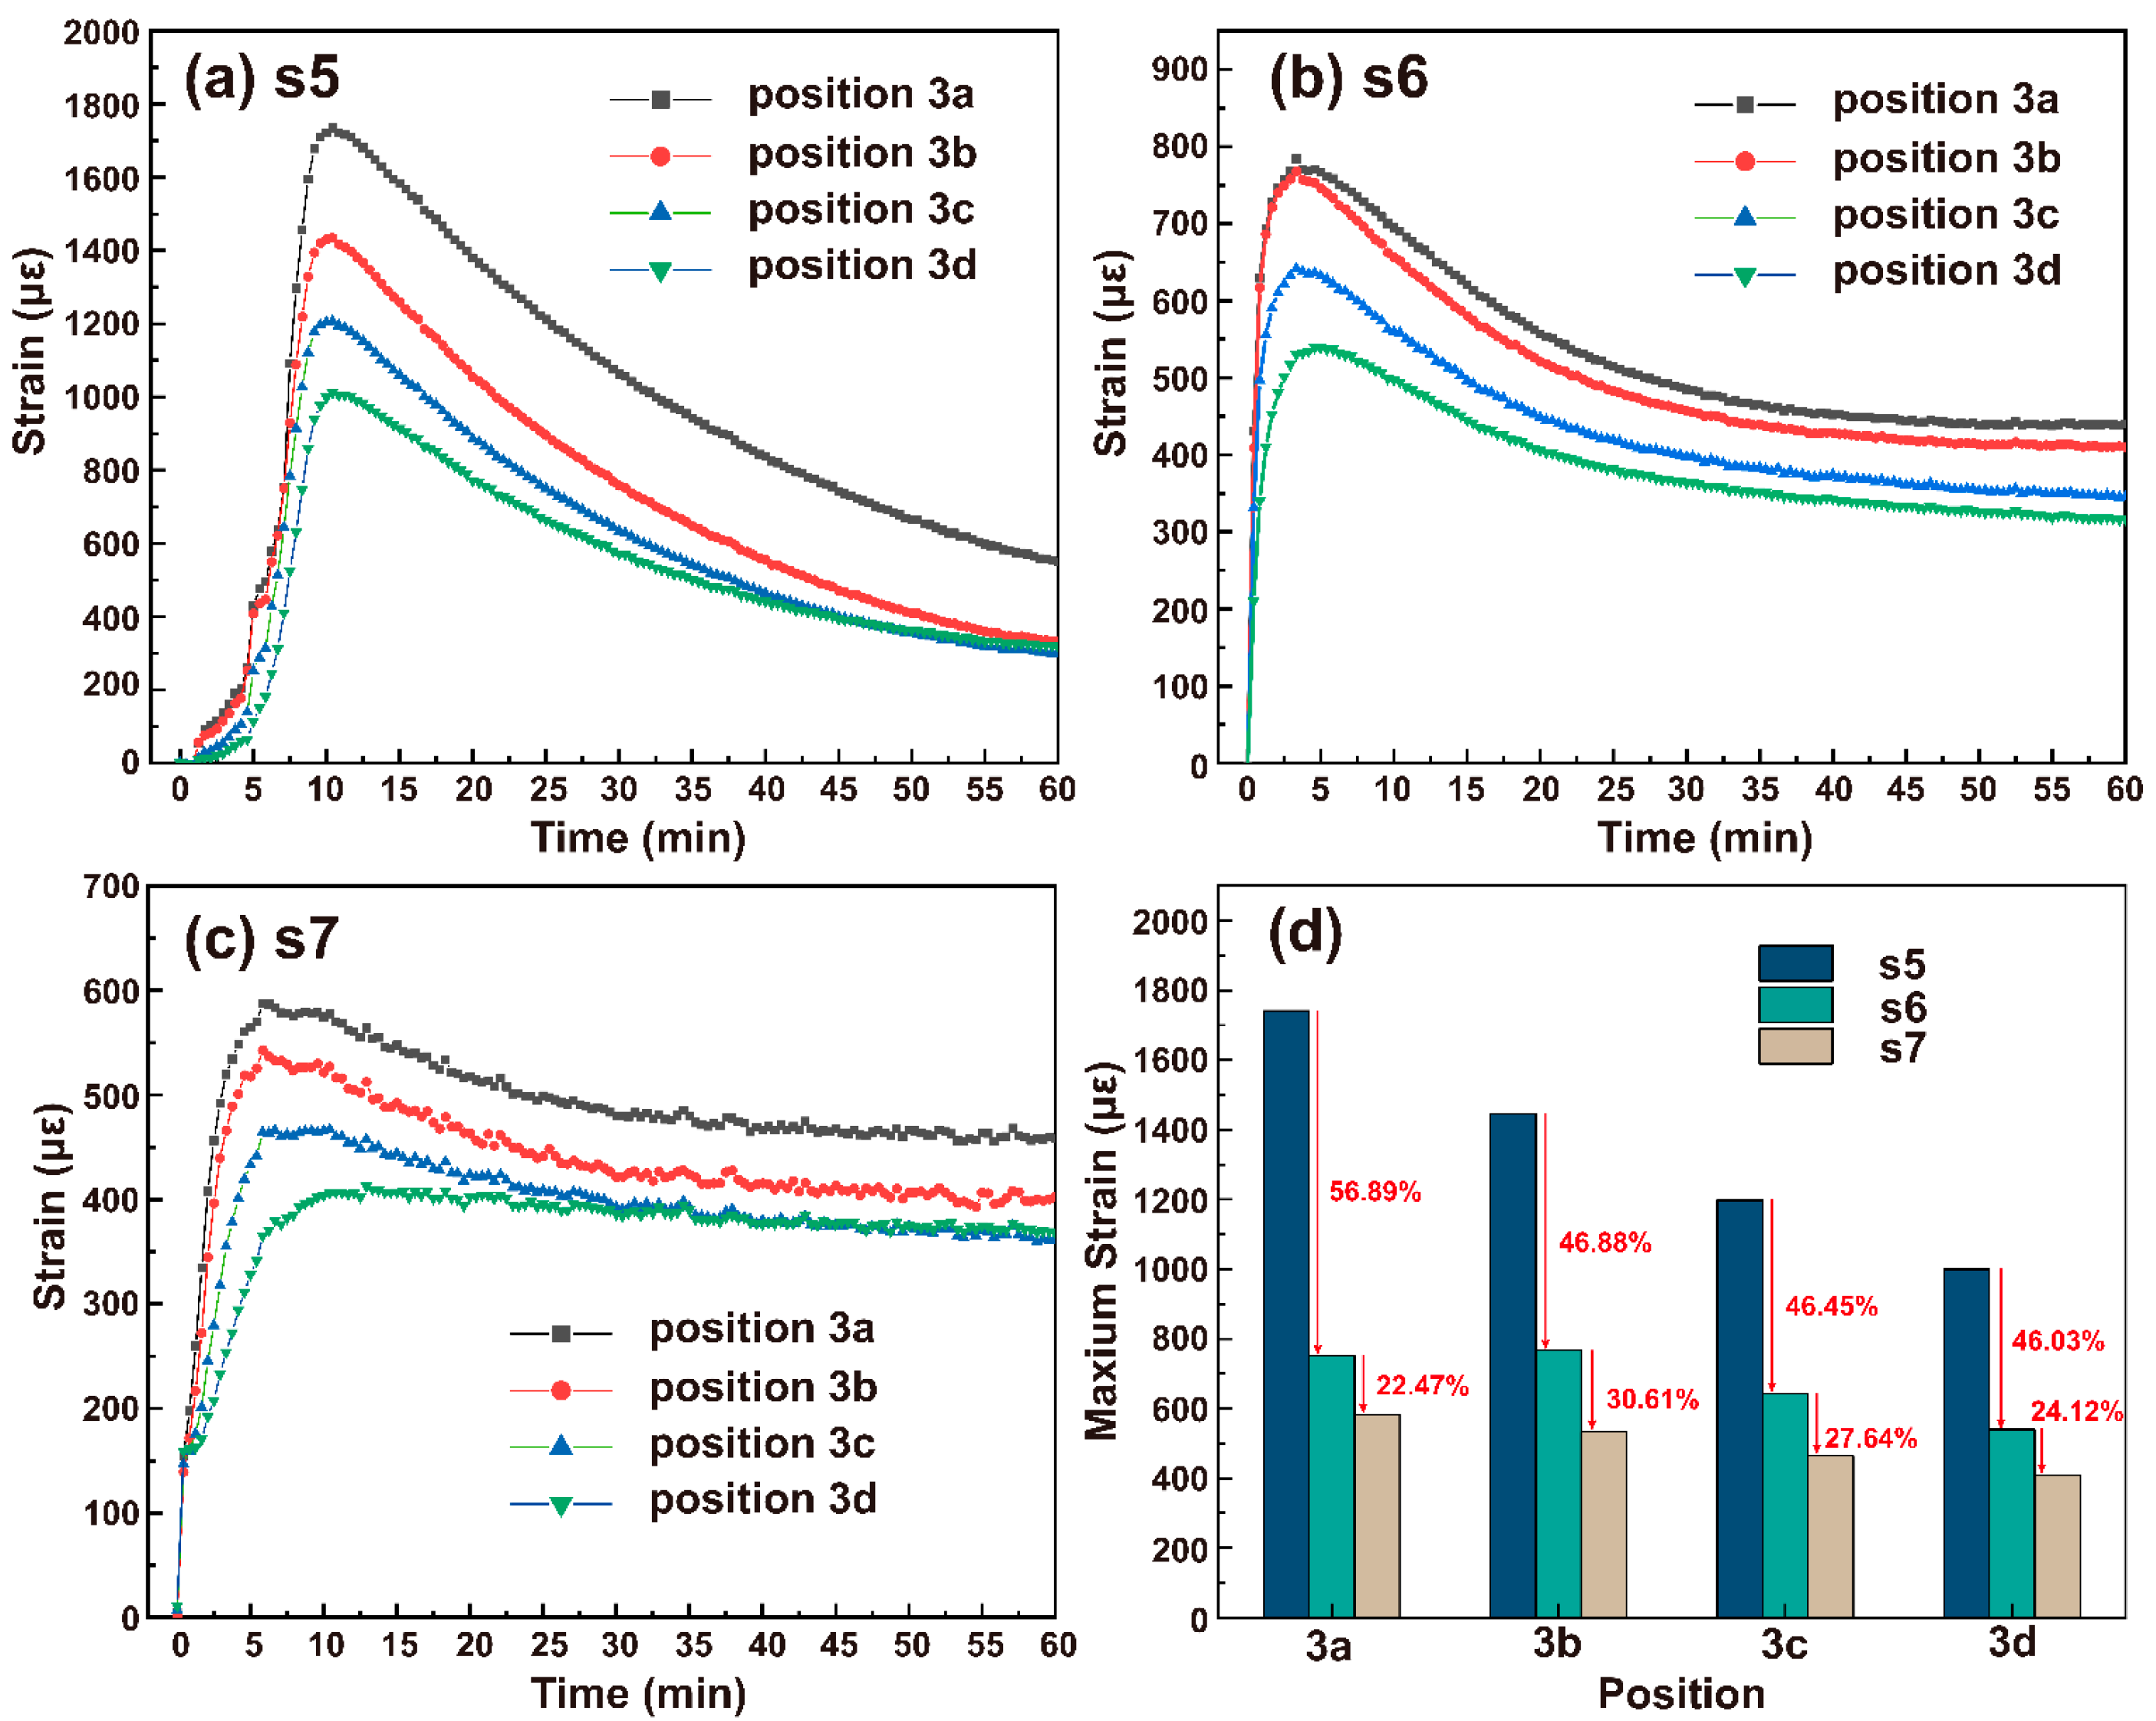
For sample s5 (Figure 6a), the strains at positions 3a to 3d increased slowly in the first 5 min, rose rapidly to the vertex after about 10 min and declined slowly afterwards. The strain at position 3a near the bottom of the container, with the maximum of 1750 με, was obviously higher that at other positions, indicating that stress was concentrated at the bottom of the container. This was due to the small expansion space near the bottom of the container, which allowed the fine powders to easily pass through the metal hydride bed, reaching the bottom of the container and filling the empty space [7]. As for sample s6 with a smaller particle size, the strain increased rapidly after hydrogen absorption started and reached the maximum after around 3 min. Compared to the strain at positions 3a to 3d for s5, shown in Figure 6b, the strain on the container walls for all samples were much smaller. For example, the maximum strain at position 3a decreased by about 56.89 %, from 1750 με for s5 to 750.84 με for s6. For s7 sample, the strain at the four positions was further reduced. For instance, the maximum strain at position 3a decreased to 582.13 με for s7, which is a drop by 22.5% compared to the value (750.84 με) measure for s6. Additionally, for s5 and s6, the time required to reach the maximum strain at the four positions was almost the same, i.e., 10 min for s5 and 3 min for s6. For sample s7, the time to reach the maximum strain was 7, 7, 8, and 10 min for positions 3a to 3d, respectively; the delay in reaching the maximum strain at positions 3c and 3d implied an alleviation of the stress concentration.
Figure 6d further compares the maximum strain at the four positions on the container walls for the three samples. For sample s7, which was composed of a fine V40Ti26Cr26Fe8 powder (325 μm) and silicone oil, the maximum strain was much lower, compared to those measured for the other two samples. This can be explained by the presence of a silicone oil film with a thickness of 320–460 nm on the surface of the metal hydride powder, which might improve the fluidity of the V40Ti26Cr26Fe8 powder, reduce the self-locking phenomenon and alleviate the stress concentration.
3. Materials and Methods
3.1. Sample Preparation
The purity of Ti, Cr and Ce was 99.5 wt%, 99.9 wt%, 99.0 wt%, respectively. A FeV80 master alloy was used as the V source; it contained 78.14 wt% V, 19.16 wt% Fe and minor amounts of Al, Si, C and O. We added 3 wt% Ce to the alloy to remove the oxygen introduced by the FeV80 master alloy and improve the activation performance [29]. The V40Ti26Cr26Fe8 alloy (denoted as s1) was prepared using a suspension melting furnace, followed by annealing at 1673 K for 30 min under vacuum (5 × 10⁻³ Pa) in a ZM-16 vacuum molybdenum wire furnace. The V40Ti26Cr26Fe8 alloy was crushed into a powder with particle size of 325 μm in an Argon glove box.
The silicone oils with different viscosities of 50, 1000 and 10,000 cSt were purchased from the Dow Corning company. We added 5 wt% silicone oil to the V40Ti26Cr26Fe8 powder by hand grinding for 15 min in a mortar. The mixtures of V40Ti26Cr26Fe8 powder and silicone oil of 50, 1000 and 10,000 cSt were denoted as samples s2, s3, and s4, respectively.
We placed ~2 g of the samples in a stainless-steel autoclave, which was then air-evacuated by a rotary pump at 373 K for 1 h. After the autoclave was cooled down to room temperature (RT), H2 (purity: 99.999 wt%) at 7 MPa was introduced. The hydrogenation kinetics and pressure composition isotherm (PCT) curves during the dehydrogenation process were measured using a Siverts-type apparatus. The hydrogen amounts of the samples were calculated without considering the mass of silicone oil.
The morphologies of the samples were observed on a scanning electron microscope (SEM, Hitachi REGULUS8230, Japan). The distribution of the particle size was analyzed by a Malvern particle analyzer (Bettersize 1900, China). The contact angles between the alloy and silicone oil were obtained by a contact angle meter (SL250, USA KINO Co., Ltd., USA). X-ray diffraction data of the samples were collected on an X-ray diffractometer (Oxford Xcalibur E diffractometer, UK) using Cu Kα radiation (λ = 1.5418 Å) at a scanning speed of 0.01°/s and 2θ of 25–80°. The microstrain of the samples was evaluated by refining the XRD patterns using the Rietveld method with the software Jade 6.0.
3.2. Strain Test
The home-made metal hydride (MH) reactor for the strain test is illustrated in Scheme 1. The reactor consists of two parts, an outer jacket and an inner MH container, made of stainless steel. The flanges were sealed by spiral wound gaskets (PTFE), and the upper flange contained a pipeline for hydrogen supply. The inner MH container with an outer diameter of 33 mm and a wall thickness of 3 mm was equipped with four strain gauges (Zemic, China). To measure the strain in the tangential (q) directions on the inner container, strain gauges were placed at positions 3a to 3d, which were 25, 45, 65 and 85 mm away from the bottom of the container, respectively. Strain is the ratio of the amount of deformation with respect to the original size and is denoted by ε. The measurement range of the strain gauges was −11,000 ≤ με ≤ 11,000. The outer jacket with an outer diameter of 45 mm and a wall thickness of 3 mm had an eccentric circular structure, leaving a 3 mm gap for attaching the strain gauges. On the top of the outer jacket, a wiring hole allowed the connection of the strain gauges with the signal acquisition device.
For each measurement, approximately 400 g of the MH powder was loaded into the MH reactor in an Ar glove box, which occupied roughly 40% of the space of the inner container. Afterward, the reactor was heated by a heating jacket to 373 K and evacuated for 3 h. Subsequently, the MH reactor was placed in a water bath for the hydrogen absorption and desorption test.
4. Conclusions
Silicone oils with viscosity from 50 to 10,000 cSt were investigated as a glidant for a V-based BCC alloy, V40Ti26Cr26Fe8 (particle size: ~325 μm). We added 5 wt% silicone oil to the V40Ti26Cr26Fe8 powder, which formed a 320~460 nm-thick layer covering the surface of the V40Ti26Cr26Fe8 particles. Regardless of viscosity, the addition of 5 wt% silicone oil slightly reduced the initial hydrogen storage capacity of V40Ti26Cr26Fe8 but improved the reversibility of hydrogen absorption. During the first 20 hydrogen sorption cycles, the reversible capacity of V40Ti26Cr26Fe8 dropped from 2.42 to 2.06 wt%, with a capacity retention of 85.1%, while the capacity retention improved to 90%, 87.3% and 87% after the addition of silicone oil with viscosity of 50, 1000, 10,000 cSt, respectively. Furthermore, for the V40Ti26Cr26Fe8 powder bed with 5 wt% silicone oil, the maximum strain on the container walls decreased by ≥22.5%. These results indicate that silicone oil is an effective glidant to alleviate the stress concentration in hydrogen storage containers with a V-based BCC alloy.
Author Contributions
Conceptualization, Y.Y.; Formal analysis, F.H. and D.C.; Funding acquisition, Y.Y. and C.W.; Investigation, X.Z. and H.K.; Resources, Y.Y.; Supervision, Y.W. and C.W.; Validation, X.Z. and H.K.; Writing—original draft, H.K. and X.Z.; Writing—review & editing, Y.Y. All authors have read and agreed to the published version of the manuscript.
Funding
This work was funded by NSAF (Grant No. U2130208), the Key R&D Program of Sichuan Province (2022YFG0116) and the Sichuan University-Panzhihua City University-Enterprise Co-project (2020CDPZH-1).
Data Availability Statement
Not applicable.
Conflicts of Interest
The authors declare no conflict of interest.
References
- Züttel, A.; Remhof, A.; Borgschulte, A.; Friedrichs, O. Hydrogen: The future energy carrier. Philos. Trans. R. Soc. London. Ser. A Math. Phys. Eng. Sci. 2010, 368, 3329–3342. [Google Scholar] [CrossRef] [PubMed]
- Tarhan, C.; Çil, M.A. A study on hydrogen, the clean energy of the future: Hydrogen storage methods. J. Energy Storage 2021, 40, 102676. [Google Scholar] [CrossRef]
- Manoharan, Y.; Hosseini, S.E.; Butler, B.; Alzhahrani, H.; Senior, B.T.F.; Ashuri, T.; Krohn, J. Hydrogen Fuel Cell Vehicles; Current Status and Future Prospect. Appl. Sci. 2019, 9, 2296. [Google Scholar] [CrossRef] [Green Version]
- Usman, M.R. Hydrogen storage methods: Review and current status. Renew. Sustain. Energy Rev. 2022, 167. [Google Scholar] [CrossRef]
- Mori, D.; Hirose, K. Recent challenges of hydrogen storage technologies for fuel cell vehicles. Int. J. Hydrogen Energy 2009, 34, 4569–4574. [Google Scholar] [CrossRef]
- Eberle, U.; Felderhoff, M.; Schüth, F. Chemical and Physical Solutions for Hydrogen Storage. Angew. Chem. Int. Ed. 2009, 48, 6608–6630. [Google Scholar] [CrossRef]
- Sakintuna, B.; Lamari-Darkrim, F.; Hirscher, M. Metal hydride materials for solid hydrogen storage: A review. Int. J. Hydrog. Energy 2007, 32, 1121–1140. [Google Scholar] [CrossRef]
- Pasini, J.M.; Corgnale, C.; van Hassel, B.; Motyka, T.; Kumar, S.; Simmons, K.L. Metal hydride material requirements for automotive hydrogen storage systems. Int. J. Hydrogen Energy 2013, 38, 9755–9765. [Google Scholar] [CrossRef] [Green Version]
- Matsushita, M.; Monde, M.; Mitsutake, Y. Experimental formula for estimating porosity in a metal hydride packed bed. Int. J. Hydrogen Energy 2013, 38, 7056–7064. [Google Scholar] [CrossRef]
- Matsushita, M.; Tajima, I.; Abe, M.; Tokuyama, H. Experimental study of porosity and effective thermal conductivity in packed bed of nano-structured FeTi for usage in hydrogen storage tanks. Int. J. Hydrogen Energy 2019, 44, 23239–23248. [Google Scholar] [CrossRef]
- Smith, K.C.; Fisher, T.S. Models for metal hydride particle shape, packing, and heat transfer. Int. J. Hydrogen Energy 2012, 37, 13417–13428. [Google Scholar] [CrossRef] [Green Version]
- Lin, C.-K.; Chen, Y.-C. Effects of cyclic hydriding–dehydriding reactions of LaNi5 on the thin-wall deformation of metal hydride storage vessels with various configurations. Renew. Energy 2012, 48, 404–410. [Google Scholar] [CrossRef]
- Ao, B.; Chen, S.; Jiang, G. A study on wall stresses induced by LaNi5 alloy hydrogen absorption–desorption cycles. J. Alloys Compd. 2005, 390, 122–126. [Google Scholar] [CrossRef]
- Tran, X.; McDonald, S.; Gu, Q.; Nogita, K. In-situ synchrotron X-ray diffraction investigation of the hydriding and dehydriding properties of a cast Mg–Ni alloy. J. Alloys Compd. 2015, 636, 249–256. [Google Scholar] [CrossRef]
- Kojima, Y.; Kawai, Y.; Towata, S.-I.; Matsunaga, T.; Shinozawa, T.; Kimbara, M. Development of metal hydride with high dissociation pressure. J. Alloys Compd. 2006, 419, 256–261. [Google Scholar] [CrossRef]
- Hu, H.; Ma, C.; Chen, Q. Mechanism and microstructural evolution of TiCrVFe hydrogen storage alloys upon de-/hydrogenation. J. Alloys Compd. 2021, 877, 160315. [Google Scholar] [CrossRef]
- Saito, T.; Suwa, K.; Kawamura, T. Influence of expansion of metal hydride during hydriding–dehydriding cycles. J. Alloys Compd. 1997, 253–254, 682–685. [Google Scholar] [CrossRef]
- Qin, F. Pulverization, expansion of La0.6Y0.4Ni4.8Mn0.2 during hydrogen absorption–desorption cycles and their influences in thin-wall reactors. Int. J. Hydrogen Energy 2008, 33, 709–717. [Google Scholar] [CrossRef]
- Charlas, B.; Gillia, O.; Doremus, P.; Imbault, D. Experimental investigation of the swelling/shrinkage of a hydride bed in a cell during hydrogen absorption/desorption cycles. Int. J. Hydrogen Energy 2012, 37, 16031–16041. [Google Scholar] [CrossRef]
- Lin, C.-K.; Huang, S.-M.; Jhang, Y.-H. Effects of cyclic hydriding–dehydriding reactions of Mg2Ni alloy on the expansion deformation of a metal hydride storage vessel. J. Alloys Compd. 2011, 509, 7162–7167. [Google Scholar] [CrossRef]
- Wu, K.; Cai, B.; Fan, L.; Qin, L.; Chen, D.; Huang, Y. Stress measurement of MlNi4.5Cr0·45Mn0.05 alloy during hydrogen absorption-desorption process in a cylindrical reactor. Int. J. Hydrogen Energy 2020, 45, 28175–28182. [Google Scholar] [CrossRef]
- Heubner, F.; Hilger, A.; Kardjilov, N.; Manke, I.; Kieback, B.; Gondek, Ł.; Banhart, J.; Röntzsch, L. In-operando stress measurement and neutron imaging of metal hydride composites for solid-state hydrogen storage. J. Power Sources 2018, 397, 262–270. [Google Scholar] [CrossRef]
- Duan, W.; Du, J.; Wang, Z.; Niu, Y.; Huang, T.; Li, Z.; Pu, C.; Wu, Z. Strain variation on the reaction tank of high hydrogen content during hydrogen absorption-desorption cycles. Int. J. Hydrogen Energy 2013, 38, 2347–2351. [Google Scholar] [CrossRef]
- Melnichuk, M.; Cuscueta, D.J.; Silin, N. Effect of glidants on LaNi5 powder flowability. Int. J. Hydrogen Energy 2018, 43, 6219–6228. [Google Scholar] [CrossRef]
- Cuscueta, D.; Silin, N.; Melnichuk, M. Stress reduction in a hydride container by the addition of a glidant agent. Int. J. Hydrogen Energy 2020, 45, 27452–27456. [Google Scholar] [CrossRef]
- Meyer, K.; Zimmermann, I. Effect of glidants in binary powder mixtures. Powder Technol. 2004, 139, 40–54. [Google Scholar] [CrossRef]
- Wang, Q.-D.; Wu, J.; Chen, C.-P.; Li, Z.-P. An investigation of the mechanical behaviour of hydrogen storage metal beds on hydriding and dehydriding and several methods of preventing the damage of hydride containers caused by the expansion of hydrogen storage metals. J. Less Common Met. 1987, 131, 399–407. [Google Scholar] [CrossRef]
- Heubner, F.; Pohlmann, C.; Mauermann, S.; Kieback, B.; Röntzsch, L. Mechanical stresses originating from metal hydride composites during cyclic hydrogenation. Int. J. Hydrogen Energy 2015, 40, 10123–10130. [Google Scholar] [CrossRef]
- Yan, Y.; Chen, Y.; Wu, C.; Tao, M.; Liang, H. A low-cost BCC alloy prepared from a FeV80 alloy with a high hydrogen storage capacity. J. Power Sources 2007, 164, 799–802. [Google Scholar] [CrossRef]
- Yu, H.; Zhai, G.; Zhang, Y.; Li, Y.; Liu, Y.; Liu, Y. Structure and thermal stability study of dimethicone (in Chinese). Shanghai Meas. Test. 2020, 47, 28–32. [Google Scholar]
- Wu, C.; Zheng, X.; Chen, Y.; Tao, M.; Tong, G.; Zhou, J. Hydrogen storage and cyclic properties of V60Ti(21.4+x)Cr(6.6−x)Fe12 (0 ≤ x ≤ 3) alloys. Int. J. Hydrogen Energy 2010, 35, 8130–8135. [Google Scholar] [CrossRef]
Figure 1.
Contact angles between silicone oils with different viscosity and the V40Ti26Cr26Fe8 alloy (s1).
Figure 1.
Contact angles between silicone oils with different viscosity and the V40Ti26Cr26Fe8 alloy (s1).
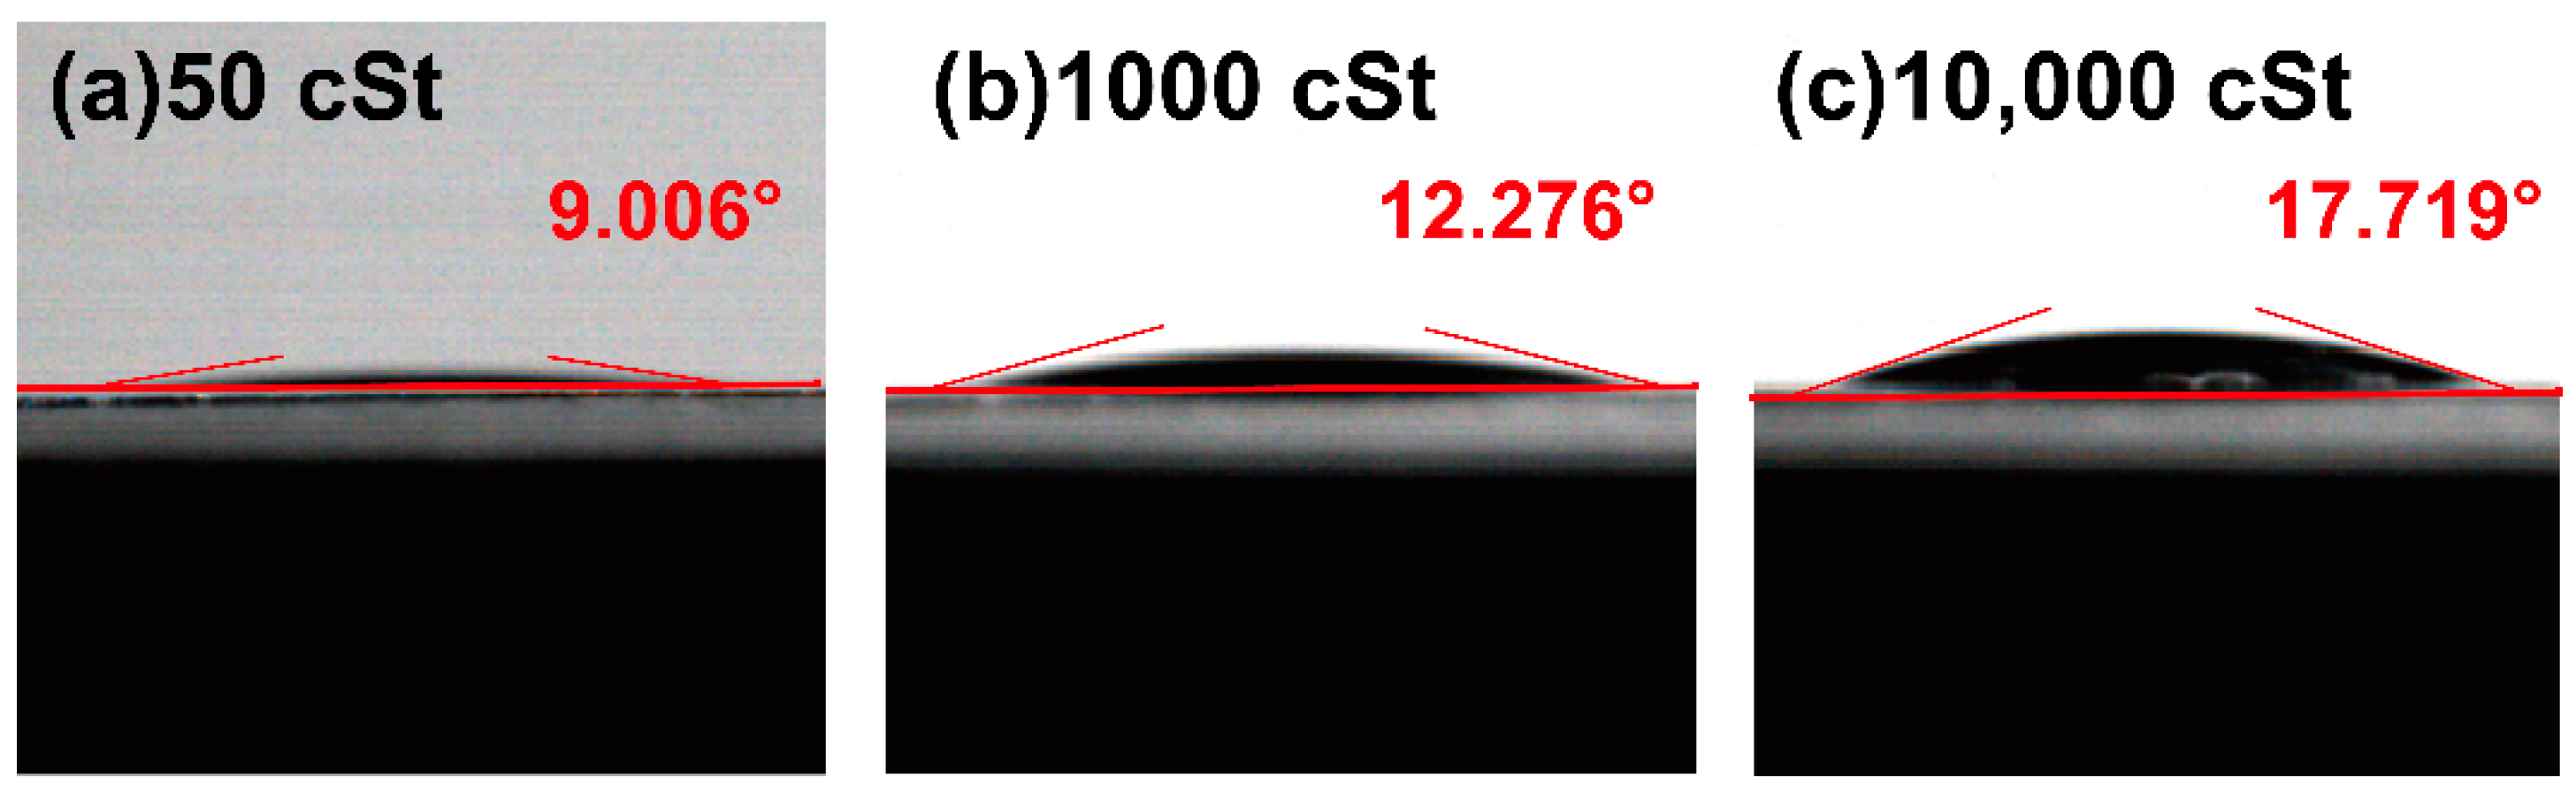
Figure 2.
(a) Initial hydrogen absorption kinetics and (b) PCT plots of samples s1 to s4 during the dehydrogenation process at 298 K.
Figure 2.
(a) Initial hydrogen absorption kinetics and (b) PCT plots of samples s1 to s4 during the dehydrogenation process at 298 K.
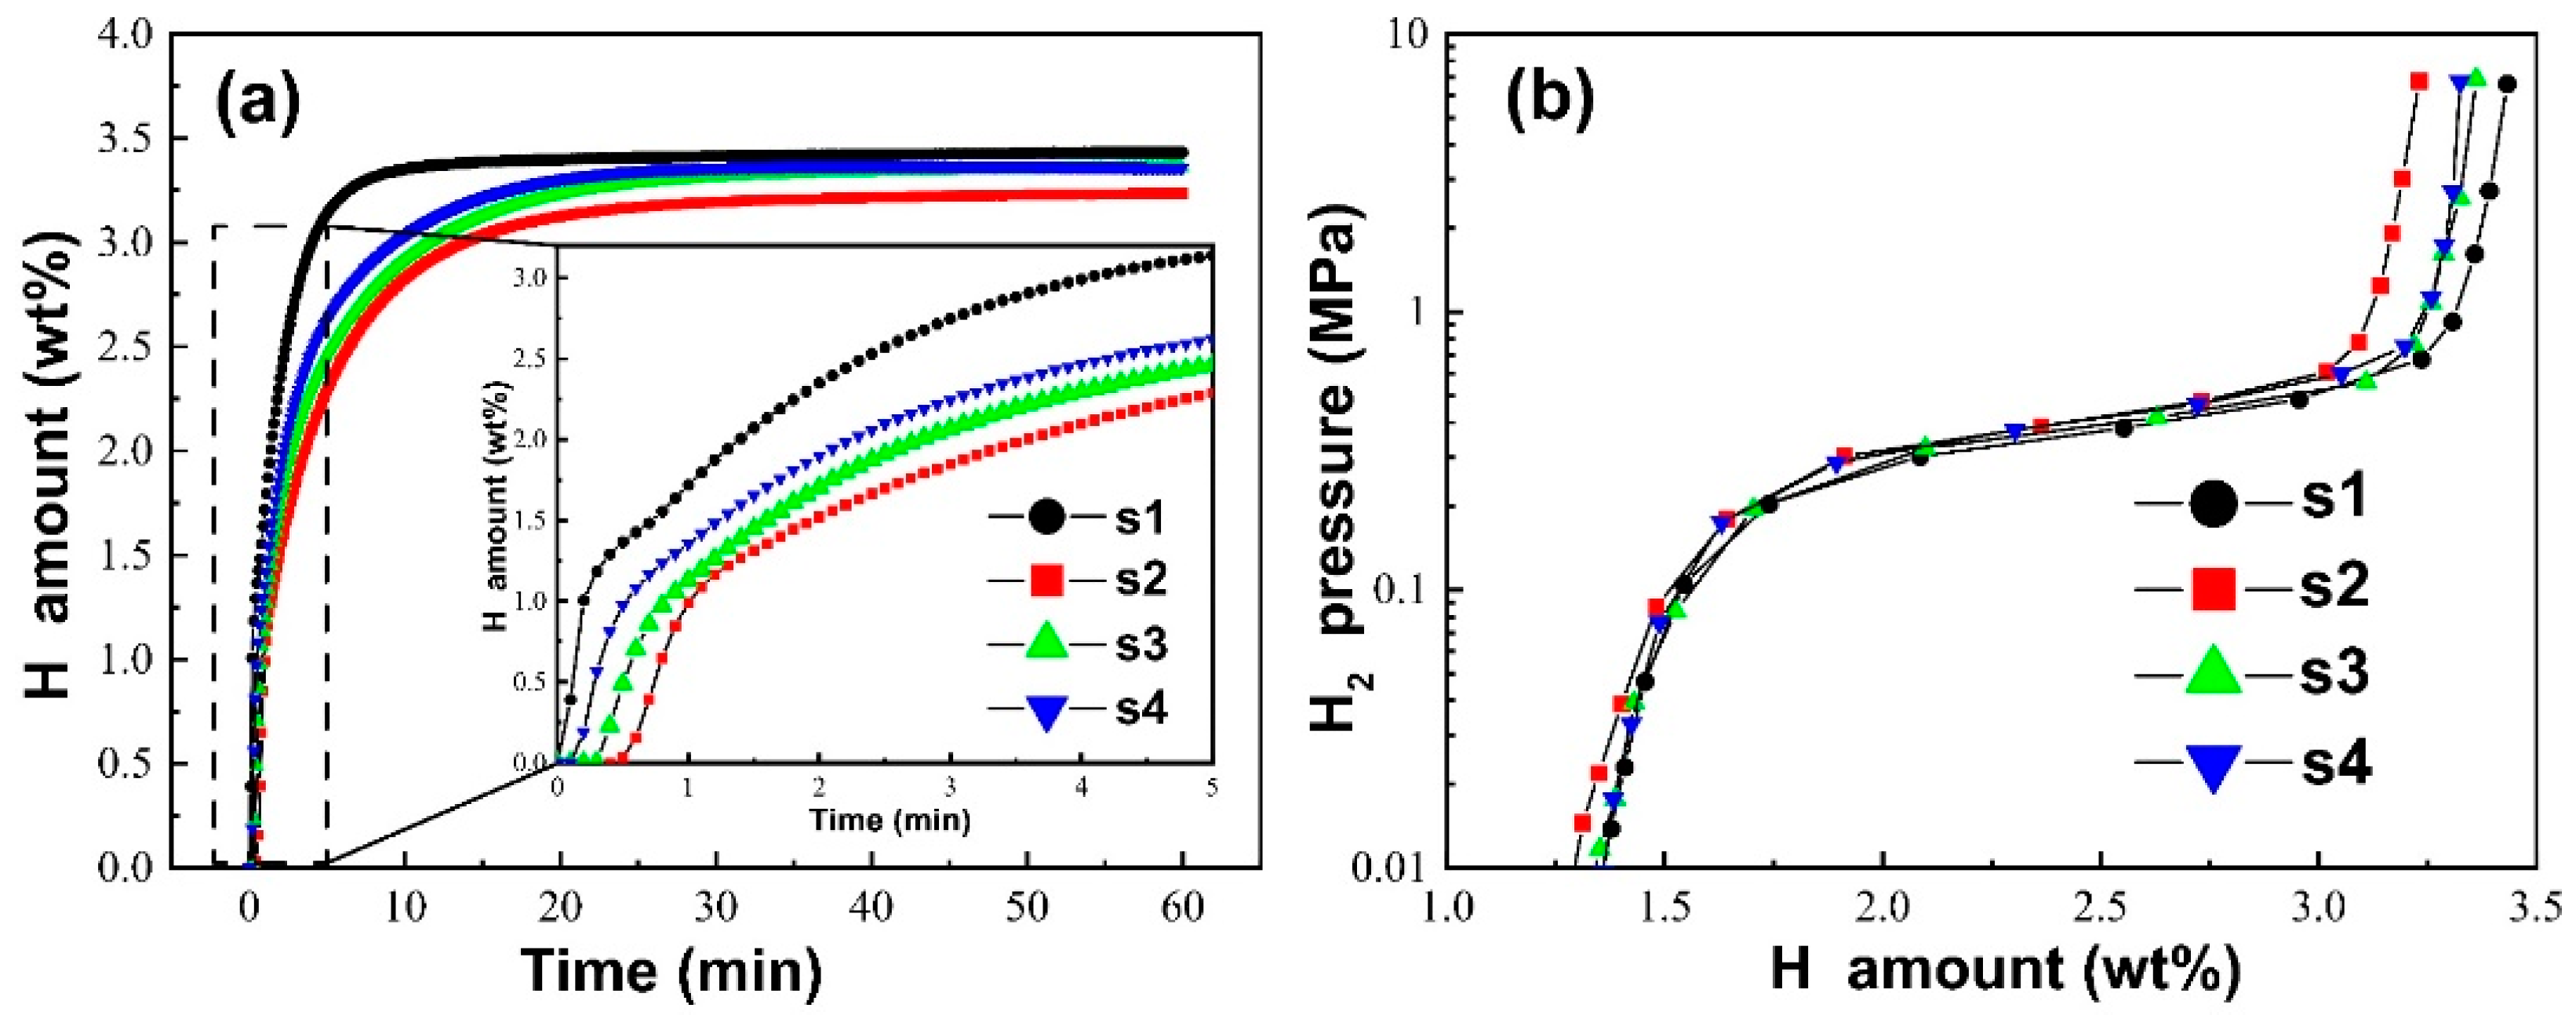
Figure 3.
(a–d) Hydrogen absorption kinetics of sample s1 to s4, (e) hydrogen absorption amounts within the first minute in different cycles, and (f) reversible hydrogen absorption amount from the 1st to the 20th cycle for samples s1 to s4.
Figure 3.
(a–d) Hydrogen absorption kinetics of sample s1 to s4, (e) hydrogen absorption amounts within the first minute in different cycles, and (f) reversible hydrogen absorption amount from the 1st to the 20th cycle for samples s1 to s4.
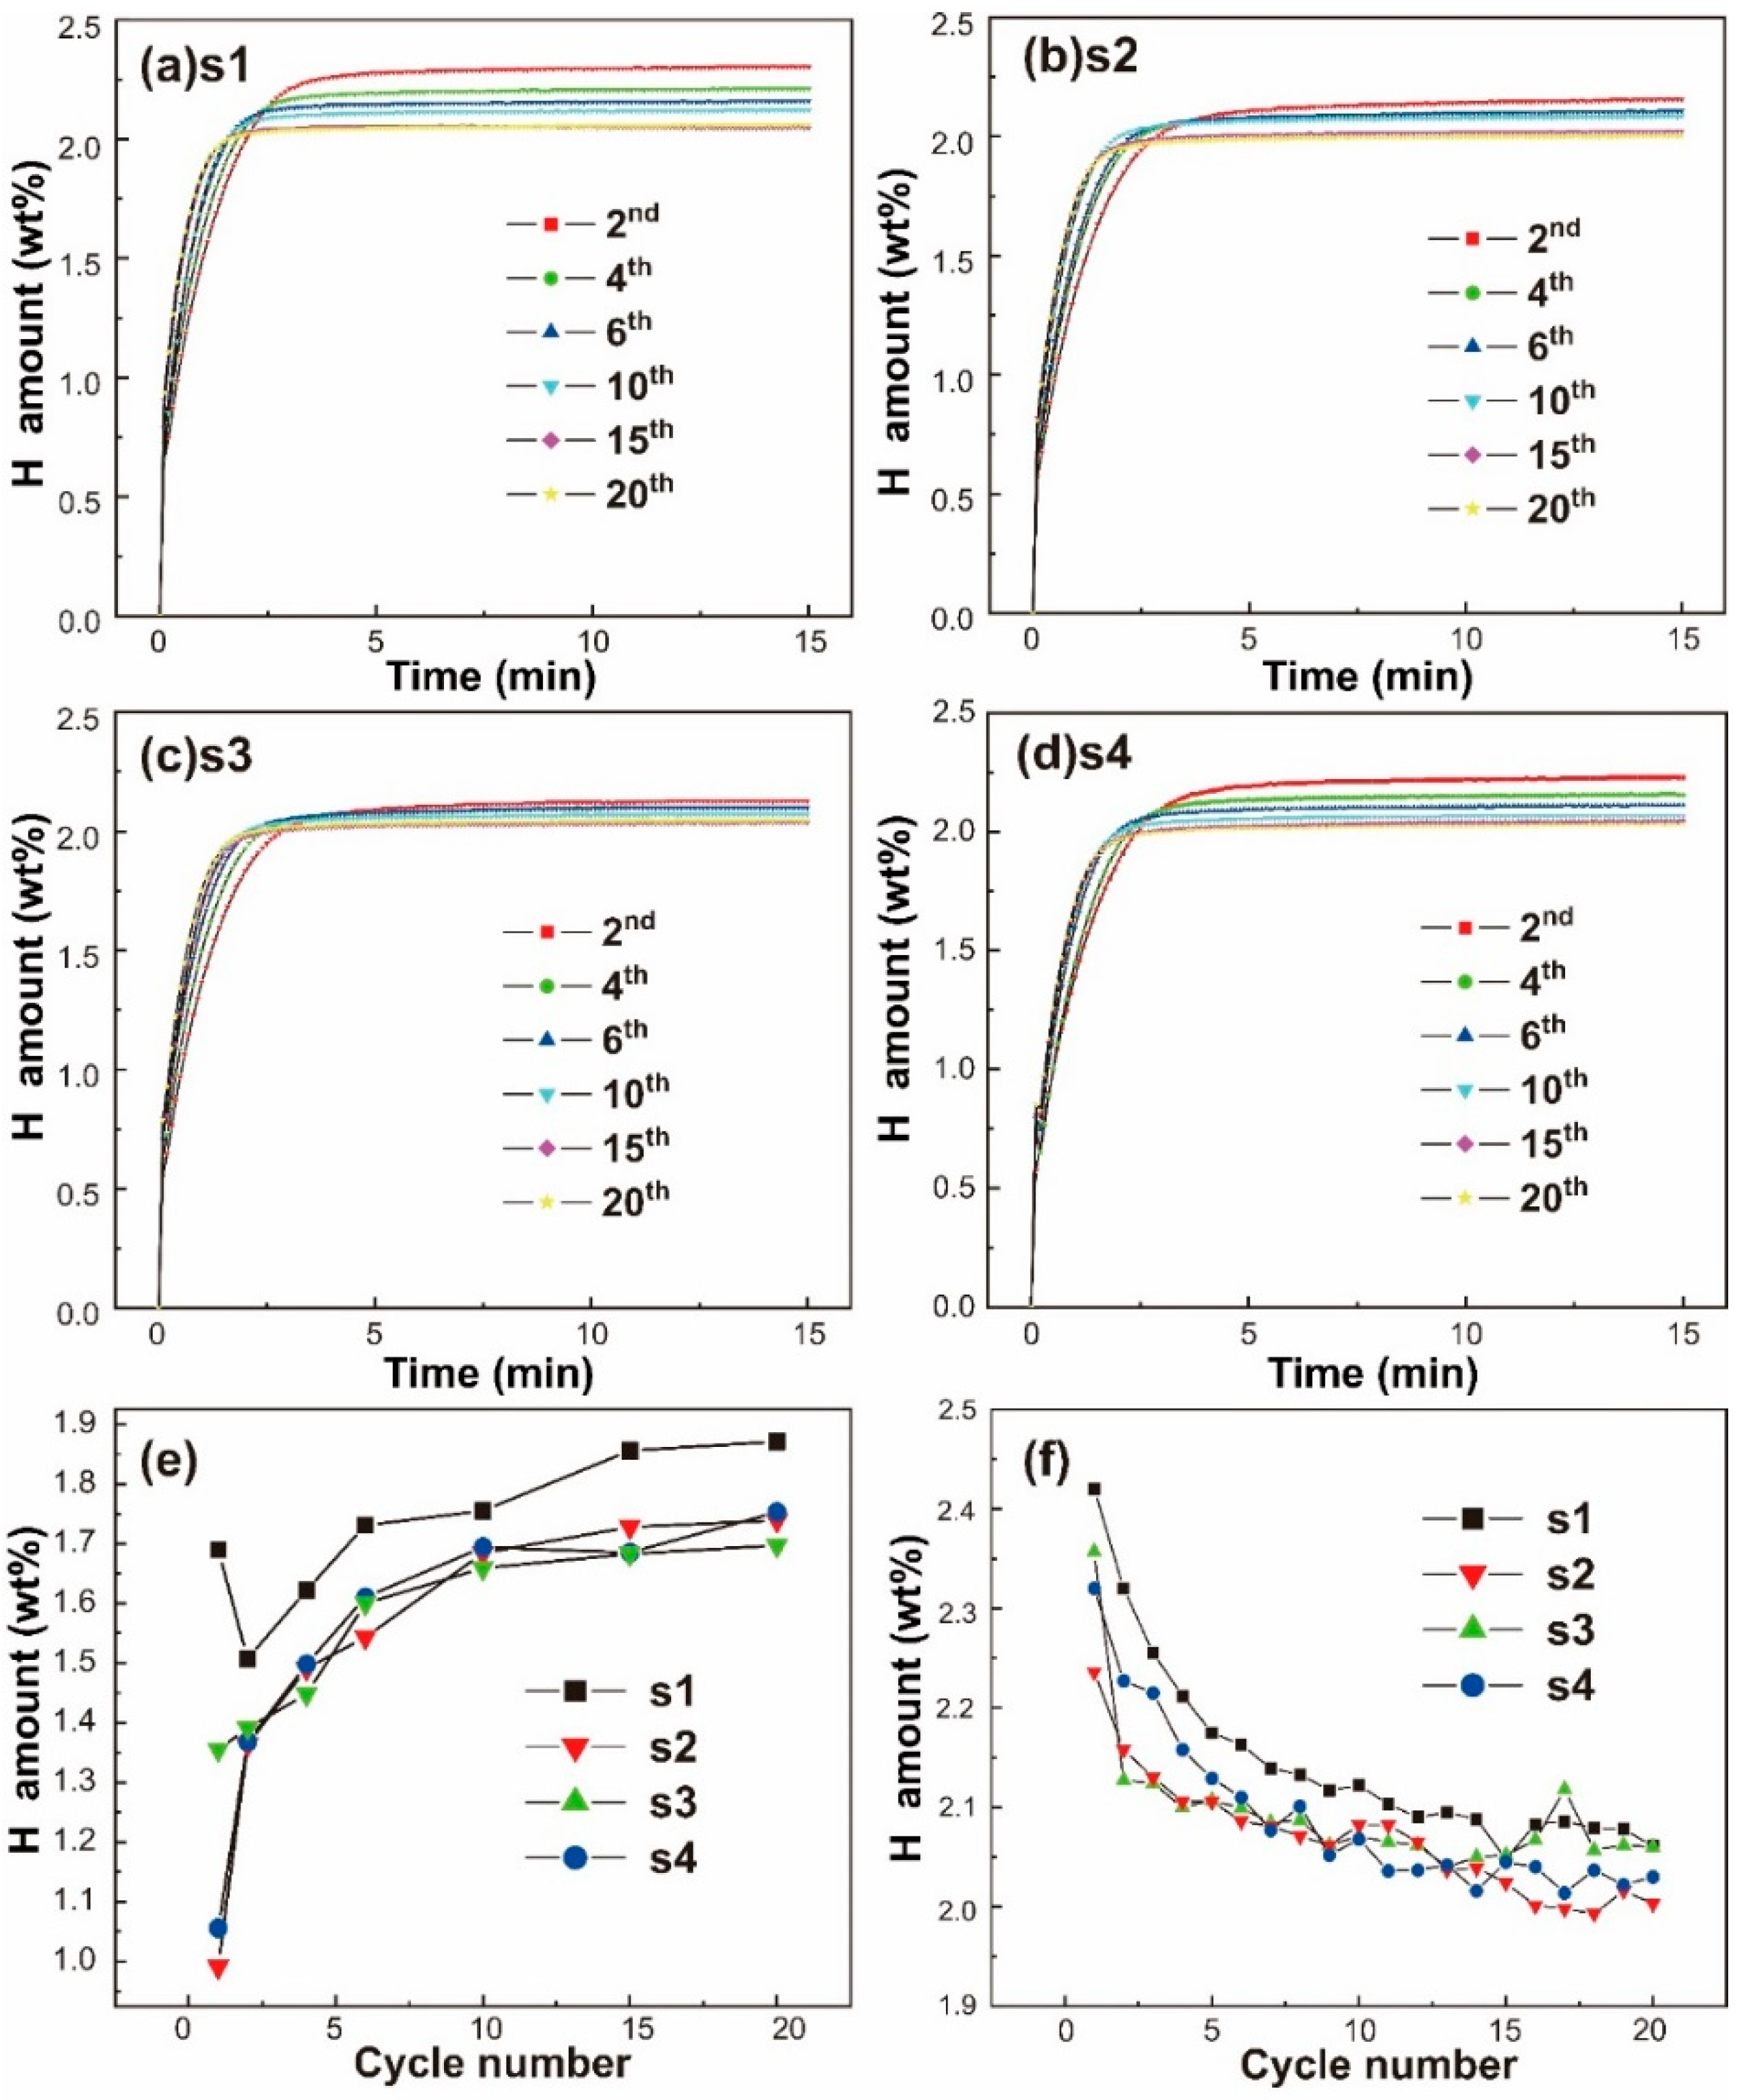
Figure 4.
(a–e) Rietveld refinement of the XRD data of sample s1 and samples s1 to s4 after 20 hydrogen ab/desorption cycles and (f) microstrains of sample s1 and samples s1 to s4 after 20 hydrogen ab/desorption cycles.
Figure 4.
(a–e) Rietveld refinement of the XRD data of sample s1 and samples s1 to s4 after 20 hydrogen ab/desorption cycles and (f) microstrains of sample s1 and samples s1 to s4 after 20 hydrogen ab/desorption cycles.
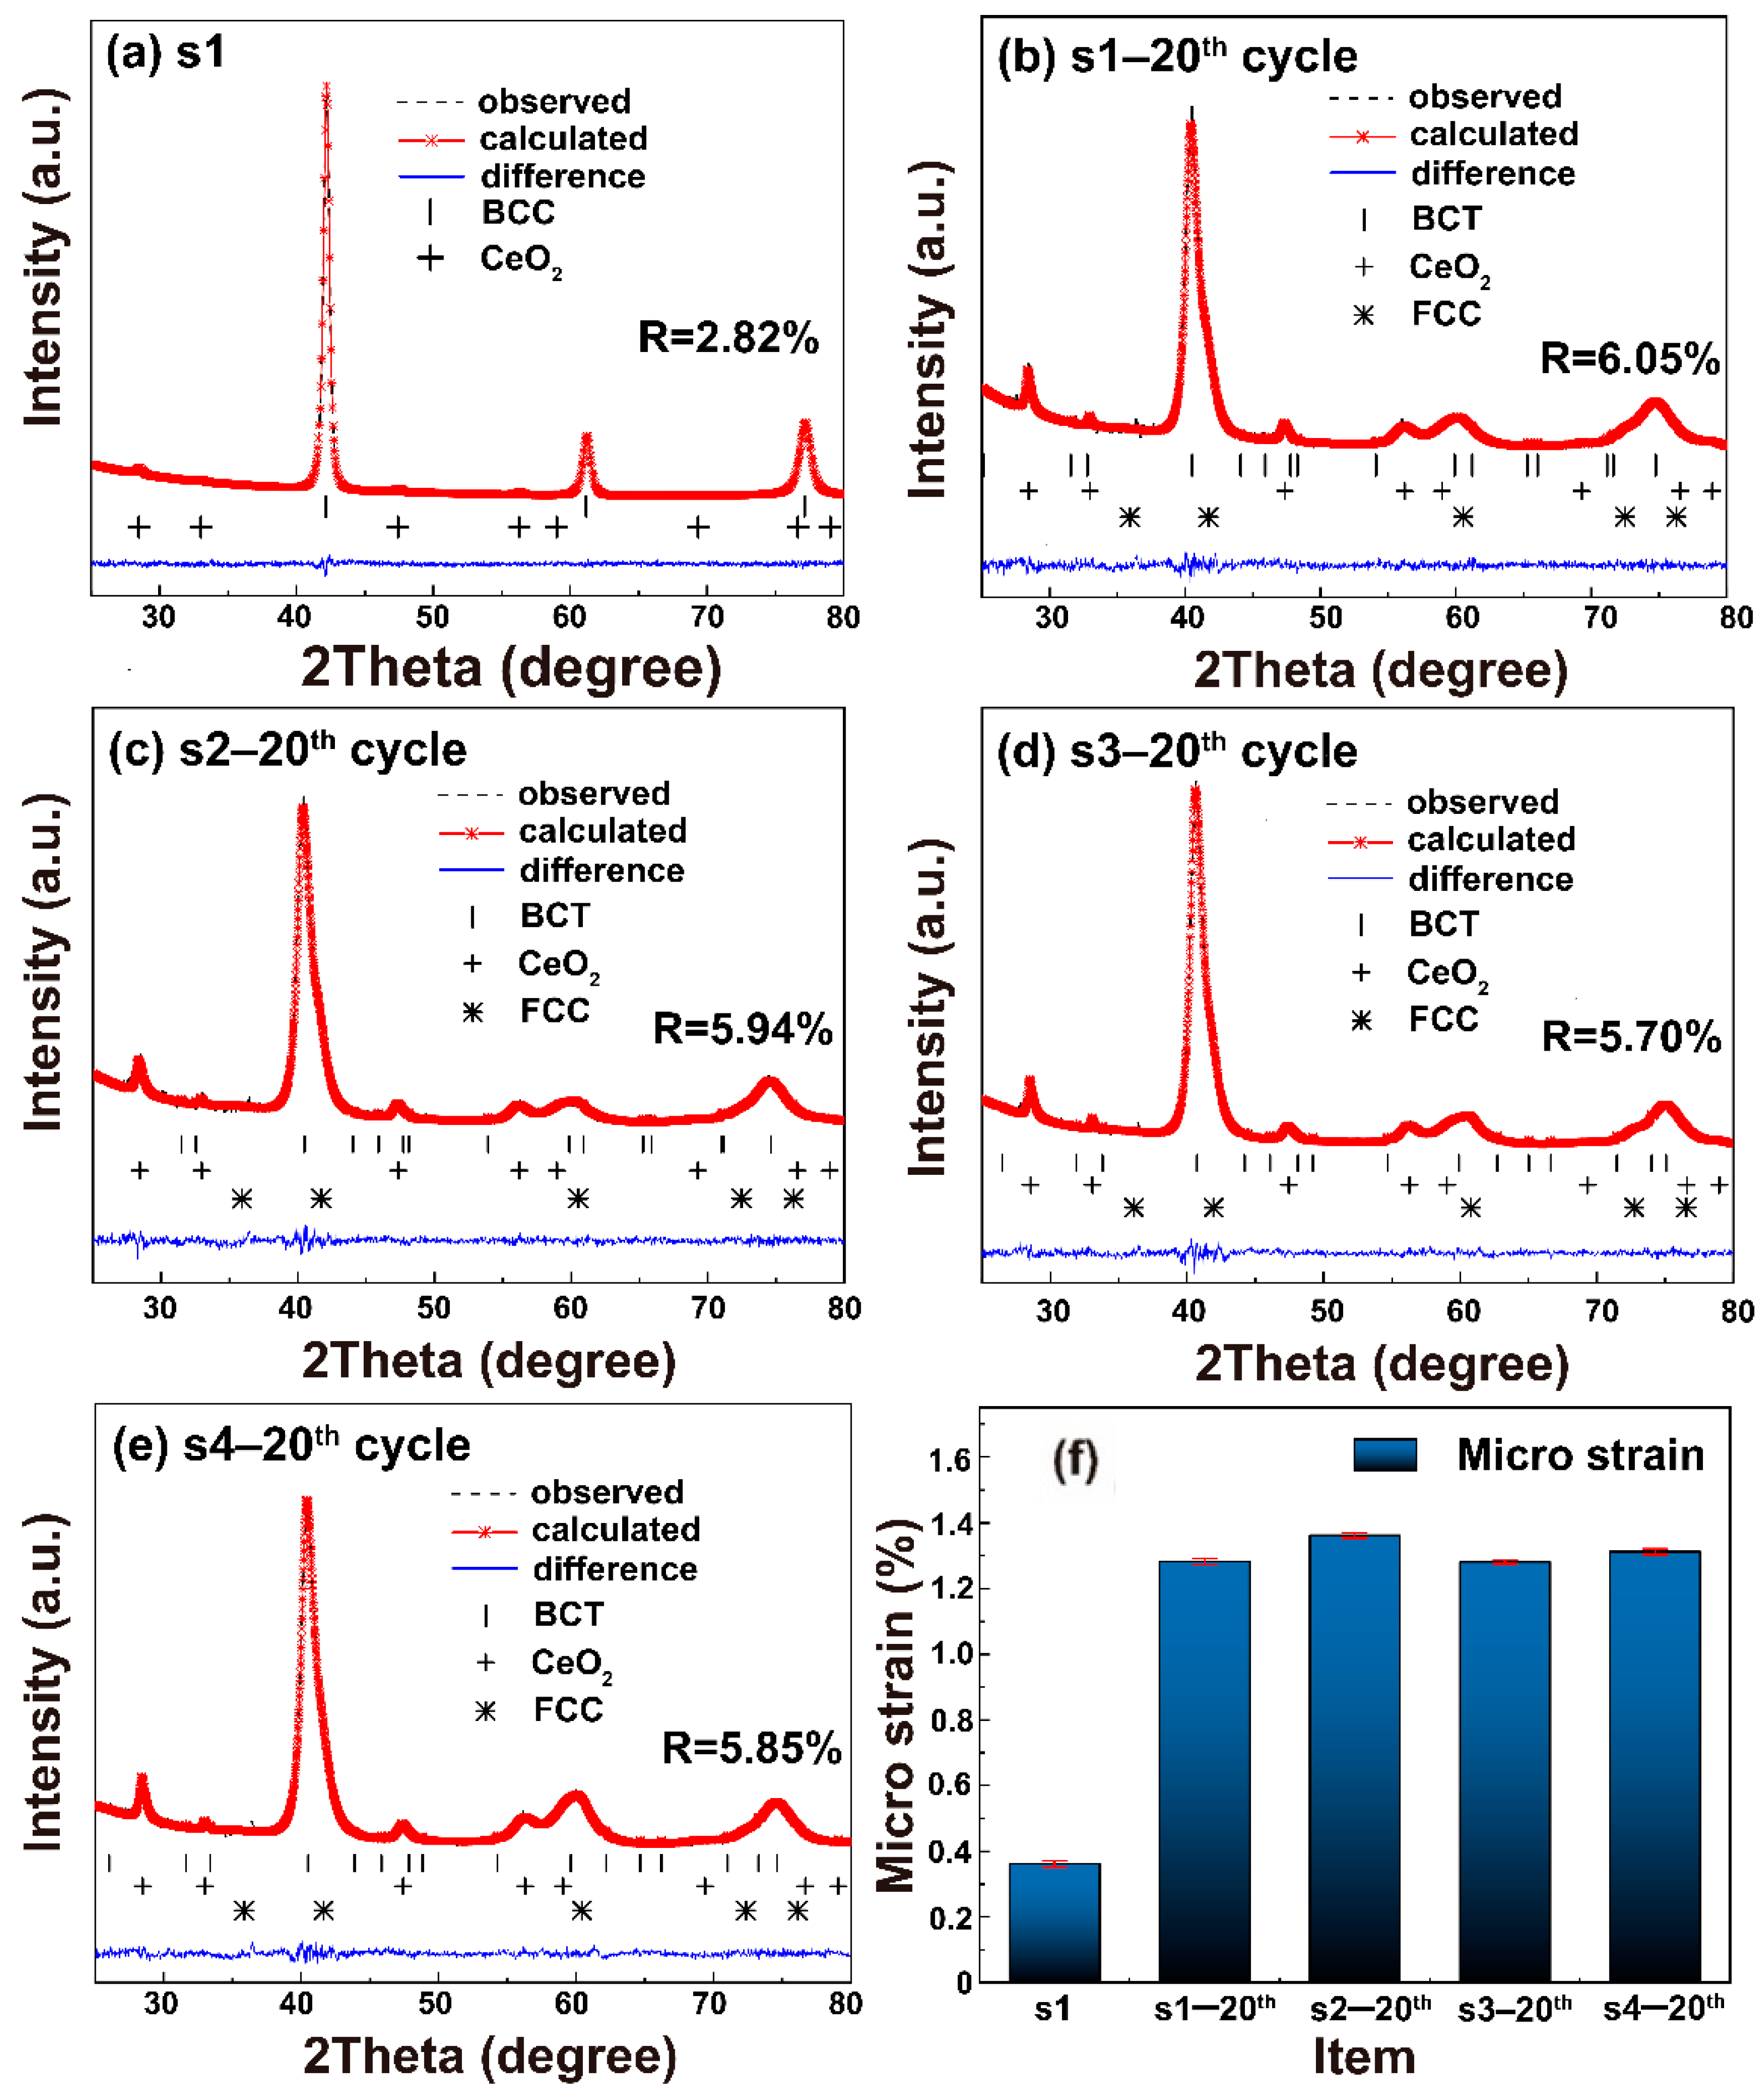
Figure 5.
(a,c) SEM images of sample s3 and (b,d) EDS mapping images of selected particles after the 1st and the 20th cycle. Insets of (a,c) display the particle size distribution.
Figure 5.
(a,c) SEM images of sample s3 and (b,d) EDS mapping images of selected particles after the 1st and the 20th cycle. Insets of (a,c) display the particle size distribution.
Scheme 1.
A schematic image of the strain test reactor. 1, hydrogen pipeline, 2, inner container, 3, strain gauges, 4, metal hydride, 5, outer jacket, 6, lower flange, 7, upper flange, 8, wiring hole.
Scheme 1.
A schematic image of the strain test reactor. 1, hydrogen pipeline, 2, inner container, 3, strain gauges, 4, metal hydride, 5, outer jacket, 6, lower flange, 7, upper flange, 8, wiring hole.
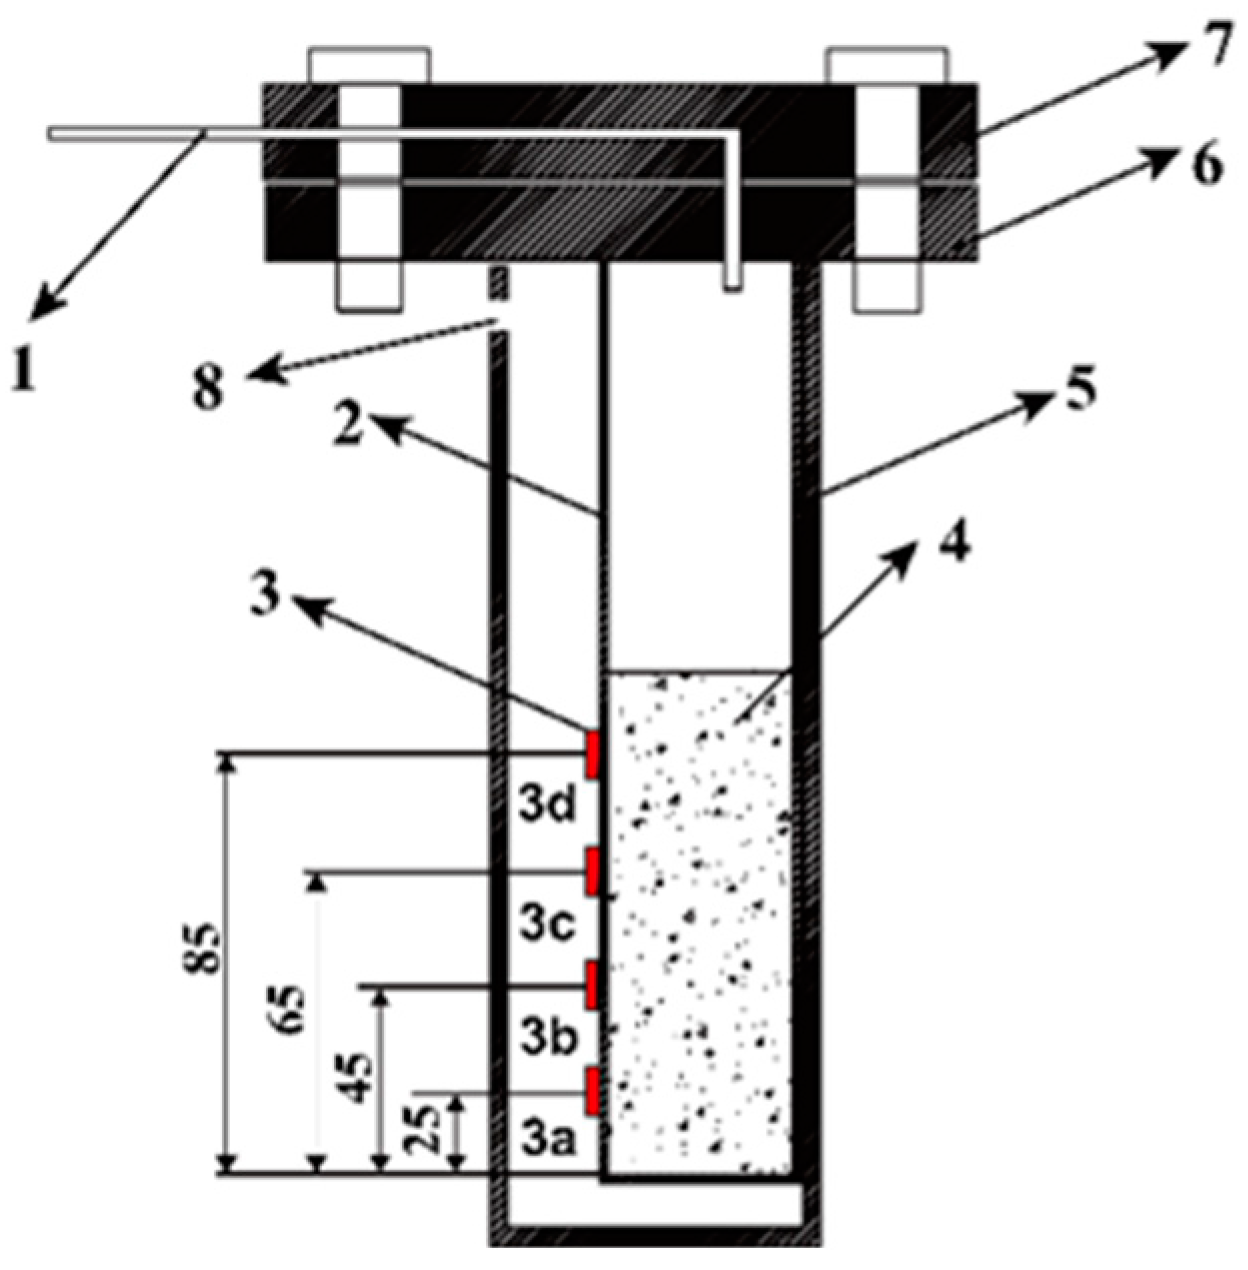
Figure 6.
(a–c) Strain distribution at positions 3a to 3d on the container for sample s5, s6, and s7 and (d) comparison of the maximum strain at position 3a to 3d for sample s5, s6 and s7.
Figure 6.
(a–c) Strain distribution at positions 3a to 3d on the container for sample s5, s6, and s7 and (d) comparison of the maximum strain at position 3a to 3d for sample s5, s6 and s7.
Publisher’s Note: MDPI stays neutral with regard to jurisdictional claims in published maps and institutional affiliations. |
© 2022 by the authors. Licensee MDPI, Basel, Switzerland. This article is an open access article distributed under the terms and conditions of the Creative Commons Attribution (CC BY) license (https://creativecommons.org/licenses/by/4.0/).
Share and Cite
MDPI and ACS Style
Zheng, X.; Kong, H.; Chu, D.; Hu, F.; Wang, Y.; Yan, Y.; Wu, C. Stress Reduction of a V-Based BCC Metal Hydride Bed Using Silicone Oil as a Glidant. Inorganics 2022, 10, 167. https://doi.org/10.3390/inorganics10100167
AMA Style
Zheng X, Kong H, Chu D, Hu F, Wang Y, Yan Y, Wu C. Stress Reduction of a V-Based BCC Metal Hydride Bed Using Silicone Oil as a Glidant. Inorganics. 2022; 10(10):167. https://doi.org/10.3390/inorganics10100167
Chicago/Turabian StyleZheng, Xin, Hanyang Kong, Desheng Chu, Faping Hu, Yao Wang, Yigang Yan, and Chaoling Wu. 2022. "Stress Reduction of a V-Based BCC Metal Hydride Bed Using Silicone Oil as a Glidant" Inorganics 10, no. 10: 167. https://doi.org/10.3390/inorganics10100167
Note that from the first issue of 2016, this journal uses article numbers instead of page numbers. See further details here.