
Exploration of Lycorine and Copper(II)’s Association with the N-Terminal Domain of Amyloid β


Department of Biotechnology, Chemistry and Pharmacy, University of Siena, Via Aldo Moro 2, 53100 Siena, Italy
*
Author to whom correspondence should be addressed.
Inorganics 2023, 11(11), 443; https://doi.org/10.3390/inorganics11110443
Submission received: 2 October 2023
/
Revised: 23 October 2023
/
Accepted: 15 November 2023
/
Published: 18 November 2023
(This article belongs to the Special Issue Editorial Board Members’ Collection Series in “Bioinorganic Chemistry of Copper”)
Abstract
:Lycorine (LYC) is an active alkaloid first isolated from Narcissus pseudonarcissus and found in most Amaryllidaceae plants. It belongs to the same family as galantamine, which is the active component of a drug used for the treatment of Alzheimer’s disease. Similarly to galantamine, LYC is able to suppress induced amyloid β (Aβ) toxicity in differentiated SH-SY5Y cell lines and it can weakly interact with the N-terminal region of Aβ via electrostatic interactions. The N-terminal Aβ domain is also involved in Cu(II)/Cu(I) binding and the formed complexes are known to play a key role in ROS production. In this study, the Aβ–LYC interaction in the absence and in the presence of copper ions was investigated by using the N-terminal Aβ peptide encompassing the first 16 residues. NMR analysis showed that Aβ can simultaneously interact with Cu(II) and LYC. The Cu(II) binding mode remains unchanged in the presence of LYC, while LYC association is favored when an Aβ–Cu(II) complex is formed. Moreover, UV-VIS studies revealed the ability of LYC to interfere with the catalytic activities of the Aβ–Cu(II) complexes by reducing the ascorbate consumption monitored at 265 nm.
Keywords:
lycorine; copper; amyloid; ternary association; ROS; natural compounds; Alzheimer’s disease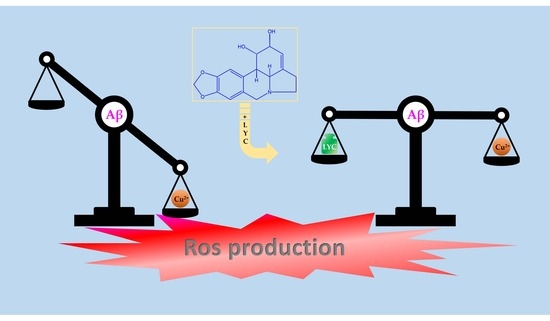
1. Introduction
Alzheimer’s disease (AD) is a progressive neurodegenerative disorder that is the most common cause of dementia in the world. It is characterized by a gradual decline in cognitive function, including memory, language, problem-solving, and judgment. As the disease progresses, people with AD may have difficulty performing everyday tasks and may become dependent on others for care [1].
Presently, over 55 million individuals globally are affected by dementia, with the majority, exceeding 60%, residing in low- and middle-income nations, as reported by the World Health Organization (WHO). Additionally, each year witnesses the onset of nearly 10 million new cases. Beyond the severity of the inexorable increase in cases of neurodegenerative diseases, it is important to ascertain the incidence of the costs involved. In fact, during the year 2019, dementia incurred a global economic cost of 1.3 trillion US dollars. Around half of this financial burden is associated with informal caregivers (such as family members and close friends) who, on average, devote 5 h per day to caregiving and supervision [2,3].
In addition to the suffering of patients and family members, the socioeconomic impact is devastating. Prevention must therefore be strengthened in order to delay and slow down symptoms. At the same time, it is necessary to invest in drug research even if developing a drug takes 13 years from preclinical studies to FDA approval. The high rate of failure of AD drug development is partly responsible for the high costs of advancing AD drug development [4,5,6]. It is advisable to increase research funds to counter this inexorable trend and at the same time not to neglect research on natural molecules that can offer a valuable therapeutic contribution [7,8,9,10].
The exact cause of AD is unknown, but it is thought to be caused by a combination of genetic and environmental factors. Some of the known risk factors for AD include (1) age: AD is most common in older adults, with the risk of developing the disease increasing with age [11,12,13]; (2) family history: people with a family history of AD are more likely to develop the disease themselves [14,15]; (3) genetic mutations: some genetic mutations have been linked to an increased risk of developing AD [16,17]; (4) head injuries: a history of head injury may increase the risk of developing AD [18]; and (5) cardiovascular disease: cardiovascular disease risk factors, such as high blood pressure, high cholesterol, and diabetes, have been linked to an increased risk of AD [19].
AD is characterized by two hallmark neuropathological features: amyloid plaques and tau tangles. Amyloid plaques are formed by the buildup of amyloid beta protein outside of the nerve cells. Tau tangles are formed by the buildup of tau protein inside of the nerve cells. Amyloid beta (Aβ) is a peptide that is produced by the normal processing of the amyloid precursor protein (APP), leading to the formation of Aβ42 and Aβ40 peptides. These fragments differ in length, aggregation propensity, and toxicity, the former being more prone to form aggregates [20]. APP is a protein that is found on the surface of the nerve cells. Aβ is normally produced and cleared from the brain, but in people with AD, Aβ accumulates in the brain and forms plaques [21]. Although the exact role of Aβ in AD is not fully understood, there is evidence supporting its central role in the disease process, showing a correlation between the amount of Aβ in the brain and the severity of AD symptoms [22]. The accumulation and formation of beta-amyloid plaques in the brain is also correlated to the oxidative damage caused by Reactive Oxygen Species (ROS). ROS are chemically reactive molecules (superoxide anions, hydroxyl radicals, and hydrogen peroxide) that can cause damage to various cellular components, including DNA, proteins, and lipids. The body has defense mechanisms, such as antioxidants, to neutralize ROS and prevent their harmful effects. However, when ROS levels are chronically elevated or antioxidant defenses are overwhelmed, it can lead to pathological conditions [23,24,25,26]. ROS can trigger oxidative stress processes that damage brain cells and induce inflammatory reactions. At the same time, amyloid accumulation can lead to an imbalance in brain metal homeostasis, creating conditions that favor ROS production. This detrimental cycle can amplify cellular damage and the cognitive decline observed in neurodegenerative diseases.
Nowadays, there is no cure for Alzheimer’s disease, and the available treatments focus on alleviating symptoms, slowing the progression of the disease, and enhancing the individual’s quality of life [27]. The currently approved medications are cholinesterase inhibitors. Acetylcholinesterase is an enzyme that breaks acetylcholine in the synaptic cleft, reducing its availability for nerve communication with negative consequences for memory, learning, and other cognitive functions [28]. Cholinesterase inhibitors, including drugs like donepezil, rivastigmine, and galantamine, work by blocking this enzyme’s activity to promote greater availability of the neurotransmitter to the neurons [29,30]. Memantine is the ultimate drug approved by the FDA for moderate to severe AD and works by blocking excessive activity of glutamate, an excitatory neurotransmitter [31]. It helps regulate glutamate levels in the brain, potentially protecting nerve cells from further damage. Memantine is often used in combination with cholinesterase inhibitors for a more comprehensive approach to symptom management.
Among the four approved drugs, galantamine (GAL) is the only one of natural origin; in fact, it is an alkaloid that derives from the family of Amaryllidaceae plants [32]. We recently investigated and compared the behavior of GAL with lycorine (LYC), another alkaloid from the same family plant [33]. The interest in LYC is derived from the interesting features exhibited by this natural alkaloid against different pathologies [34,35,36]. GAL and LYC were studied by evaluating their neuroprotective effects, antioxidant properties, and beta-amyloid-binding abilities [33]. Using a combined ligand- and peptide-based approach, we analyzed the atomic and molecular interactions of LYC and GAL with the pathogenic Aβ40 peptide, revealing that both alkaloids possess the ability to selectively induce changes in Aβ40 resonances [33]. The protective effect of these two alkaloids on SH-SY5Y differentiated cells previously intoxicated with Aβ42 were also evaluated. Surprisingly, our data indicated that LYC exhibits a greater ability to attenuate Aβ42-induced cytotoxicity in SH-SY5Y cells compared to GAL [33]. In this study, according to the investigation methods, Aβ42 or Aβ40 isoforms were differentially used. Spectroscopic analysis was mainly performed on Aβ40, which is less prone to aggregation compared to Aβ42 and therefore more stable and easy to handle. On the other hand, cellular studies were performed by using Aβ42, exhibiting a greater tendency to form aggregates and being more toxic than Aβ40.
Given the highly promising outcomes exhibited by LYC, particularly its capability to engage with the N-terminal section of Aβ via electrostatic interactions with residues also involved in copper binding [37], we opted to focus our study on a comprehensive exploration of the molecular interactions between LYC and Aβ, both in the presence and absence of copper(II). For this study, we decided to utilize the Aβ16 peptide, a fragment encompassing the N-terminal domain of Aβ, acting as the minimal binding motif for Cu(II) [38]. The interactions of LYC with the apo- and copper(II)-bound forms of Aβ16 were investigated by using NMR and UV-VIS techniques, providing new insights into the chemical and reactivity features of Aβ–Cu(II)–LYC associations.
2. Results
The interaction between Aβ16, LYC, and Cu(II) ions was first evaluated using NMR spectroscopy. Compared to the longest Aβ fragments, Aβ42 and Aβ40, Aβ16 has a good solubility in water at a physiological pH and does not form oligomeric or aggregated species in solutions. The NMR assignment of the Aβ16 signals was obtained via the analysis of 1H-1H TOCSY and NOESY spectra and it is reported in Table S1. From the analysis of the NMR spectra, the lack of the amide signals corresponding to Ala2, His6, Asp7, Ser8, His13, His14, and Gln15 is evident. The absence of NH resonances is generally observed for flexible peptides at a physiological pH due to their lability and exchange with water protons. In this case, the NMR data are consistent with a larger solvent exposure of Ala, Asp, His, Ser, and Gln residues leading to faster amide proton exchange rates known to be dependent on the amide pKa [39]. On the other hand, NMR investigations performed on an acetylated Aβ16 system at a lower temperature (T = 278 K) revealed the presence of all nitrogen backbone main-chain protons, strongly indicating the influence of temperature on amide–water proton exchange [40].
2.1. Study of Aβ16–LYC Interaction
Upon the full NMR assignment of the Aβ16 spectra, the effects of LYC were evaluated by looking at the variations in the chemical shifts and line broadening of both the Aβ16 and LYC signals. As shown in Table 1 and Figure 1, the LYC protons were slightly perturbed in presence of Aβ16 and, as expected, the chemical shift variations were more pronounced at a the larger Aβ16:LYC ratio. Moreover, Table 1 points out that larger effects are exhibited by the protons in the proximity of the nitrogen atom in position 6, in agreement with the data recorded for the system Aβ40L–YC [33].
Beyond the results obtained on the LYC resonances, the comparison between the NMR spectra of the Aβ16 in the absence and in the presence of LYC indicates His residues as the most affected ones, being weakly downfield-shifted by increasing the LYC concentration up to 1.2 eqs. (Figure 2A). On the other hand, LYC causes the line broadening of selected Aβ16 cross-peaks of the 1H-1H TOCSY (Figure 2B,C). In particular, upon LYC addition, we observed the disappearance of the correlations belonging to Asp1, Glu3, Arg5, Glu11, Val12, and Lys16. The observed variations agree with the effects recorded on the Aβ40–LYC system, strongly indicating that the Aβ–LYC interaction occurs at the N-terminal Aβ region [33].
In order to better evaluate the LYC-induced structural rearrangements, the CD spectra of Aβ16 in the presence and in the absence of LYC were collected. The CD spectra of Aβ16 showed the typical features of a disordered and flexible peptide exhibiting a negative absorption at 198 nm (Figure S1). The addition of 0.5 and 1.0 LYC equivalents lead to subtle changes in the CD spectra. In both cases, we observed a slightly increased absorption at 198 nm. No new absorptions were visible strongly indicating the absence of significant structural rearrangements of Aβ16 (Figure S1).
2.2. Study of Aβ16–Cu(II) Interaction
Cu(II)/Cu(I) binding to Aβ peptides has been extensively investigated in recent years as nicely described in recent review papers [23,41,42,43]. The binding domains of both copper oxidation states are located at the N-terminus, and it is well accepted that His acts as a copper-anchoring site. In order to evaluate the ability of LYC to interfere with the Aβ–Cu(II) interaction, 1H-NMR analysis on the Aβ16–Cu(II) system was first performed. In agreement with previous studies, the presence of substoichiometric Cu(II) ions in the Aβ16 solutions caused extensive line broadening on the His residues (Figure S2). In addition to the effects recorded on the His protons, the disappearance of the 1H-1H TOCSY correlations belonging to Asp1, Glu3, Arg5, Val12, Gln15, and Lys16 was observed (Figure 3). All these findings confirmed the involvement of the N-terminal and imidazole nitrogen in the copper coordination sphere, together with the carboxylate oxygens of Asp1 and Glu3.
2.3. Study of the Ternary Association between Aβ16, Cu(II), and LYC
The NMR spectra of the ternary systems were compared with the correspondent NMR spectra recorded only in the presence of Cu(II) or LYC. Both Aβ16 and LYC NMR signals were monitored for insights into the formation of ternary adducts. As shown in Figure S3 and Figure 4A, the copper-induced line broadening was completely conserved in the sample containing LYC as well, strongly indicating that copper coordination is unaltered by the presence of LYC, and pointing out the ability of copper to bind Aβ16 regardless of LYC’s presence. In fact, the two 1H-1H TOCSY experiments of Aβ16 recorded using Cu(II) and LYC or using Cu(II) only almost overlapped, except for the LYC signals that were present in the sample containing LYC only (Figure 4A). At the same time, the LYC NMR signals were monitored in the presence and absence of Cu(II) ions. As shown in Figure 4B,C, LYC protons experience a larger up-field shift when Cu(II) is coordinated to Aβ16. These findings suggest that upon Cu(II) coordination, Aβ16 retains its ability to associate with LYC. Moreover, the large shift observed in the LYC protons (Figure 5) suggests that the Aβ16–LYC interaction is more efficient when the peptide is bound to copper ions.
Although NMR experiments provided evidence of a ternary interaction between Aβ16, Cu(II), and LYC, further analysis was needed for a better understanding of the features associated with these adducts. By considering the ability of Aβ16–Cu(II) complexes to generate ROS, we decided to gain more insights into the impact of the Aβ16–Cu(II)–LYC system by analyzing the effects of LYC on the ascorbate prooxidant activity, both in the presence and absence of Aβ16. Redox active metal ions, like Cu(II), have the capacity to expedite the oxidation process of ascorbate when exposed to oxygen. This acceleration results in the generation of ROS via Fenton-type reactions [44,45]. The consumption of ascorbate can be effectively monitored by measuring its absorption at 265 nm as a function of time. This method provides a characteristic kinetic curve, the slope of which is directly associated with the reaction rate.
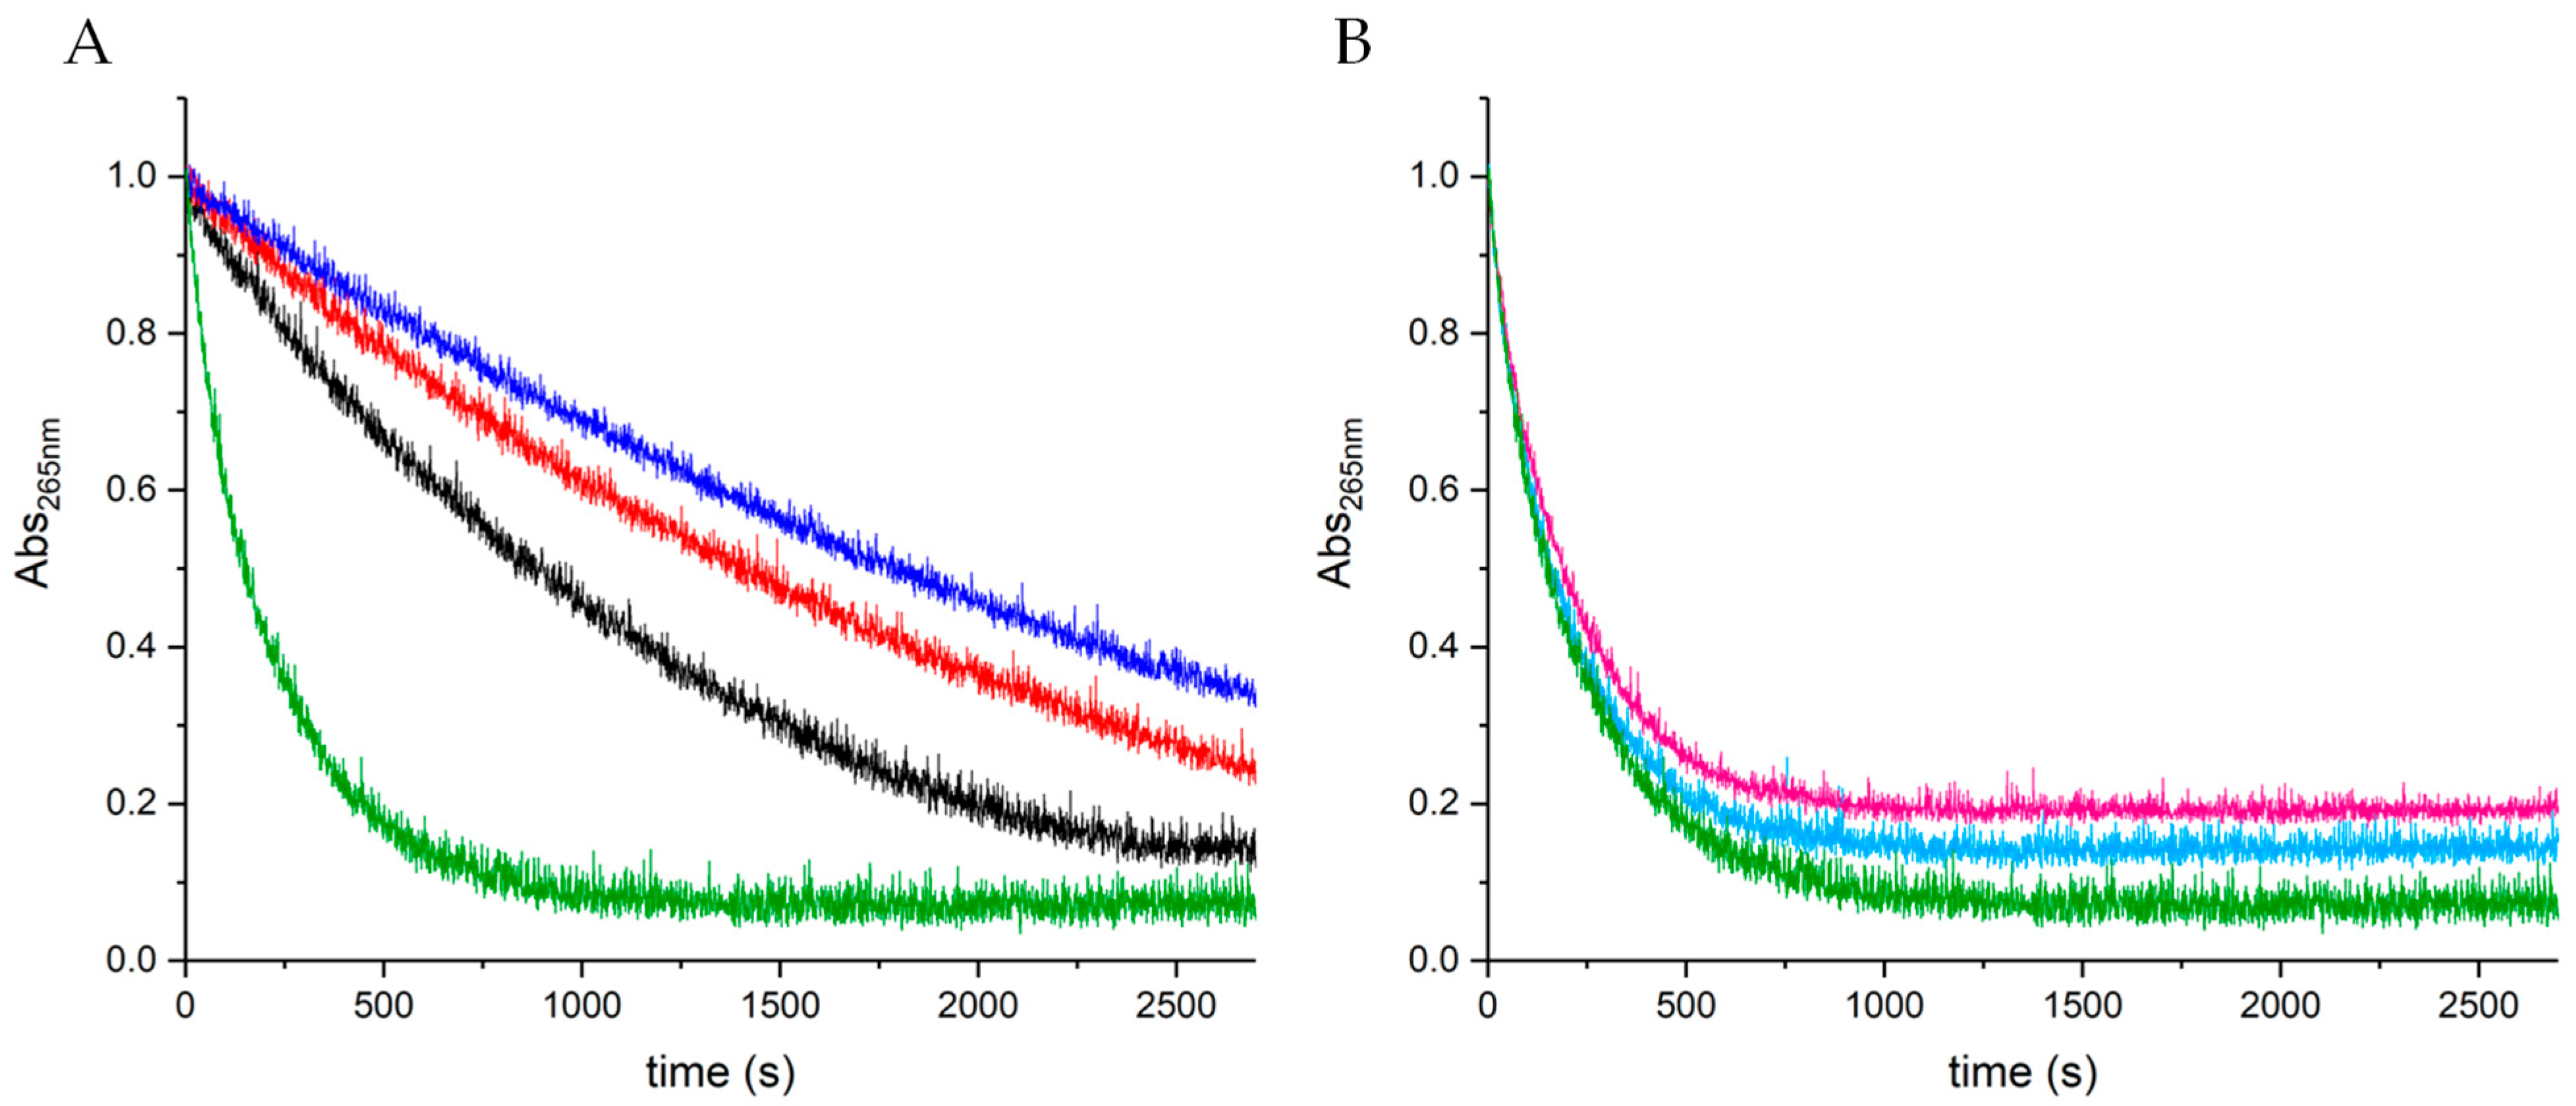
Figure 6 shows that LYC delays the consumption/oxidation of ascorbate, strongly indicating a protective role of LYC against ROS species, usually formed by ascorbate in the presence of copper(II) and molecular oxygen [44,45,46]. Such effects are dependent on the LYC concentration and are much more evident in the system containing Aβ16 and LYC. In particular, the changes observed on the slope of the kinetic curve (Figure 6A) reveal that the Aβ16–Cu(II)–LYC adduct is able to impact the kinetic rate of the ascorbate oxidation. Finally, the effects measured on LYC alone allowed us to independently evaluate LYC’s impact on the ascorbate–Cu(II) system. As shown in Figure 6B, the absence of Aβ16 results in a completely different LYC behavior, thus indicating that the observed ROS protection is mainly dependent on the Aβ1–LYC interaction. These findings agree with the NMR observations and indicate that the Aβ–LYC association, albeit weak, is able to interfere with Aβ16’s ability to generate ROS.
3. Discussion
In this study, the ability of LYC to interact with Aβ16 in the absence and presence of Cu(II) was investigated using NMR spectroscopy. Our findings indicate that LYC weakly associates with Aβ16 as shown by the variations in the NMR parameters of both LYC and Aβ16 (Figure 1 and Figure 2). In fact, the NMR signals of LYC showed slight chemical shift variations together with the His aromatic protons of Aβ16, while other Aβ16 residues, like Asp1, Glu3, Arg5, Glu11, and Val12, exhibited decreased intensity signals upon LYC addition. These data are in good agreement with the recent features shown by an Aβ40–LYC system [33] and indicate that LYC is also able to interact with the monomeric, disordered, and flexible Aβ16 form. The interaction takes place at the N-atom at position 6 of the LYC as shown by the largest effects displayed by the protons located nearby (Figure 5).
The NMR data collected on the Aβ16–LYC and Aβ16–Cu(II) systems indicate that both LYC and Cu(II) share a similar Aβ16-binding domain, mainly encompassing the N-terminal and His residues (Figure 2 and Figure 3). Despite the evidence of a correspondence between the LYC and Cu(II) association sites, the two species experience different binding modes since Cu(II) is able to form very stable coordination complexes while LYC weakly interacts with Aβ16 via electrostatic interaction. In this scenario, the NMR behavior of solutions containing Aβ16, copper, and LYC was investigated with the aim to evaluate the possible existence of a ternary association involving all three analyzed species.
The analysis of the NMR spectra reported in Figure 3 and Figure 4 points out that LYC’s association with Aβ16 is also conserved in presence of Cu(II). Moreover, the largest shifts measured in the ternary system containing Aβ16, Cu(II), and LYC (Figure 4 and Figure 5) gave evidence of stronger Aβ16–LYC associations when the peptide was bound to the cupric ion. This phenomenon could be explained by considering the different conformation assumed by the peptide in the apo- or metal-complexed form. In fact, previous CD investigations have shown that upon Cu(II) binding, both Aβ16 and Aβ26 assume a more ordered structure [47], which in turn might favor the interaction with LYC.
The formation of an Aβ16–Cu(II) –LYC adduct was also confirmed by the UV-VIS kinetic curve, indicating that the ternary system is capable of interfering with the prooxidant activity of the ascorbate (Figure 6A). In fact, the protective effects of LYC are tangible only in the presence of Aβ16, probably due to LYC’s influence in favoring peptide conformations less suitable for Cu(II)/Cu(I) redox cycling. The importance of backbone structural rearrangements is also supported by measuring the ascorbate oxidation in the presence of the His–LYC system (Figure S4). The choice of using His was made in order to evaluate the effects of LYC in a system able to strongly bind both Cu(II) and Cu(I), such as His, but at the same time not able to interact with LYC or undergo structural changes upon LYC association. The obtained UV-VIS kinetic curves point out that the same LYC amounts used for the Aβ–LYC system lead to completely different results when Aβ is substituted with His. In fact, the presence of LYC in the solution does not yield a slowing down of ascorbate oxidation but it rather induces a mild increase. Moreover, the lack of LYC concentration dependence suggests that the observed changes can be considered negligible.
The role of copper ions in AD is well documented in the literature [48,49,50,51,52,53]. Altered copper levels have been measured in the serum, cerebrospinal fluid, and post-mortem brains of AD patients [54,55]. Copper is also involved in several AD processes, such as oligomer and fibril Aβ formation [56,57,58], Aβ proteolysis and clearance [59,60], and oxidative stress [26,61,62,63]. At the same time, copper binding to Aβ peptides has been extensively investigated in recent years. It is well accepted that copper forms stable metal complexes at the N-terminal region of Aβ in both oxidation states, and the formed metal complexes are able to catalyze ROS production in vitro in the presence of molecular oxygen and ascorbate [26]. ROS production is mediated by the redox cycling between the Cu(II) and Cu(I) oxidation states occurring in the presence of ascorbate. Recently, it has been shown that ROS production is catalyzed by a low-populated copper binding state, different from the Cu(II) and Cu(I) binding modes observed in the “resting state” [64].
The copper-induced line broadening of the NMR signals allowed us to identify and compare the metal coordination sphere in the presence and absence of LYC. Our findings indicate that LYC has no effect on a Cu(II) binding mode of Aβ16, consisting of the three His imidazoles together with the Asp1 and Glu3 carboxylic groups, in agreement with previous results reporting copper(II) coordination to N and O donor atoms from His, N-terminus amine, and Asp and Glu carboxylate groups in a distorted square-pyramidal geometry [61].
In conclusion, our findings strongly suggest LYC’s ability to function against oxidative stress via its interaction with Aβ–Cu(II) complexes, which are known to be able to catalyze ROS production. Similarly to LYC, GAL was also found inhibit Aβ-mediated ROS accumulation [65], thus possibly explaining the neuroprotection exhibited by both alkaloids against Aβ toxicity and providing new insights into a deeper understanding of AD progression and the molecular basis of GAL and LYC in neuroprotection.
4. Materials and Methods
4.1. Materials
The CuSO4 solution (4% w/v, prepared from copper(II) sulfate pentahydrate), ascorbic acid (≥99%), lycorine hydrochloride (≥98% TLC), and L-Histidine, phosphate buffer and water for chromatography (LC-MS-grade) were all supplied by Sigma-Aldrich (Schnelldorf, Germany). The Aβ16 peptide was purchased from DBA Italia (Segrate, Italy).
4.2. NMR Experiments
The NMR experiments were performed at 14.1 T using a Bruker Avance III 600 MHz spectrometer and a 5 mm BBI (Broadband Inverse) probe. All the experiments were collected and carried out at controlled temperature T = 298 K ± 0.2 K. The chemical shifts were referenced against external 2-(Trimethylsilyl)-propionic-2,2,3,3-d4 acid sodium salt (TMSP-d4). The 1D spectra were recorded by using standard pulse sequences, and were analyzed by using the TopSpin 4.1.4 software. The residual water signal was suppressed using an excitation sculpting pulse program, applying a selective 2 ms long square pulse to water [66]. The TOCSY spectra were obtained using the MLEV-17 pulse sequence with a mixing time of 60 ms. The NOESY spectra were obtained using different mixing times to ascertain the best one. The NMR tubes were prepared by using a stock solution of Aβ16 peptide to achieve a final concentration of 0.5 mM. LYC and Cu(II) stock solutions were used to obtained the desired stoichiometric ratios Aβ16:Cu(II) and Aβ16:LYC in the NMR tubes. All the samples were prepared in phosphate buffer 30 mM at a pH of 7.5 with 10% D2O.
4.3. UV-VIS Measurements
The absorption spectra and the kinetic curves (45 min, 2700 s) were recorded on a Perkin Elmer Lambda 900 UV/VIS/NIR spectrophotometer. The UV-VIS samples were prepared by using ascorbate, Aβ16, L-His, and Cu(II) stock solutions to generate the final concentrations 20 μM, 10 μM, and 1 μM for ascorbate, Aβ16/L-His, and Cu(II), respectively. The stoichiometric ratios Aβ16/L-His:LYC were 1:0.5 and 1:1 during all the experiments. The samples were prepared in phosphate buffer 1 mM, pH 7.5. In order to avoid any sample contamination interfering with the ascorbate oxidation, all the stock solutions, the buffer, and the UV-VIS samples were prepared by using water for chromatography.
4.4. CD Studies
The Circular Dichroism (CD) spectra were acquired using a Jasco J-815 spectropolarimeter at room temperature. A 1 cm cell path length was used for data between 190 and 260 nm, with a 1 nm sampling interval. Four scans were collected for each sample, with a scan speed of 100 nm min−1 and a bandwidth of 1 nm. The baseline spectra were subtracted from each spectrum and data were smoothed with the Savitzky–Golay method [67]. The data were processed using the Origin 5.0 spread sheet/graph package. The Aβ16 samples were prepared to obtain a final concentration 10 μM in the cuvette. LYC addition was performed to obtain the Aβ16:LYC ratios 1:0.5 and 1:1. The samples were prepared in phosphate buffer 1 mM, pH 7.5.
Supplementary Materials
The following supporting information can be downloaded at https://www.mdpi.com/article/10.3390/inorganics11110443/s1: Figure S1: CD spectra of Aβ16 in absence (black lines) and presence of 0.5 (red lines) and 1.0 LYC eqs. (blue lines). Aβ16 concentration 10 µM, phosphate buffer 1 mM, T = 298 K; Figure S2: NMR spectra of Aβ16 0.5 mM in absence (black traces) and presence of 1.2 LYC eqs. (blue traces), 1.0 LYC eqs. (magenta traces), 0.8 LYC eqs. (cyan traces), 0.6 LYC eqs. (red traces), 0.4 LYC eqs. (green traces), and 0.2 LYC eqs. (gray traces). T = 298 K, pH 7.5, 20 mM phosphate buffer; Figure S3: Superimposition of selected regions of 1H-1H TOCSY spectra of Aβ16 0.5 mM (black), Aβ16 0.5 mM with 0.1 Cu(II) eqs. in absence (blue) and presence of 1.0 LYC eqs. (magenta). T = 298 K, pH 7.5, 20 mM phosphate buffer; Figure S4: UV-VIS kinetic curves of the systems composed of ascorbate 20 μM and Cu(II) 1 μM in the presence of His and LYC. The green curve corresponds to ascorbate in the presence of only copper(II), while the other colors refer to samples in the simultaneous presence of His and Aβ16, together or alone. Specifically, His 10 μM (blue), His 10 μM + LYC 5 μM (black), His 10 μM + LYC 10 μM (black); Table S1: 1H chemical shift assignment of Aβ16 0.5 mM, T = 298 K, pH 7.5, 20 mM phosphate buffer.
Author Contributions
Conceptualization, A.K. and D.V.; methodology, A.K. and D.V.; validation, A.K., G.V. and D.V.; formal analysis, A.K., G.V., and D.V.; investigation, A.K., G.V. and D.V.; resources, A.K. and D.V.; data curation, A.K., G.V. and D.V.; writing—original draft preparation, A.K. and D.V.; writing—review and editing, A.K., G.V. and D.V.; visualization, A.K., G.V. and D.V.; supervision, A.K.; project administration, D.V. All authors have read and agreed to the published version of the manuscript.
Funding
This research received no external funding.
Data Availability Statement
Data are contained within the article and supplementary materials.
Acknowledgments
The Consorzio Interuniversitario Risonanze Magnetiche di Metallo Proteine (CIRMMP) is acknowledged for the scholarship support.
Conflicts of Interest
The authors declare no conflict of interest.
References
- Scheltens, P.; De Strooper, B.; Kivipelto, M.; Holstege, H.; Chételat, G.; Teunissen, C.E.; Cummings, J.; van der Flier, W.M. Alzheimer’s Disease. Lancet 2021, 397, 1577–1590. [Google Scholar] [CrossRef]
- Dementia. Available online: https://www.who.int/news-room/fact-sheets/detail/dementia (accessed on 29 September 2023).
- World Health Organization. Global Action Plan on the Public Health Response to Dementia 2017–2025; World Health Organization: Geneva, Switzerland, 2017; ISBN 978-92-4-151348-7. [Google Scholar]
- Scott, T.J.; O’Connor, A.C.; Link, A.N.; Beaulieu, T.J. Economic Analysis of Opportunities to Accelerate Alzheimer’s Disease Research and Development. Ann. N. Y. Acad. Sci. 2014, 1313, 17–34. [Google Scholar] [CrossRef] [PubMed]
- Cummings, J.L.; Morstorf, T.; Zhong, K. Alzheimer’s Disease Drug-Development Pipeline: Few Candidates, Frequent Failures. Alzheimer’s Res. Ther. 2014, 6, 37. [Google Scholar] [CrossRef] [PubMed]
- Cummings, J.; Reiber, C.; Kumar, P. The Price of Progress: Funding and Financing Alzheimer’s Disease Drug Development. A&D Transl. Res. Clin. Interv. 2018, 4, 330–343. [Google Scholar] [CrossRef]
- International, A.D.; Patterson, C. World Alzheimer Report 2018: The State of the Art of Dementia Research: New Frontiers; Alzheimer’s Disease International (ADI): London, UK, 2018. [Google Scholar]
- Xiao, J.; Tundis, R. Natural Products for Alzheimer’s Disease Therapy: Basic and Application. J. Pharm. Pharmacol. 2013, 65, 1679–1680. [Google Scholar] [CrossRef] [PubMed]
- Palmioli, A.; Mazzoni, V.; De Luigi, A.; Bruzzone, C.; Sala, G.; Colombo, L.; Bazzini, C.; Zoia, C.P.; Inserra, M.; Salmona, M.; et al. Alzheimer’s Disease Prevention through Natural Compounds: Cell-Free, In Vitro, and In Vivo Dissection of Hop (Humulus lupulus L.) Multitarget Activity. ACS Chem. Neurosci. 2022, 13, 3152–3167. [Google Scholar] [CrossRef] [PubMed]
- da Rosa, M.M.; de Amorim, L.C.; Alves, J.V.d.O.; Aguiar, I.F.d.S.; Oliveira, F.G.d.S.; da Silva, M.V.; dos Santos, M.T.C. The Promising Role of Natural Products in Alzheimer’s Disease. Brain Disord. 2022, 7, 100049. [Google Scholar] [CrossRef]
- Braak, H.; Thal, D.R.; Ghebremedhin, E.; Del Tredici, K. Stages of the Pathologic Process in Alzheimer Disease: Age Categories from 1 to 100 Years. J. Neuropathol. Exp. Neurol. 2011, 70, 960–969. [Google Scholar] [CrossRef]
- Abate, G.; Vezzoli, M.; Sandri, M.; Rungratanawanich, W.; Memo, M.; Uberti, D. Mitochondria and Cellular Redox State on the Route from Ageing to Alzheimer’s Disease. Mech. Ageing Dev. 2020, 192, 111385. [Google Scholar] [CrossRef]
- Azam, S.; Haque, M.E.; Balakrishnan, R.; Kim, I.-S.; Choi, D.-K. The Ageing Brain: Molecular and Cellular Basis of Neurodegeneration. Front. Cell Dev. Biol. 2021, 9, 683459. [Google Scholar] [CrossRef]
- Talboom, J.S.; Håberg, A.; De Both, M.D.; Naymik, M.A.; Schrauwen, I.; Lewis, C.R.; Bertinelli, S.F.; Hammersland, C.; Fritz, M.A.; Myers, A.J.; et al. Family History of Alzheimer’s Disease Alters Cognition and Is Modified by Medical and Genetic Factors. eLife 2019, 8, e46179. [Google Scholar] [CrossRef]
- Green, R.C.; Cupples, L.A.; Go, R.; Benke, K.S.; Edeki, T.; Griffith, P.A.; Williams, M.; Hipps, Y.; Graff-Radford, N.; Bachman, D.; et al. Risk of Dementia among White and African American Relatives of Patients with Alzheimer Disease. JAMA 2002, 287, 329–336. [Google Scholar] [CrossRef] [PubMed]
- Silva, M.V.F.; Loures, C.d.M.G.; Alves, L.C.V.; de Souza, L.C.; Borges, K.B.G.; das Graças Carvalho, M. Alzheimer’s Disease: Risk Factors and Potentially Protective Measures. J. Biomed. Sci. 2019, 26, 33. [Google Scholar] [CrossRef] [PubMed]
- Bellenguez, C.; Küçükali, F.; Jansen, I.E.; Kleineidam, L.; Moreno-Grau, S.; Amin, N.; Naj, A.C.; Campos-Martin, R.; Grenier-Boley, B.; Andrade, V.; et al. New Insights into the Genetic Etiology of Alzheimer’s Disease and Related Dementias. Nat. Genet. 2022, 54, 412–436. [Google Scholar] [CrossRef]
- Schneider, A.L.C.; Selvin, E.; Latour, L.; Turtzo, L.C.; Coresh, J.; Mosley, T.; Ling, G.; Gottesman, R.F. Head Injury and 25-year Risk of Dementia. Alzheimer’s Dement. 2021, 17, 1432–1441. [Google Scholar] [CrossRef] [PubMed]
- Abubakar, M.B.; Sanusi, K.O.; Ugusman, A.; Mohamed, W.; Kamal, H.; Ibrahim, N.H.; Khoo, C.S.; Kumar, J. Alzheimer’s Disease: An Update and Insights Into Pathophysiology. Front. Aging Neurosci. 2022, 14, 742408. [Google Scholar] [CrossRef]
- Gu, L.; Guo, Z. Alzheimer’s Aβ42 and Aβ40 Peptides Form Interlaced Amyloid Fibrils. J. Neurochem. 2013, 126, 305–311. [Google Scholar] [CrossRef]
- Kepp, K.P.; Robakis, N.K.; Høilund-Carlsen, P.F.; Sensi, S.L.; Vissel, B. The Amyloid Cascade Hypothesis: An Updated Critical Review. Brain 2023, 146, awad159. [Google Scholar] [CrossRef] [PubMed]
- Näslund, J.; Haroutunian, V.; Mohs, R.; Davis, K.L.; Davies, P.; Greengard, P.; Buxbaum, J.D. Correlation Between Elevated Levels of Amyloid β-Peptide in the Brain and Cognitive Decline. JAMA 2000, 283, 1571–1577. [Google Scholar] [CrossRef]
- Falcone, E.; Hureau, C. Redox Processes in Cu-Binding Proteins: The “in-between” States in Intrinsically Disordered Peptides. Chem. Soc. Rev. 2023, 52, 6595–6600. [Google Scholar] [CrossRef]
- Wärmländer, S.K.T.S.; Österlund, N.; Wallin, C.; Wu, J.; Luo, J.; Tiiman, A.; Jarvet, J.; Gräslund, A. Metal Binding to the Amyloid-β Peptides in the Presence of Biomembranes: Potential Mechanisms of Cell Toxicity. J. Biol. Inorg. Chem. 2019, 24, 1189–1196. [Google Scholar] [CrossRef]
- Esmieu, C.; Guettas, D.; Conte-Daban, A.; Sabater, L.; Faller, P.; Hureau, C. Copper-Targeting Approaches in Alzheimer’s Disease: How To Improve the Fallouts Obtained from in Vitro Studies. Inorg. Chem. 2019, 58, 13509–13527. [Google Scholar] [CrossRef]
- Cheignon, C.; Tomas, M.; Bonnefont-Rousselot, D.; Faller, P.; Hureau, C.; Collin, F. Oxidative Stress and the Amyloid Beta Peptide in Alzheimer’s Disease. Redox Biol. 2018, 14, 450–464. [Google Scholar] [CrossRef] [PubMed]
- Buccellato, F.R.; D’Anca, M.; Tartaglia, G.M.; Del Fabbro, M.; Scarpini, E.; Galimberti, D. Treatment of Alzheimer’s Disease: Beyond Symptomatic Therapies. Int. J. Mol. Sci. 2023, 24, 13900. [Google Scholar] [CrossRef] [PubMed]
- Hampel, H.; Mesulam, M.-M.; Cuello, A.C.; Farlow, M.R.; Giacobini, E.; Grossberg, G.T.; Khachaturian, A.S.; Vergallo, A.; Cavedo, E.; Snyder, P.J.; et al. The Cholinergic System in the Pathophysiology and Treatment of Alzheimer’s Disease. Brain 2018, 141, 1917–1933. [Google Scholar] [CrossRef]
- Zemek, F.; Drtinova, L.; Nepovimova, E.; Sepsova, V.; Korabecny, J.; Klimes, J.; Kuca, K. Outcomes of Alzheimer’s Disease Therapy with Acetylcholinesterase Inhibitors and Memantine. Expert. Opin. Drug Saf. 2014, 13, 759–774. [Google Scholar]
- Marucci, G.; Michela Buccioni, M.; Ben, D.D.; Lambertucci, C.; Volpini, R.; Amenta, F. Efficacy of Acetylcholinesterase Inhibitors in Alzheimer’s Disease. Neuropharmacology 2021, 190, 108352. [Google Scholar] [CrossRef]
- Guzior, N.; Wieckowska, A.; Panek, D.; Malawska, B. Recent Development of Multifunctional Agents as Potential Drug Candidates for the Treatment of Alzheimer’s Disease. Curr. Med. Chem. 2015, 22, 373–404. [Google Scholar] [CrossRef]
- Vrabec, R.; Blunden, G.; Cahlíková, L. Natural Alkaloids as Multi-Target Compounds towards Factors Implicated in Alzheimer’s Disease. Int. J. Mol. Sci. 2023, 24, 4399. [Google Scholar] [CrossRef] [PubMed]
- Kola, A.; Lamponi, S.; Currò, F.; Valensin, D. A Comparative Study between Lycorine and Galantamine Abilities to Interact with AMYLOID β and Reduce In Vitro Neurotoxicity. Int. J. Mol. Sci. 2023, 24, 2500. [Google Scholar] [CrossRef] [PubMed]
- Nair, J.J.; van Staden, J. Insight to the Antifungal Properties of Amaryllidaceae Constituents. Phytomedicine 2020, 73, 152753. [Google Scholar] [CrossRef]
- Roy, M.; Liang, L.; Xiao, X.; Feng, P.; Ye, M.; Liu, J. Lycorine: A Prospective Natural Lead for Anticancer Drug Discovery. Biomed. Pharmacother. 2018, 107, 615–624. [Google Scholar] [CrossRef] [PubMed]
- Xiao, H.; Xu, X.; Du, L.; Li, X.; Zhao, H.; Wang, Z.; Zhao, L.; Yang, Z.; Zhang, S.; Yang, Y.; et al. Lycorine and Organ Protection: Review of Its Potential Effects and Molecular Mechanisms. Phytomedicine 2022, 104, 154266. [Google Scholar] [CrossRef] [PubMed]
- Rana, M.; Sharma, A.K. Cu and Zn Interactions with Aβ Peptides: Consequence of Coordination on Aggregation and Formation of Neurotoxic Soluble Aβ Oligomers. Metallomics 2019, 11, 64–84. [Google Scholar] [CrossRef]
- De Gregorio, G.; Biasotto, F.; Hecel, A.; Luczkowski, M.; Kozlowski, H.; Valensin, D. Structural Analysis of Copper(I) Interaction with Amyloid β Peptide. J. Inorg. Biochem. 2019, 195, 31–38. [Google Scholar] [CrossRef] [PubMed]
- Fogolari, F.; Esposito, G.; Viglino, P.; Briggs, J.M.; McCammon, J.A. pKa Shift Effects on Backbone Amide Base-Catalyzed Hydrogen Exchange Rates in Peptides. J. Am. Chem. Soc. 1998, 120, 3735–3738. [Google Scholar] [CrossRef]
- Zirah, S.; Kozin, S.A.; Mazur, A.K.; Blond, A.; Cheminant, M.; Ségalas-Milazzo, I.; Debey, P.; Rebuffat, S. Structural Changes of Region 1-16 of the Alzheimer Disease Amyloid Beta-Peptide upon Zinc Binding and in Vitro Aging. J. Biol. Chem. 2006, 281, 2151–2161. [Google Scholar] [CrossRef]
- Park, S.; Na, C.; Han, J.; Lim, M.H. Methods for Analyzing the Coordination and Aggregation of Metal-Amyloid-β. Metallomics 2023, 15, mfac102. [Google Scholar] [CrossRef]
- Sóvágó, I.; Várnagy, K.; Kállay, C.; Grenács, Á. Interactions of Copper(II) and Zinc(II) Ions with the Peptide Fragments of Proteins Related to Neurodegenerative Disorders: Similarities and Differences. Curr. Med. Chem. 2023, 30, 4050–4071. [Google Scholar] [CrossRef]
- Singh, S.K.; Balendra, V.; Obaid, A.A.; Esposto, J.; Tikhonova, M.A.; Gautam, N.K.; Poeggeler, B. Copper-Mediated β-Amyloid Toxicity and Its Chelation Therapy in Alzheimer’s Disease. Metallomics 2022, 14, mfac018. [Google Scholar] [CrossRef]
- Atrián-Blasco, E.; Del Barrio, M.; Faller, P.; Hureau, C. Ascorbate Oxidation by Cu(Amyloid-β) Complexes: Determination of the Intrinsic Rate as a Function of Alterations in the Peptide Sequence Revealing Key Residues for Reactive Oxygen Species Production. Anal. Chem. 2018, 90, 5909–5915. [Google Scholar] [CrossRef]
- Shen, J.; Griffiths, P.T.; Campbell, S.J.; Utinger, B.; Kalberer, M.; Paulson, S.E. Ascorbate Oxidation by Iron, Copper and Reactive Oxygen Species: Review, Model Development, and Derivation of Key Rate Constants. Sci. Rep. 2021, 11, 7417. [Google Scholar] [CrossRef] [PubMed]
- Kola, A.; Vigni, G.; Baratto, M.C.; Valensin, D. A Combined NMR and UV-Vis Approach to Evaluate Radical Scavenging Activity of Rosmarinic Acid and Other Polyphenols. Molecules 2023, 28, 6629. [Google Scholar] [CrossRef]
- Syme, C.D.; Nadal, R.C.; Rigby, S.E.J.; Viles, J.H. Copper Binding to the Amyloid-Beta (Abeta) Peptide Associated with Alzheimer’s Disease: Folding, Coordination Geometry, pH Dependence, Stoichiometry, and Affinity of Abeta-(1-28): Insights from a Range of Complementary Spectroscopic Techniques. J. Biol. Chem. 2004, 279, 18169–18177. [Google Scholar] [CrossRef] [PubMed]
- Cicero, C.E.; Mostile, G.; Vasta, R.; Rapisarda, V.; Signorelli, S.S.; Ferrante, M.; Zappia, M.; Nicoletti, A. Metals and Neurodegenerative Diseases. A Systematic Review. Environ. Res. 2017, 159, 82–94. [Google Scholar] [CrossRef] [PubMed]
- Kola, A.; Nencioni, F.; Valensin, D. Bioinorganic Chemistry of Micronutrients Related to Alzheimer’s and Parkinson’s Diseases. Molecules 2023, 28, 5467. [Google Scholar] [CrossRef]
- Gaggelli, E.; Kozlowski, H.; Valensin, D.; Valensin, G. Copper Homeostasis and Neurodegenerative Disorders (Alzheimer’s, Prion, and Parkinson’s Diseases and Amyotrophic Lateral Sclerosis). Chem. Rev. 2006, 106, 1995–2044. [Google Scholar] [CrossRef]
- Liu, Y.; Nguyen, M.; Robert, A.; Meunier, B. Metal Ions in Alzheimer’s Disease: A Key Role or Not? Acc. Chem. Res. 2019, 52, 2026–2035. [Google Scholar] [CrossRef]
- Kozlowski, H.; Luczkowski, M.; Remelli, M.; Valensin, D. Copper, Zinc and Iron in Neurodegenerative Diseases (Alzheimer’s, Parkinson’s and Prion Diseases). Coord. Chem. Rev. 2012, 256, 2129–2141. [Google Scholar] [CrossRef]
- Wang, L.; Yin, Y.-L.; Liu, X.-Z.; Shen, P.; Zheng, Y.-G.; Lan, X.-R.; Lu, C.-B.; Wang, J.-Z. Current Understanding of Metal Ions in the Pathogenesis of Alzheimer’s Disease. Transl. Neurodegener. 2020, 9, 10. [Google Scholar] [CrossRef]
- Scolari Grotto, F.; Glaser, V. Are High Copper Levels Related to Alzheimer’s and Parkinson’s Diseases? A Systematic Review and Meta-Analysis of Articles Published between 2011 and 2022. Biometals 2023. [Google Scholar] [CrossRef] [PubMed]
- Wang, Z.-X.; Tan, L.; Wang, H.-F.; Ma, J.; Liu, J.; Tan, M.-S.; Sun, J.-H.; Zhu, X.-C.; Jiang, T.; Yu, J.-T. Serum Iron, Zinc, and Copper Levels in Patients with Alzheimer’s Disease: A Replication Study and Meta-Analyses. J. Alzheimers Dis. 2015, 47, 565–581. [Google Scholar] [CrossRef] [PubMed]
- Atrián-Blasco, E.; Gonzalez, P.; Santoro, A.; Alies, B.; Faller, P.; Hureau, C. Cu and Zn Coordination to Amyloid Peptides: From Fascinating Chemistry to Debated Pathological Relevance. Coord. Chem. Rev. 2018, 375, 38–55. [Google Scholar] [CrossRef]
- Leal, S.S.; Botelho, H.M.; Gomes, C.M. Metal Ions as Modulators of Protein Conformation and Misfolding in Neurodegeneration. Coord. Chem. Rev. 2012, 256, 2253–2270. [Google Scholar] [CrossRef]
- Cherny, R.A.; Atwood, C.S.; Xilinas, M.E.; Gray, D.N.; Jones, W.D.; McLean, C.A.; Barnham, K.J.; Volitakis, I.; Fraser, F.W.; Kim, Y.-S.; et al. Treatment with a Copper-Zinc Chelator Markedly and Rapidly Inhibits β-Amyloid Accumulation in Alzheimer’s Disease Transgenic Mice. Neuron 2001, 30, 665–676. [Google Scholar] [CrossRef] [PubMed]
- Mital, M.; Bal, W.; Frączyk, T.; Drew, S.C. Interplay between Copper, Neprilysin, and N-Truncation of β-Amyloid. Inorg. Chem. 2018, 57, 6193–6197. [Google Scholar] [CrossRef]
- Grasso, G.; Pietropaolo, A.; Spoto, G.; Pappalardo, G.; Tundo, G.R.; Ciaccio, C.; Coletta, M.; Rizzarelli, E. Copper(I) and Copper(II) Inhibit Aβ Peptides Proteolysis by Insulin-Degrading Enzyme Differently: Implications for Metallostasis Alteration in Alzheimer’s Disease. Chemistry 2011, 17, 2752–2762. [Google Scholar] [CrossRef] [PubMed]
- Cheignon, C.; Jones, M.; Atrián-Blasco, E.; Kieffer, I.; Faller, P.; Collin, F.; Hureau, C. Identification of Key Structural Features of the Elusive Cu-Aβ Complex That Generates ROS in Alzheimer’s Disease. Chem. Sci. 2017, 8, 5107–5118. [Google Scholar] [CrossRef]
- Shen, H.; Dou, Y.; Wang, X.; Wang, X.; Kong, F.; Wang, S. Guluronic Acid Can Inhibit Copper(II) and Amyloid-β Peptide Coordination and Reduce Copper-Related Reactive Oxygen Species Formation Associated with Alzheimer’s Disease. J. Inorg. Biochem. 2023, 245, 112252. [Google Scholar] [CrossRef]
- Birla, H.; Minocha, T.; Kumar, G.; Misra, A.; Singh, S.K. Role of Oxidative Stress and Metal Toxicity in the Progression of Alzheimer’s Disease. Curr. Neuropharmacol. 2020, 18, 552–562. [Google Scholar] [CrossRef]
- Falcone, E.; Nobili, G.; Okafor, M.; Proux, O.; Rossi, G.; Morante, S.; Faller, P.; Stellato, F. Chasing the Elusive “In-Between” State of the Copper-Amyloid β Complex by X-Ray Absorption through Partial Thermal Relaxation after Photoreduction. Angew. Chem. Int. Ed. Engl. 2023, 62, e202217791. [Google Scholar] [CrossRef] [PubMed]
- Jiang, S.; Zhao, Y.; Zhang, T.; Lan, J.; Yang, J.; Yuan, L.; Zhang, Q.; Pan, K.; Zhang, K. Galantamine Inhibits β-Amyloid-Induced Cytostatic Autophagy in PC12 Cells through Decreasing ROS Production. Cell Prolif. 2018, 51, e12427. [Google Scholar] [CrossRef] [PubMed]
- Hwang, T.-L.; Shaka, A.J. Multiple-Pulse Mixing Sequences That Selectively Enhance Chemical Exchange or Cross-Relaxation Peaks in High-Resolution NMR Spectra. J. Magn. Reson. 1998, 135, 280–287. [Google Scholar] [CrossRef]
- Savitzky, A.; Golay, M.J.E. Smoothing and Differentiation of Data by Simplified Least Squares Procedures. Anal. Chem. 1964, 36, 1627–1639. [Google Scholar] [CrossRef]
Figure 1.
Superimposition of selected regions of 1H-NMR spectra of Aβ16 0.5 mM (lower trace), LYC (upper trace), and Aβ16:LYC solutions (middle traces) at different ratios. Aβ16:LYC ratios are shown as the following: violet 1.0:0.2; green 1.0:0.4; red 1.0:0.6; cyan 1.0:0.8; magenta 1.0:1.0; and blue 1.0:1.2. T = 298 K, pH 7.5, 30 mM phosphate buffer.
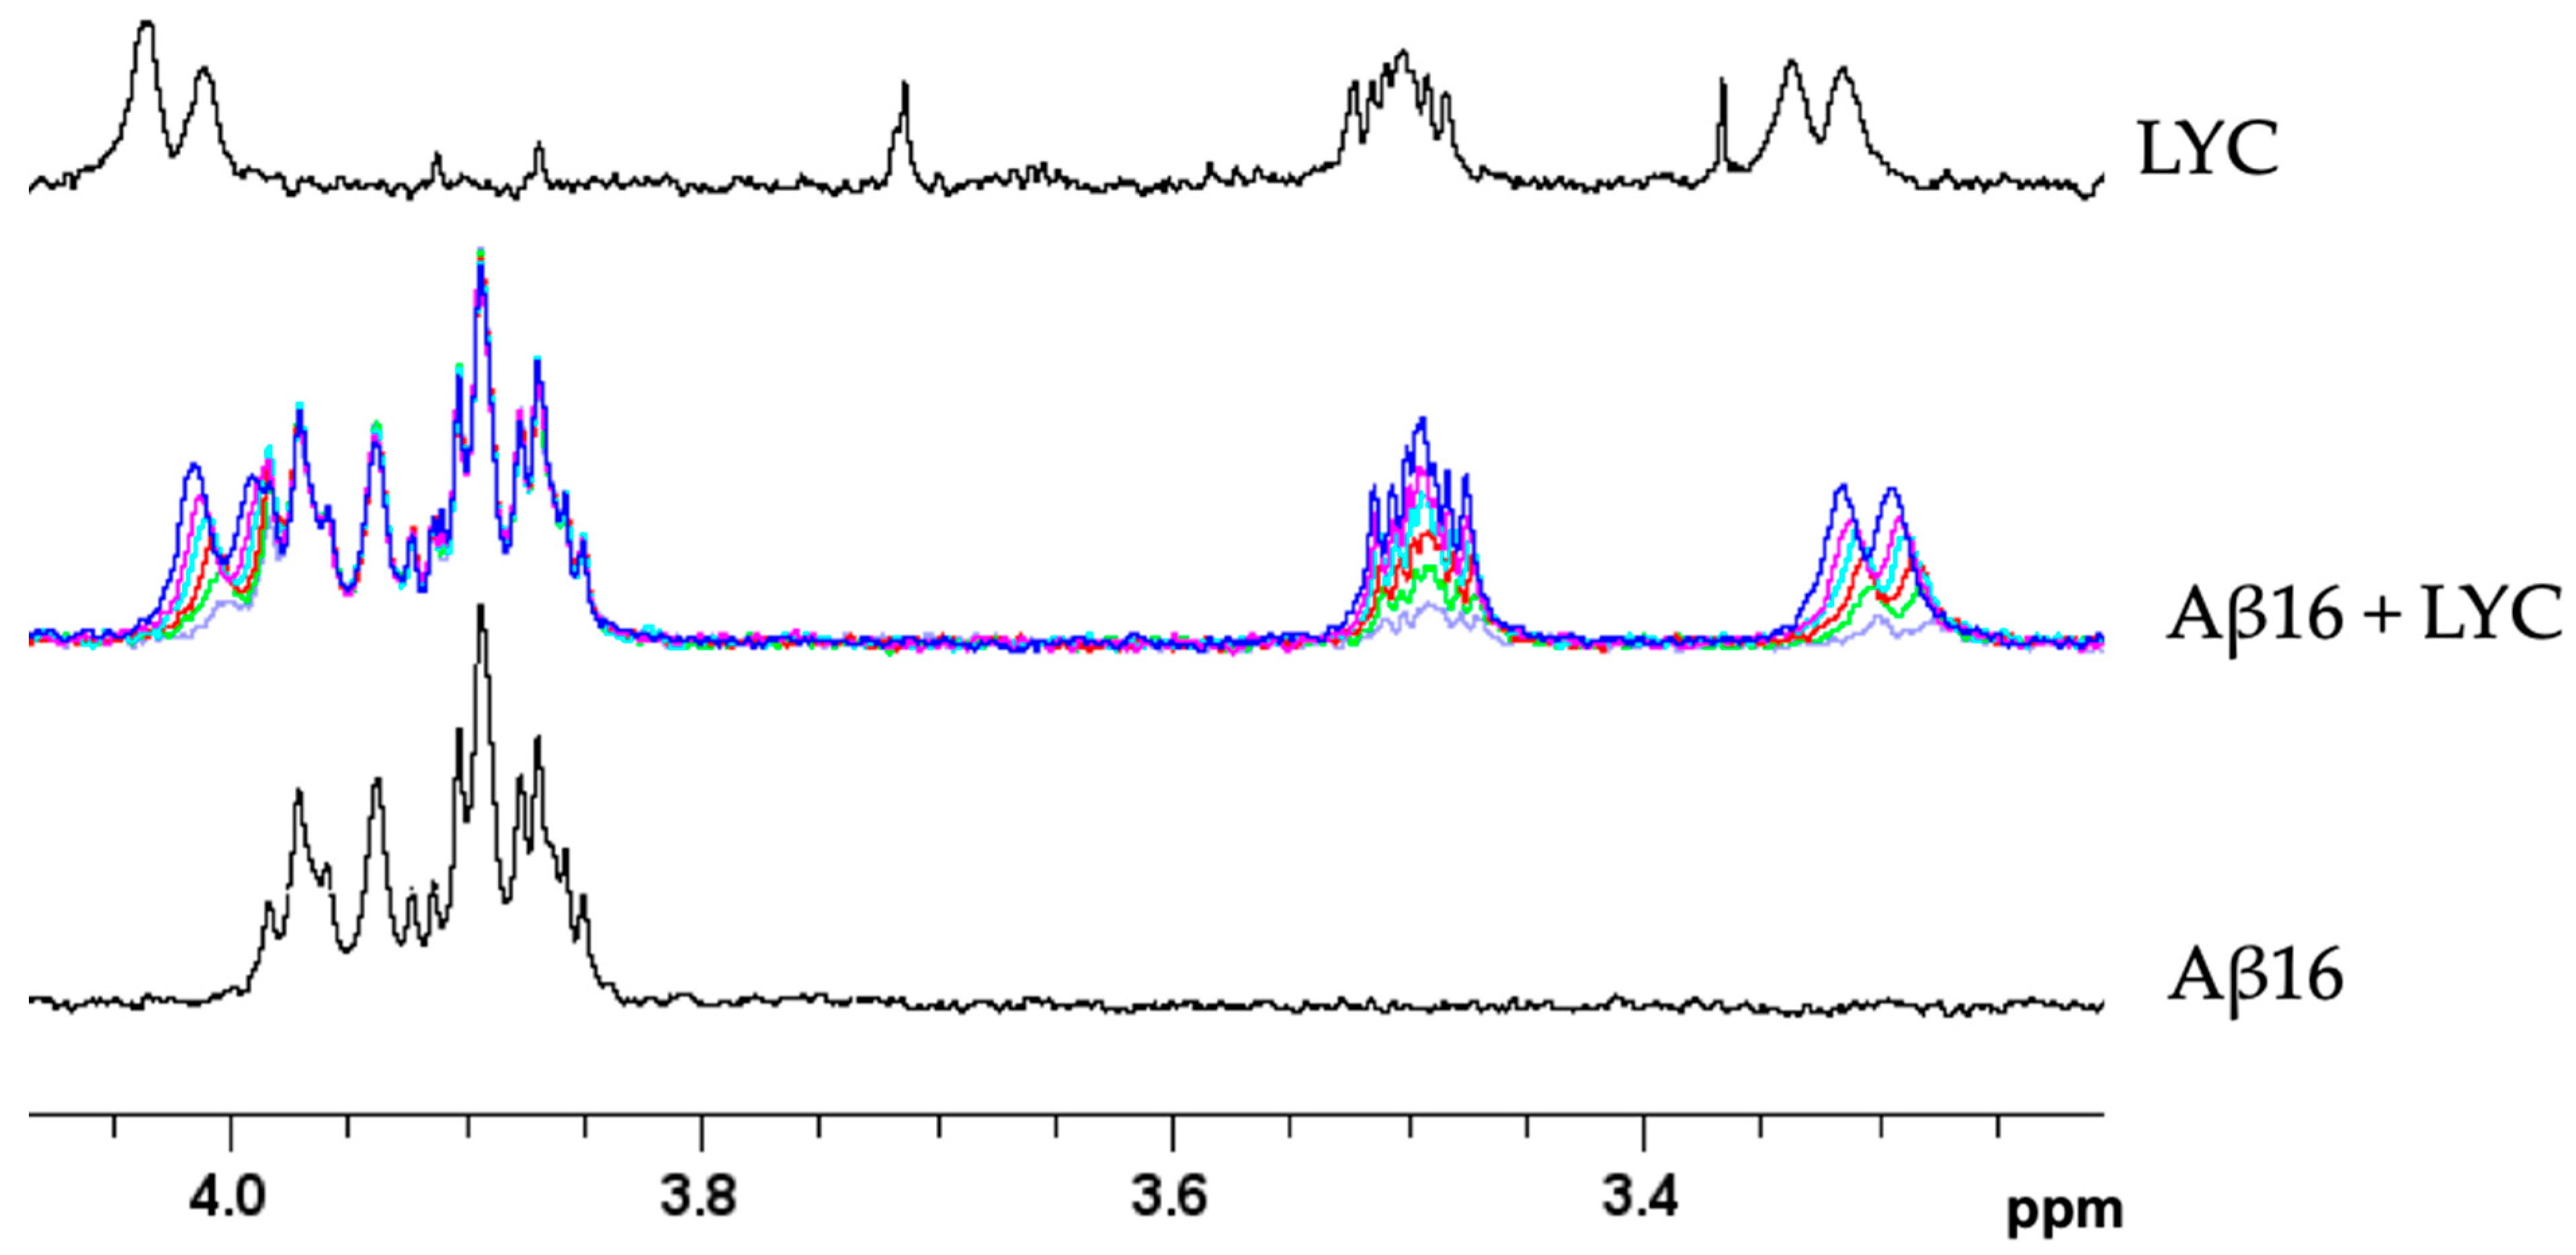
Figure 2.
Superimposition of selected regions of NMR spectra of Aβ16 alone and with LYC. (A) Aromatic region of 1H NMR spectra of Aβ16 0.5mM in absence (black) and in presence of 0.16 (mauve), 0.32 (lime), 0.48 (red), 0.64 (cyan), 0.80 (magenta) and 0.96 (blue) LYC eqs. (B,C) 1H-1H TOCSY NMR spectra of Aβ16 0.5 mM in absence (black traces) and in presence of 1.0 LYC eqs. (blue traces). T = 298 K, pH 7.5, 30 mM phosphate buffer.
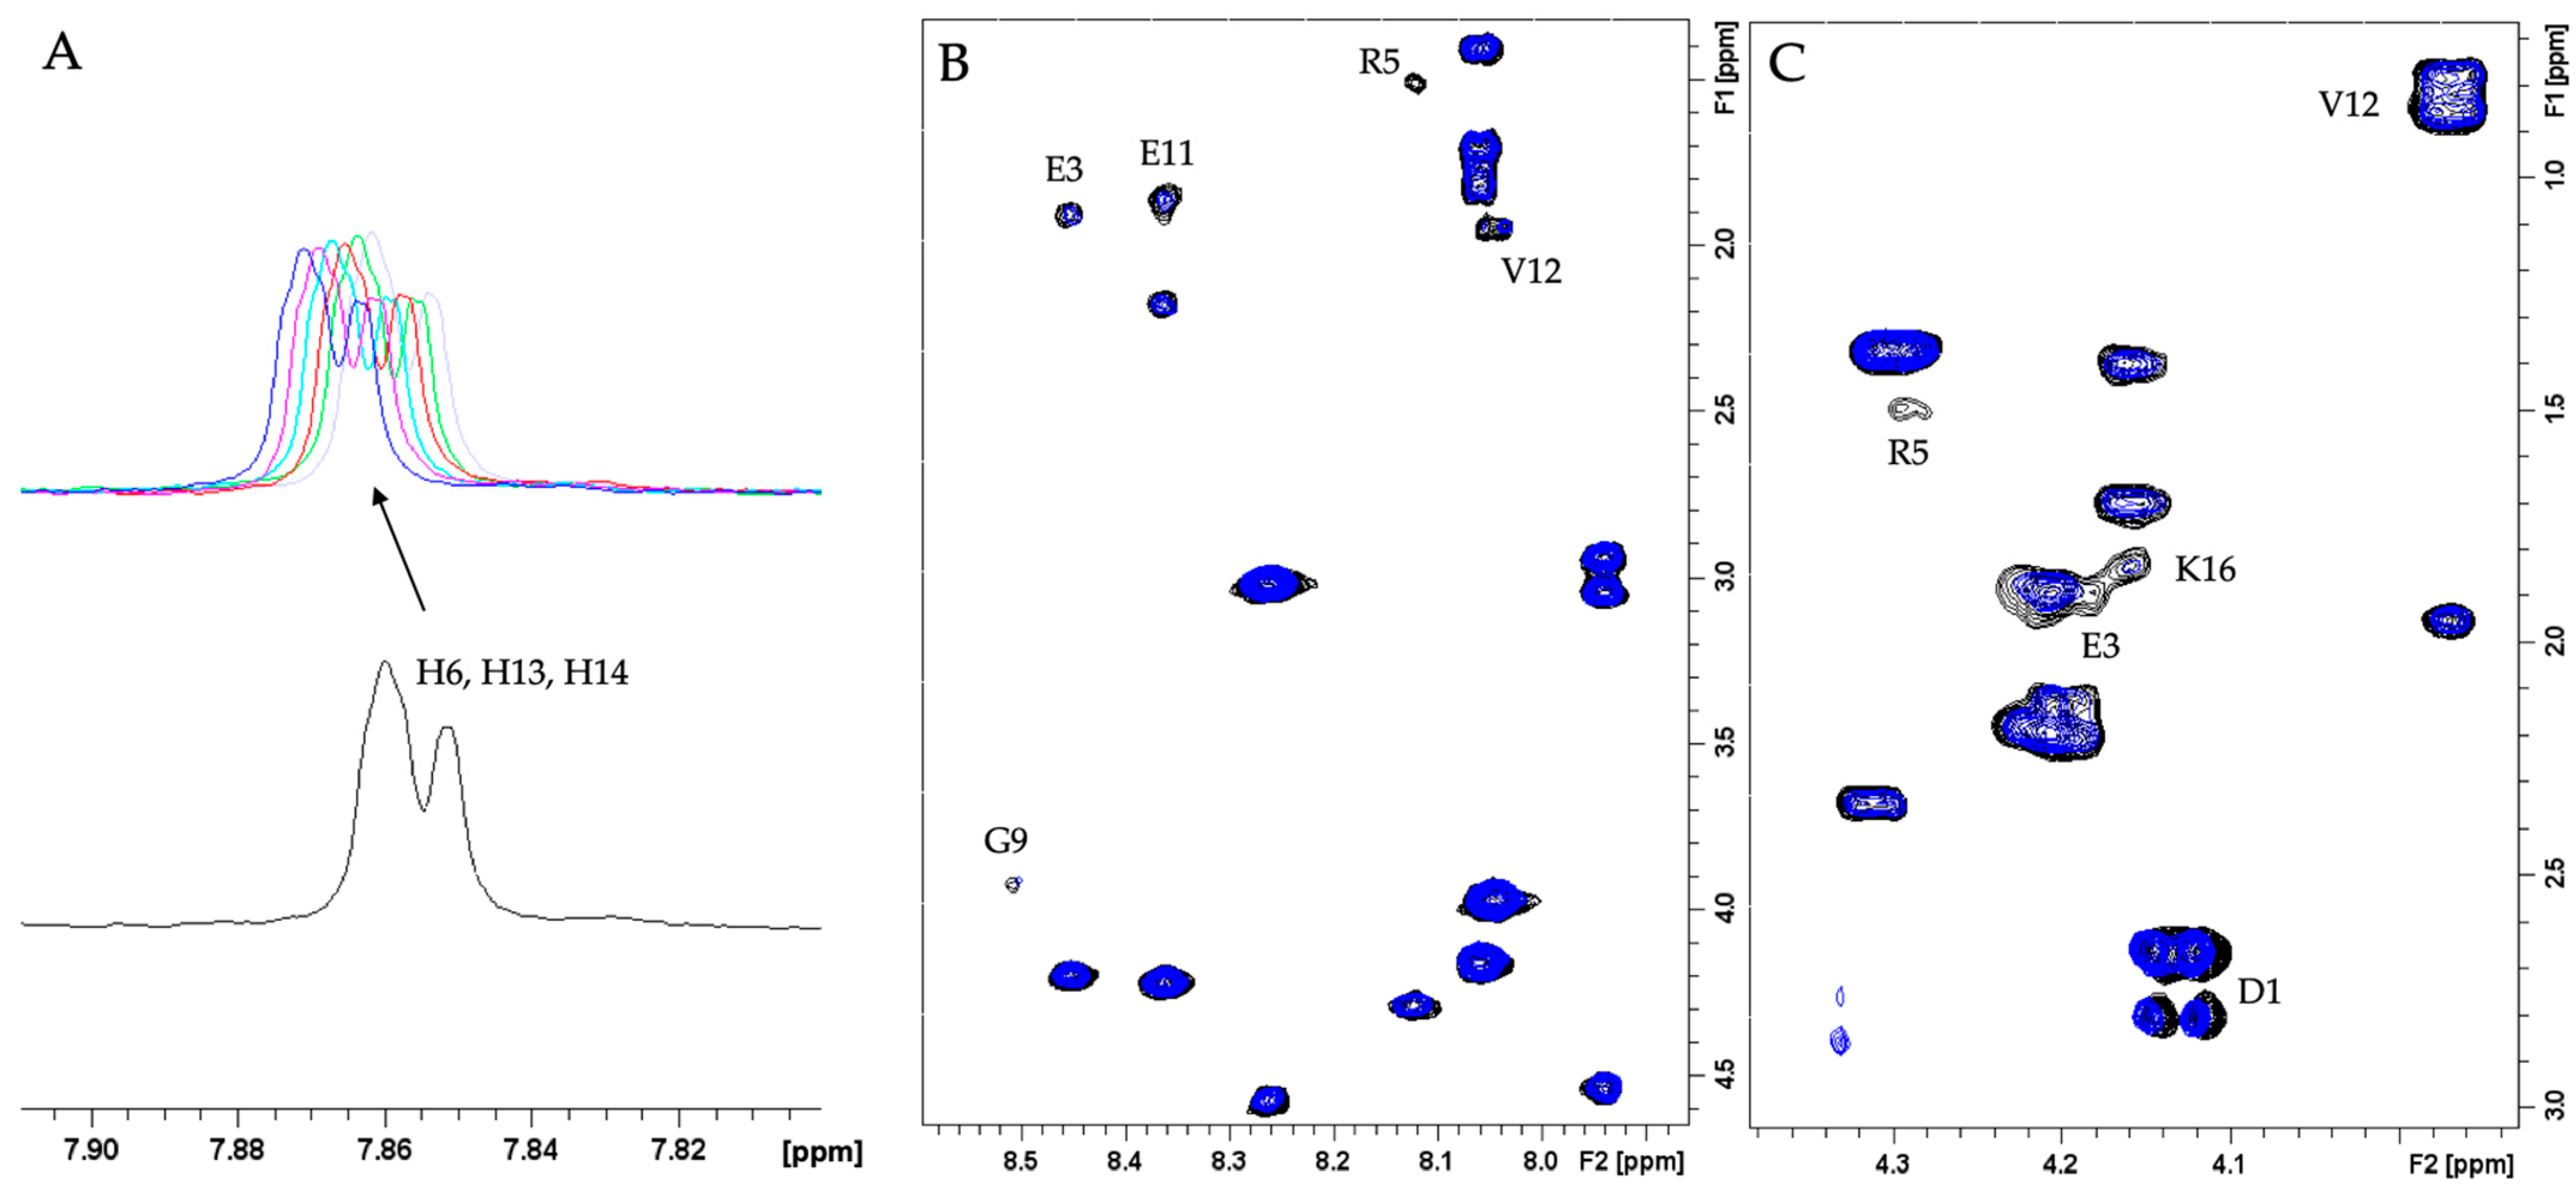
Figure 3.
Superimposition of selected regions of 1H-1H TOCSY spectra of Aβ16 0.5 mM in absence (black) and in presence of 0.1 Cu(II) eqs. (blue) T = 298 K, pH 7.5, 30 mM phosphate buffer.
Figure 3.
Superimposition of selected regions of 1H-1H TOCSY spectra of Aβ16 0.5 mM in absence (black) and in presence of 0.1 Cu(II) eqs. (blue) T = 298 K, pH 7.5, 30 mM phosphate buffer.
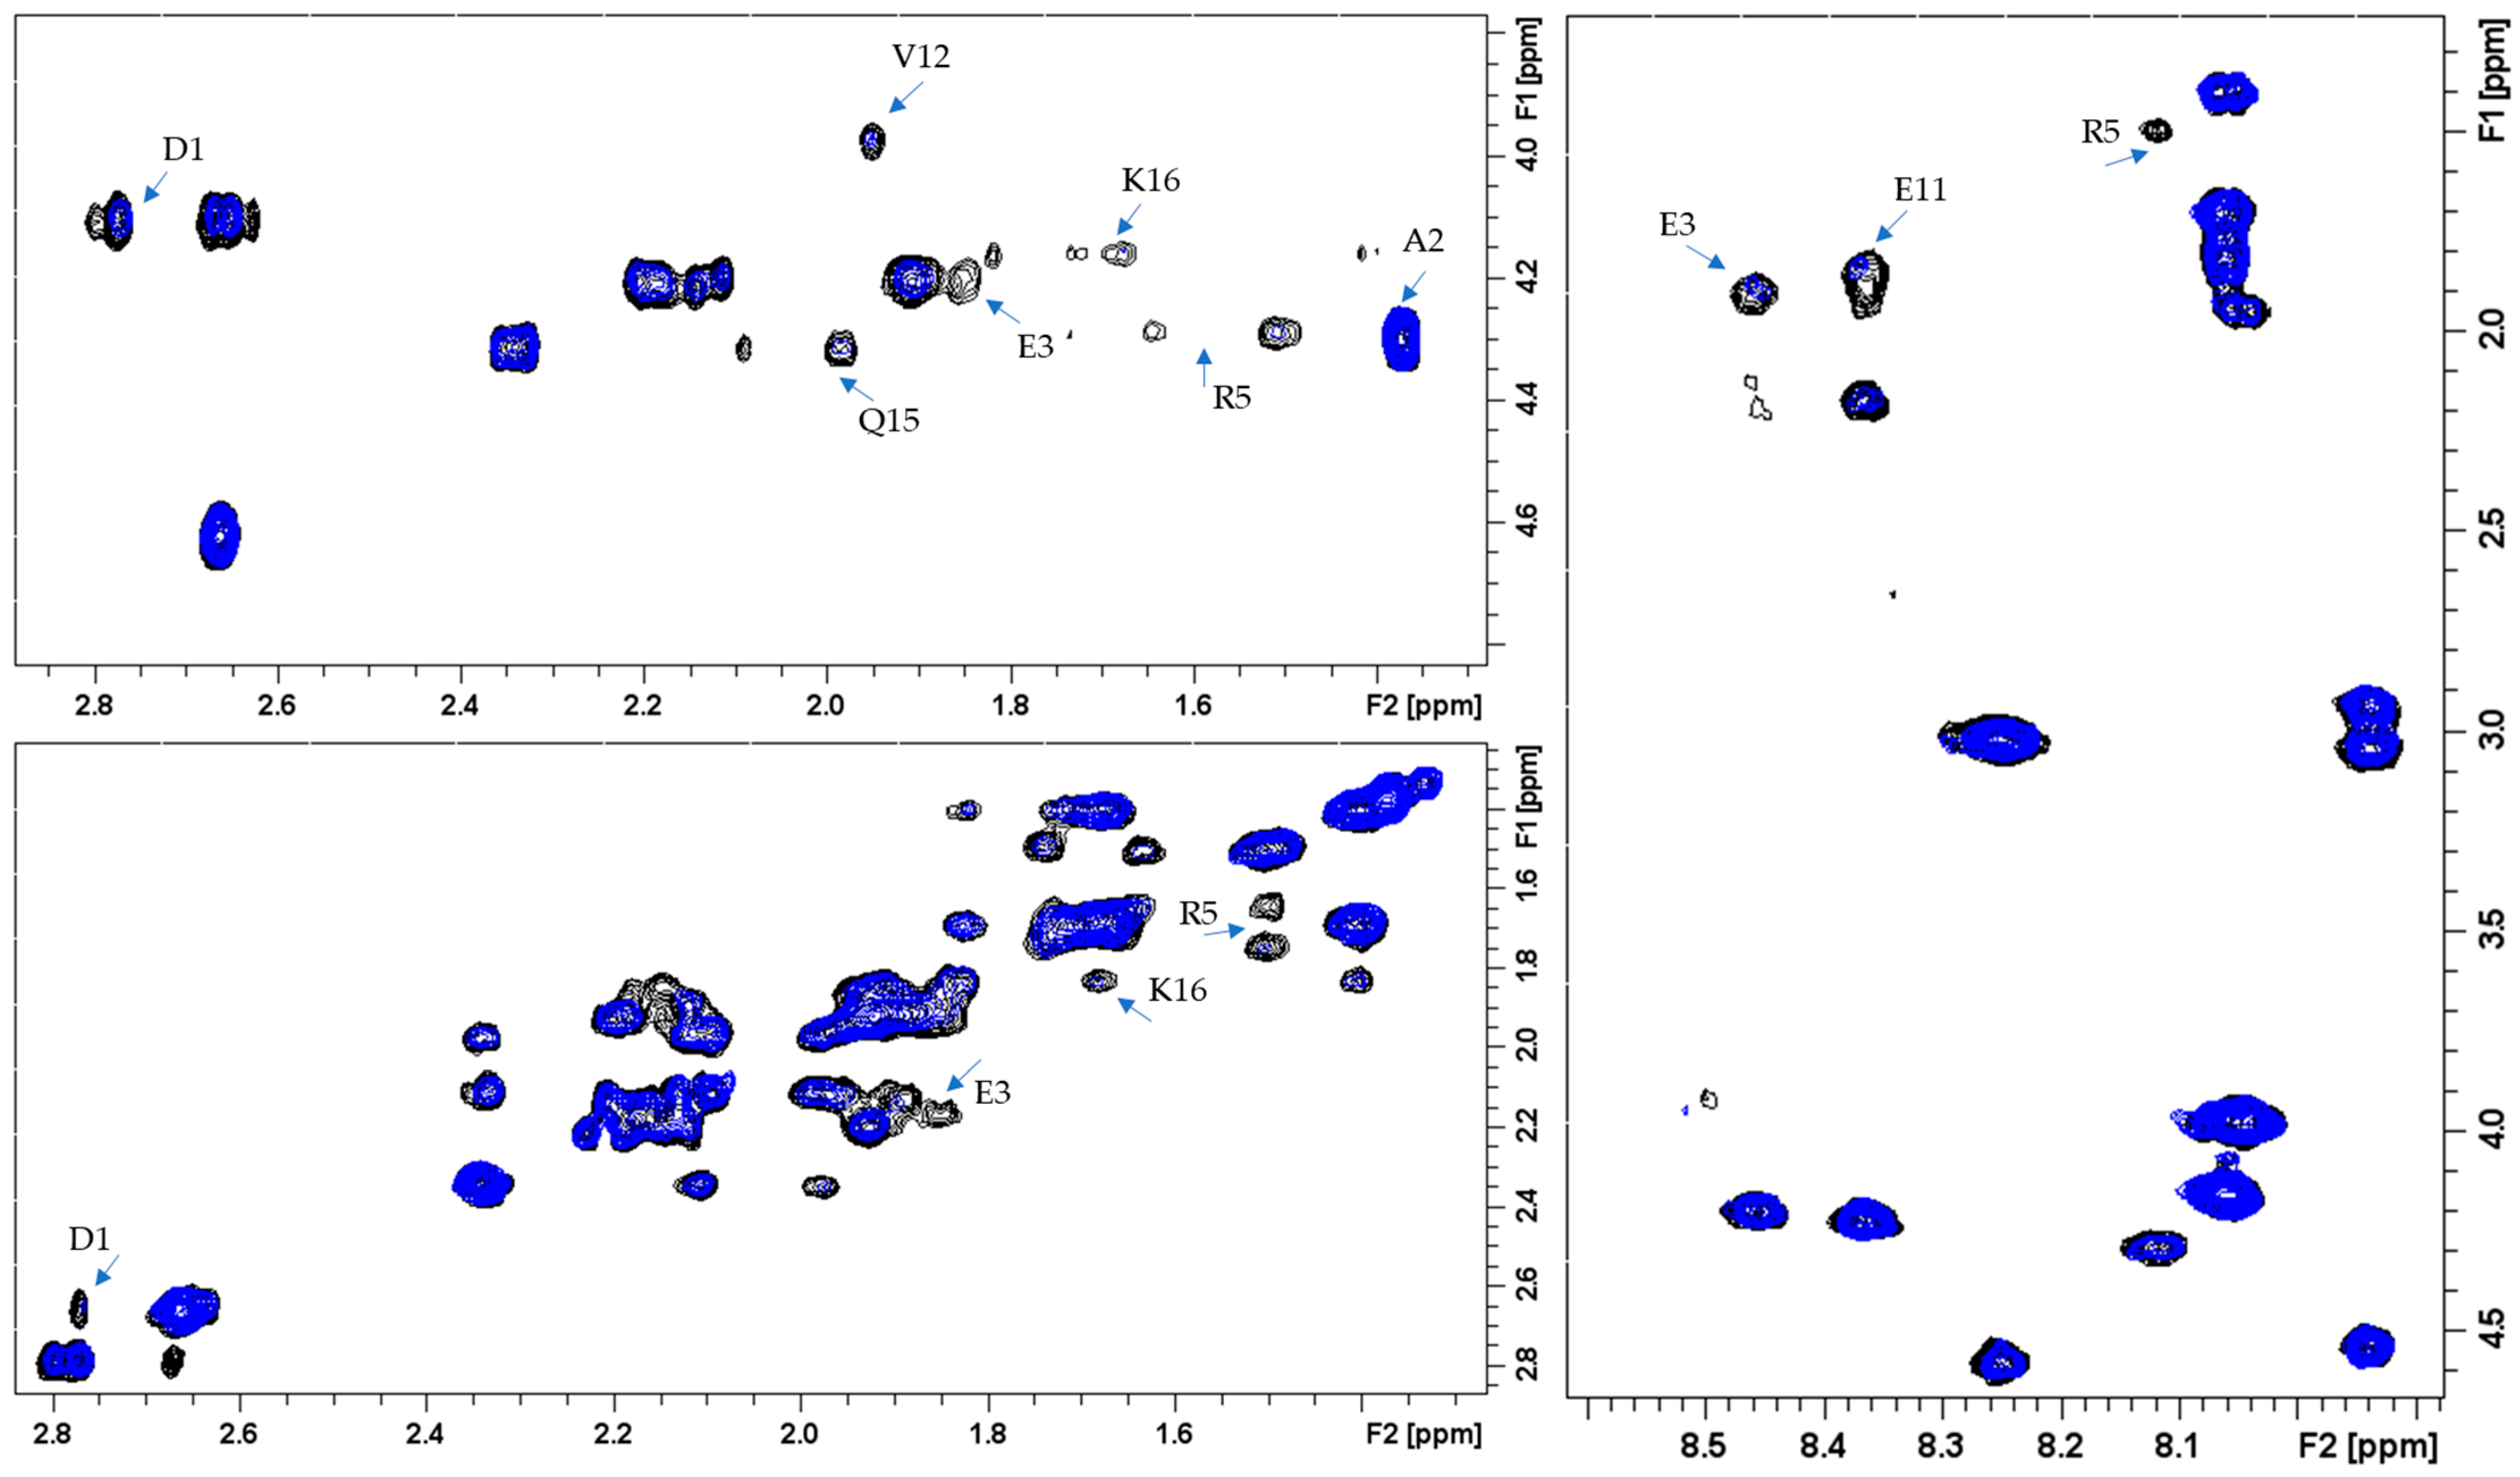
Figure 4.
Comparison of NMR spectra of Aβ16, Cu(II), and LYC systems at different concentrations (A) 1H-1H TOCSY spectra of Aβ16 0.5 mM alone (black contours), in presence of 0.1 Cu(II) eqs. (red contours), and in presence of 0.1 Cu(II) and 1.0 LYC eqs. (blue contours). (B) 1D and (C) 1H-1H TOCSY spectra of LYC 0.5 mM alone (blue), in presence of 1.0 Aβ16 eqs. (magenta), and in presence of 1.0 Aβ16 and 0.1 Cu(II) eqs. (black). T = 298 K, pH 7.5, 30 mM phosphate buffer.
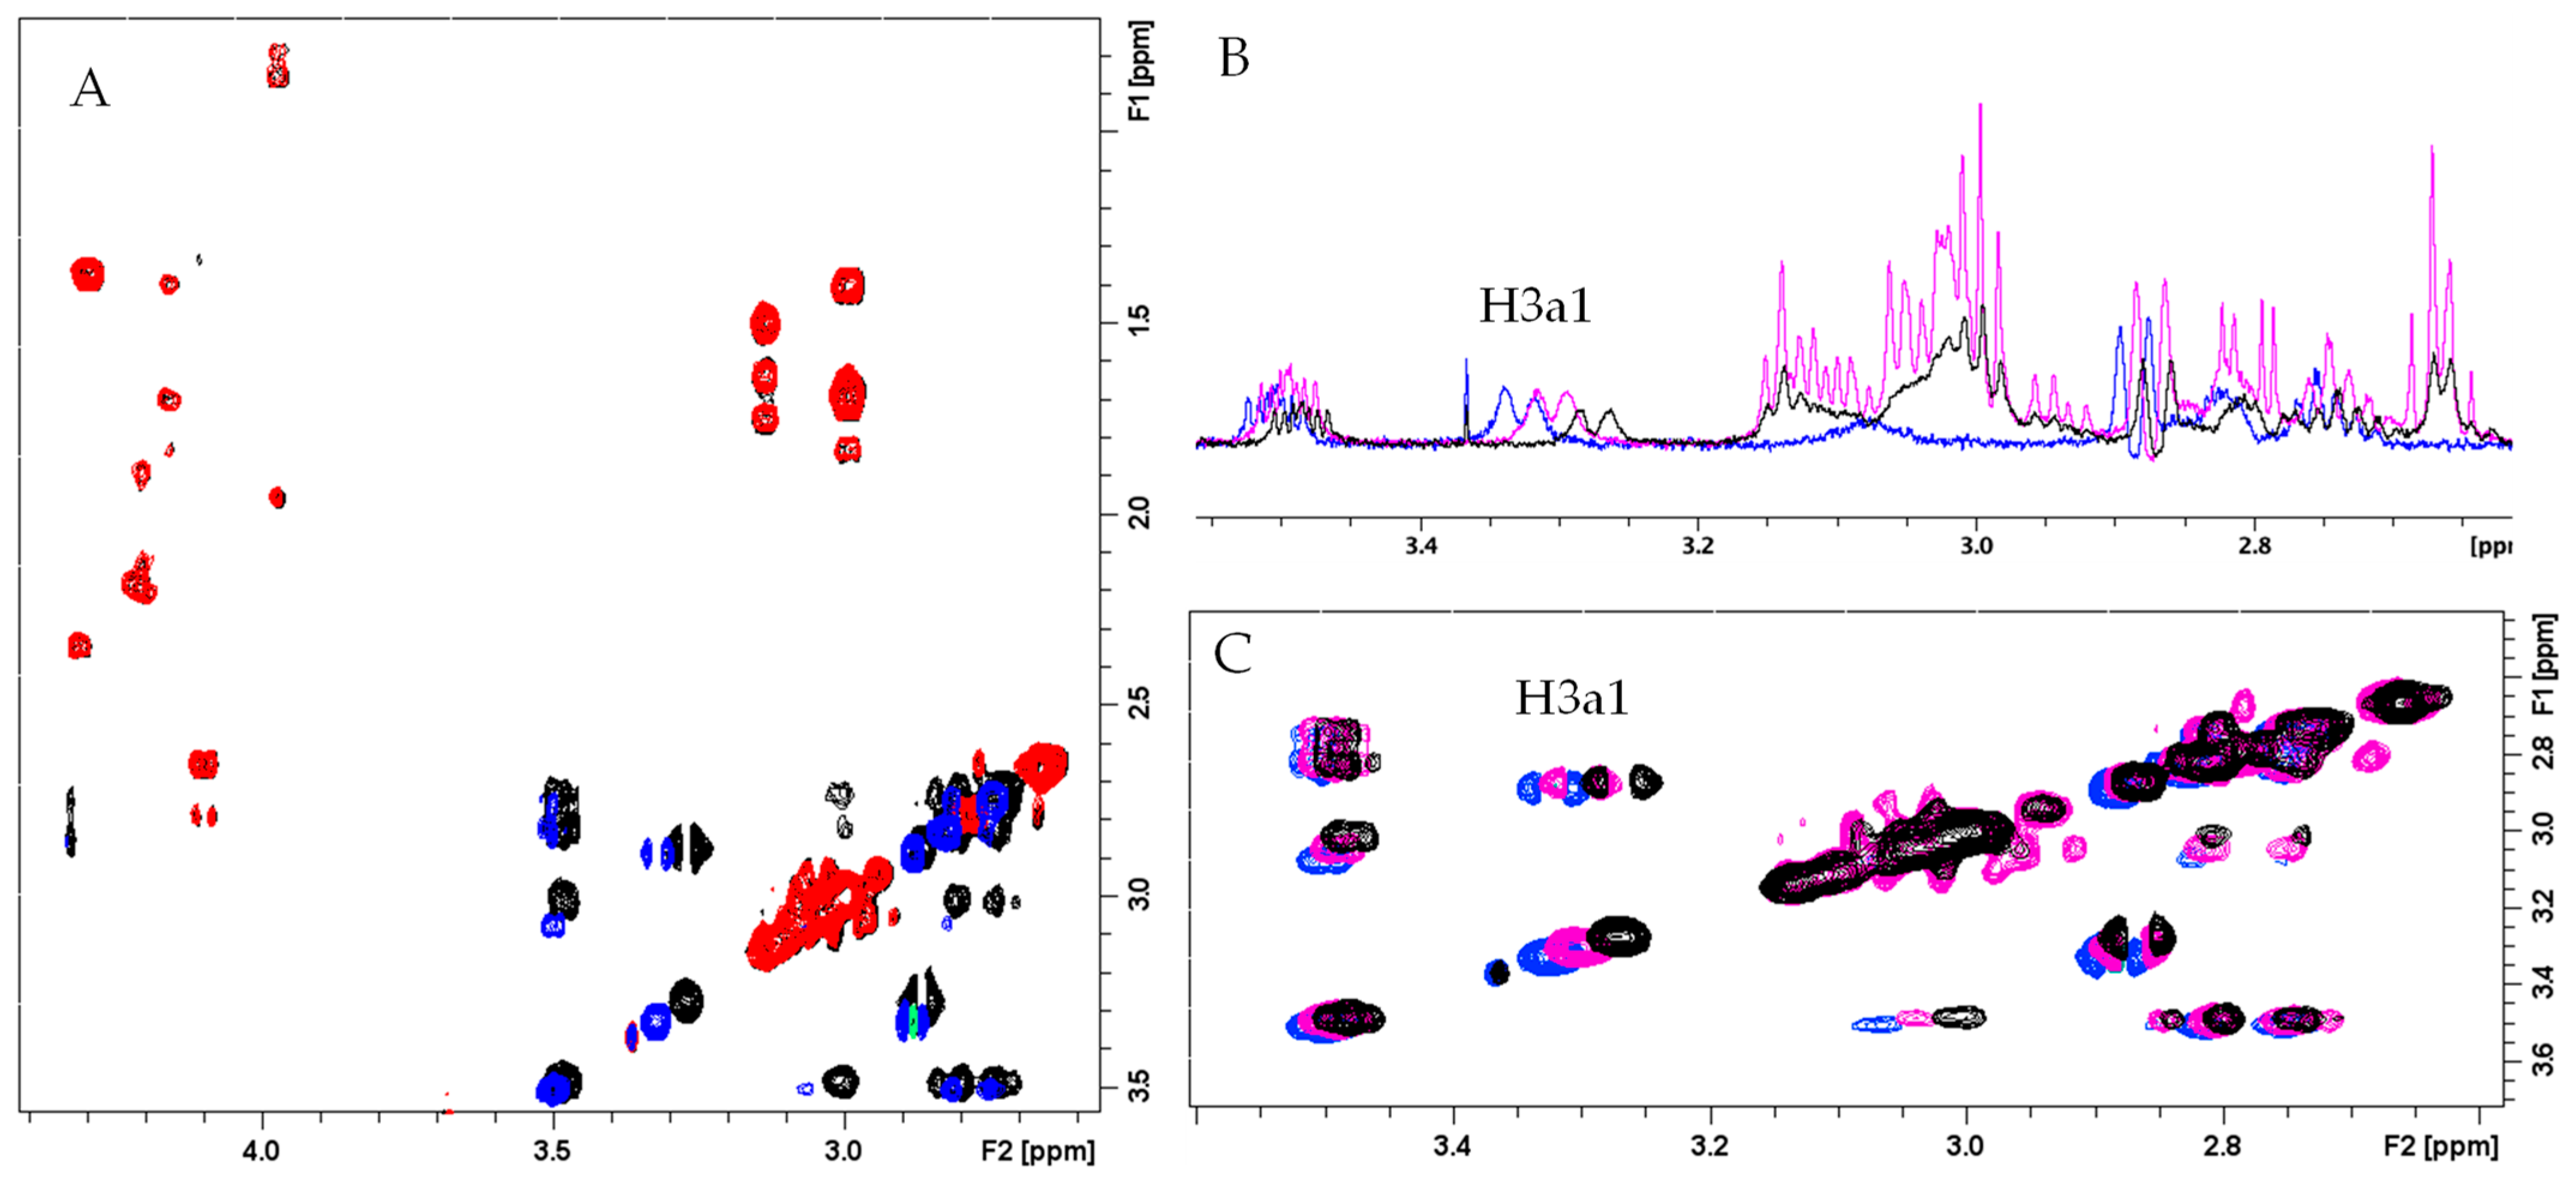
Figure 5.
Comparison of the significant chemical shift variations of LYC protons upon Aβ16 and Aβ16/Cu(II) additions. The most shifted protons are shown as colored circles; the larger the variations, the more intense the color.
Figure 5.
Comparison of the significant chemical shift variations of LYC protons upon Aβ16 and Aβ16/Cu(II) additions. The most shifted protons are shown as colored circles; the larger the variations, the more intense the color.
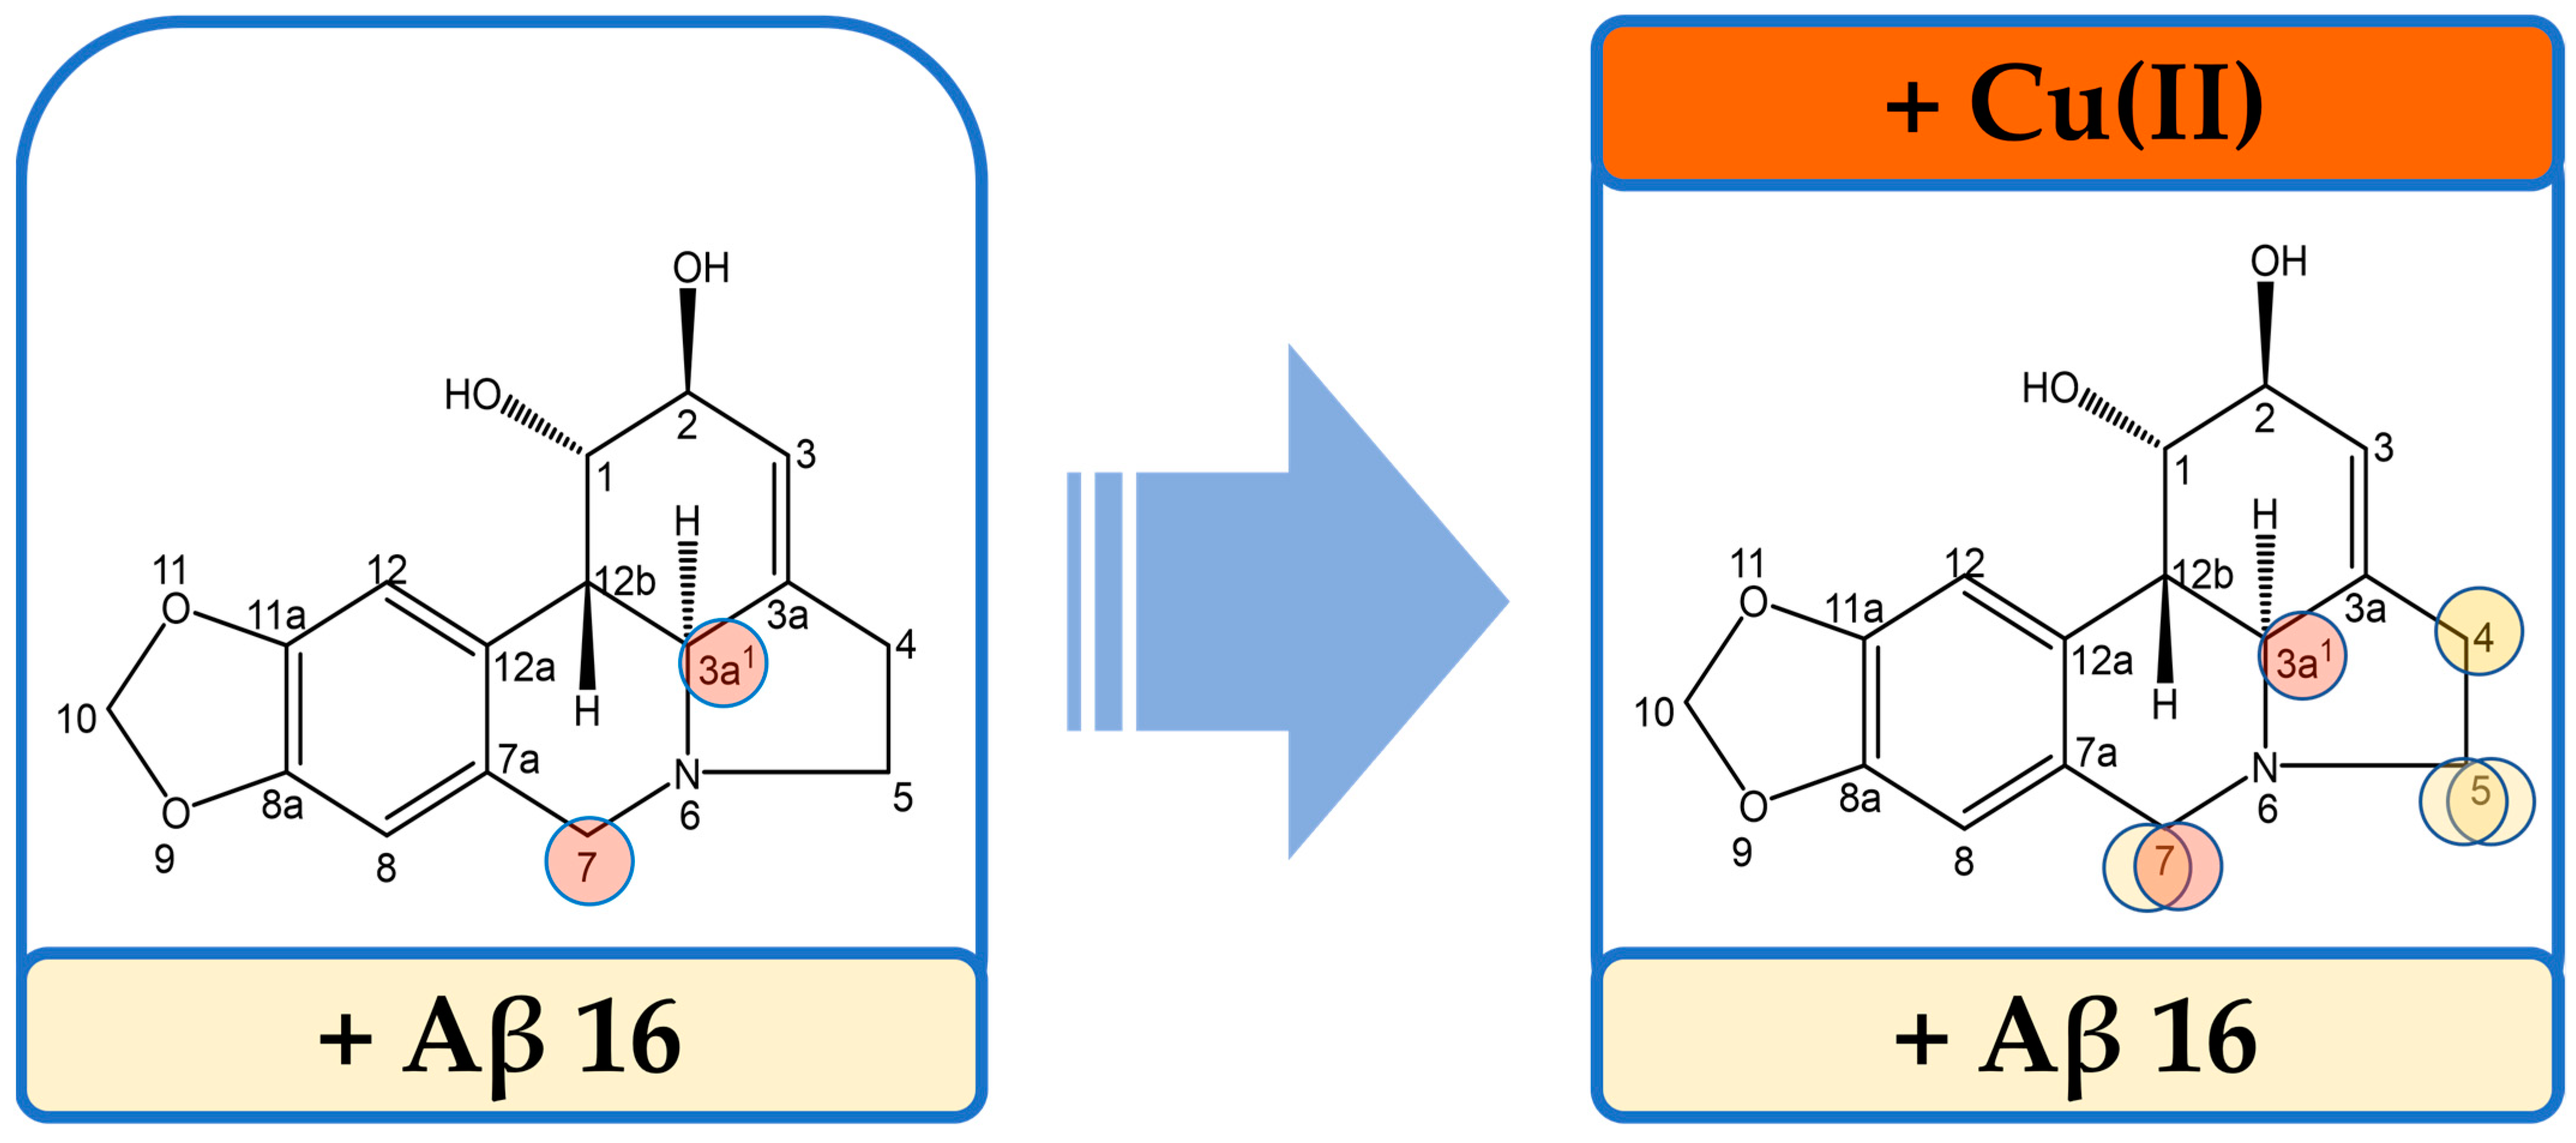
Figure 6.
UV–VIS kinetic curves of the systems composed of ascorbate 20 μM and Cu(II) 1 μM in the presence of Aβ16 and LYC (A) or LYC only (B). The curve corresponding to ascorbate in the presence of copper(II) is shown in green, while the other colors refer to samples in the simultaneous presence of LYC and Aβ16, together or alone: Aβ16 10 μM (black); Aβ16 10 μM + LYC 5 μM (red); Aβ16 10 μM + LYC 10 μM (blue); LYC 5 μM (light blue); LYC 10 μM (magenta). Room temperature, pH 7.5, 1 mM phosphate buffer.

Table 1.
Chemical shifts of LYC protons in absence and in presence of different Aβ concentrations. T = 298 K, pH 7.5, phosphate buffer 30 mM.
Table 1.
Chemical shifts of LYC protons in absence and in presence of different Aβ concentrations. T = 298 K, pH 7.5, phosphate buffer 30 mM.
| Atom Type | ppm Values | ||
|---|---|---|---|
| LYC Protons | LYC | LYC (0.4 eqs) + Aβ | LYC (1.0 eqs) + Aβ |
| H12 | 7.03 | 7.03 | 7.03 |
| H8 | 6.84 | 6.83 | 6.83 |
| H10 | 6.01 | 6.00 | 6.00 |
| H3 | 5.74 | 5.73 | 5.73 |
| H1 | 4.65 | 4.65 | 4.65 |
| H2 | 4.34 | 4.33 | 4.33 |
| H7″ | 4.25 | 4.24 | 4.24 |
| H7′ | 4.02 | 3.99 (−0.03 ppm) 1 | 4.00 |
| H5″ | 3.50 | 3.49 | 3.49 |
| H3a1 | 3.33 | 3.29 (−0.04 ppm) 1 | 3.30 |
| H12b | 2.88 | 2.87 | 2.87 |
| H4 | 2.82 | 2.81 | 2.81 |
| H5′ | 2.75 | 2.74 | 2.74 |
1 Chemical shift variations are calculated by subtracting the chemical shift ppm values of LYC in presence and in absence of Aβ16.
Disclaimer/Publisher’s Note: The statements, opinions and data contained in all publications are solely those of the individual author(s) and contributor(s) and not of MDPI and/or the editor(s). MDPI and/or the editor(s) disclaim responsibility for any injury to people or property resulting from any ideas, methods, instructions or products referred to in the content. |
© 2023 by the authors. Licensee MDPI, Basel, Switzerland. This article is an open access article distributed under the terms and conditions of the Creative Commons Attribution (CC BY) license (https://creativecommons.org/licenses/by/4.0/).
Share and Cite
MDPI and ACS Style
Kola, A.; Vigni, G.; Valensin, D. Exploration of Lycorine and Copper(II)’s Association with the N-Terminal Domain of Amyloid β. Inorganics 2023, 11, 443. https://doi.org/10.3390/inorganics11110443
AMA Style
Kola A, Vigni G, Valensin D. Exploration of Lycorine and Copper(II)’s Association with the N-Terminal Domain of Amyloid β. Inorganics. 2023; 11(11):443. https://doi.org/10.3390/inorganics11110443
Chicago/Turabian StyleKola, Arian, Ginevra Vigni, and Daniela Valensin. 2023. "Exploration of Lycorine and Copper(II)’s Association with the N-Terminal Domain of Amyloid β" Inorganics 11, no. 11: 443. https://doi.org/10.3390/inorganics11110443
Note that from the first issue of 2016, this journal uses article numbers instead of page numbers. See further details here.