Article

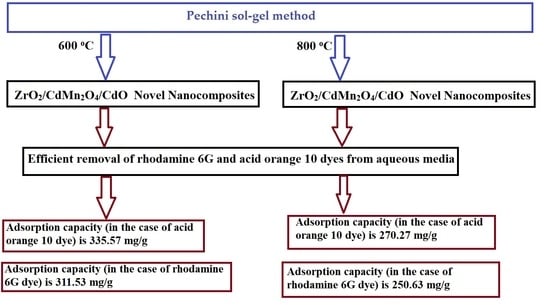
Efficient Disposal of Rhodamine 6G and Acid Orange 10 Dyes from Aqueous Media Using ZrO2/CdMn2O4/CdO as Novel and Facilely Synthesized Nanocomposites

by
Ehab A. Abdelrahman
1,2,*,
Faisal K. Algethami
1,
Huda S. AlSalem
3,
Mona S. Binkadem
4,
Mohamed Khairy
1,2,
Fawaz A. Saad
5,
Gharieb S. El-Sayyad
6,7 and
Zahrah Alqahtani
8
1
Department of Chemistry, College of Science, Imam Mohammad Ibn Saud Islamic University (IMSIU), Riyadh 11623, Saudi Arabia
2
Chemistry Department, Faculty of Science, Benha University, Benha 13518, Egypt
3
Department of Chemistry, College of Science, Princess Nourah bint Abdulrahman University, P.O. Box 84428, Riyadh 11671, Saudi Arabia
4
Department of Chemistry, College of Science, University of Jeddah, P.O. Box 80327, Jeddah 21589, Saudi Arabia
5
Department of Chemistry, Faculty of Applied Sciences, Umm Al-Qura University, Makkah 21955, Saudi Arabia
6
Microbiology and Immunology Department, Faculty of Pharmacy, Ahram Canadian University (ACU), Giza 12451, Egypt
7
Microbiology and Immunology Department, Faculty of Pharmacy, Galala University, Galala City, Suez 11566, Egypt
8
Department of Physics, Faculty of Science, Taif University, P.O. Box 11099, Taif 21944, Saudi Arabia
*
Author to whom correspondence should be addressed.
Inorganics 2023, 11(8), 333; https://doi.org/10.3390/inorganics11080333
Submission received: 15 July 2023 / Revised: 9 August 2023 / Accepted: 10 August 2023 / Published: 12 August 2023

Abstract

:
It is essential to remove rhodamine 6G and acid orange 10 dyes from contaminated water because they can induce cancer and irritate the lungs, skin, mucous, membranes, and eyes. Hence, in the current work, the Pechini sol–gel method was used for the facile synthesis of ZrO2/CdMn2O4/CdO as novel nanocomposites at 600 and 800 °C. The synthesized nanocomposites were used as novel adsorbents for the efficient removal of rhodamine 6G and acid orange 10 dyes from aqueous media. The nanocomposites, which were synthesized at 600 and 800 °C, were abbreviated as EK600 and EK800, respectively. The synthesized nanocomposites were characterized by EDS, XRD, N2 adsorption/desorption analyzer, and FE-SEM. The patterns of XRD showed that the average crystal size of the EK600 and EK800 nanocomposites is 68.25 and 85.32 nm, respectively. Additionally, the images of FE-SEM showed that the surface of the EK600 nanocomposite consists of spherical, polyhedral, and rod shapes with an average grain size of 99.36 nm. Additionally, the surface of the EK800 nanocomposite consists of polyhedral and spherical shapes with an average grain size of 143.23 nm. In addition, the BET surface area of the EK600 and EK800 nanocomposites is 46.33 and 38.49 m2/g, respectively. The optimal conditions to achieve the highest removal of rhodamine 6G and acid orange 10 dyes are pH = 8, contact time = 24 min, and temperature = 298 kelvin. The greatest removal capacity of the EK600 and EK800 adsorbents towards rhodamine 6G dye is 311.53 and 250.63 mg/g, respectively. Additionally, the greatest removal capacity of the EK600 and EK800 adsorbents towards acid orange 10 dye is 335.57 and 270.27 mg/g, respectively. The removal of rhodamine 6G and acid orange 10 dyes using the EK600 and EK800 adsorbents is spontaneous, exothermic, follows the Langmuir adsorption isotherm, and fits well with the pseudo-first-order kinetic model.

Graphical Abstract

1. Introduction

The pollution of the aquatic environment is currently one of the most significant and critical issues around the globe [1,2,3,4,5]. The discharge of hazardous compounds, such as synthetic dyes and heavy metal ions, from industrial effluents is the primary cause of water contamination [6,7,8,9]. Dyes are complex organic substances that were once manufactured from coal ash but are now manufactured from petroleum. What distinguishes a dye from a pigment is that pigments are typically insoluble. Today, diverse synthetic dyes are manufactured to satisfy the needs of various industries, such as adhesives, paper and pulp, plastics, construction glass, ceramics, wax biomedicine, paints, beverages, art supplies, cosmetics, pharmaceuticals, leather, soap, polymers, and food [10,11,12]. Despite the availability of natural colorants, many manufacturers opt for synthetic dyes that pose harmful health risks. One of the issues with the majority of natural dyes is the need for mordant. Natural dyes are more expensive and scarce, and their production is more time-consuming and complicated. With natural dyes, the color palette is more restricted. According to scientists, organic dyes are carcinogenic and toxic and contribute to anxiety migraines, hyperactivity, and behavioral disorders [13,14,15]. It is undesirable to discharge synthetic dyes into aquatic environments due to the adverse effects they may have on aquatic organisms [16,17,18,19,20]. The acid orange 10 dye (orange G dye) is one of the most widely used anionic dyes in the printing and textile industries. It can induce cancer and irritate the lungs, skin, mucous, membranes, and eyes [21]. The rhodamine 6G dye is one of the most widely used cationic dyes in the food and textile industries. In addition, consuming water contaminated with rhodamine has been shown to cause subcutaneous sarcoma, which is highly neurotoxic and carcinogenic [22]. There have been several studies on dye removal techniques, such as chemical coagulation, reverse osmosis, nanofiltration, electrochemical treatment, catalysis, and adsorption [23,24,25,26,27,28,29,30,31,32,33,34]. However, adsorption is one of the most frequently used methods. Adsorption is a technique for collecting soluble components of an aqueous solution on a suitable surface without producing deleterious byproducts [35,36,37]. Adsorption can be employed for a wide range of substances, including liquids, gases, and dissolved ions. This versatility makes it applicable in various fields, such as environmental remediation, gas separation, water purification, and chemical processing. Many adsorbents, such as zeolites and activated carbon, have high surface areas with numerous pores and active sites [38,39,40,41,42]. This provides a large contact area for adsorbate molecules, allowing for efficient adsorption. The materials used as adsorbents are often inexpensive and readily available, making adsorption a cost-effective method for purification and separation processes. In many cases, adsorbents can be regenerated and reused multiple times, which can lead to cost savings and reduced waste generation compared to other separation methods. Compared to some other separation methods like distillation, adsorption processes can be energy-efficient, especially at lower temperatures and pressures. There are many adsorbents that have been used to remove dyes, such as zinc ferrite, chitosan/pyrazole/zinc oxide, cobalt oxide, carboxymethylcellulose magnetic, zeolites, and benzenesulfonyl hydrazone modified guar gum [43,44,45,46,47,48]. Gollakota et al. synthesized aluminophosphate for the removal of rhodamine 6G dye, and its maximum adsorption capacity equaled 208.11 mg/g [49]. Vanamudan et al. synthesized chitosan-g-(N-vinylpyrrolidone)/montmorillonite composite for the removal of rhodamine 6G dye, and its maximum adsorption capacity equaled 36.60 mg/g [50]. Annadurai et al. synthesized activated carbon for the removal of rhodamine 6G dye, and its maximum adsorption capacity equaled 44.70 mg/g [51]. Gollakota et al. synthesized ZSM-22 zeolite from Taiwanese coal fly ash for the removal of rhodamine 6G dye, and its maximum adsorption capacity equaled 195.30 mg/g [52]. Zheng et al. synthesized quaternary ammonium group-rich magnetic nanoparticles for the removal of acid orange 10 dye, and their maximum adsorption capacity equaled 98.70 mg/g [53]. Arulkumar et al. synthesized activated carbon for the removal of acid orange 10 dye, and its maximum adsorption capacity equaled 17.60 mg/g [54]. Banerjee et al. synthesized alumina nanoparticles for the removal of acid orange 10 dye, and their maximum adsorption capacity equaled 93.30 mg/g [55]. Imgharn et al. synthesized polyaniline/Fe-ZSM-5 composite for the removal of acid orange 10 dye, and its maximum adsorption capacity equaled 217 mg/g [56]. Due to the small crystalline size of nanomaterials and their high surface area, they are widely used in the removal of several dyes. The pechini sol gel method was widely used to synthesize a lot of nanostructures such as Al2O3, PbCrO4, Y2O3/MgO, and Bi2Ti2O7 [57,58,59,60]. High prices of chemicals can limit the scalability and affordability of these adsorbents, particularly in developing countries or resource-constrained settings. As a result, researchers and scientists are actively exploring alternatives and low-cost materials that can serve as effective adsorbents while reducing overall operational expenses. In the current paper, ZrO2/CdMn2O4/CdO was facilely synthesized for the first time as a novel nanocomposite for the efficient removal of rhodamine 6G and acid orange 10 dyes from aqueous solutions. Three key characteristics of synthesized nanocomposites are stability, small crystal size, and high surface area, which play significant roles in enhancing their adsorption capabilities. Also, the preparation of ZrO2/CdMn2O4/CdO nanocomposite offers several advantages, making it a promising choice for water treatment. The combination of these three components results in a synergistic effect that enhances the overall performance of the nanocomposite. The incorporation of ZrO2, CdO, and CdMn2O4 in the nanocomposite provides a larger number of active adsorption sites. This combination leads to an increased adsorption capacity, allowing for more efficient removal of rhodamine 6G and acid orange 10 dyes from aqueous media. The synergistic effect between these components enhances the overall adsorption performance of the nanocomposite. The synthesized nanocomposite was characterized by EDS, XRD, N2 adsorption/desorption analyzer, and FE-SEM. The effects of dye solution pH, adsorbent/adsorbate contact time, temperature, and dye concentration on the removal of rhodamine 6G and acid orange 10 dyes were also studied.

2. Experimental Section

2.1. Chemicals

The utilized chemicals were cadmium(II) nitrate tetrahydrate (Cd(NO3)2·4H2O), manganese(II) acetate tetrahydrate (Mn(CH3COO)2·4H2O), sodium hydroxide (NaOH), zirconyl chloride octahydrate (ZrOCl2·8H2O), citric acid (C6H8O7), ethylene glycol (C2H6O2), hydrochloric acid (HCl), rhodamine 6G dye (C28H31N2O3Cl), and acid orange 10 dye (C16H10N2Na2O7S2). All the aforementioned chemicals were of high purity, purchased from the Sigma-Aldrich company, and used without any purification.

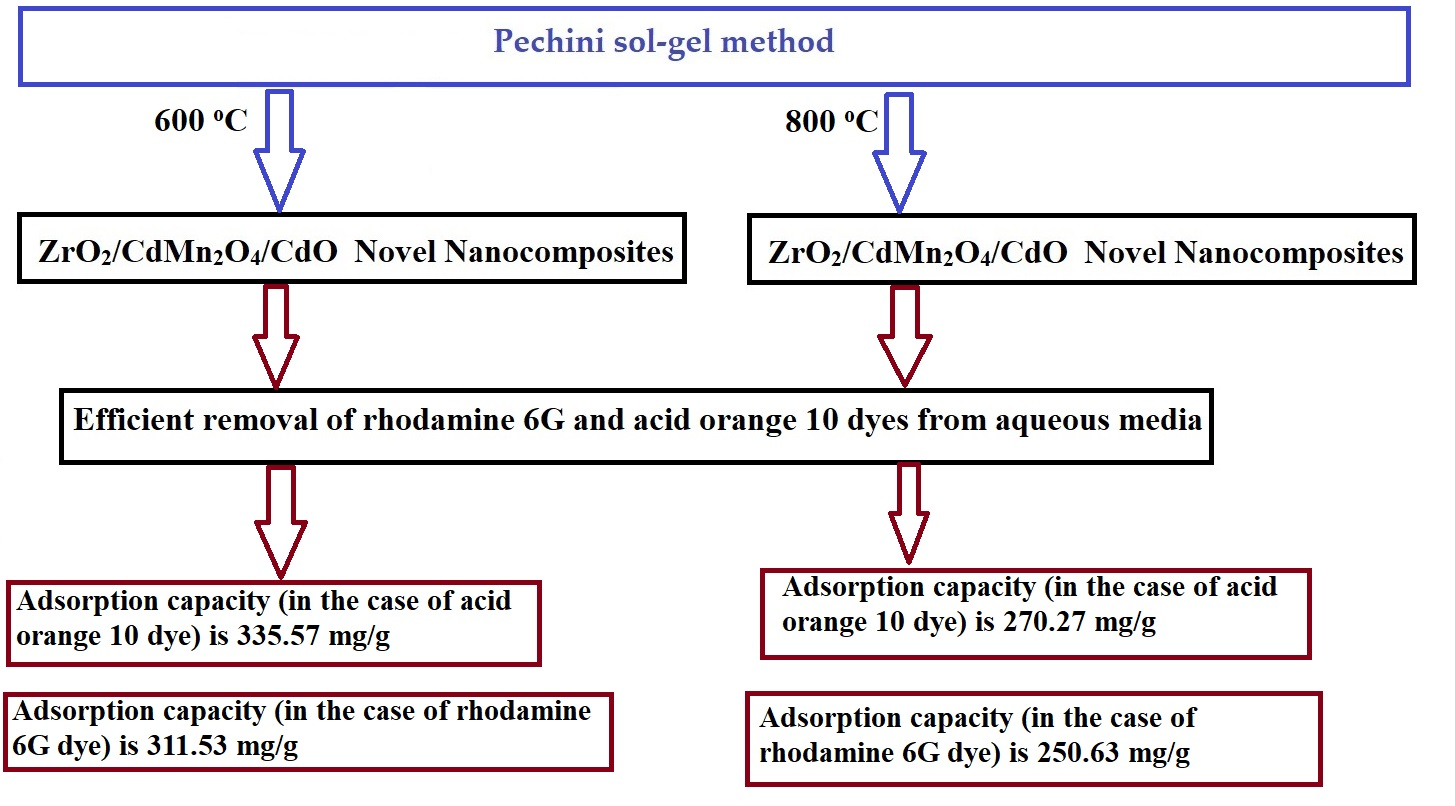
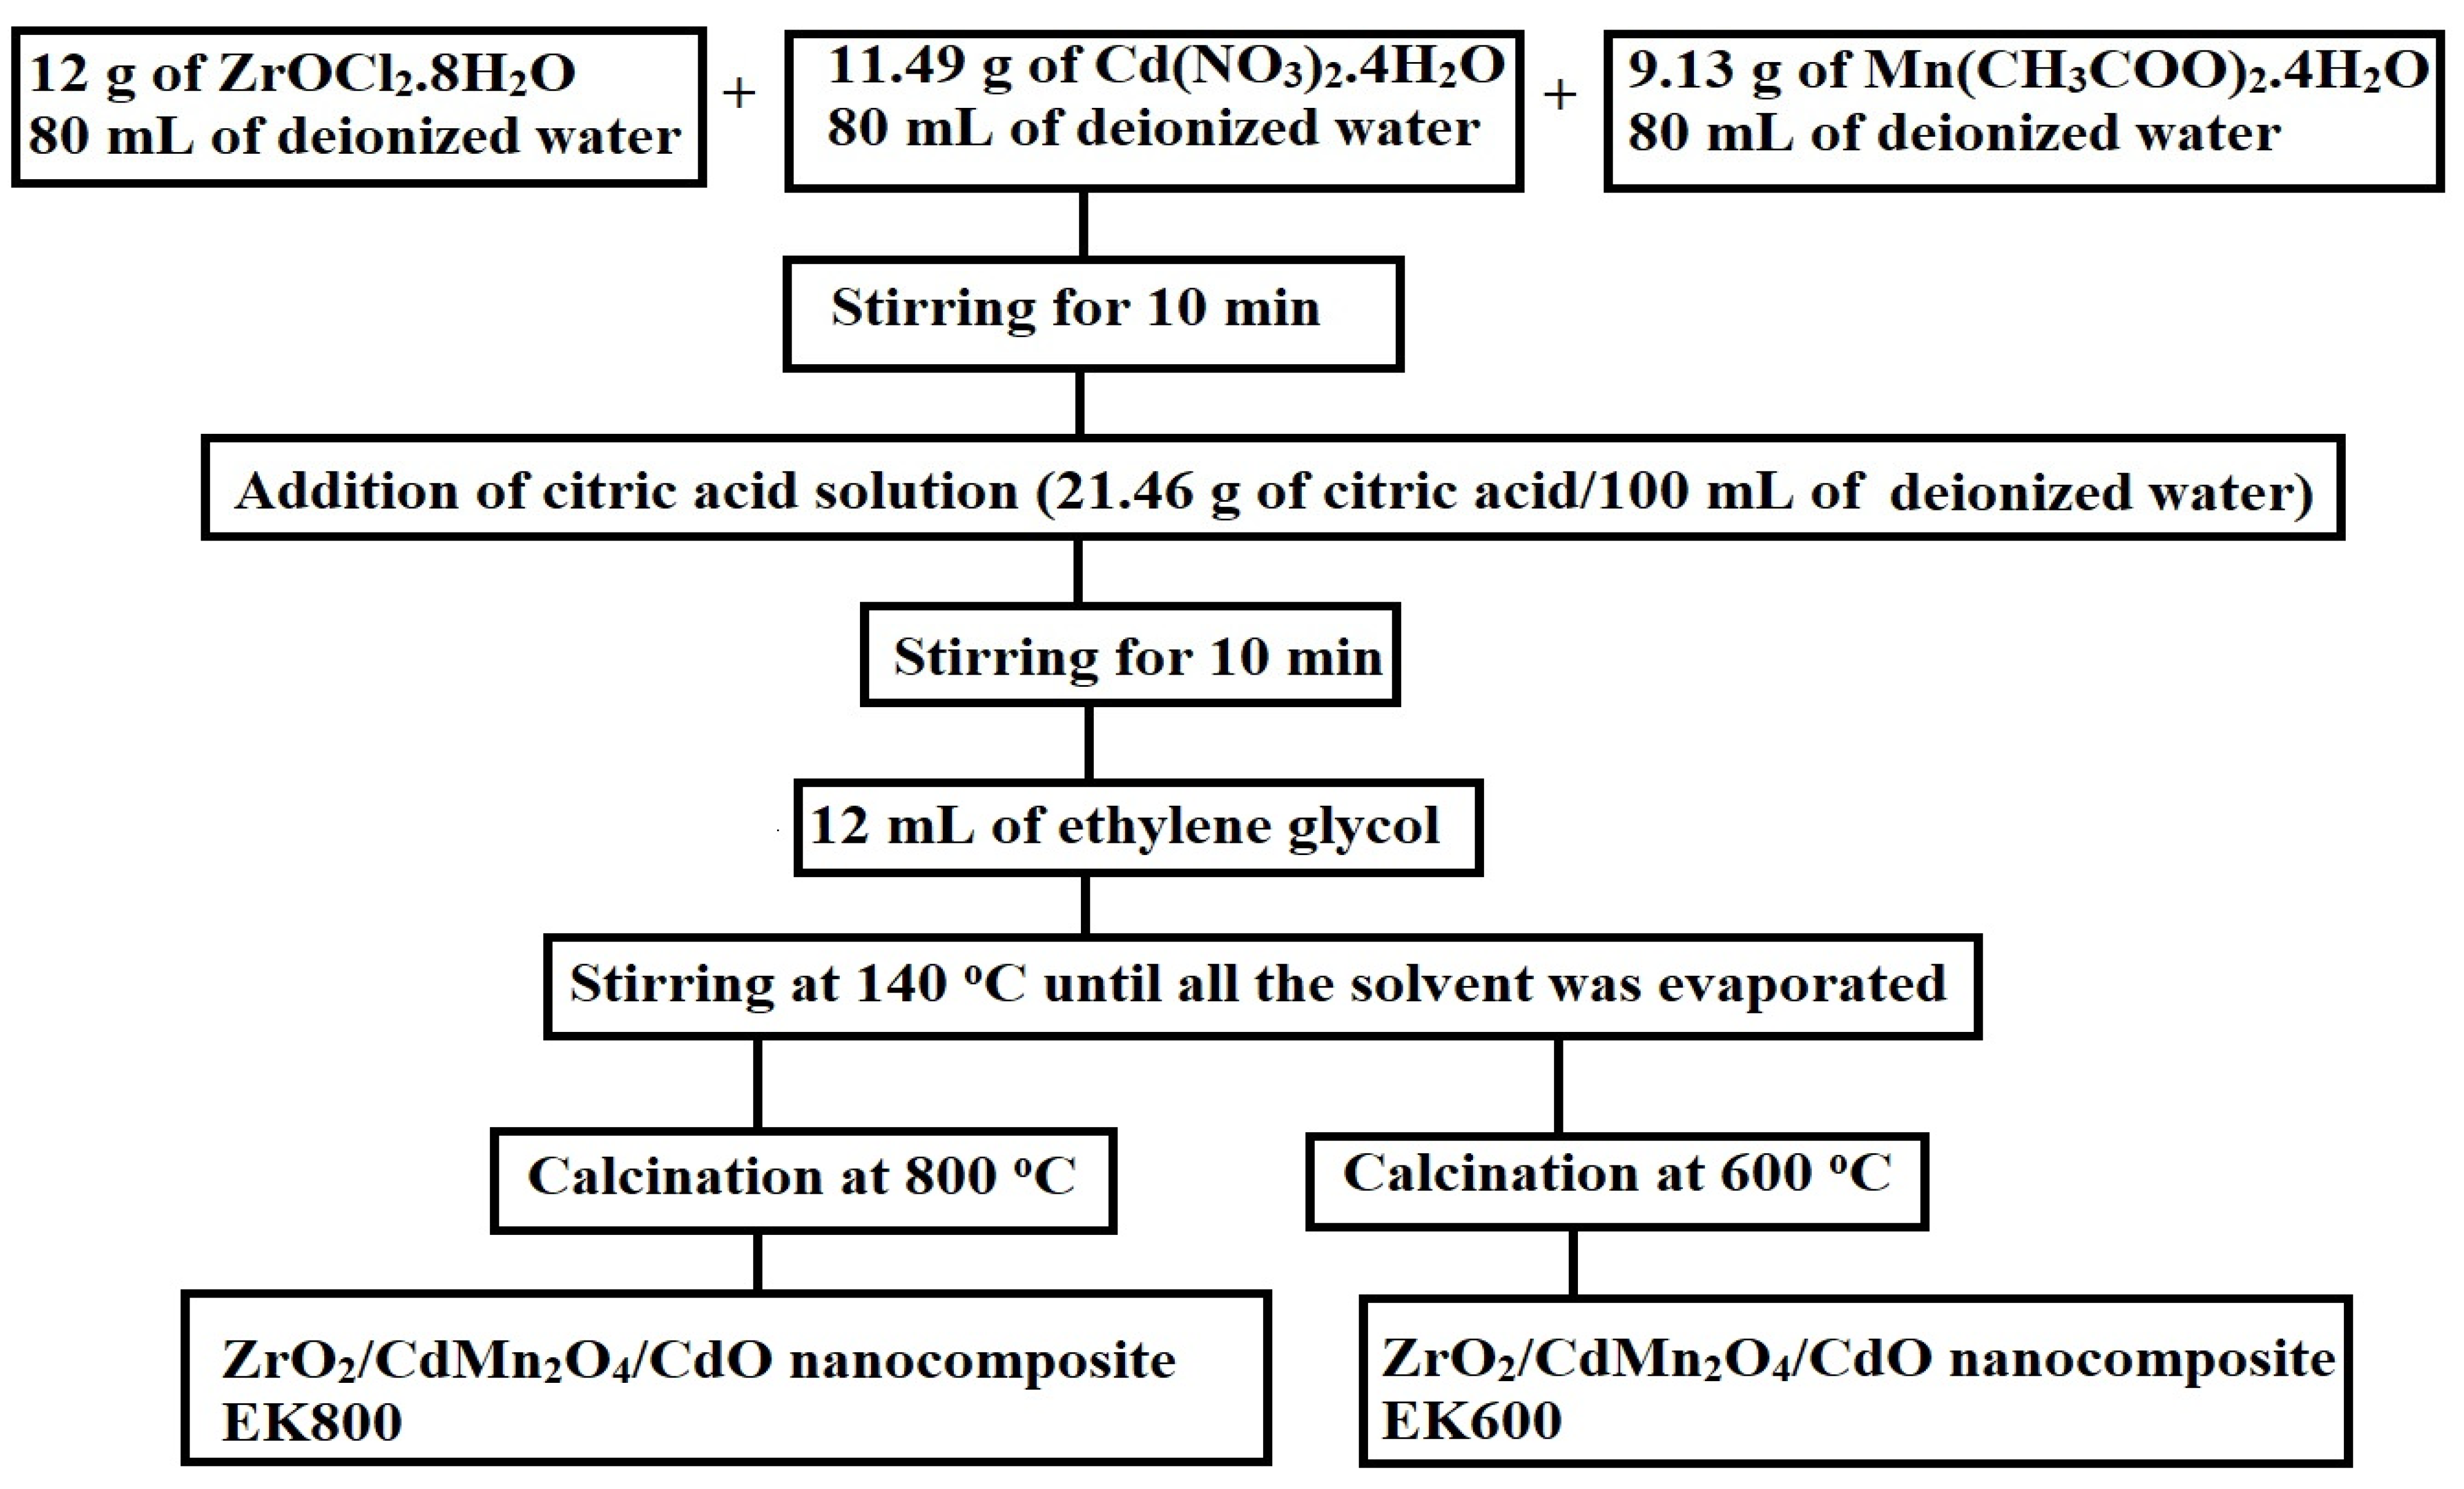
2.2. Synthesis of Adsorbents

Three solutions of zirconium, cadmium, and manganese ions were freshly prepared with a molar ratio of Zr/Cd/Mn equal to 1:1:1. The solution of zirconium ions was prepared via dissolving 12 g of ZrOCl2·8H2O in 80 mL of deionized water. In addition, the solution of cadmium ions was prepared by dissolving 11.49 g of Cd(NO3)2·4H2O in 80 mL of deionized water. In addition, the solution of manganese ions was prepared by dissolving 9.13 g of Mn(CH3COO)2·4H2O in 80 mL of deionized water. Moreover, a solution of citric acid was prepared by dissolving 21.46 g of citric acid in 100 mL of deionized water. After that, solutions of zirconium, cadmium, and manganese metal ions were mixed with each other and stirred at 560 rpm for 10 min. The citric acid solution is then added to the mixed metal ion solution with continuous stirring at 560 rpm for 10 min. In addition, 12 mL of ethylene glycol was added with continuous stirring at 560 rpm at 140 °C until all the solvent was evaporated. Finally, the resulting powder is collected, ground, and then calcinated at 600 and 800 °C to obtain the mixed metal oxide nanostructures. The products, which were obtained by calcination at 600 and 800 °C, were labeled as EK600 and EK800, respectively. The practical steps for synthesizing the EK600 and EK800 nanocomposites are shown in Scheme 1.

2.3. Characterization of Adsorbents

Patterns of X-ray diffraction (XRD) of EK600 and EK800 nanocomposites were obtained using a Bruker D8 Advance diffractometer with 0.15 nm CuKα radiation. Surface images and compositions of EK600 and EK800 samples were obtained using the JSM-IT800 Schottky field emission scanning electron microscope (FE-SEM) coupled with energy dispersive X-ray spectroscopy (EDS). A Quantachrome N2 adsorption/desorption analyzer was used to determine the BET surface area in addition to the pore features of the EK600 and EK800 samples.

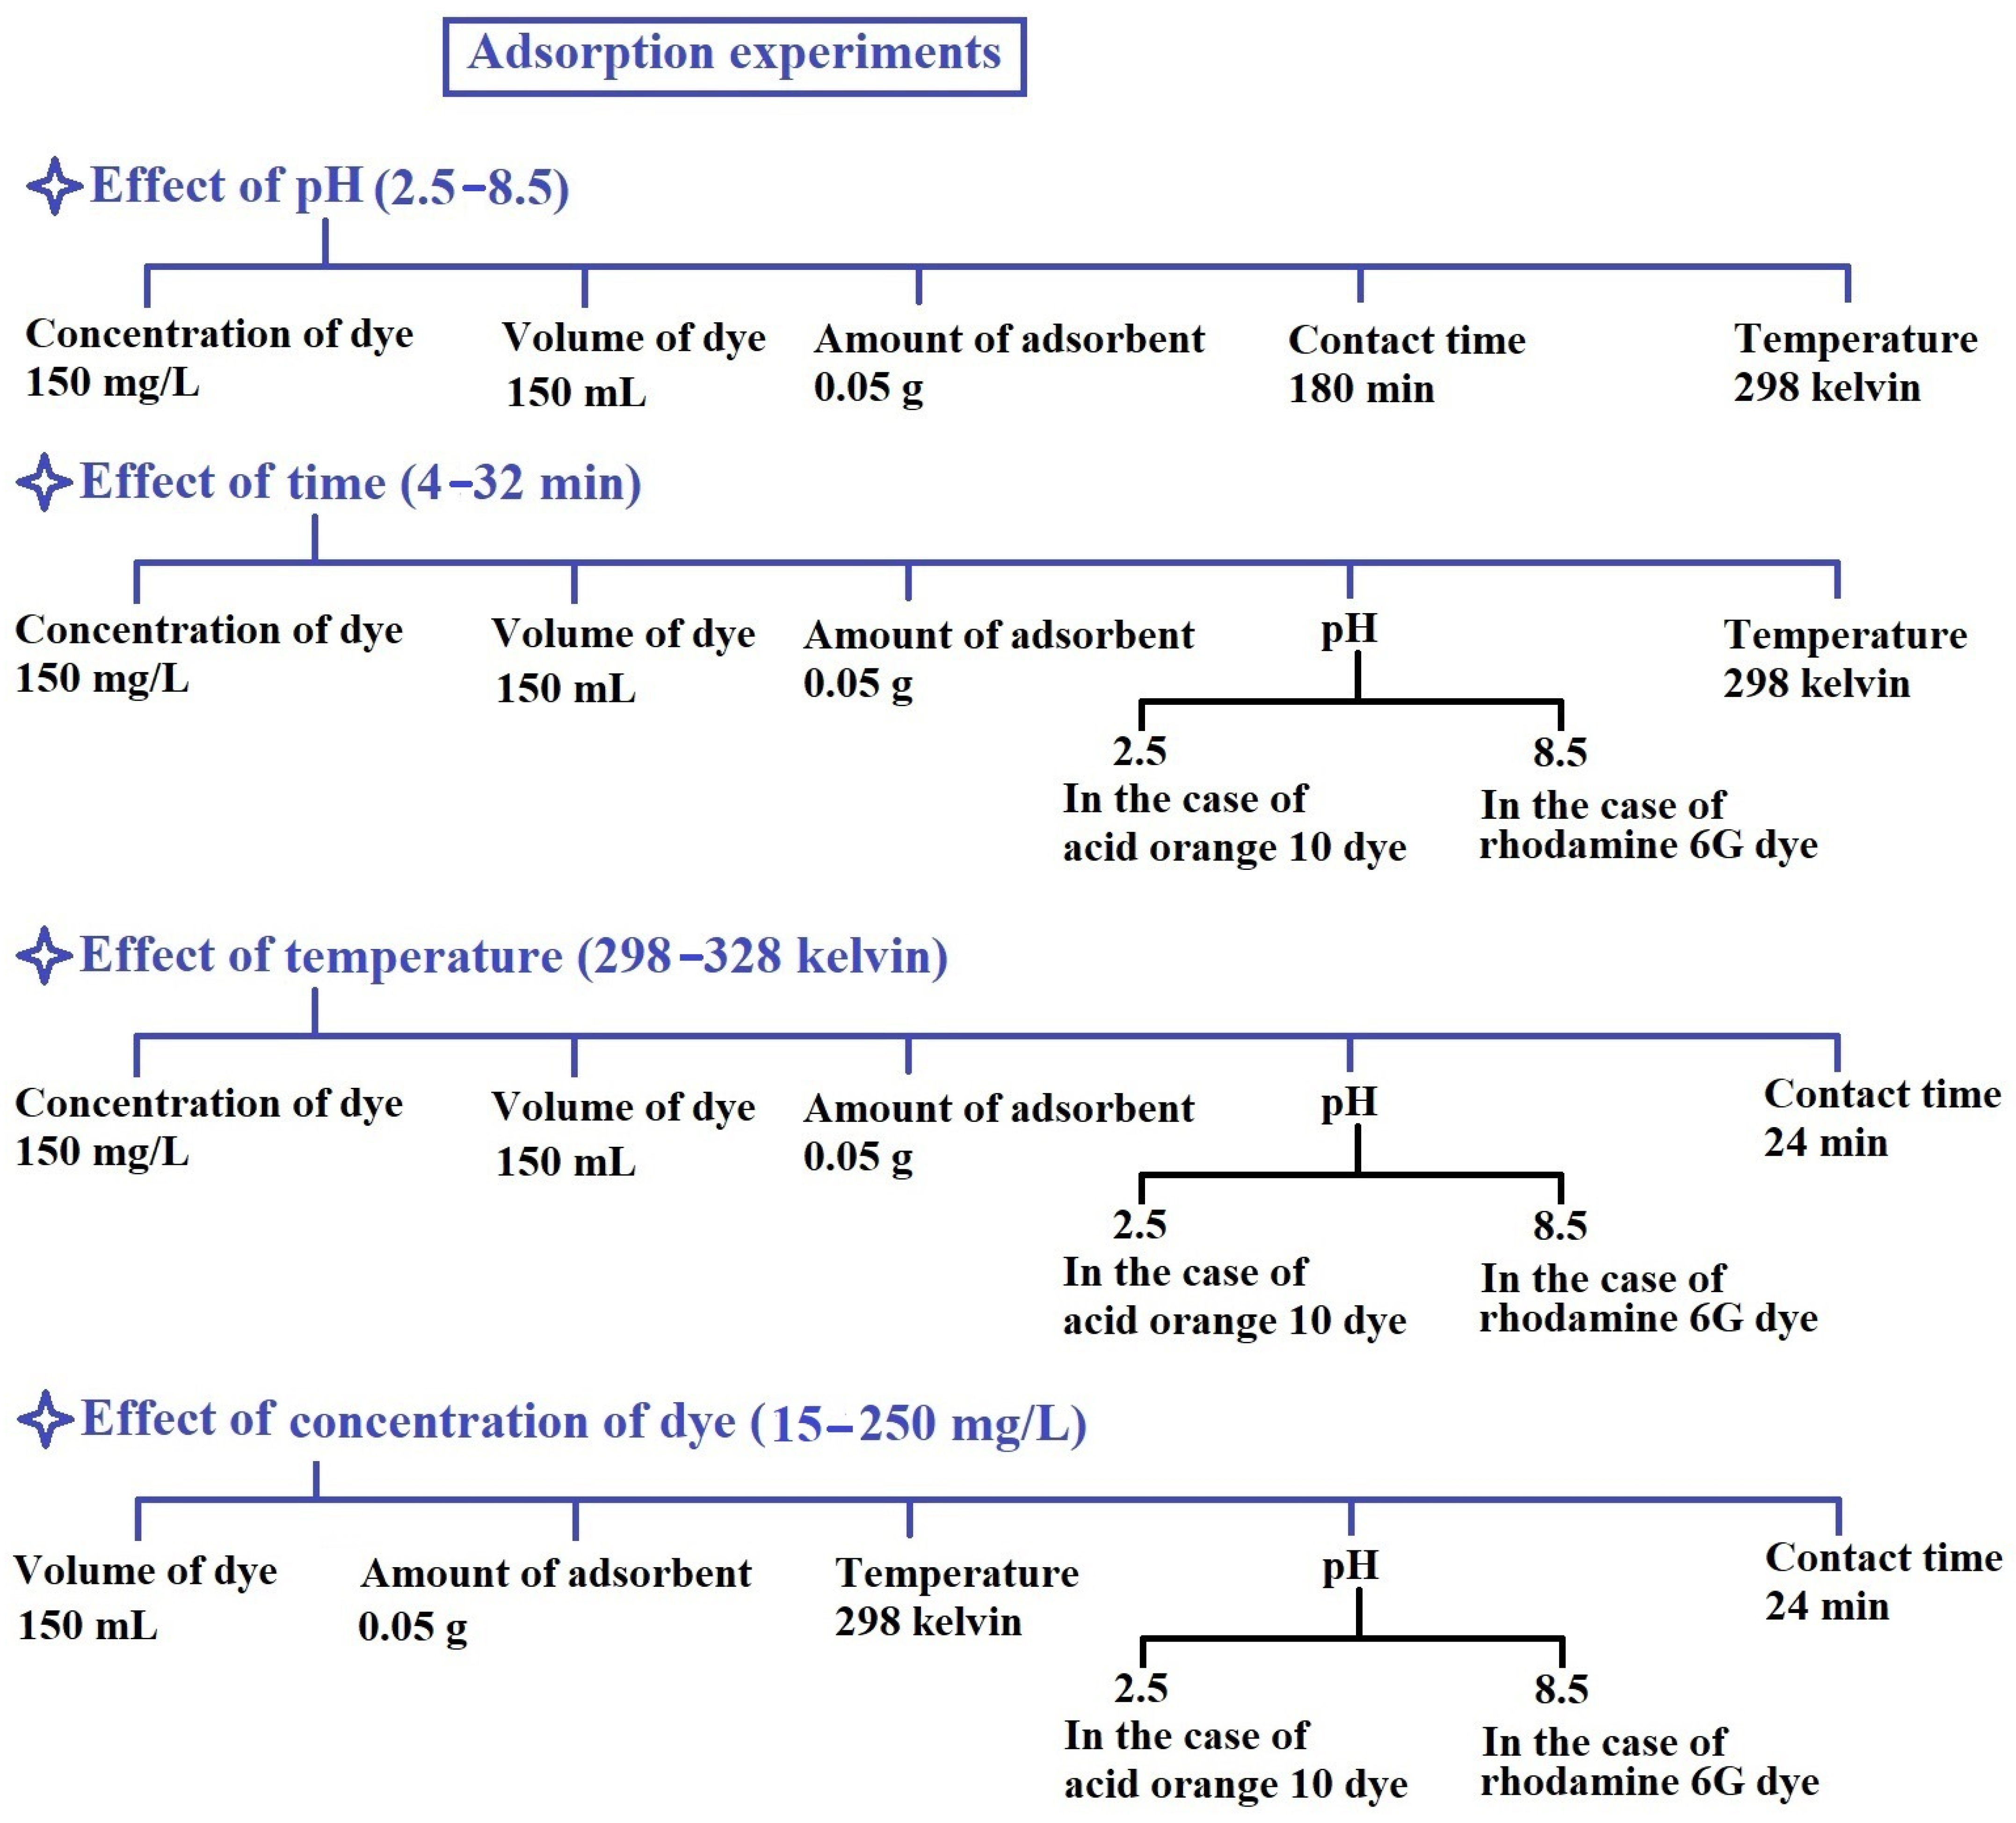
2.4. Removal of Rhodamine 6G and Acid Orange 10 Dyes from Aqueous Solutions

A total of 0.05 g of EK600 or EK800 adsorbent was mixed with 150 mL of a 150 mg/L aqueous solution of rhodamine 6G or acid orange 10 dyes and then stirred at 550 rpm for 180 min in order to investigate the effect of solution pH ranging from 2.5 to 8.5. The adsorbent was then removed from the mixture by centrifuging it at 2550 rpm for 4 min. After centrifugation, the produced filtrate was analyzed with a Shimadzu 1800 UV–Vis spectrophotometer at 524 and 485 nm to determine the equilibrium concentration of rhodamine 6G and acid orange 10 dyes, respectively. Furthermore, the effects of time (in the range of 4–40 min), temperature (in the range of 298–328 kelvin), and concentration (in the range of 15–250 mg/L) were also studied.
The % removal of rhodamine 6G or acid orange 10 dyes (% U) and the adsorption capacity of EK600 and EK800 adsorbents (O, mg/g) were determined by Equations (1) and (2), respectively.
% U = Z o Z e Z o × 100
O = Z o Z e × V M
Zo and Ze are the original and equilibrium concentrations of rhodamine 6G or acid orange 10 dyes (mg/L), respectively. Moreover, M and V are the amount of adsorbent (g) and the solution volume of rhodamine 6G or acid orange 10 dyes (L), respectively. The practical steps for removing the rhodamine 6G and acid orange 10 dyes using the EK600 and EK800 nanocomposites are shown in Scheme 2.

3. Results and Discussion

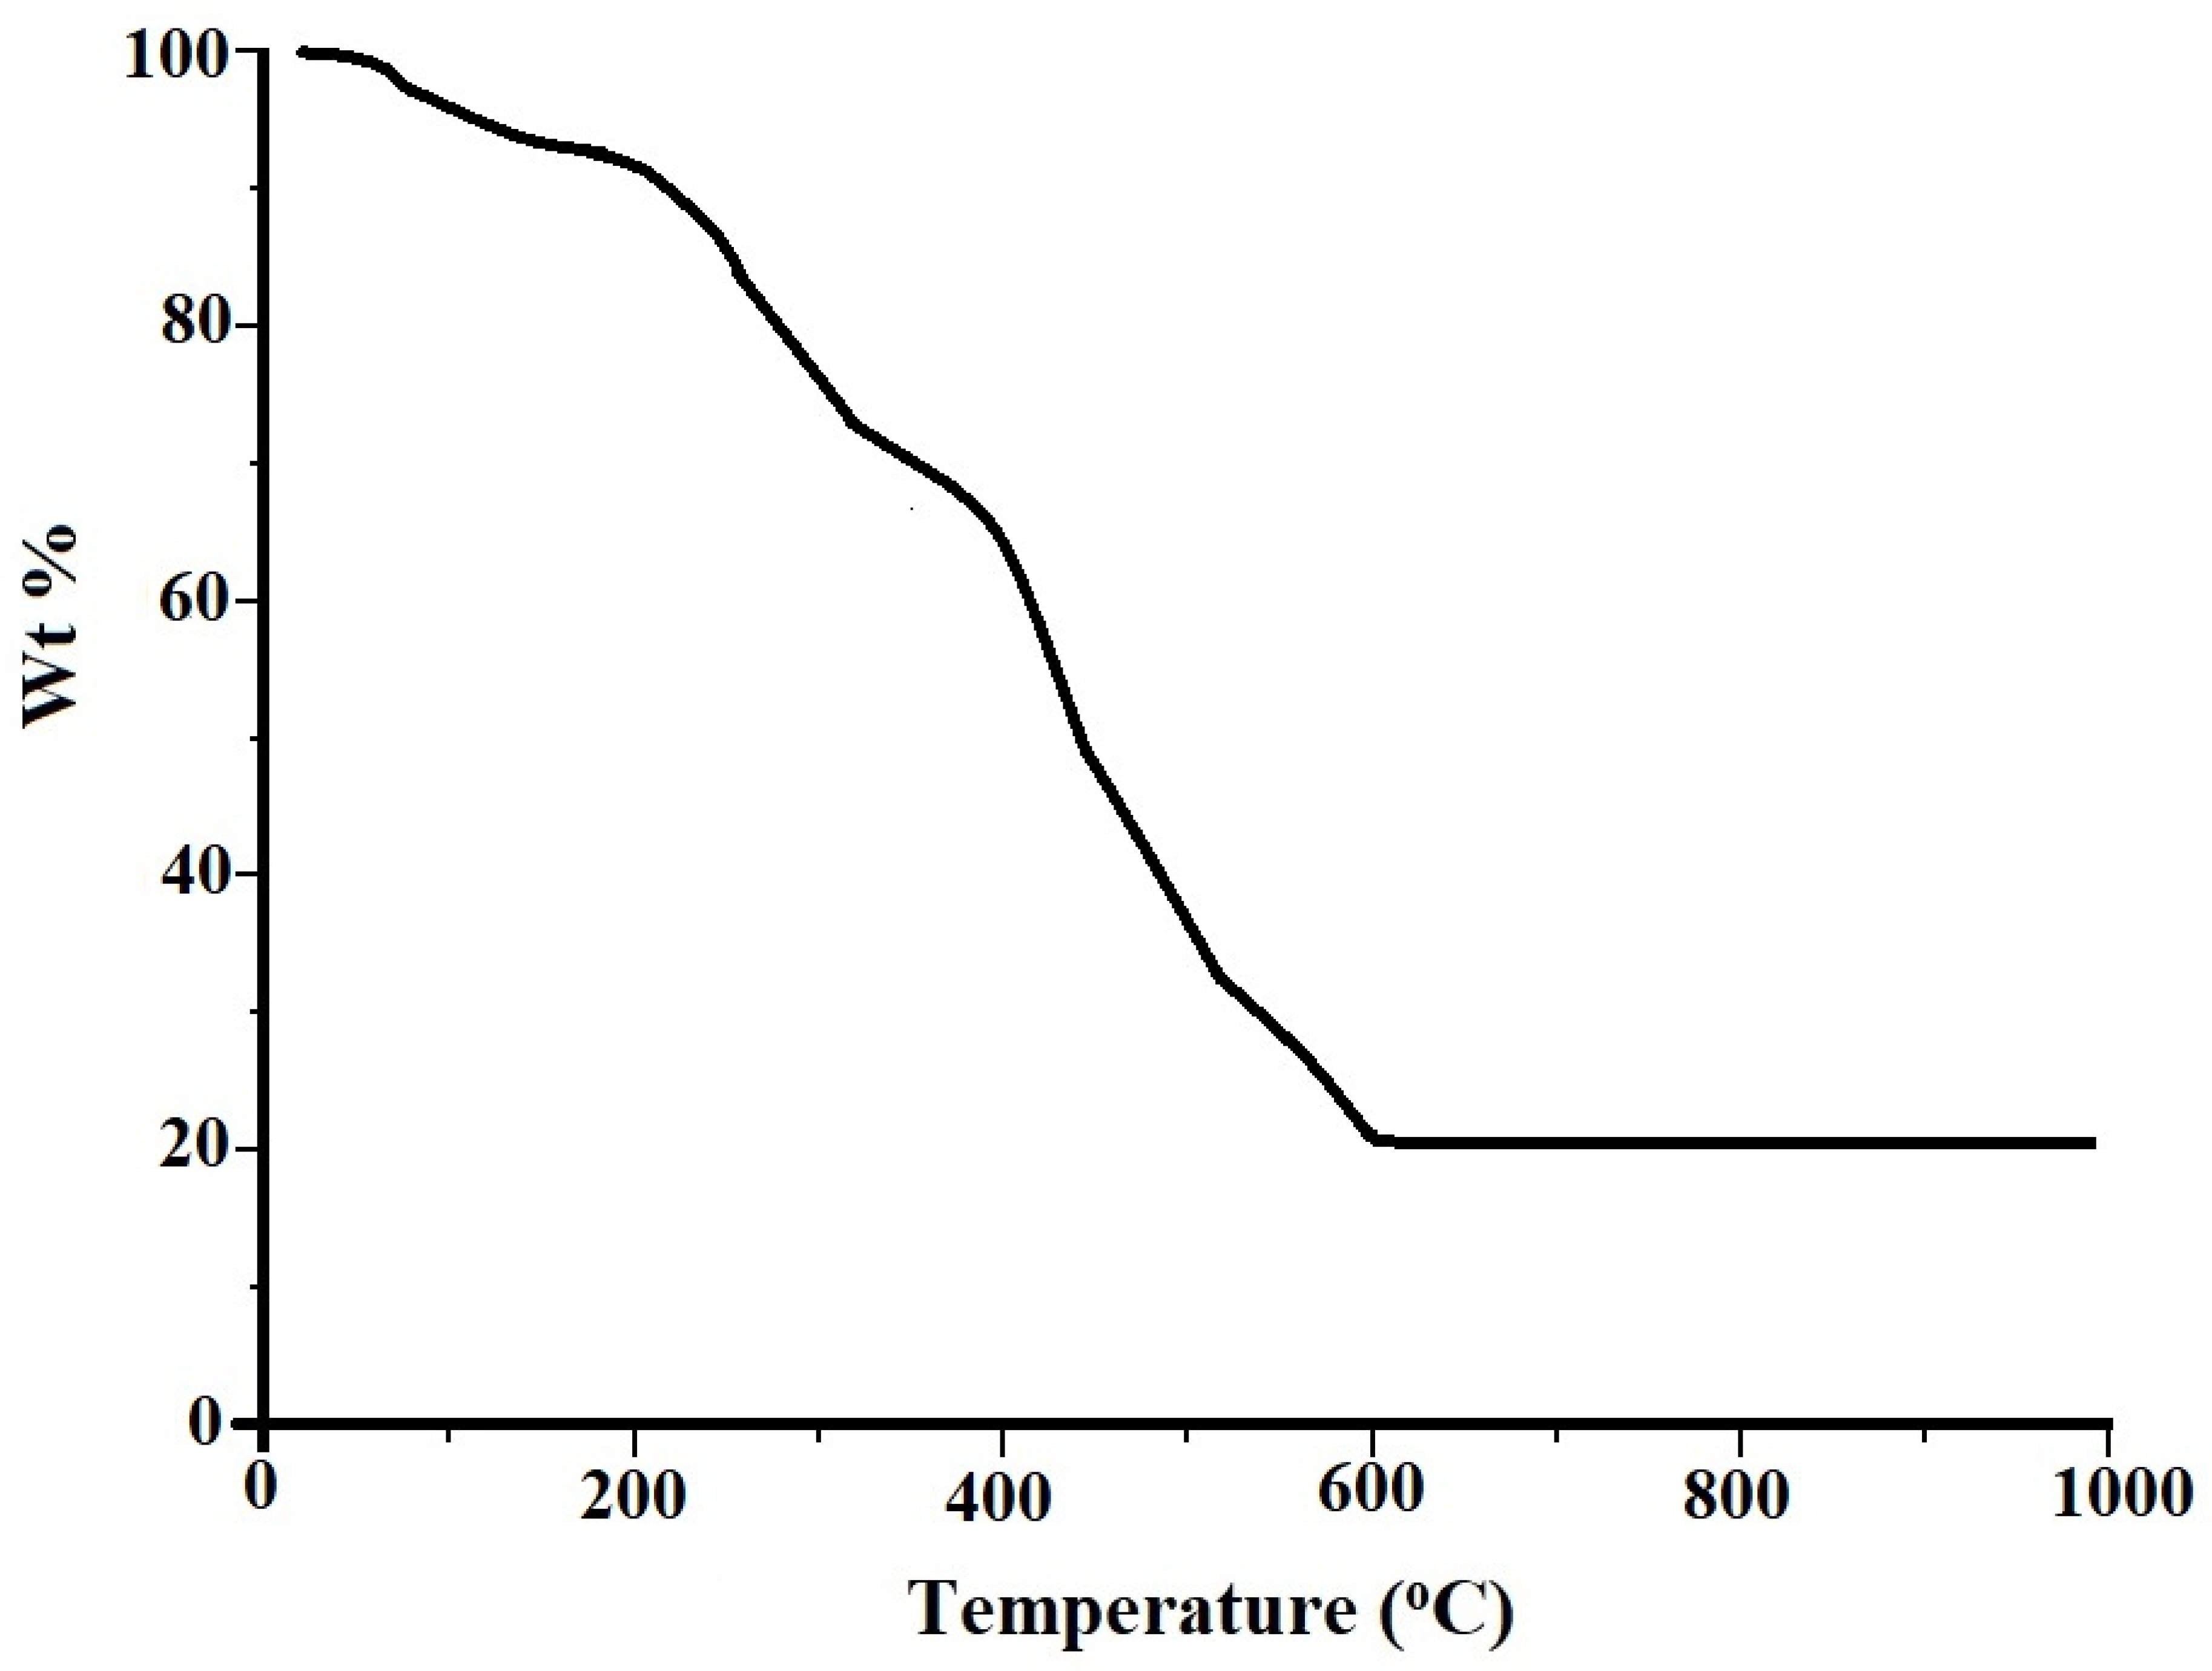
3.1. Synthesis and Characterization of the Synthesized Samples
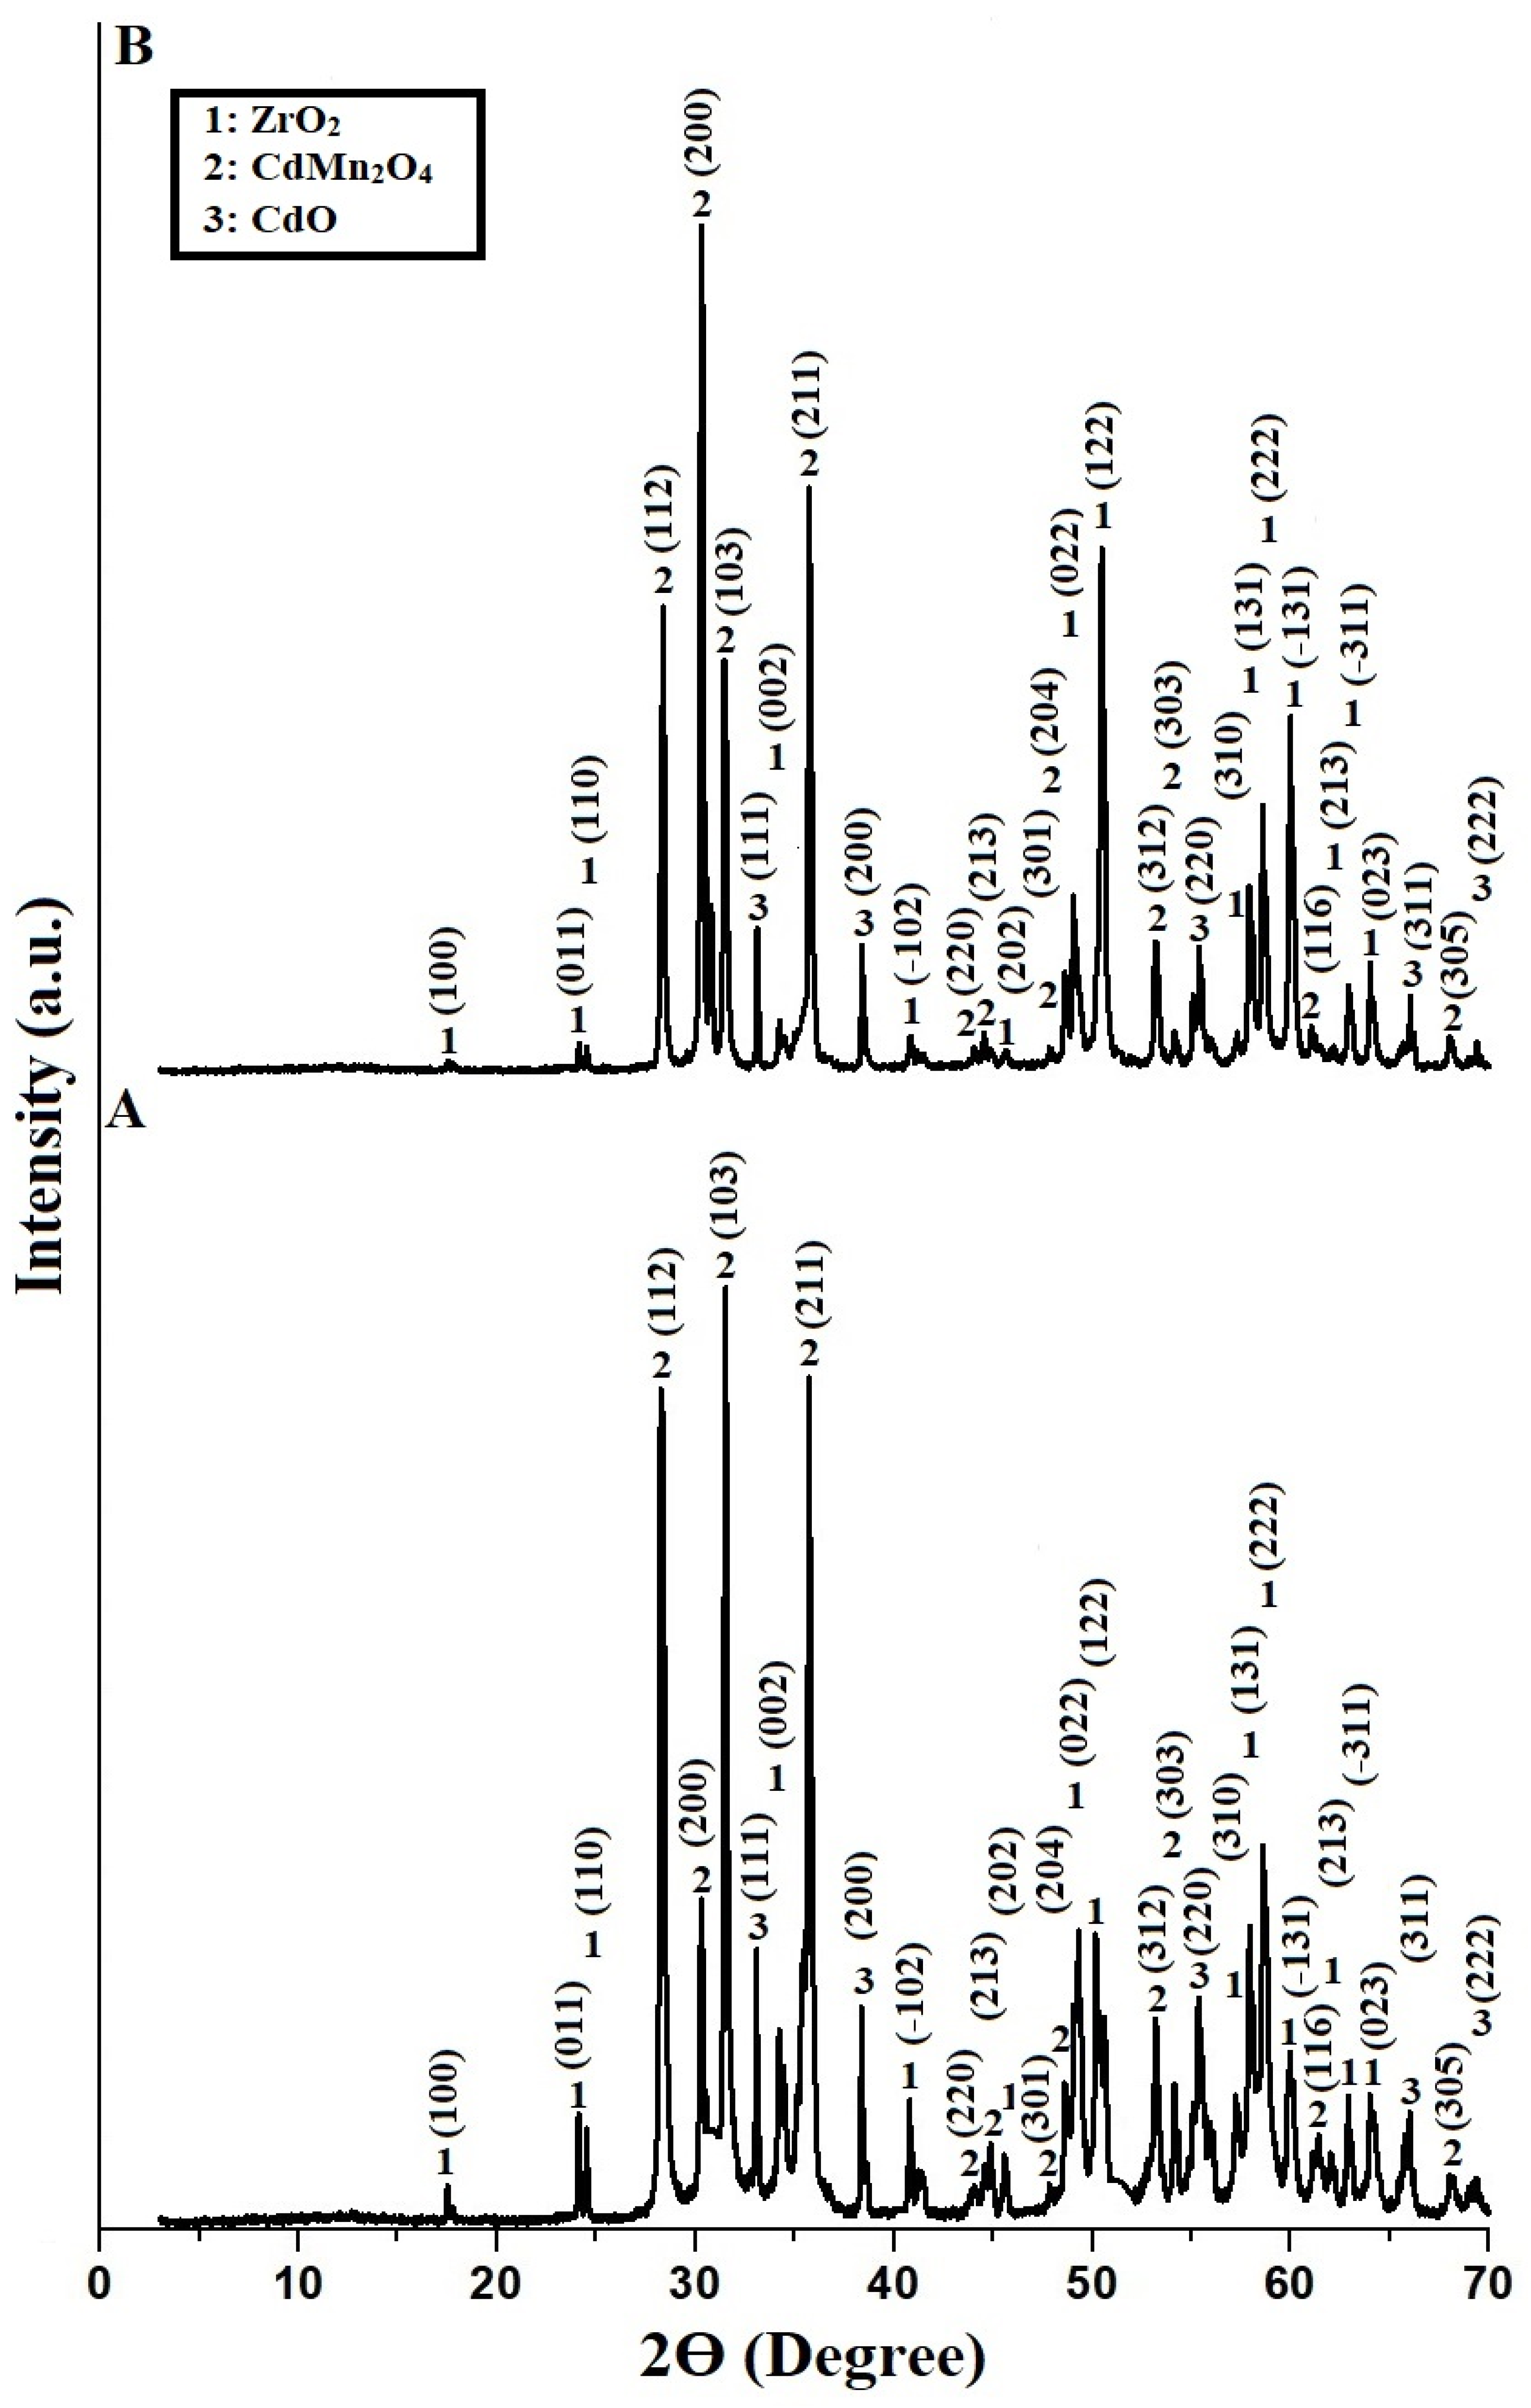
The Pechini sol–gel method was utilized to produce a ZrO2/CdMn2O4/CdO nanocomposite. To achieve this, zirconyl citrate, cadmium citrate, and manganese citrate were derived from citric acid reacting with zirconyl chloride octahydrate, cadmium(II) nitrate tetrahydrate, and manganese(II) acetate tetrahydrate. In this process, ethylene glycol plays a crucial role as a control agent for polymerization and contributes to gel formation by reacting with citric acid. The resultant three-dimensional gel network serves as a template for the final nanocomposite, which is obtained through calcination at 600 and 800 °C. To obtain the desired pure ZrO2/CdMn2O4/CdO nanocomposite, it is necessary to fully decompose and eliminate the organic constituents. The temperatures selected for this process, 600 °C and 800 °C, appear to be appropriate based on the thermogravimetric analysis of the resulting powder prior to calcination (Figure 1).

3.1.1. XRD

Figure 2A,B illustrate the XRD patterns of the EK600 and KE800 nanocomposites, respectively. Also, the results showed that the EK600 and EK800 samples consist of zirconium oxide (ZrO2), cadmium manganese oxide (CdMn2O4), and cadmium oxide (CdO) nanostructures as elucidated from JCPDS Nos. 00-007-0343, 00-023-0826, and 01-075-0592, respectively. The peaks at 2Ɵ = 17.52°, 24.09°, 24.42°, 34.34°, 41.02°, 45.62°, 49.21°, 50.36°, 57.29°, 57.91°, 58.66°, 59.92°, 62.02°, 62.96°, and 64.11° are due to the (100), (011), (110), (002), (−102), (202), (022), (122), (310), (131), (222), (−131), (213), (−311), and (023) miller indices of ZrO2, respectively. Also, the peaks at 2Ɵ = 28.45°, 30.33°, 31.45°, 35.58°, 43.96°, 44.67°, 47.95°, 48.57°, 53.19°, 54.14°, 61.27°, and 68.09° are due to the (112), (200), (103), (211), (220), (213), (301), (204), (312), (303), (116), and (305) miller indices of CdMn2O4, respectively. In addition, the peaks at 2Ɵ = 33.12°, 38.50°, 55.30°, 65.90°, and 69.15° are due to the (111), (200), (220), (311), and (222) miller indices of CdO, respectively. Moreover, the average crystal size of the EK600 and EK800 nanocomposites is 68.25 and 85.32 nm, respectively. Hence, the compositions of EK600 and EK800 nanocomposites are the same, but the average crystallite size is different. This can be seen from the difference in intensity of the XRD peaks in the two samples, with no difference in their position. In the Pechini sol–gel method, the size of the resulting particles can increase with increasing calcination temperatures due to several underlying processes that take place during the calcination step. The calcination stage is a crucial stage in which the dried gel precursor is heated to remove the organic components and promote the formation of the desired crystalline phase. At elevated temperatures, particles start to undergo sintering, which is the process of grain boundary migration and coalescence of adjacent particles. Sintering causes the particles to fuse together, resulting in the growth of larger crystallites and an overall increase in particle size. Also, during calcination, organic solvents and other volatiles are driven off as gases from the gel. As these volatiles escape, voids or pores may be formed within the structure, leading to an increase in particle size. In addition, during calcination, particles may agglomerate or cluster together due to the increased diffusion and mobility of atoms at higher temperatures. These agglomerates can contribute to the observed increase in particle size.

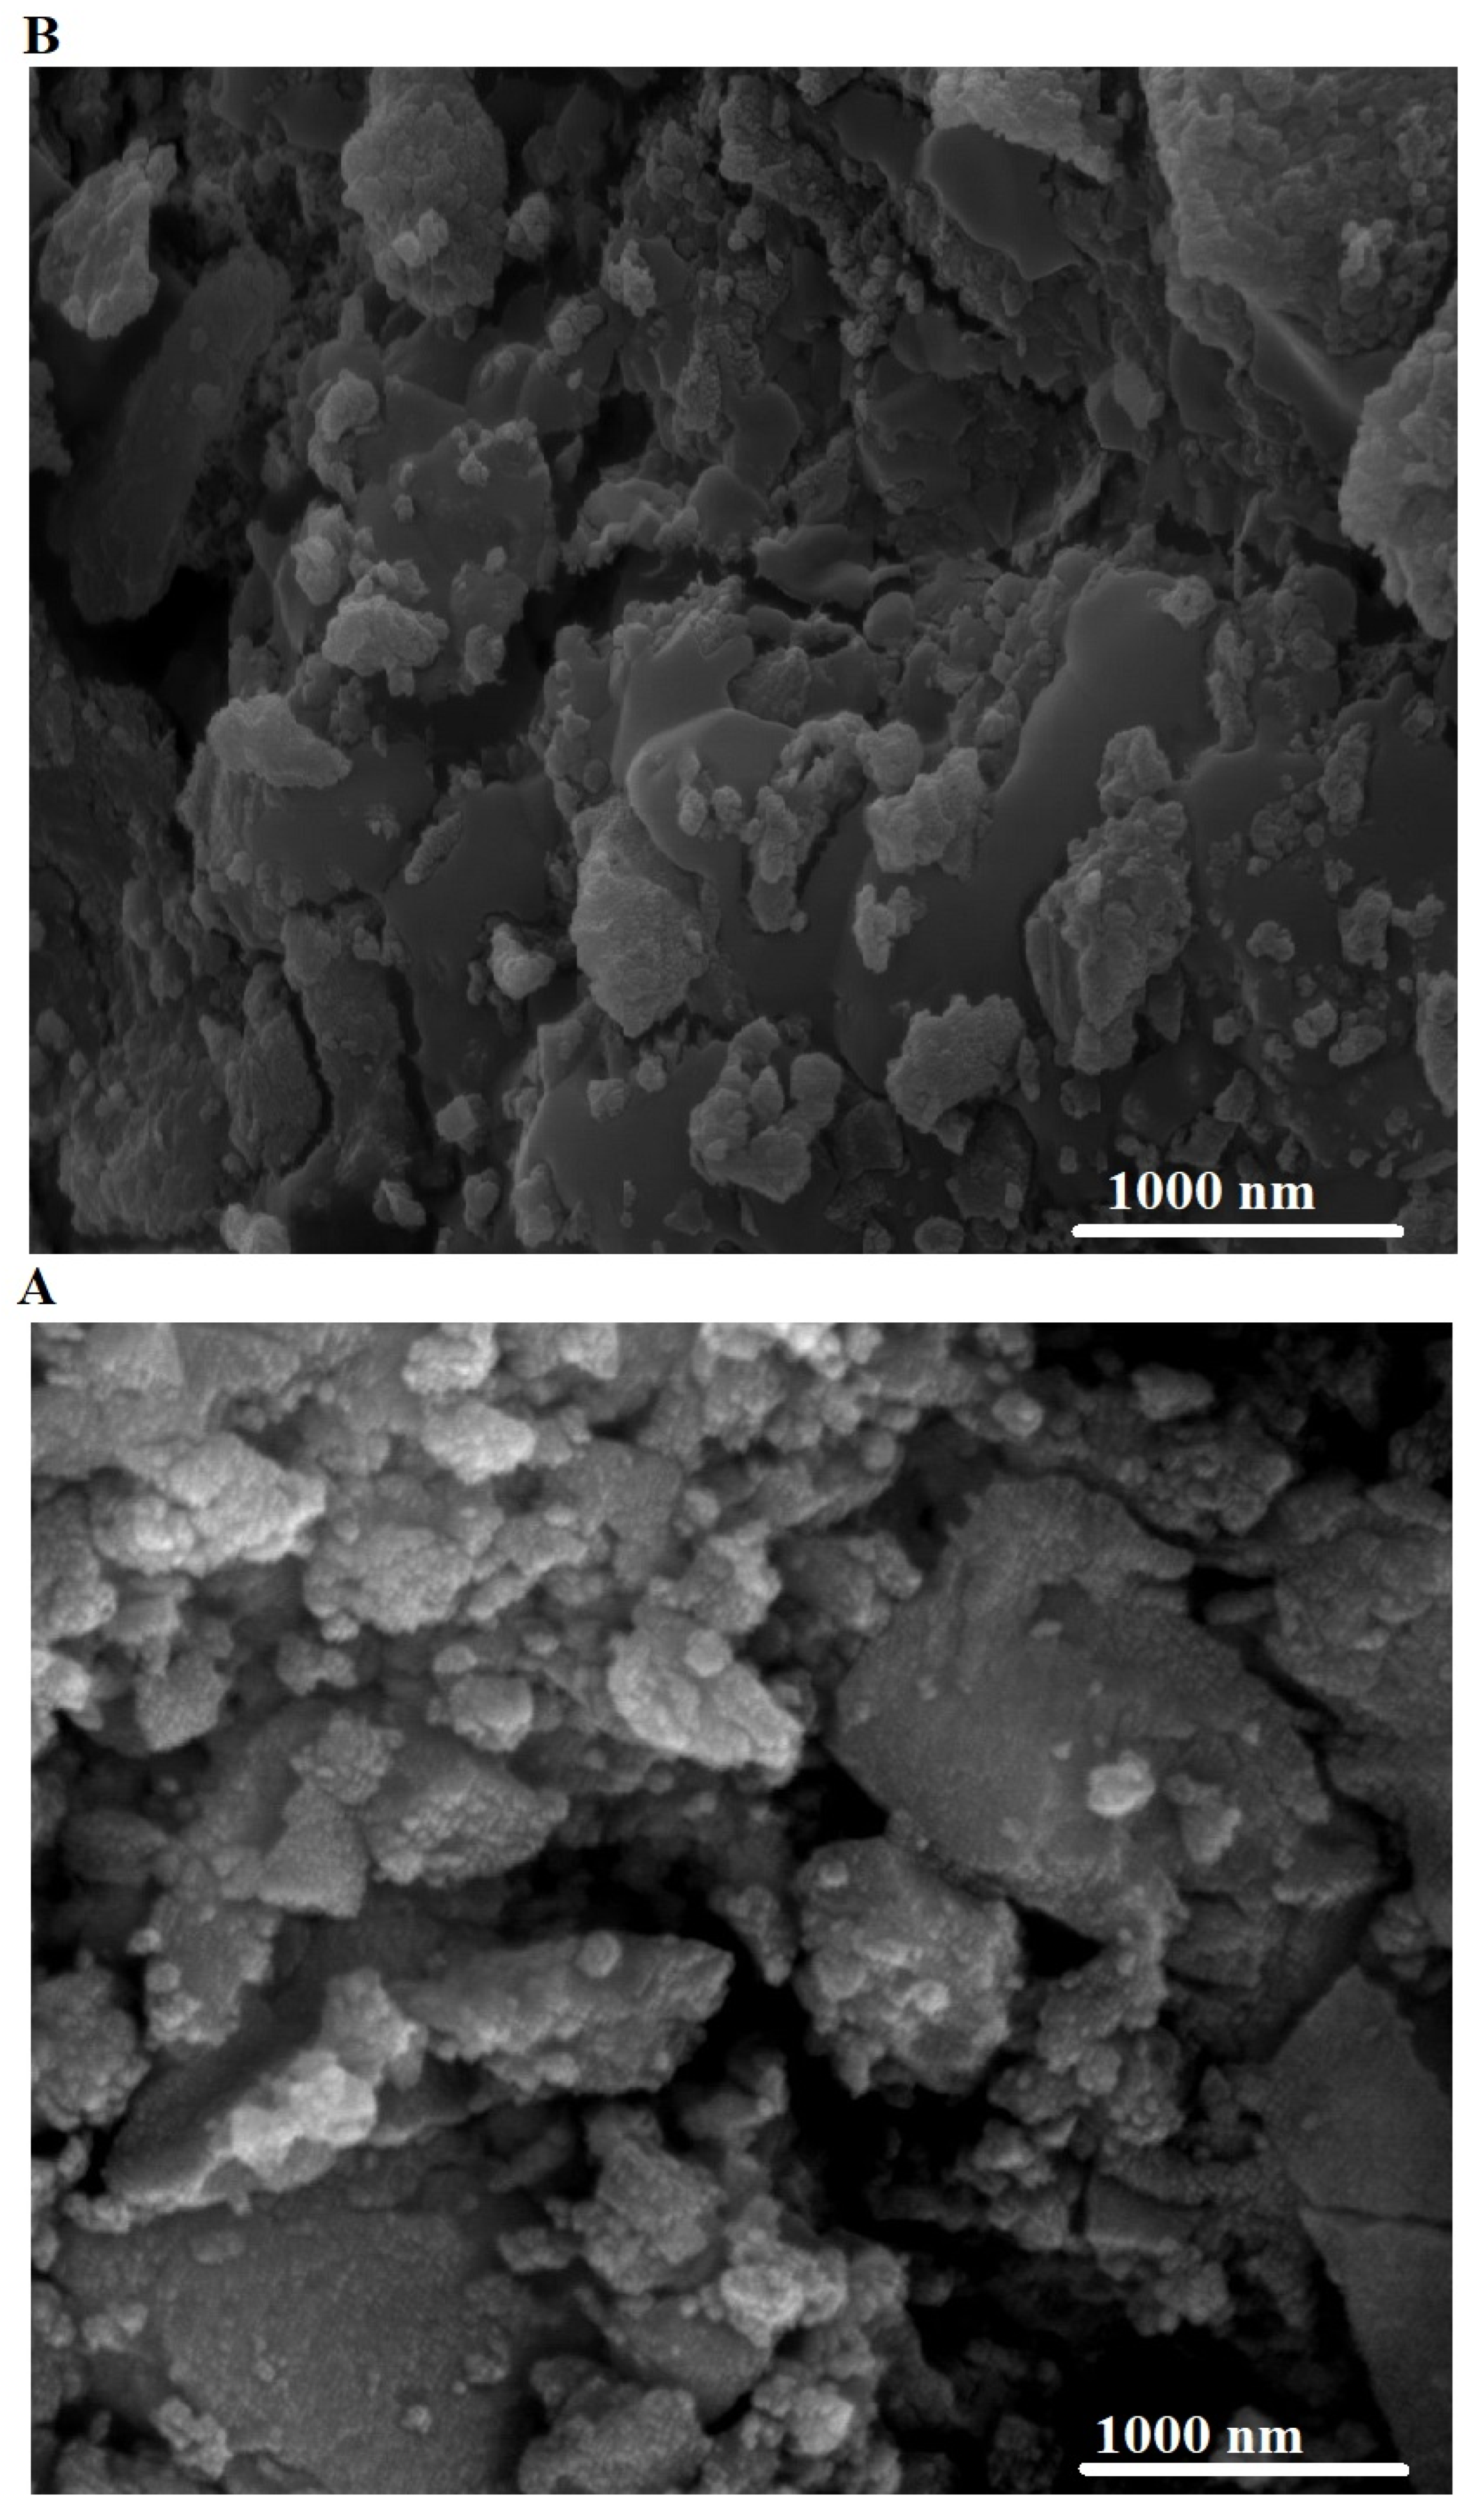
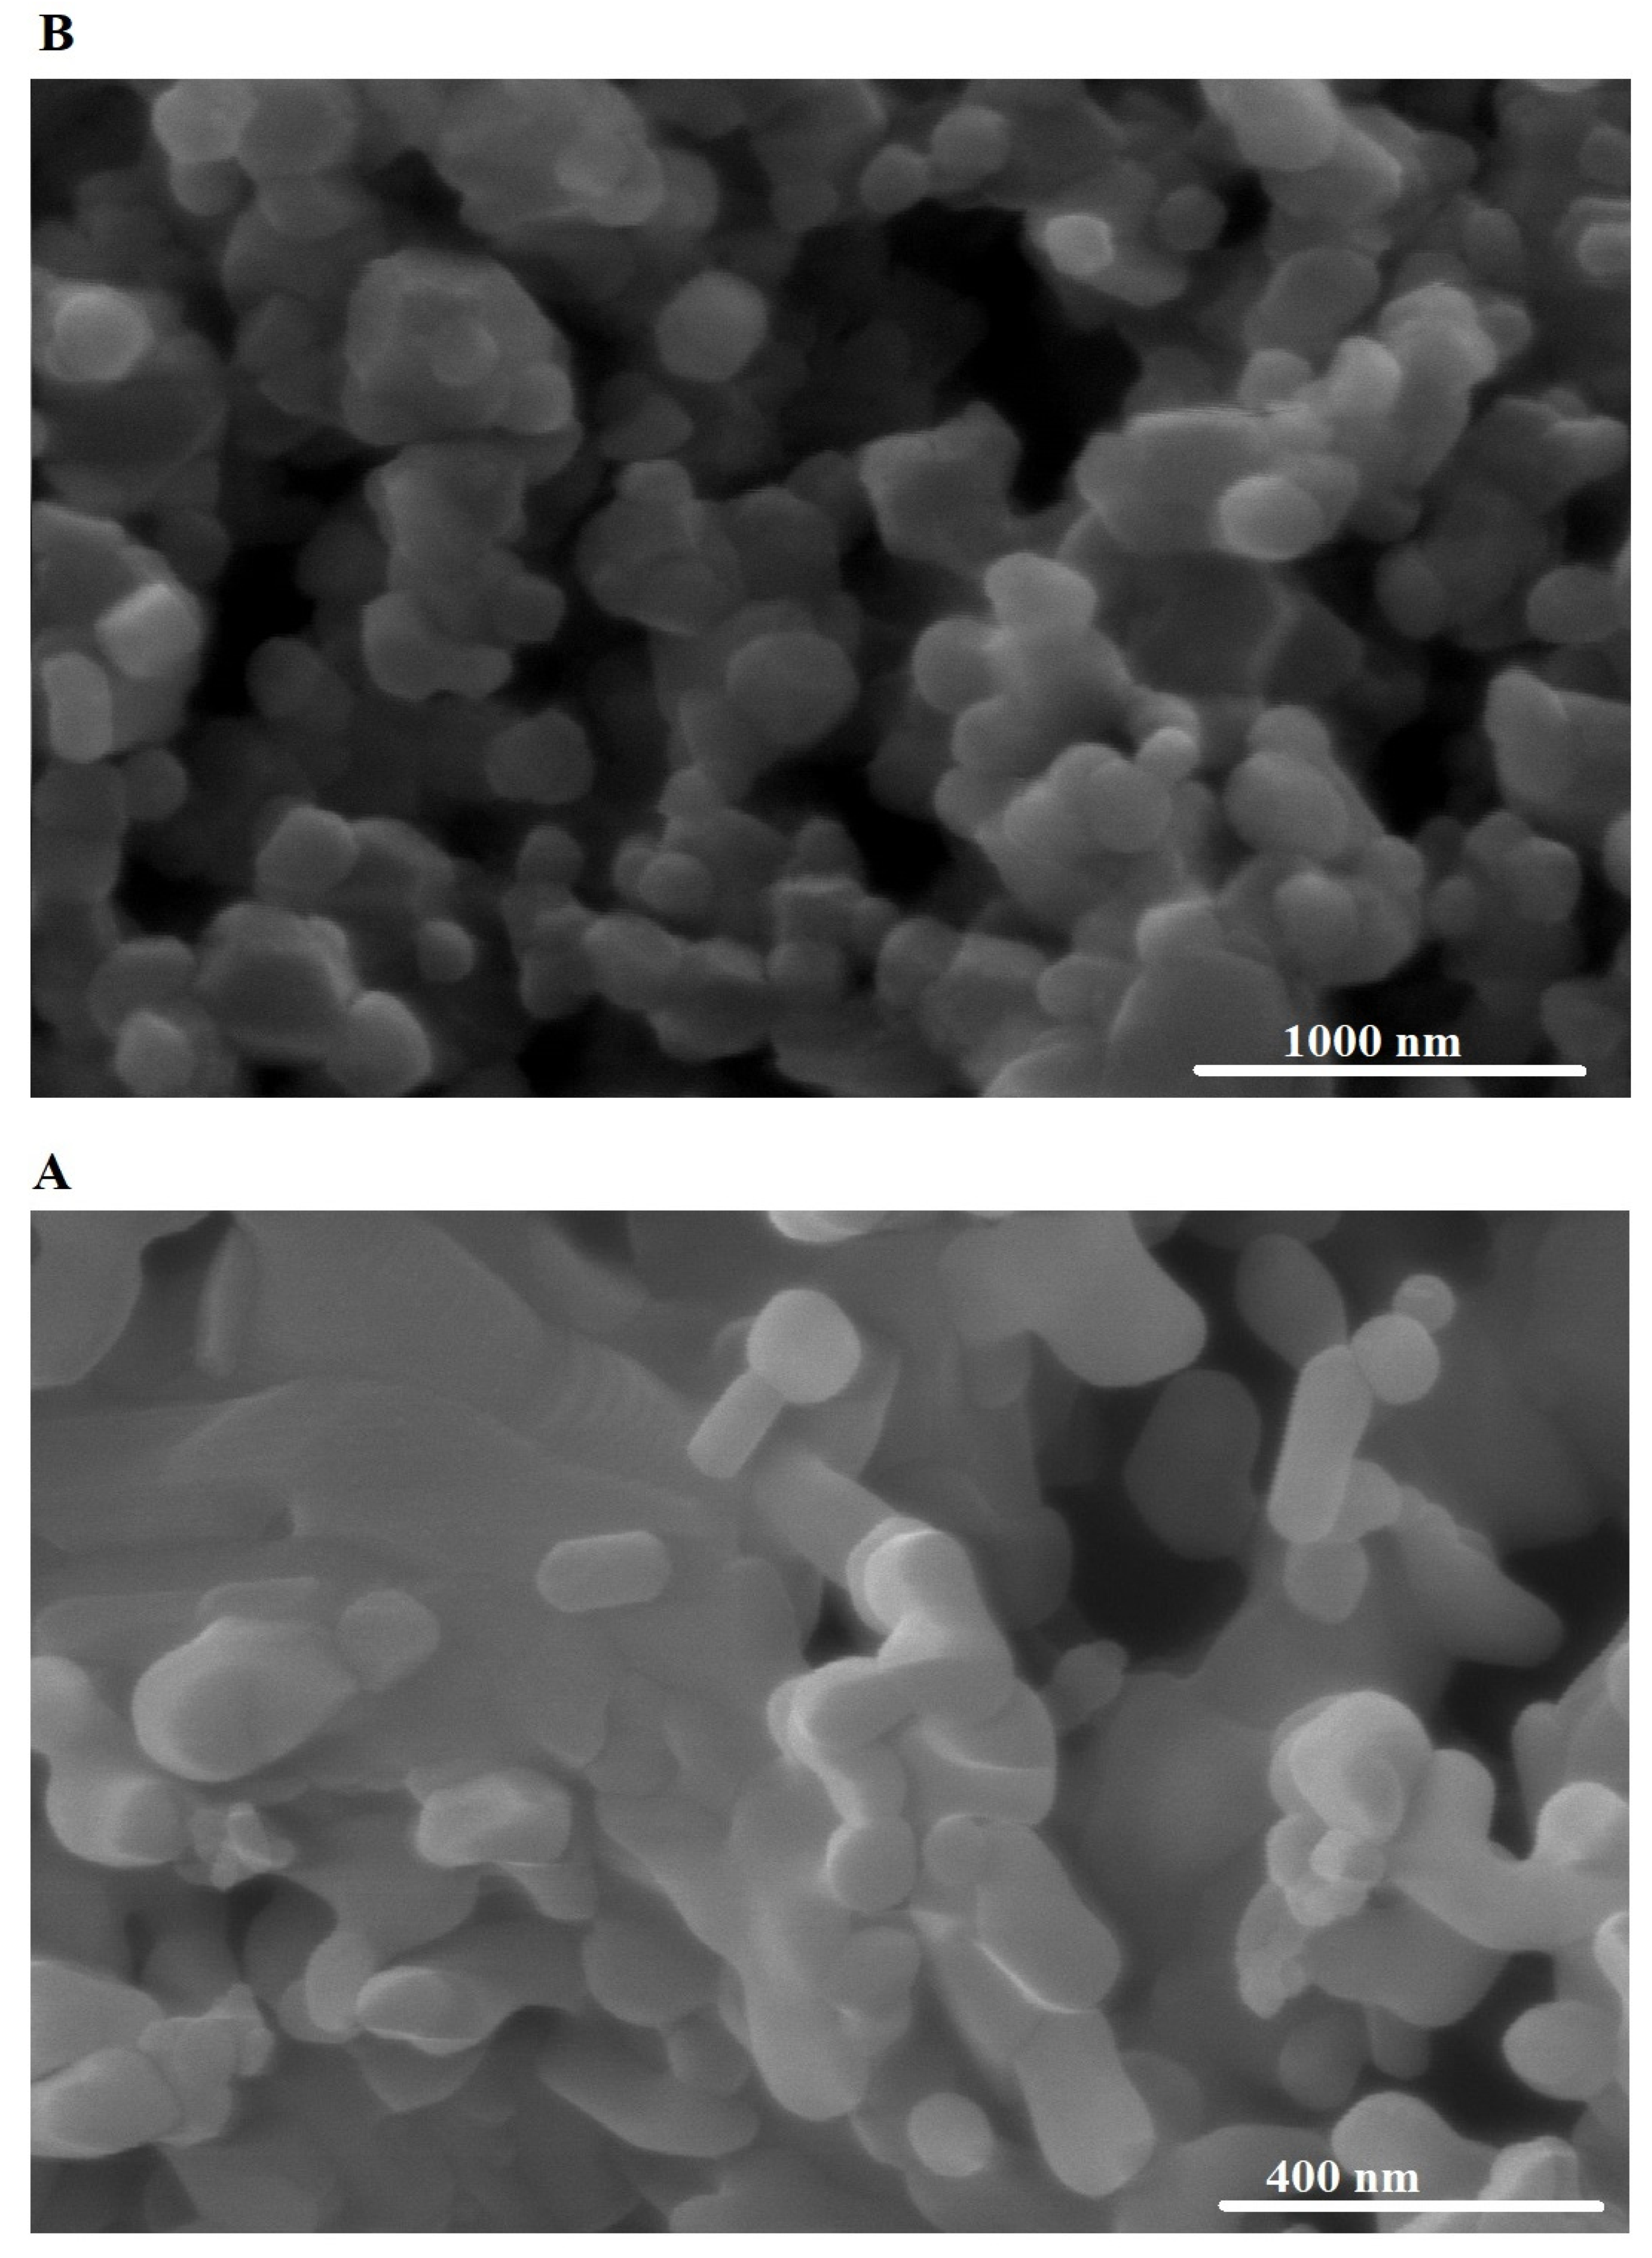
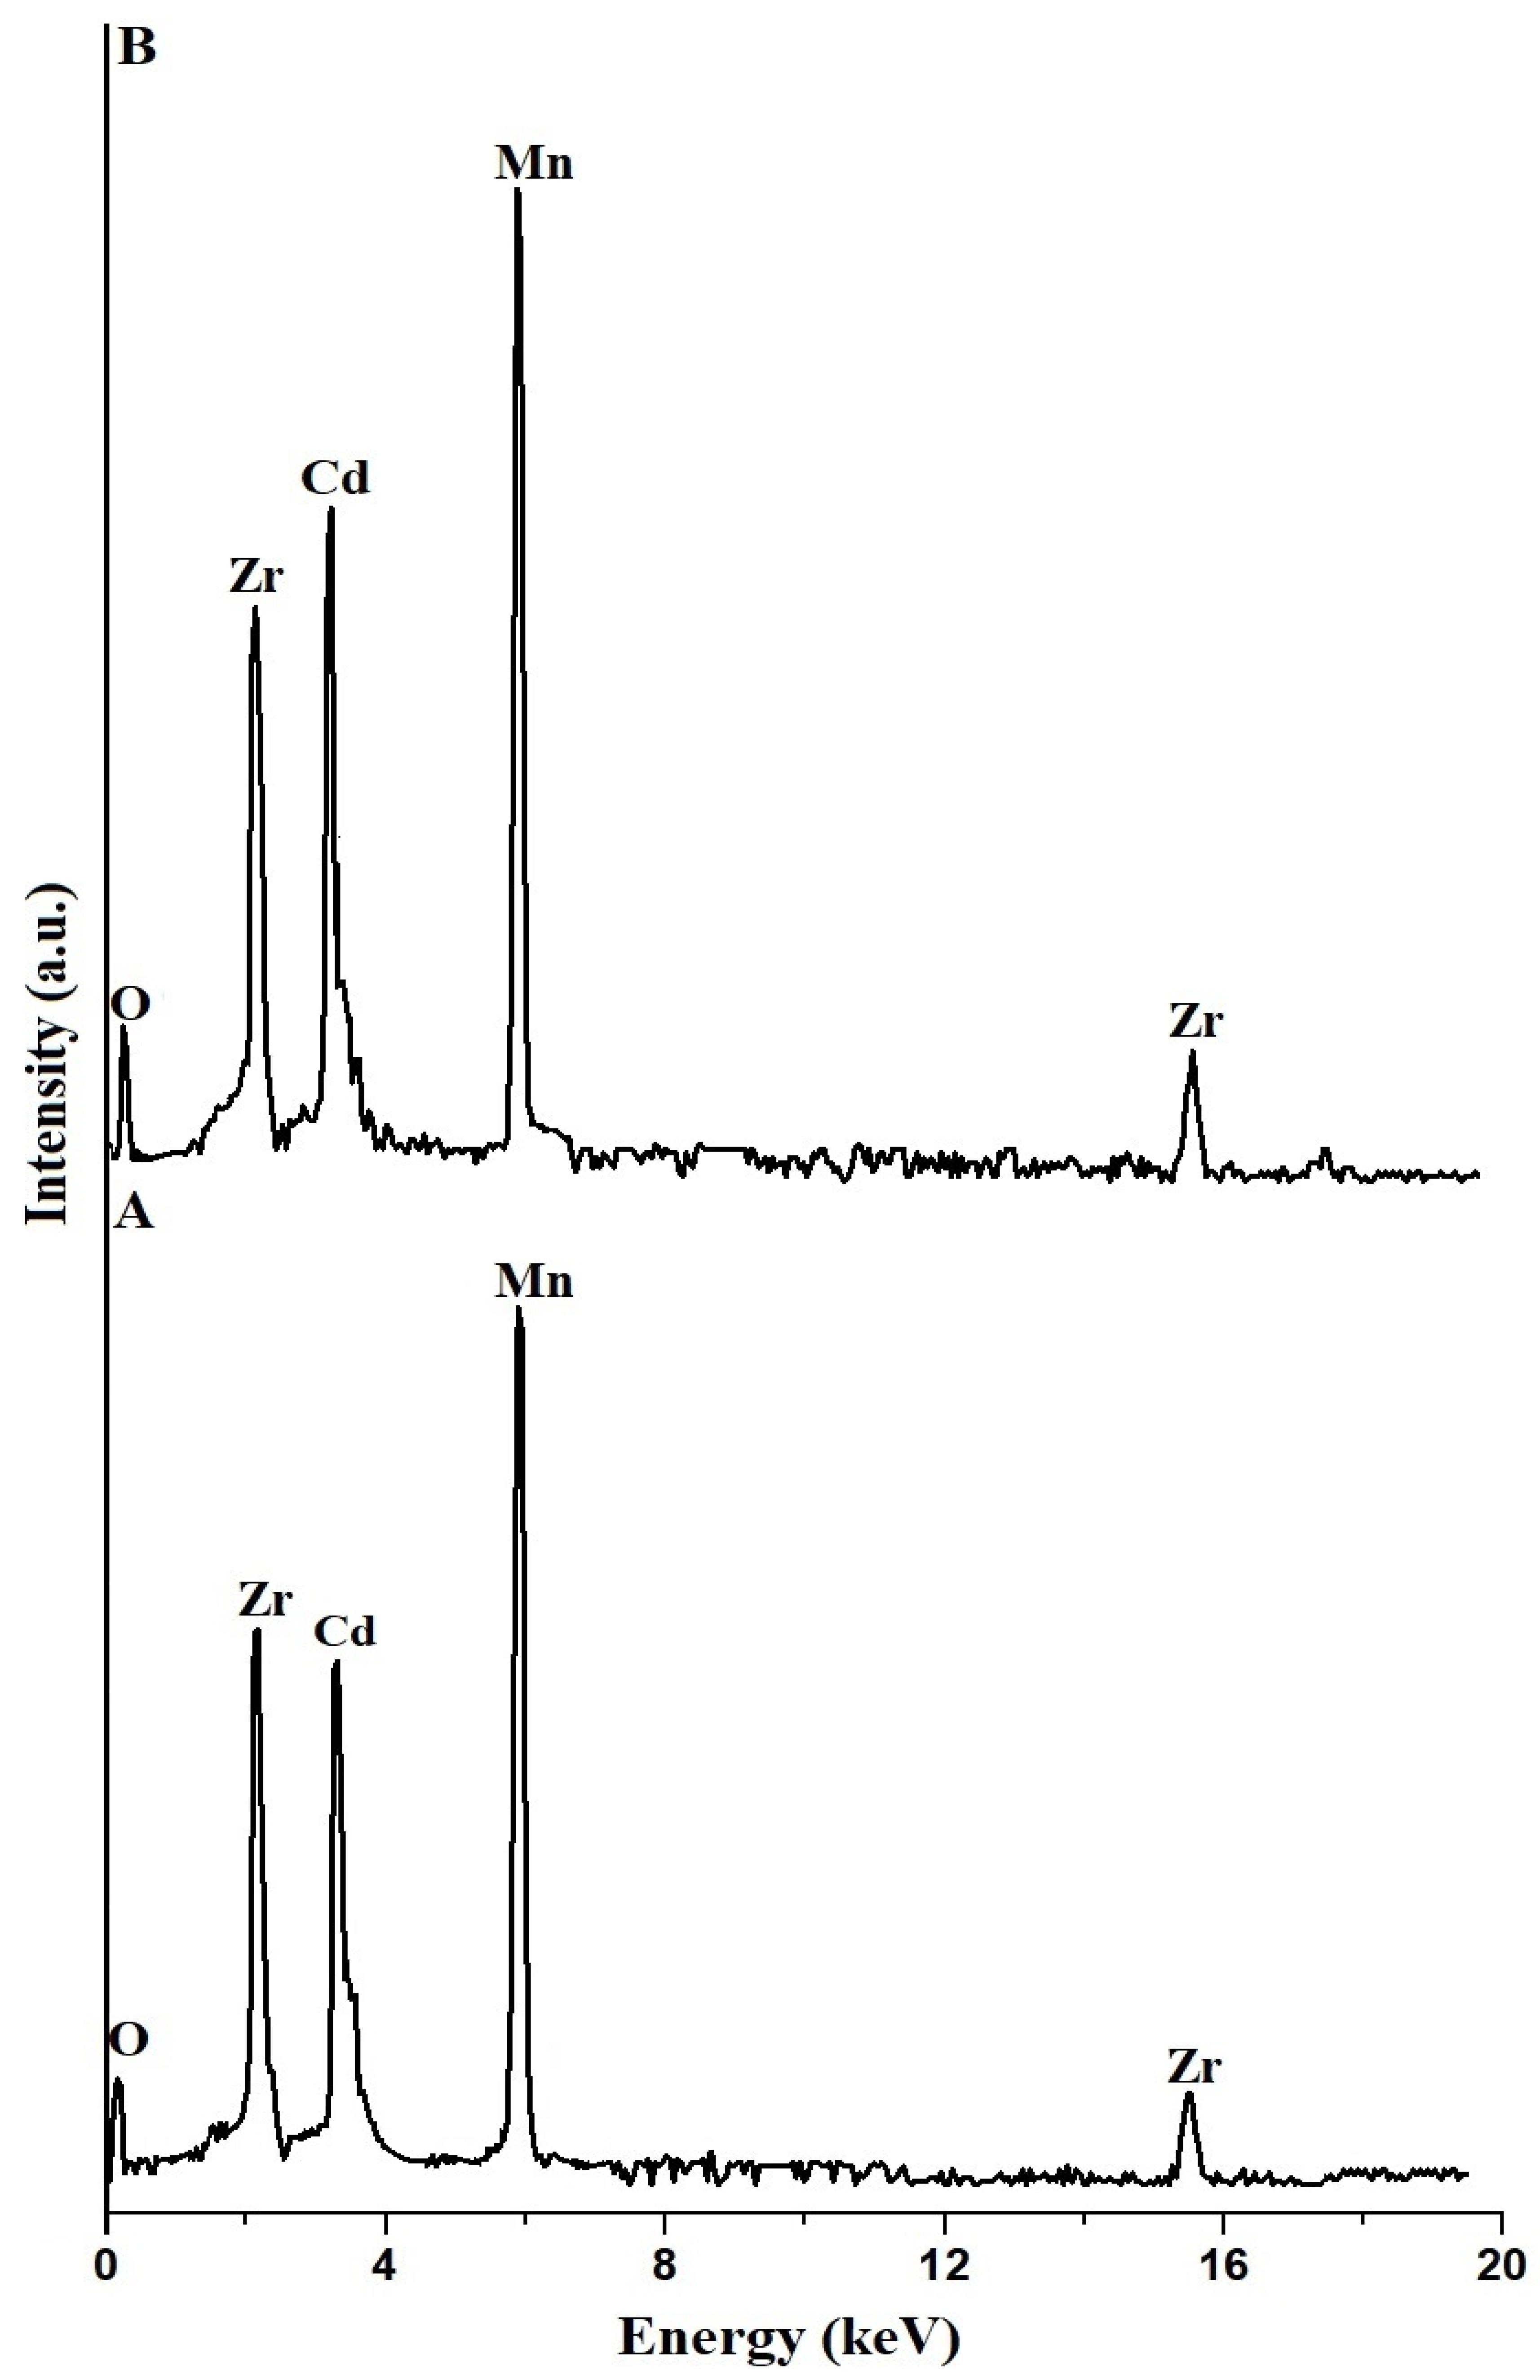
3.1.2. FE-SEM and EDS

Figure 3A,B illustrate the images of FE-SEM for the EK600 and KE800 nanocomposites, respectively. Also, the results showed that the surface of the EK600 sample consists of spherical, polyhedral, and rod shapes with an average grain size of 99.36 nm. In addition, the surface of the EK800 sample consists of polyhedral and spherical shapes with an average grain size of 143.23 nm. The average crystal sizes of nanocomposites obtained from X-ray diffraction (XRD) and scanning electron microscopy (SEM) may not be the same due to the different principles and measurement techniques involved in each method. XRD measures the crystallite size in the bulk material, considering all crystallographic directions. SEM, on the other hand, provides information about the surface morphology, which is often an agglomeration of many particles and hence may not directly correlate to the crystal size obtained from XRD. Figure 4A,B illustrate the patterns of EDS for the EK600 and EK800 nanocomposites, respectively. Also, the results showed that the EK600 and EK800 nanocomposites consist of O, Mn, Cd, and Zr, as shown in Table 1. The absence of peaks for other elements confirms the purity of the synthesized nanocomposites. The mass ratios of O (oxygen), Mn (manganese), Cd (cadmium), and Zr (zirconium) from energy-dispersive X-ray spectroscopy (EDS) analysis are not consistent with the expected compositions of “ZrO2/CdMn2O4/CdO due to sample inhomogeneity and different percentages of each component inside the nanocomposite. The XRD confirmed that the percentages of ZrO2, CdMn2O4, and CdO inside the EK600 nanocomposite are 74.30, 24.20, and 1.5%, respectively. In addition, the XRD confirmed that the percentages of ZrO2, CdMn2O4, and CdO inside the EK800 nanocomposite are 78.00, 18.50, and 3.5%, respectively. If the nanocomposite is not homogeneous, different regions within the sample might have varying elemental compositions. EDS analysis provides local elemental information, and the results may not reflect the overall average composition of the entire nanocomposite.

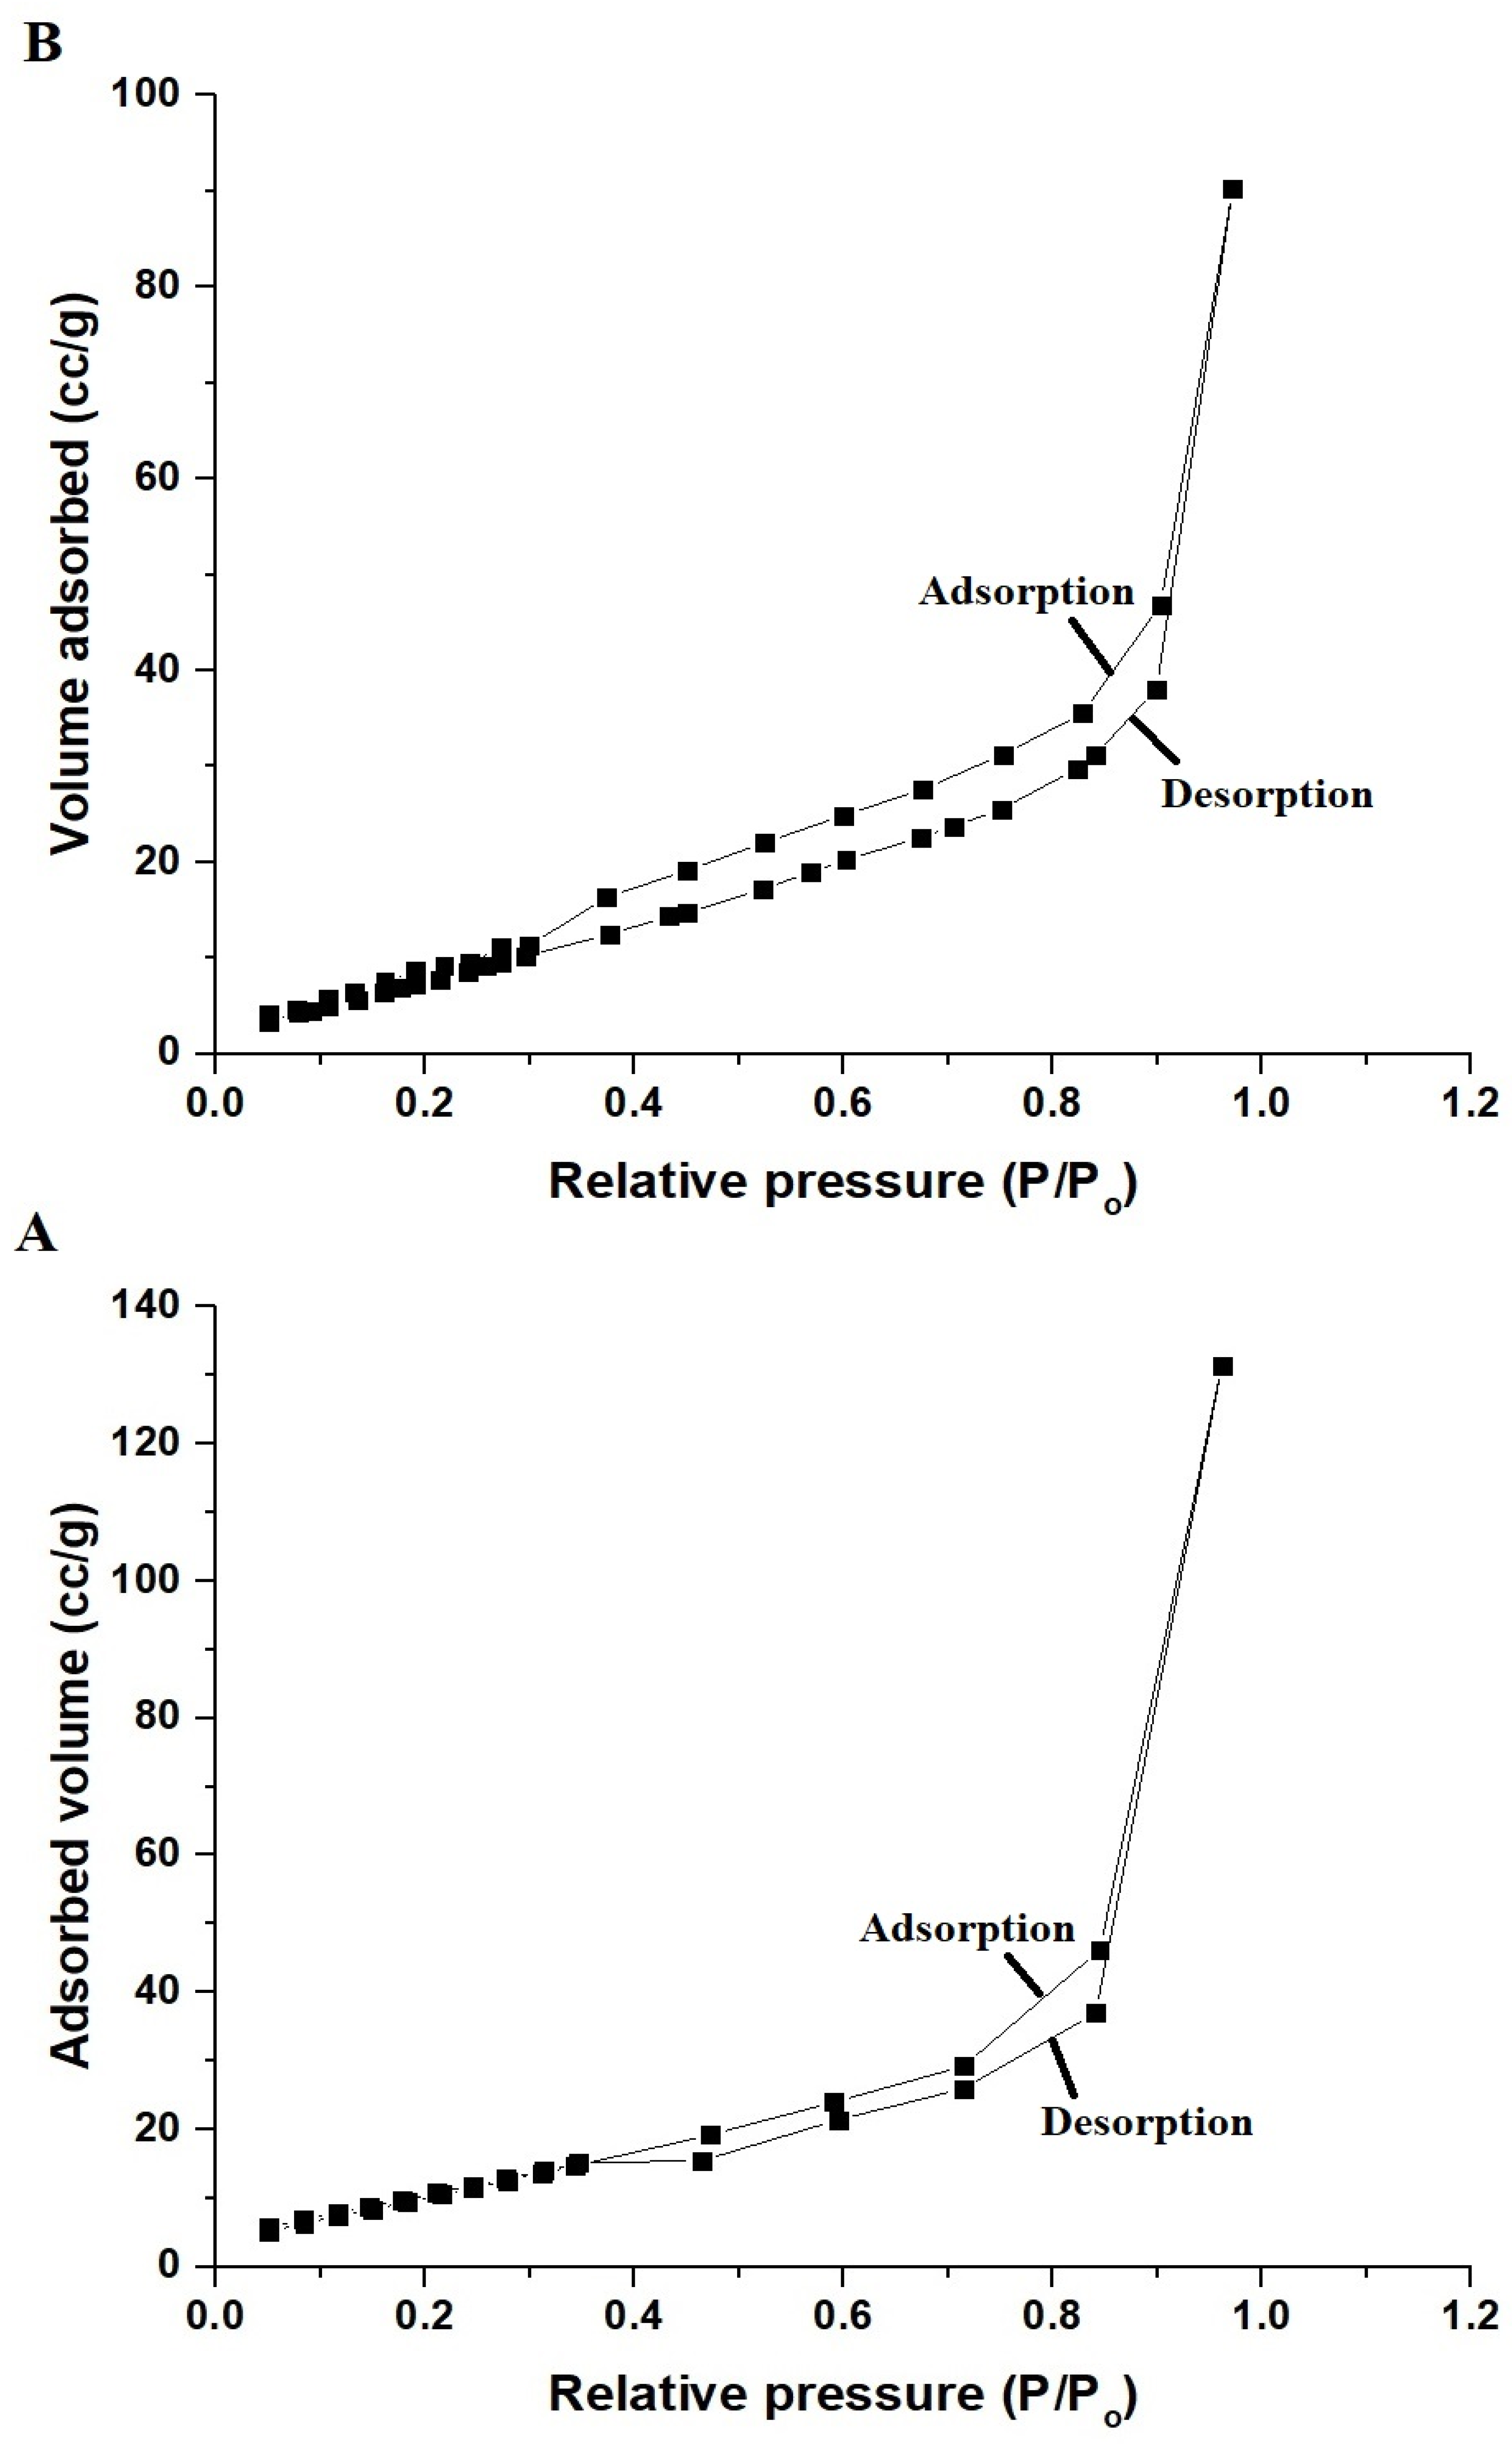
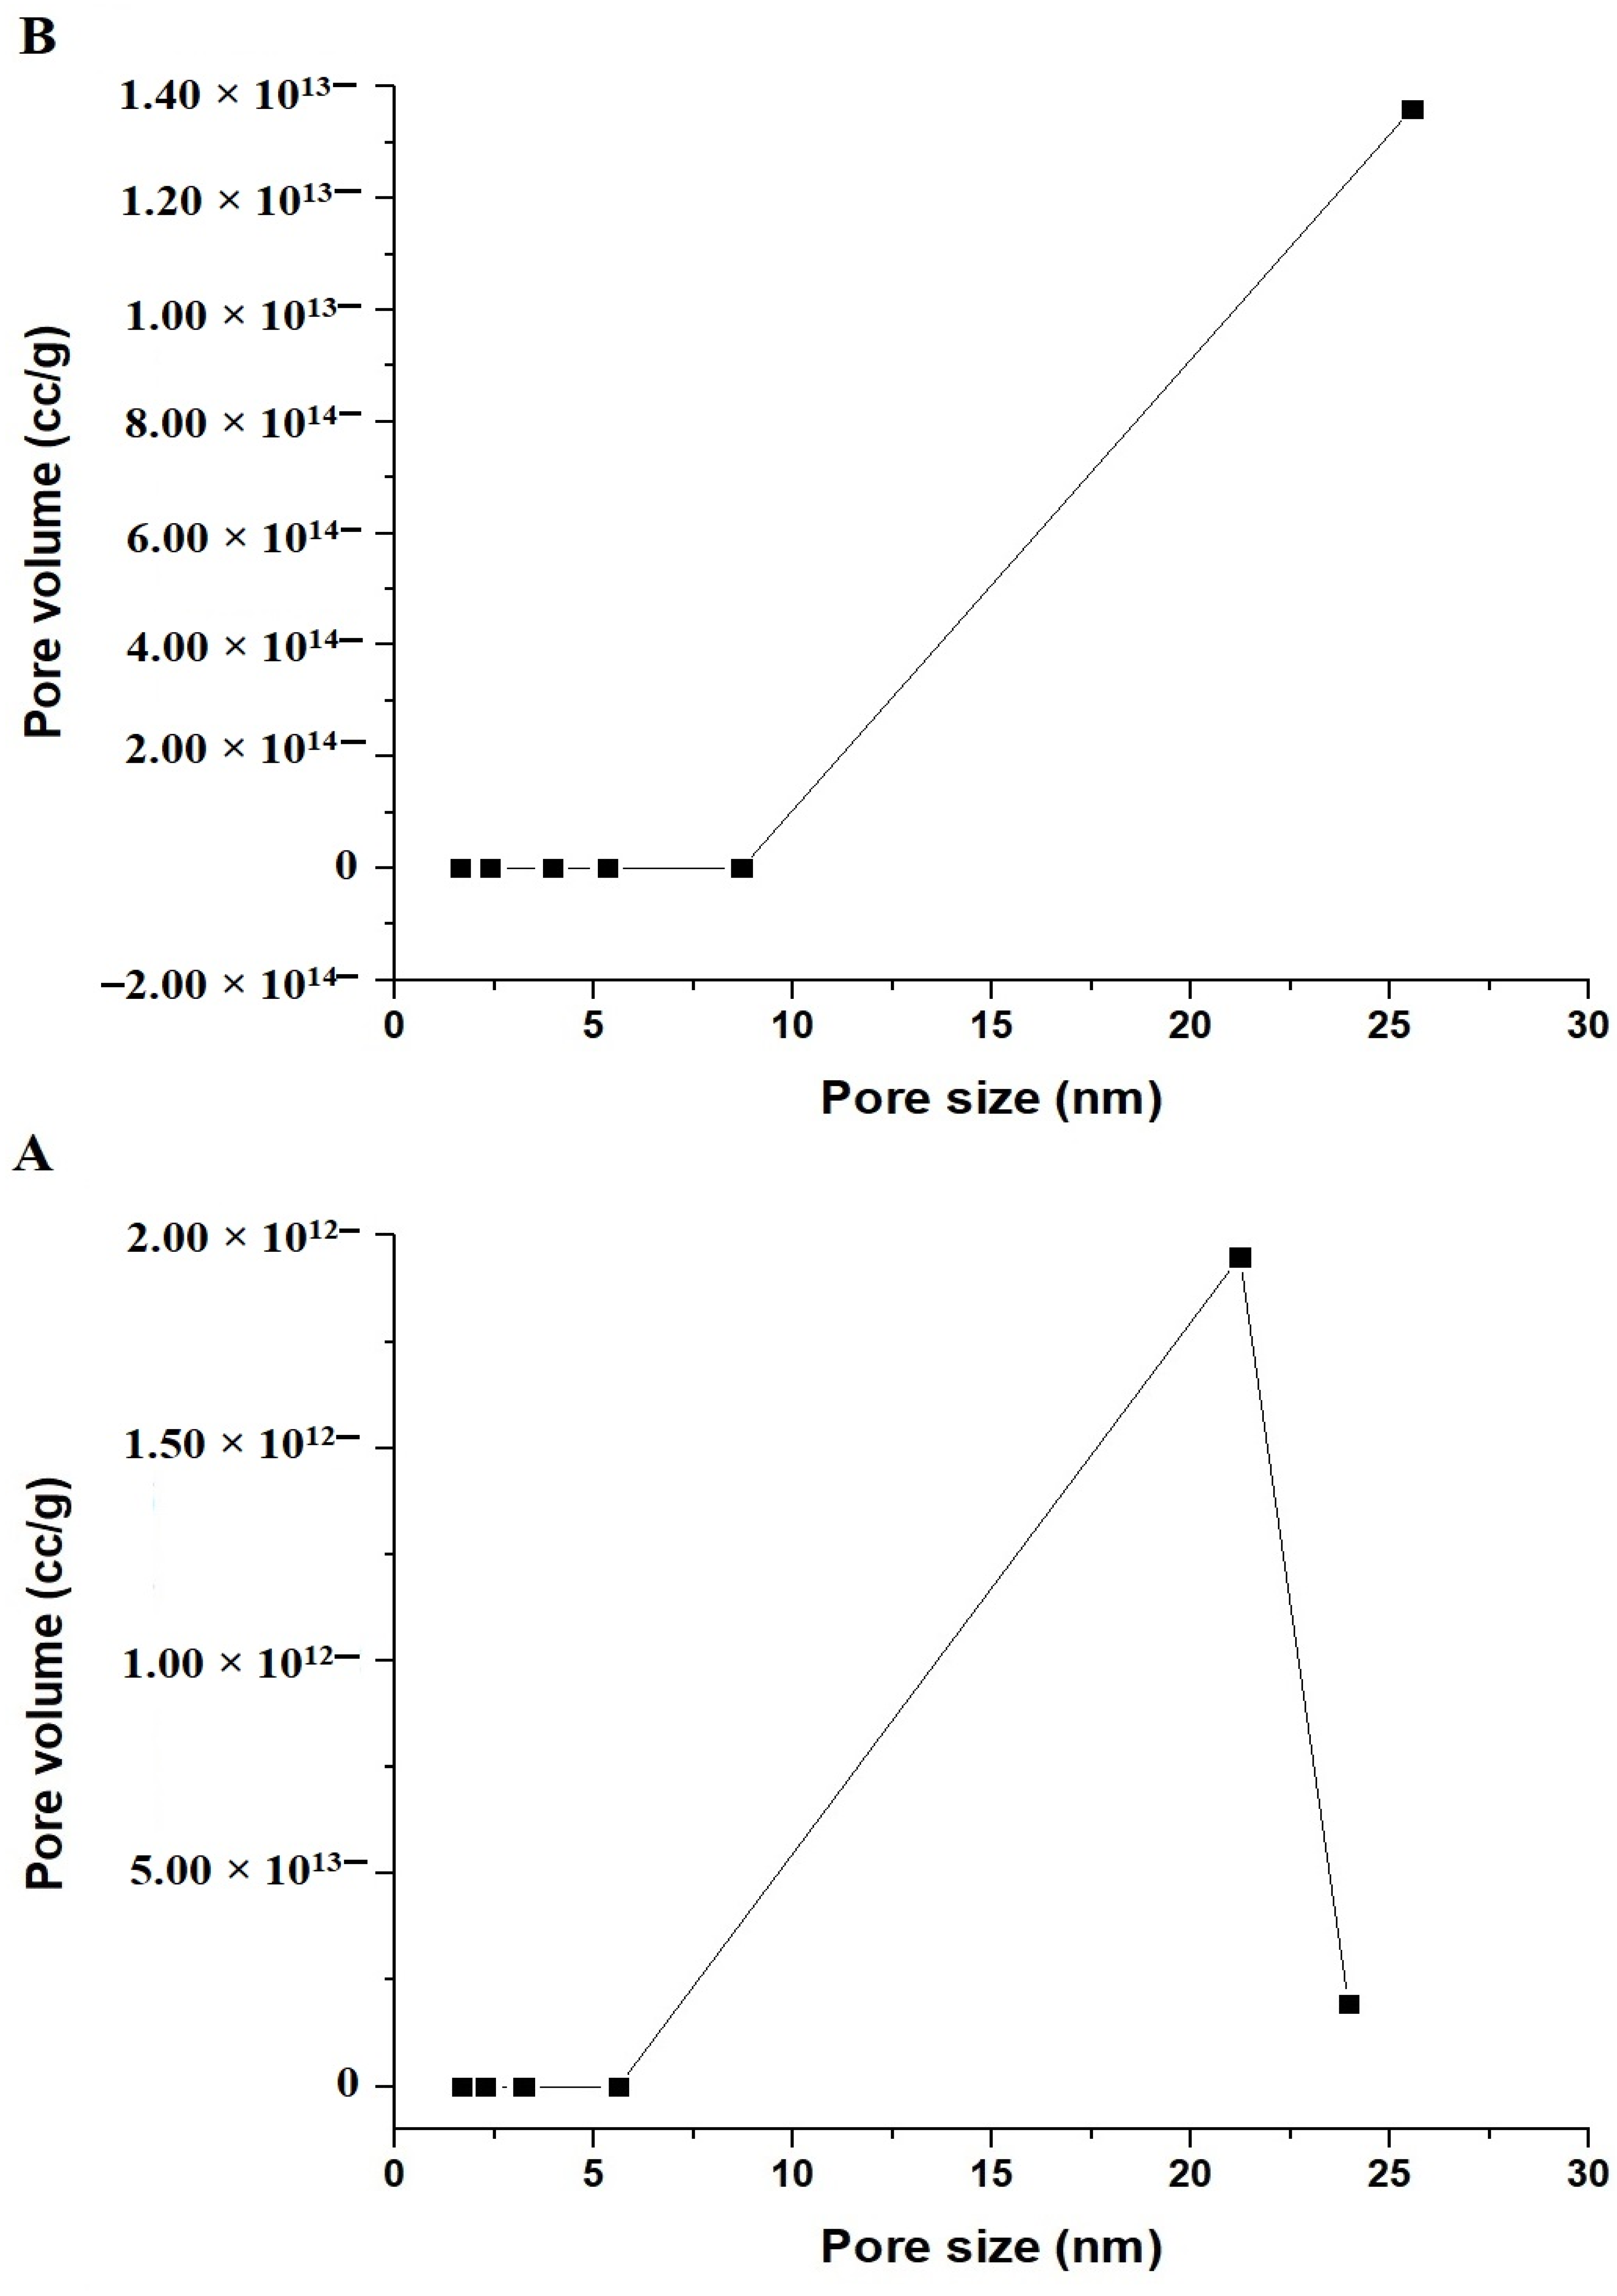
3.1.3. Nitrogen Adsorption/Desorption

Figure 5A,B illustrate the relation between adsorbed volume and relative pressure for the EK600 and EK800 samples, respectively. In addition, Figure 6A,B illustrate the BJH pore size distribution of the EK600 and EK800 nanocomposites, respectively. Additionally, the results showed strongly that the resulting curves follow the IV types, and this confirms their mesoporous nature. The surface textures, such as BET surface area, total pore volume, and average pore size, are clarified in Table 2. The BET surface area of the EK600 nanocomposite is greater than that of the EK800 nanocomposite because of the inverse relationship between crystal size and surface area.

3.2. Removal of Rhodamine 6G and Acid Orange 10 Dyes from Aqueous Solutions
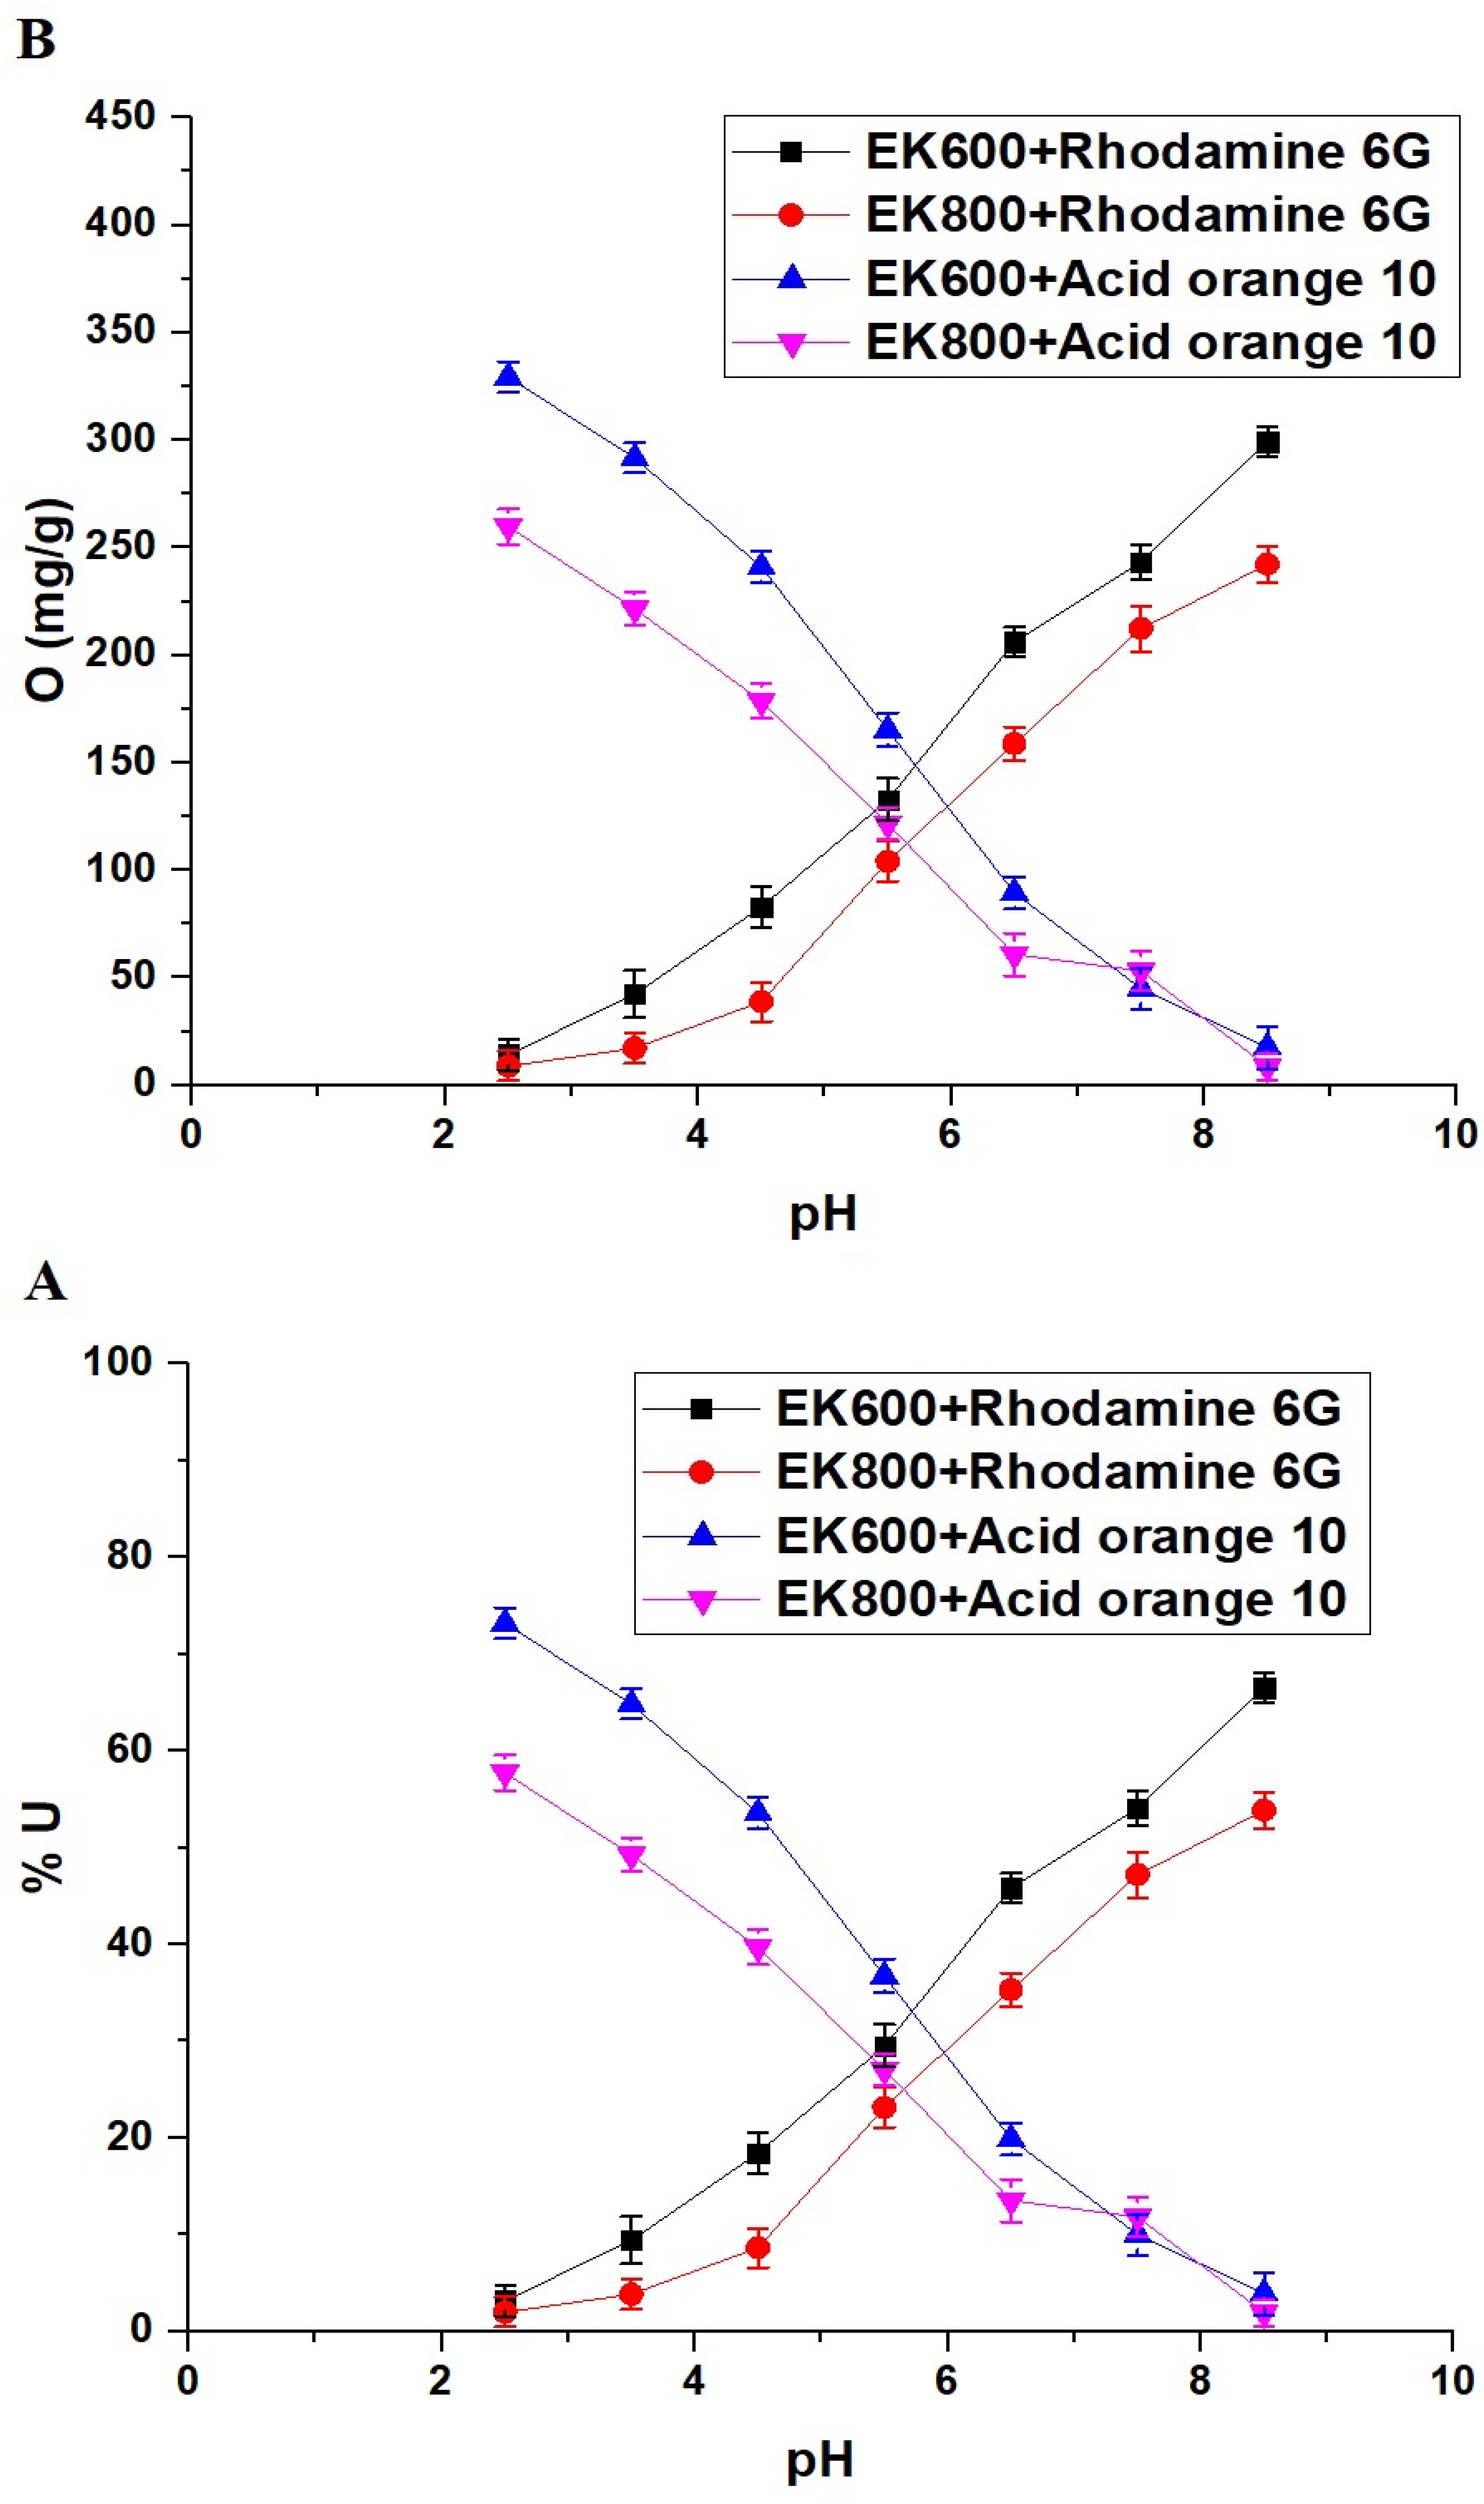
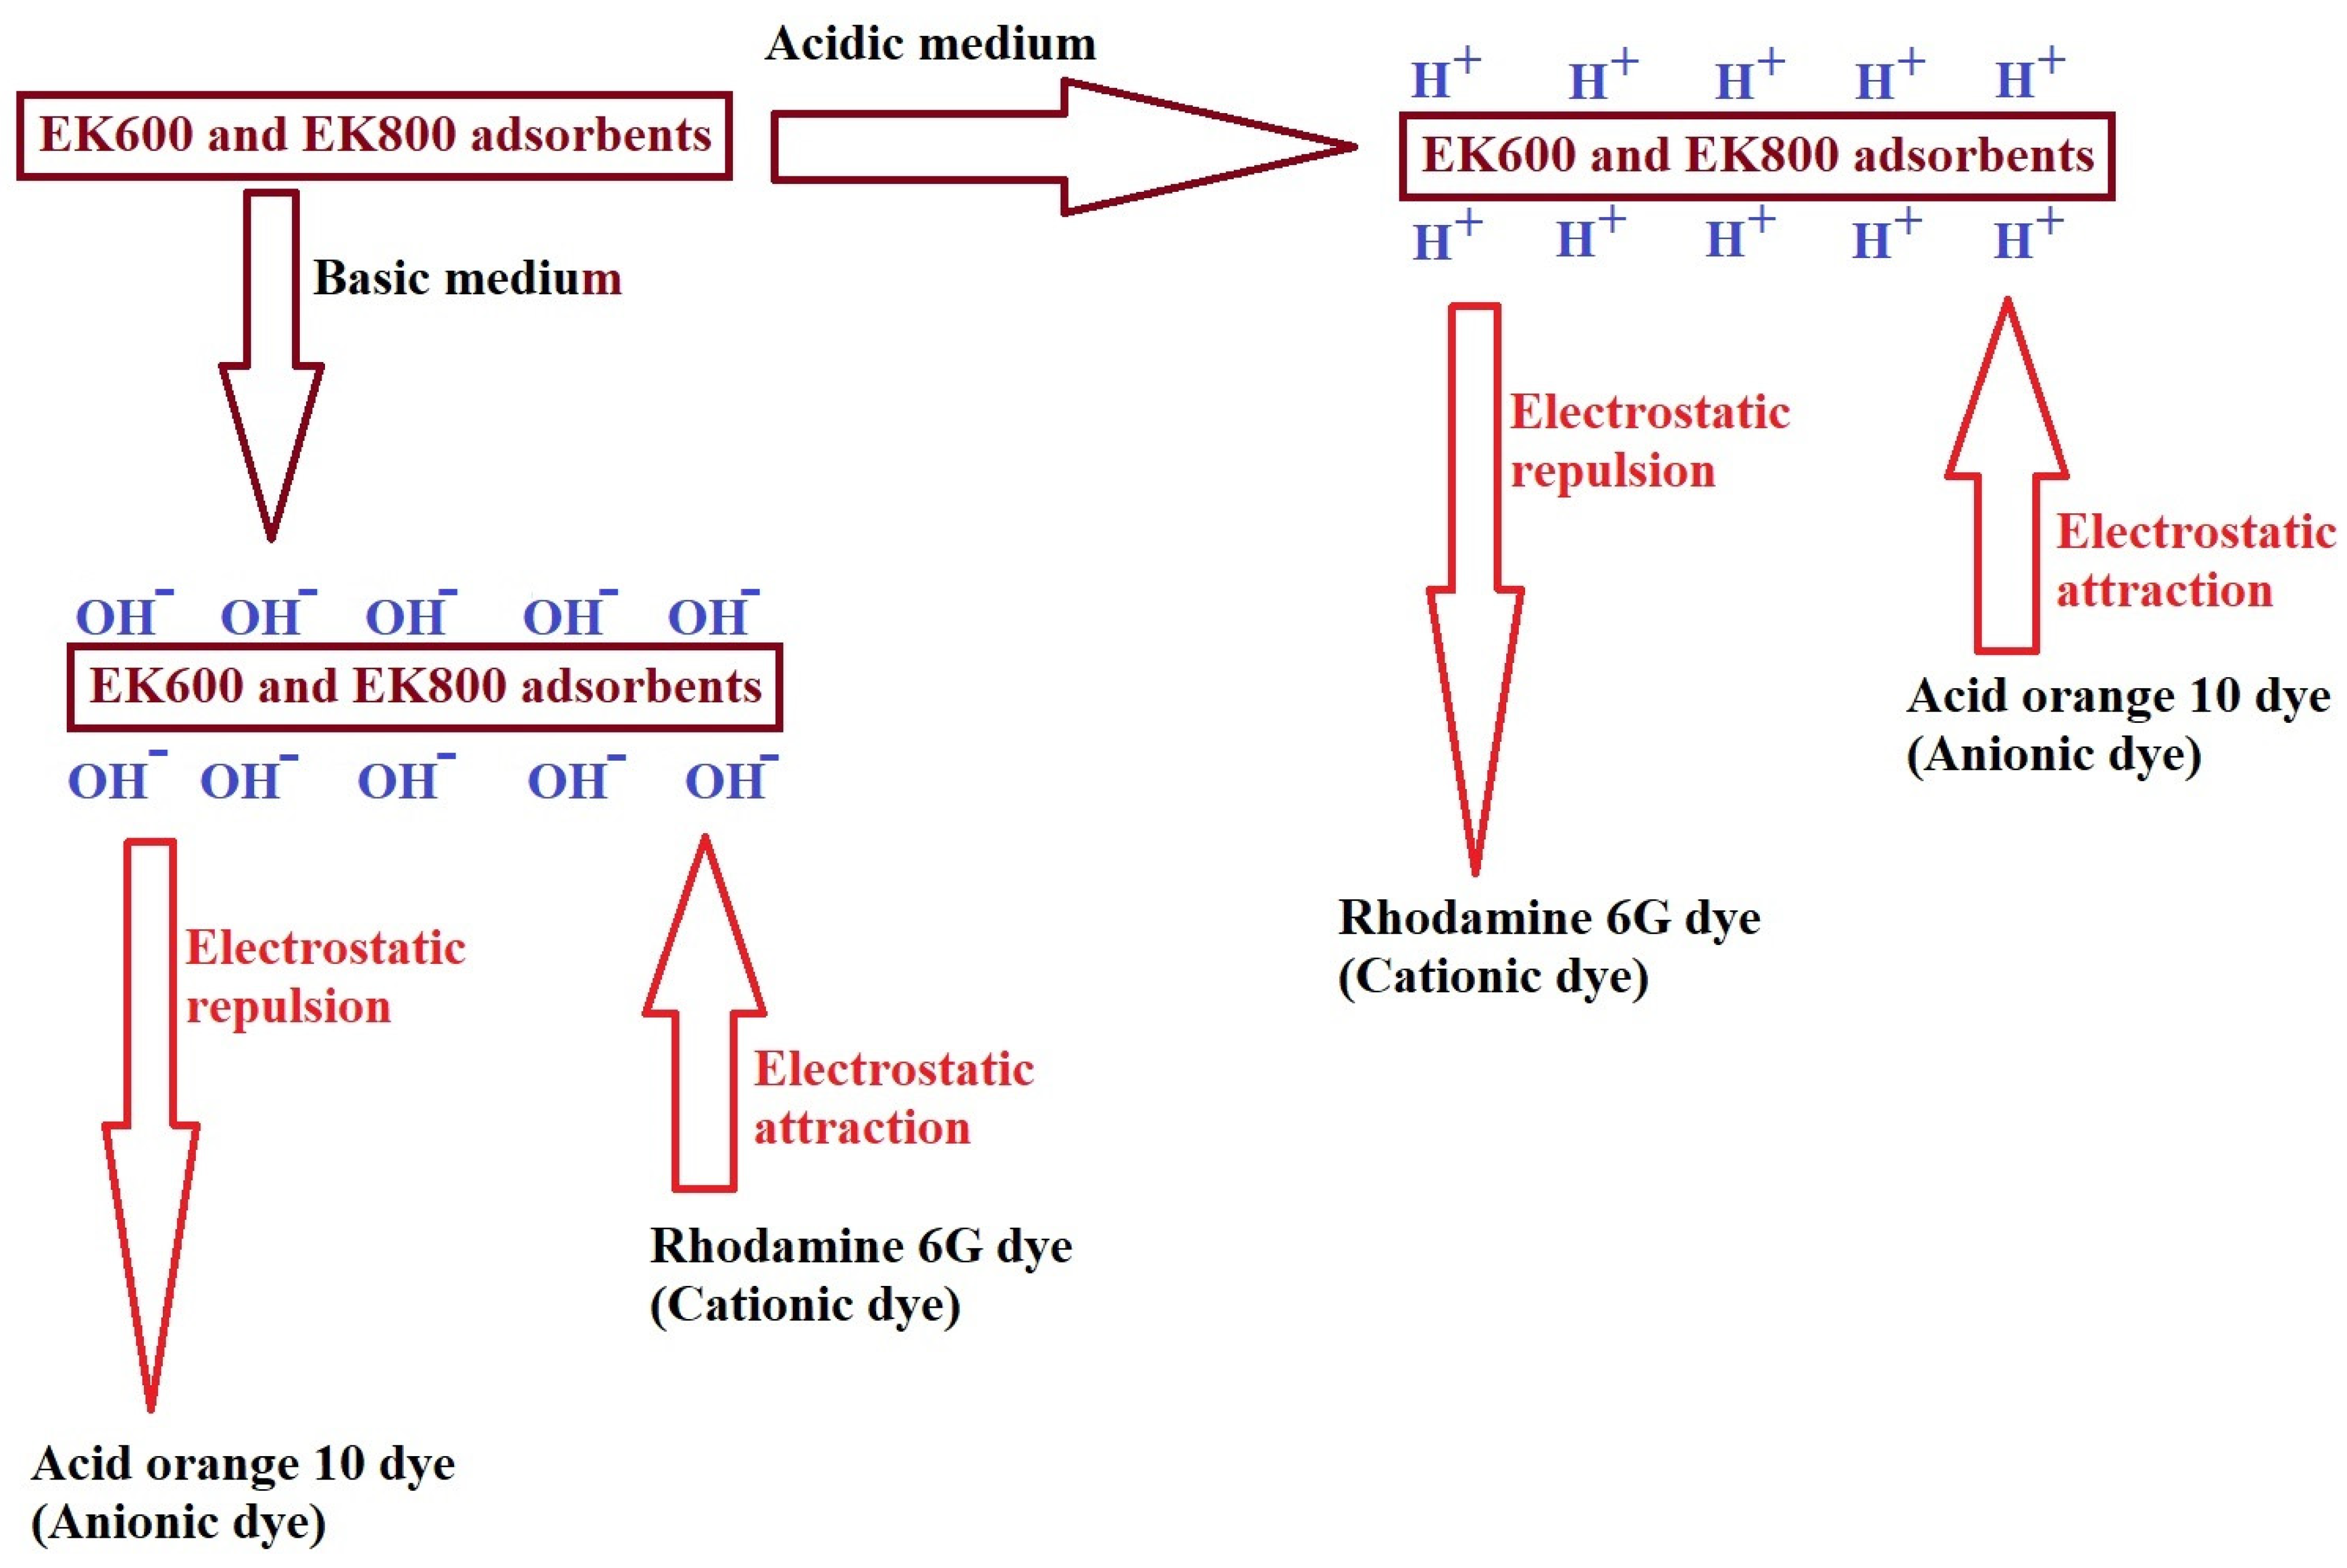
3.2.1. Effect of pH

Figure 7A,B represent the effect of solution pH on the % U of rhodamine 6G and acid orange 10 dyes in addition to the removal capacity of the EK600 and EK800 adsorbents, respectively. In the case of rhodamine 6G dye, it was found that the % U of rhodamine 6G dye and the removal capacity of the EK600 and EK800 adsorbents increased with increasing pH from 2.5 to 8.5. At pH 8.5, the % U of rhodamine 6G dye using EK600 and EK800 adsorbents is 66.53 and 53.85%, respectively. At pH 8.5, the removal capacity of the EK600 and EK800 adsorbents towards rhodamine 6G dye is 299.40 and 242.34 mg/g, respectively. The acidic medium produces positive hydrogen ions that surround the surface of the EK600 and EK800 adsorbents and thus repel the cationic rhodamine 6G dye as shown in Scheme 3, and thus the % U and adsorption capacity decrease [61]. The basic medium produces negative hydroxide ions that surround the surface of the EK600 and EK800 adsorbents and thus attract the cationic rhodamine 6G dye as shown in Scheme 3, and thus the % U and adsorption capacity increase. Hence, the optimum pH value for the removal of rhodamine 6G dye is 8.5. In the case of acid orange 10 dye, it was found that the % U of acid orange 10 dye and the removal capacity of the EK600 and EK800 adsorbents decreased with increasing pH from 2.5 to 8.5. At pH 2.5, the % U of acid orange 10 dye using EK600 and EK800 adsorbents is 73.19 and 57.71%, respectively. At pH 2.5, the removal capacity of the EK600 and EK800 adsorbents towards acid orange 10 dye is 329.34 and 259.71 mg/g, respectively. The acidic medium produces positive hydrogen ions that surround the surface of the EK600 and EK800 adsorbents and thus attract the anionic acid orange 10 dye as shown in Scheme 3, and thus the % U and adsorption capacity increase. The basic medium produces negative hydroxide ions that surround the surface of the EK600 and EK800 adsorbents and thus repel the anionic acid orange 10 dye as shown in Scheme 3, and thus the % U and adsorption capacity decrease [61]. Hence, the optimum pH value for the removal of acid orange 10 dye is 2.5.
To confirm the adsorption mechanism, FE-SEM analysis was performed for the EK600 sample (as an illustrative example) after the adsorption of rhodamine 6G and acid orange 10 dyes, as shown in Figure 8A,B, respectively. In addition, the FE-SEM analysis of the EK600 sample is shown in Figure 3A. Figure 8A,B clearly show the disappearance of the spherical, polyhedral, and rod shapes of the EK600 adsorbent. Additionally, Figure 8A,B clearly show the aggregation of rhodamine 6G and acid orange 10 dyes on the surface of EK600 adsorbent, and this indicates that rhodamine 6G and acid orange 10 dyes were successfully adsorbed on the surface of EK600 adsorbent.
Moreover, the inductively coupled plasma (ICP) elucidated that there is no ion leaching from the synthesized EK600 and EK800 nanocomposites in the filtrate during the adsorption processes. Hence, the synthesized nanocomposites are considered safe and can be utilized in water treatment.

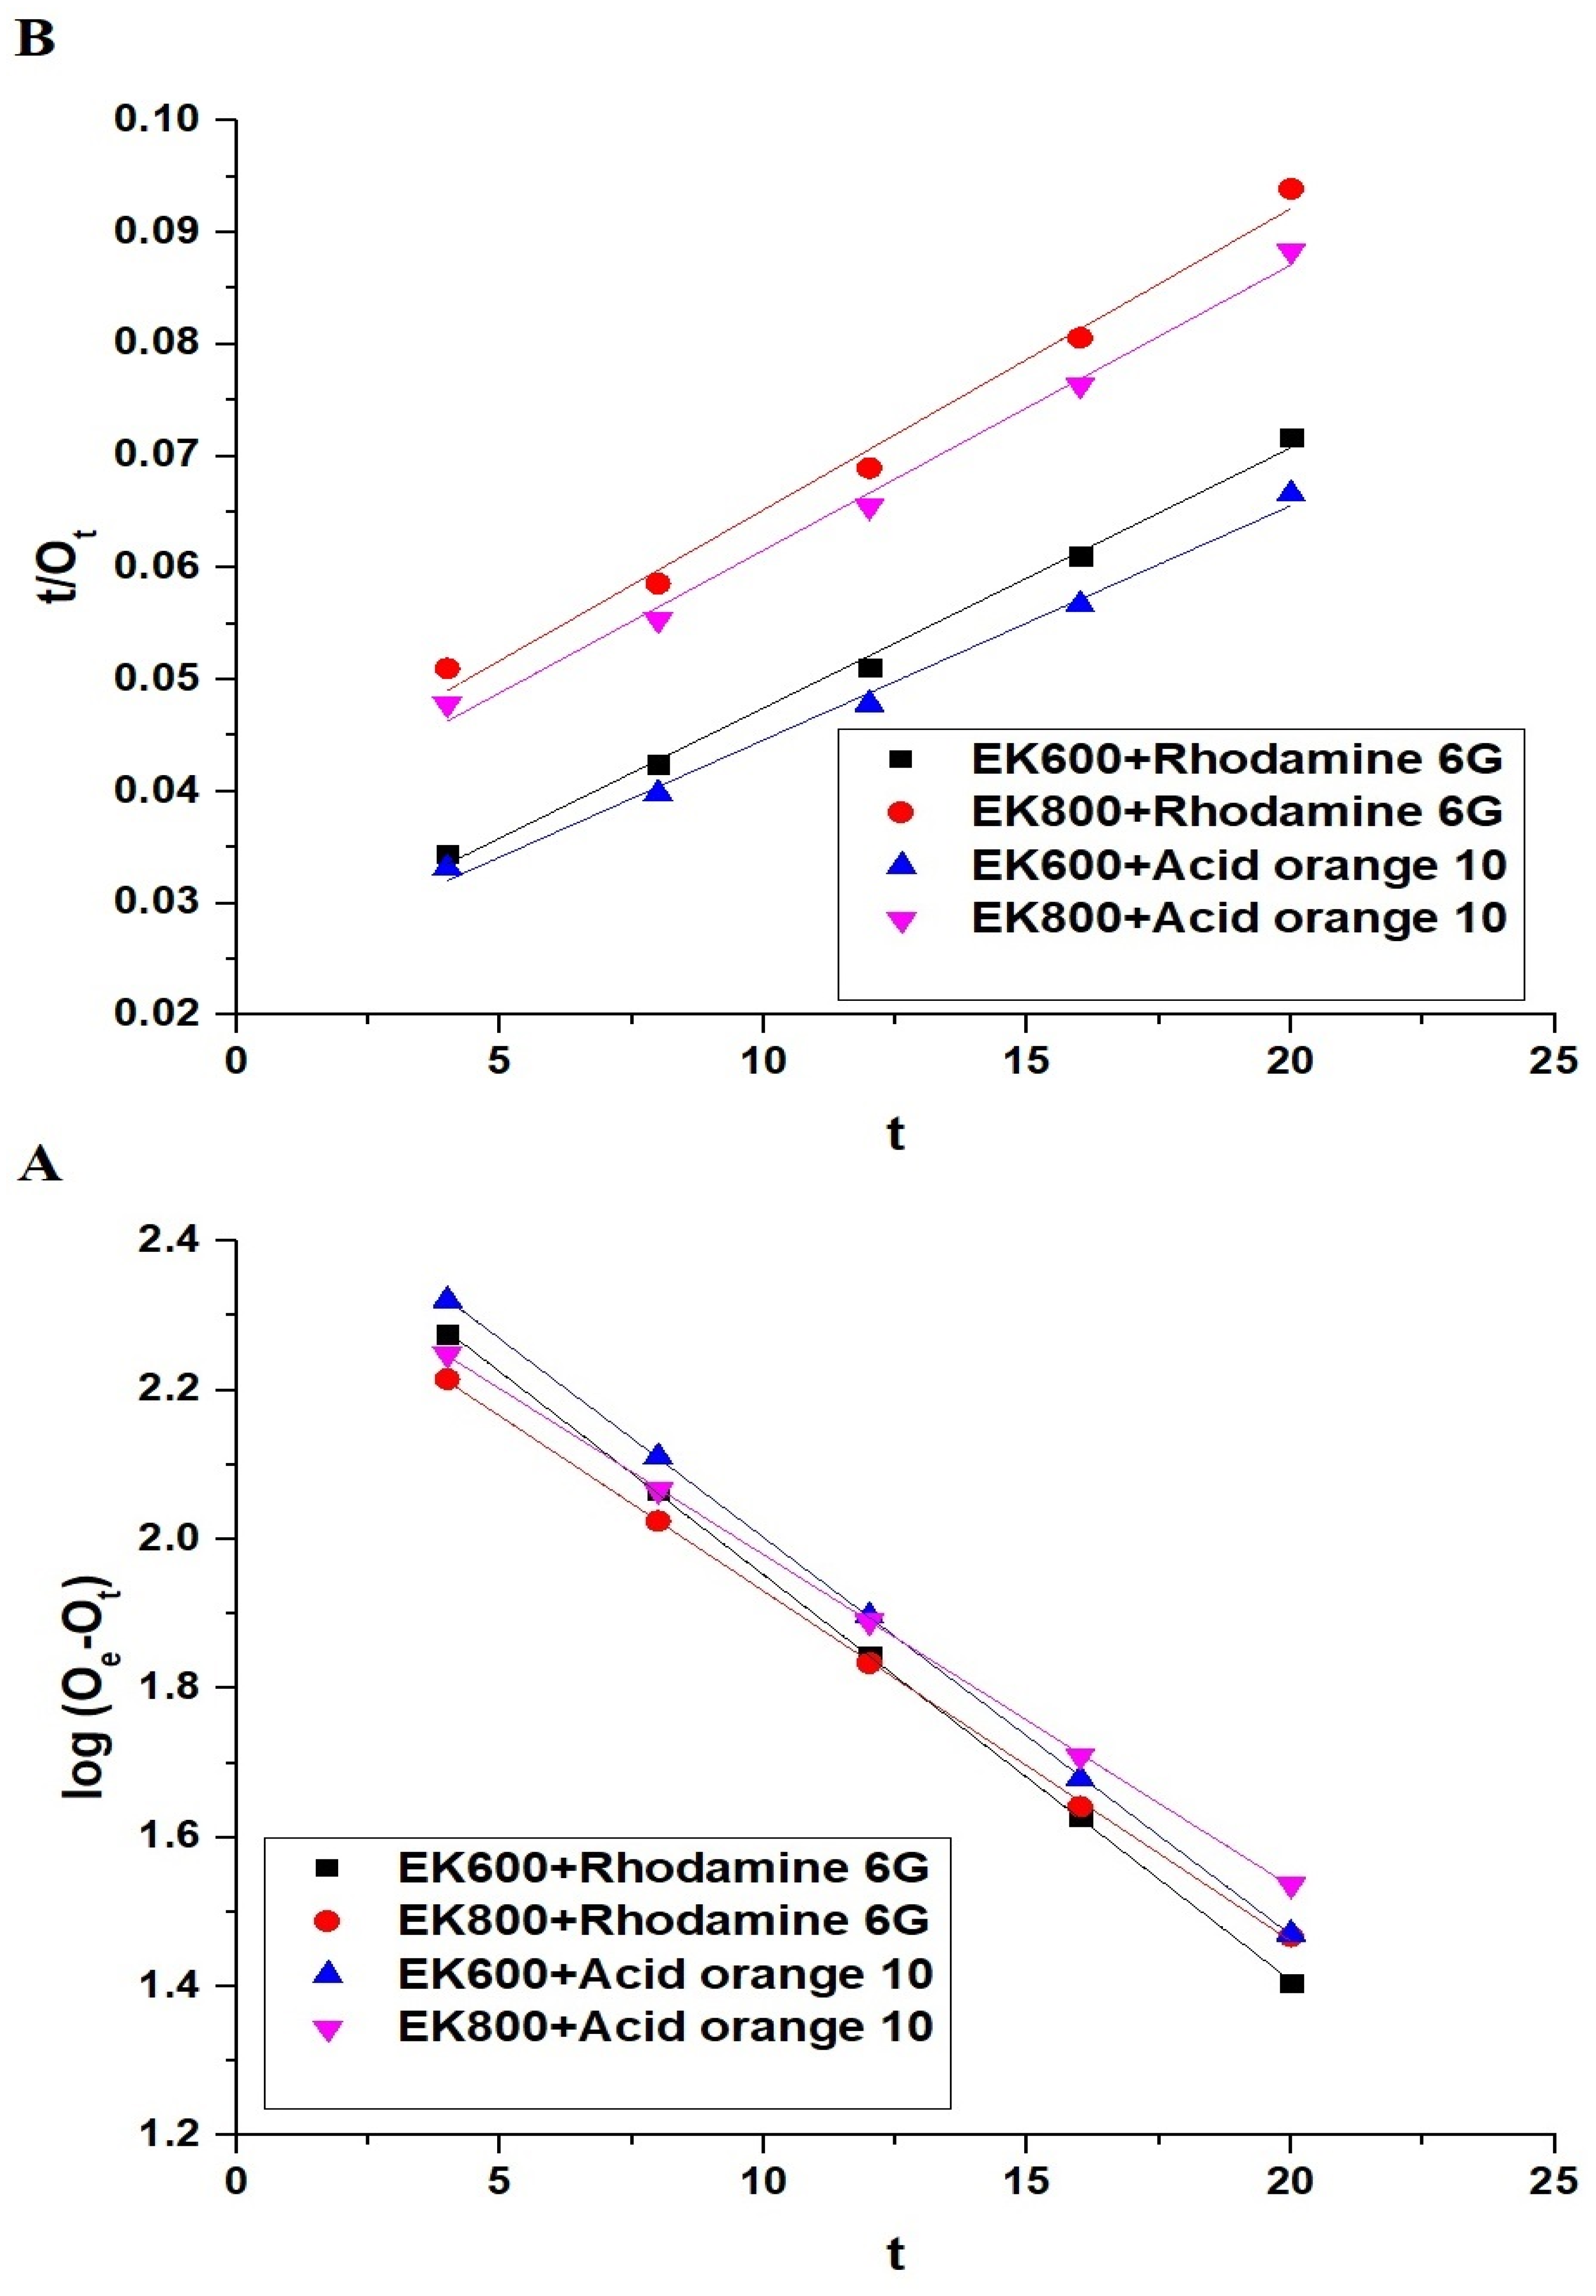
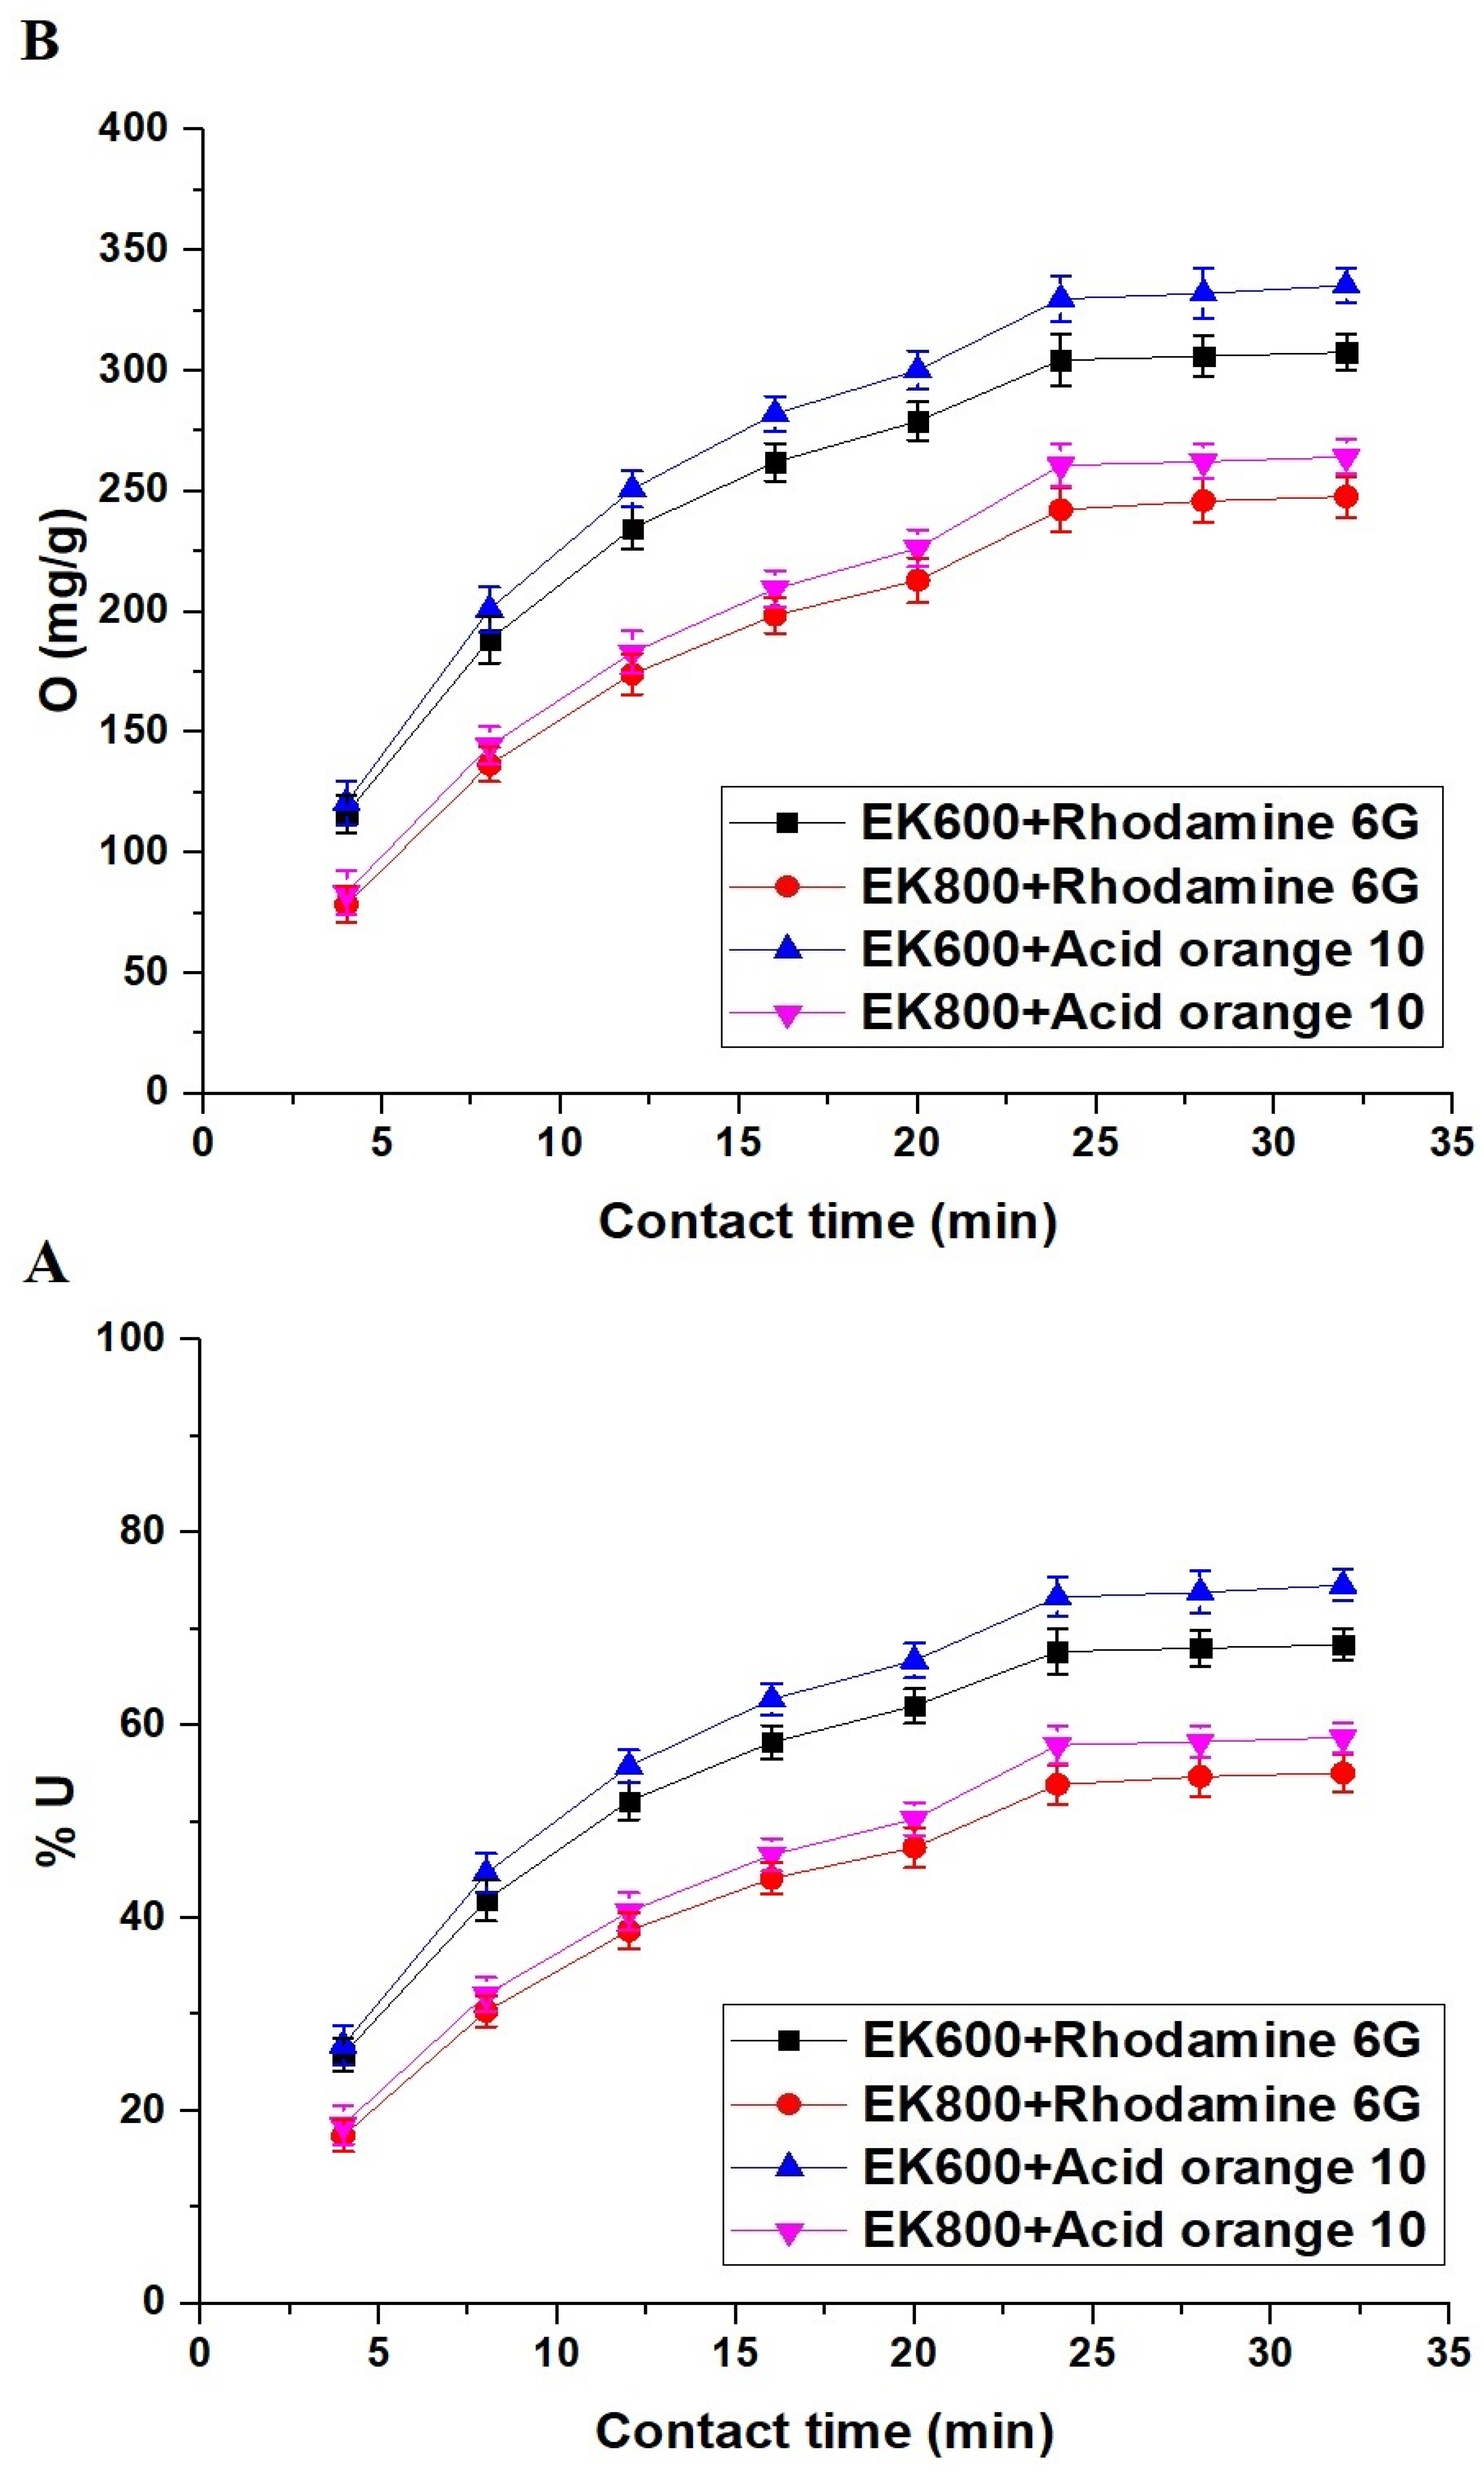
3.2.2. Effect of Contact Time

Figure 9A,B represent the effect of contact time on the % U of rhodamine 6G and acid orange 10 dyes in addition to the removal capacity of the EK600 and EK800 adsorbents, respectively. In addition, the results exhibited that the % U of rhodamine 6G and acid orange 10 dyes, in addition to the removal capacity of the EK600 and EK800 adsorbents, increased when increasing the contact time from 4 to 24 min. In addition, the % U of rhodamine 6G and acid orange 10 dyes, in addition to the removal capacity of the EK600 and EK800 adsorbents, were almost constant when increasing the contact time from 24 to 32 min as a result of the fullness saturation of active sites. A sudden increase in the adsorption percentage when increasing the contact time from 20 min to 25 min is due to the activation of adsorption sites of the adsorbent, which is a mixture of several metal oxides. Adsorption typically occurs on the surface of the adsorbent material, which contains specific sites where adsorption can take place. If these adsorption sites are not immediately available for interaction with the adsorbate, the adsorption rate may initially be slow. However, with increasing contact time, these sites may become activated or exposed, leading to a sudden increase in the adsorption percentage.
The % U of rhodamine 6G dye by the EK600 and EK800 adsorbents after 24 min is 67.67 and 53.85%, respectively. Additionally, the removal capacity of the EK600 and EK800 adsorbents towards rhodamine 6G dye after 24 min is 304.50 and 242.34 mg/g, respectively. In addition, the % U of acid orange 10 dye by the EK600 and EK800 adsorbents after 24 min is 73.30 and 57.95%, respectively. Additionally, the removal capacity of the EK600 and EK800 adsorbents towards acid orange 10 dye after 24 min is 329.85 and 260.76 mg/g, respectively.
The pseudo-first-order (Equation (3)), in addition to the pseudo-second-order (Equation (4)), kinetic equations [61], were used to examine the linear fitting of the obtained experimental data due to the removal of rhodamine 6G and acid orange 10 dyes by the EK600 and EK800 adsorbents, as shown in Figure 10A,B, respectively.
log O e O t = l o g O e k 1 2.303 t
t O t = 1 k 2 O e 2 + 1 O e t
k1 represents the pseudo-first-order rate constant (1/min), Ot represents the amount of rhodamine 6G or acid orange 10 dye adsorbed at time t (mg/g), k2 represents the pseudo-second-order rate constant (g/mg.min), and Oe represents the quantity of rhodamine 6G or acid orange 10 dye adsorbed at equilibrium (mg/g). Table 3 displays the resultant constants and correlation coefficients (R2). Moreover, the removal of rhodamine 6G and acid orange 10 dyes by the EK600 and EK800 adsorbents follows the pseudo-first order owing to the following reasons: (1) The R2 values of the pseudo-first order are greater than the R2 values of pseudo-second order. (2) The calculated Oe values of the pseudo-first order are very close to the experimental Oe.

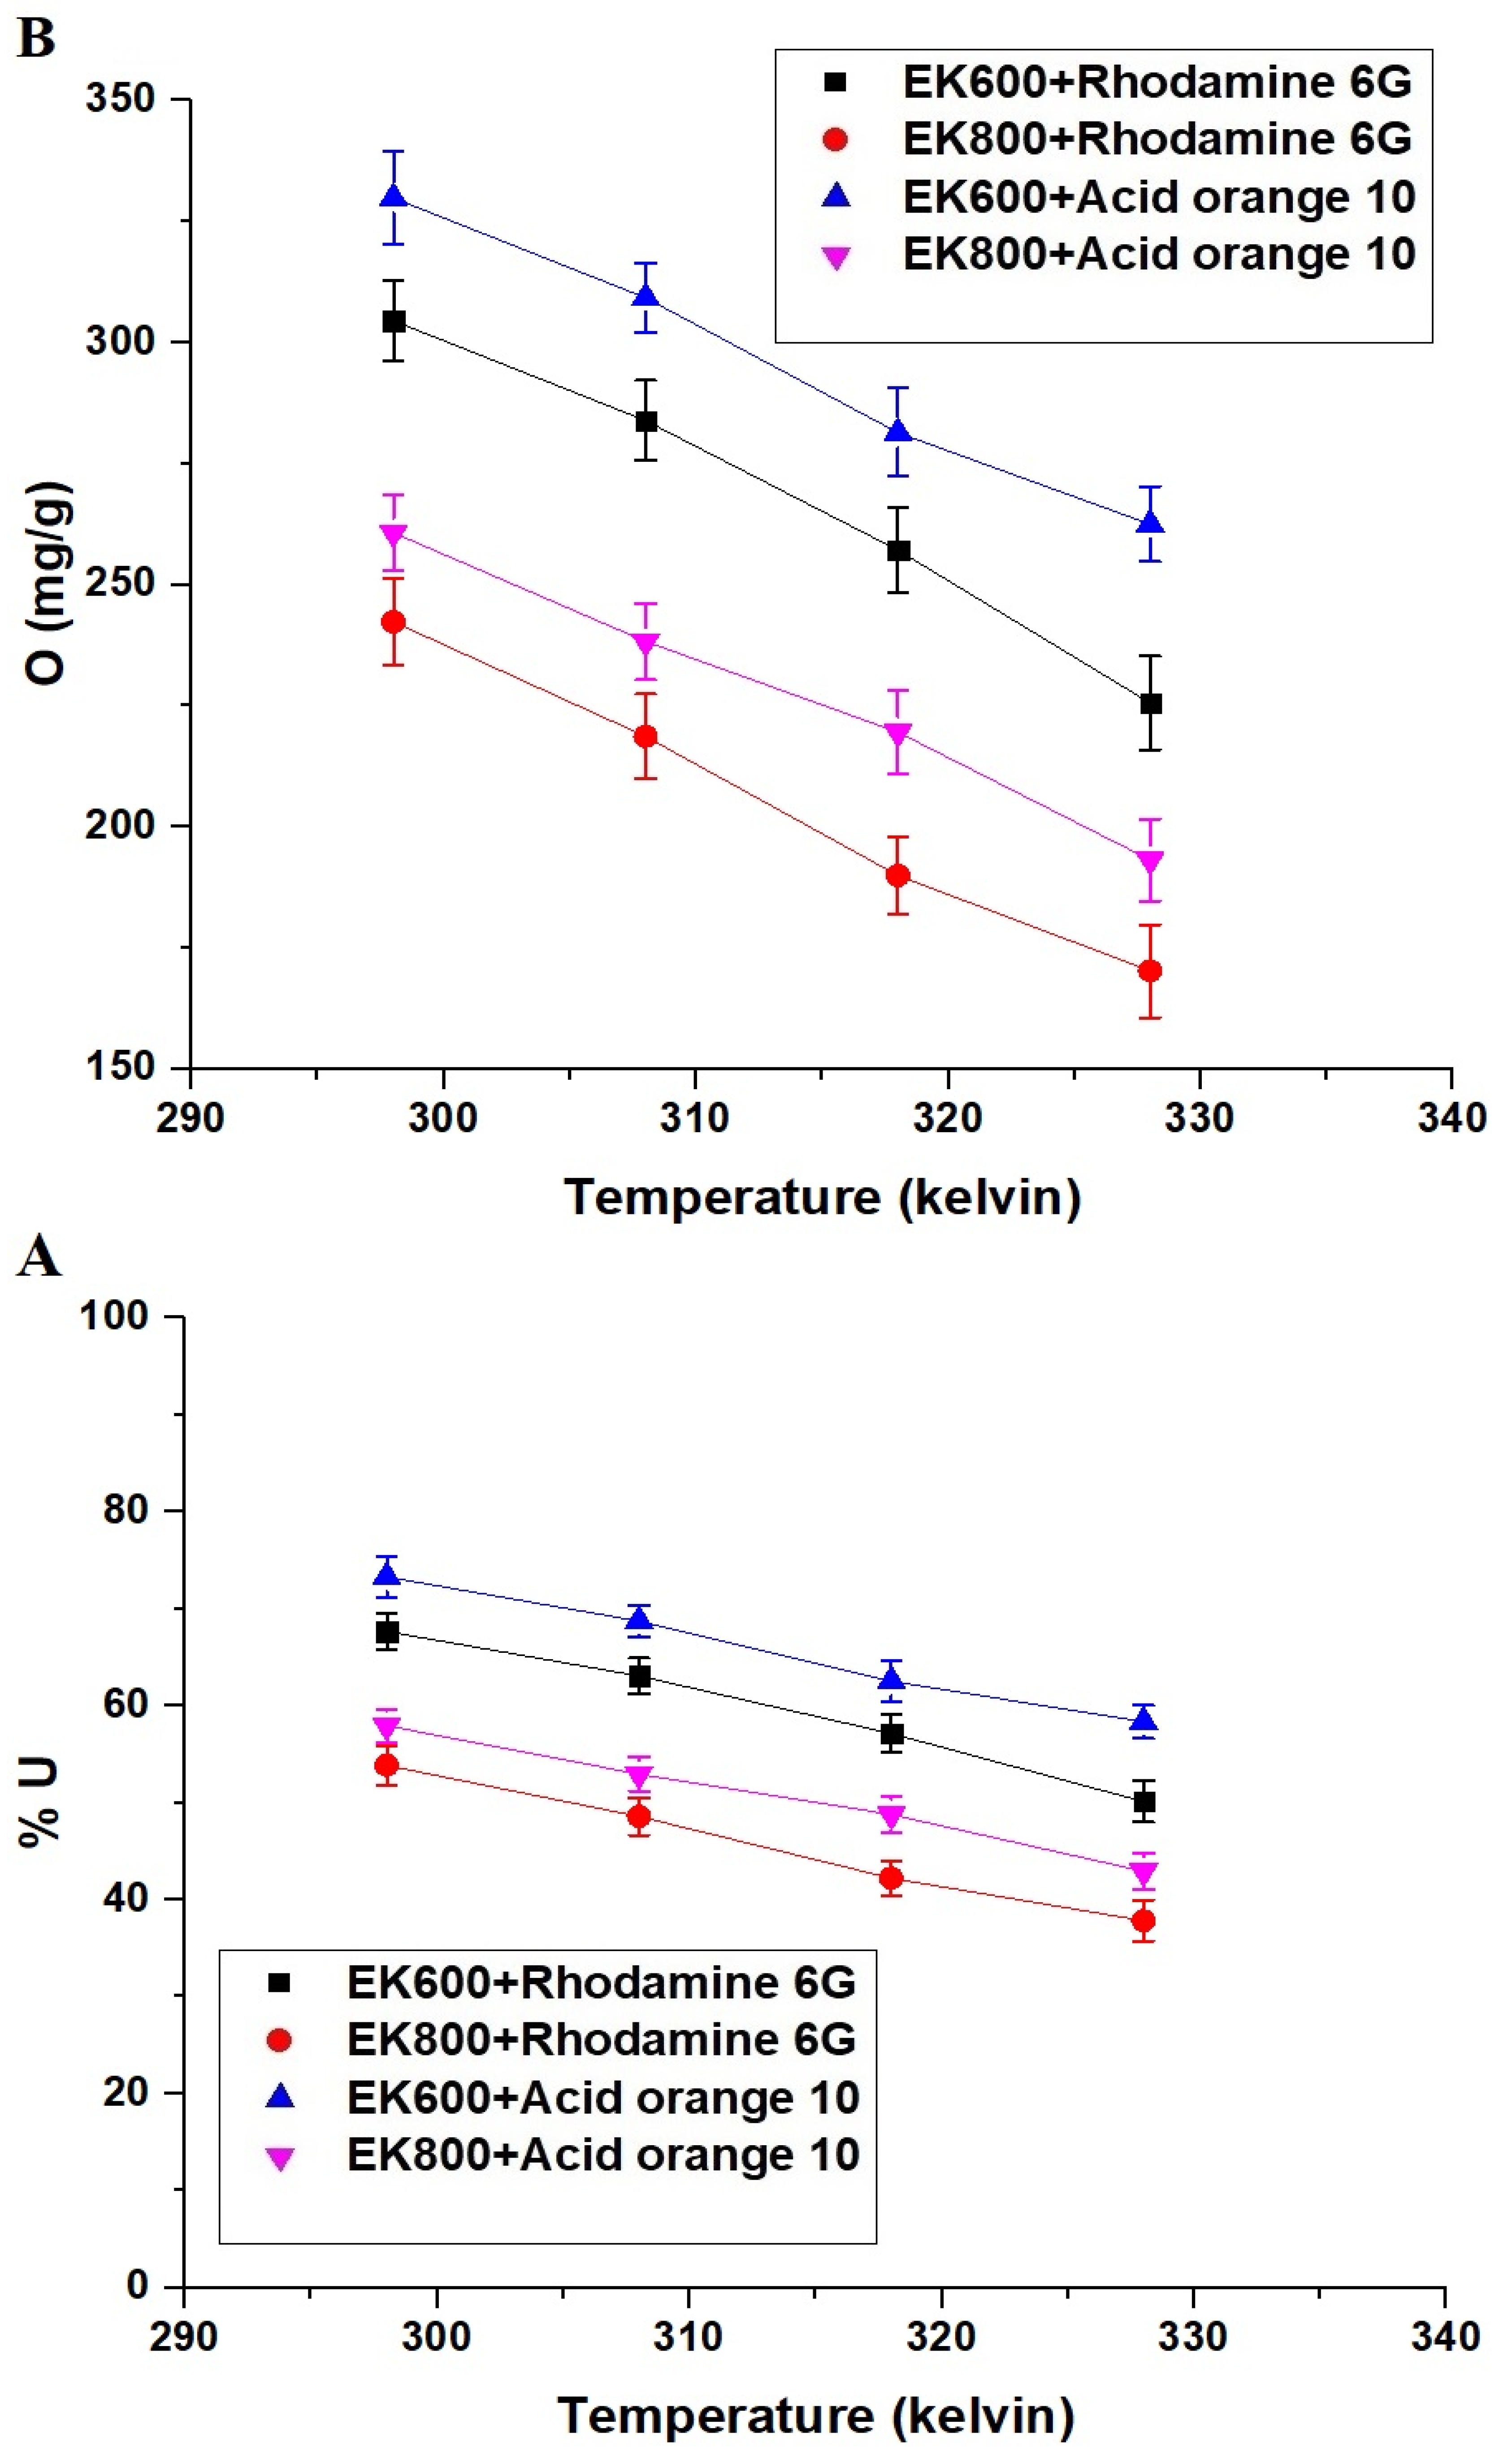
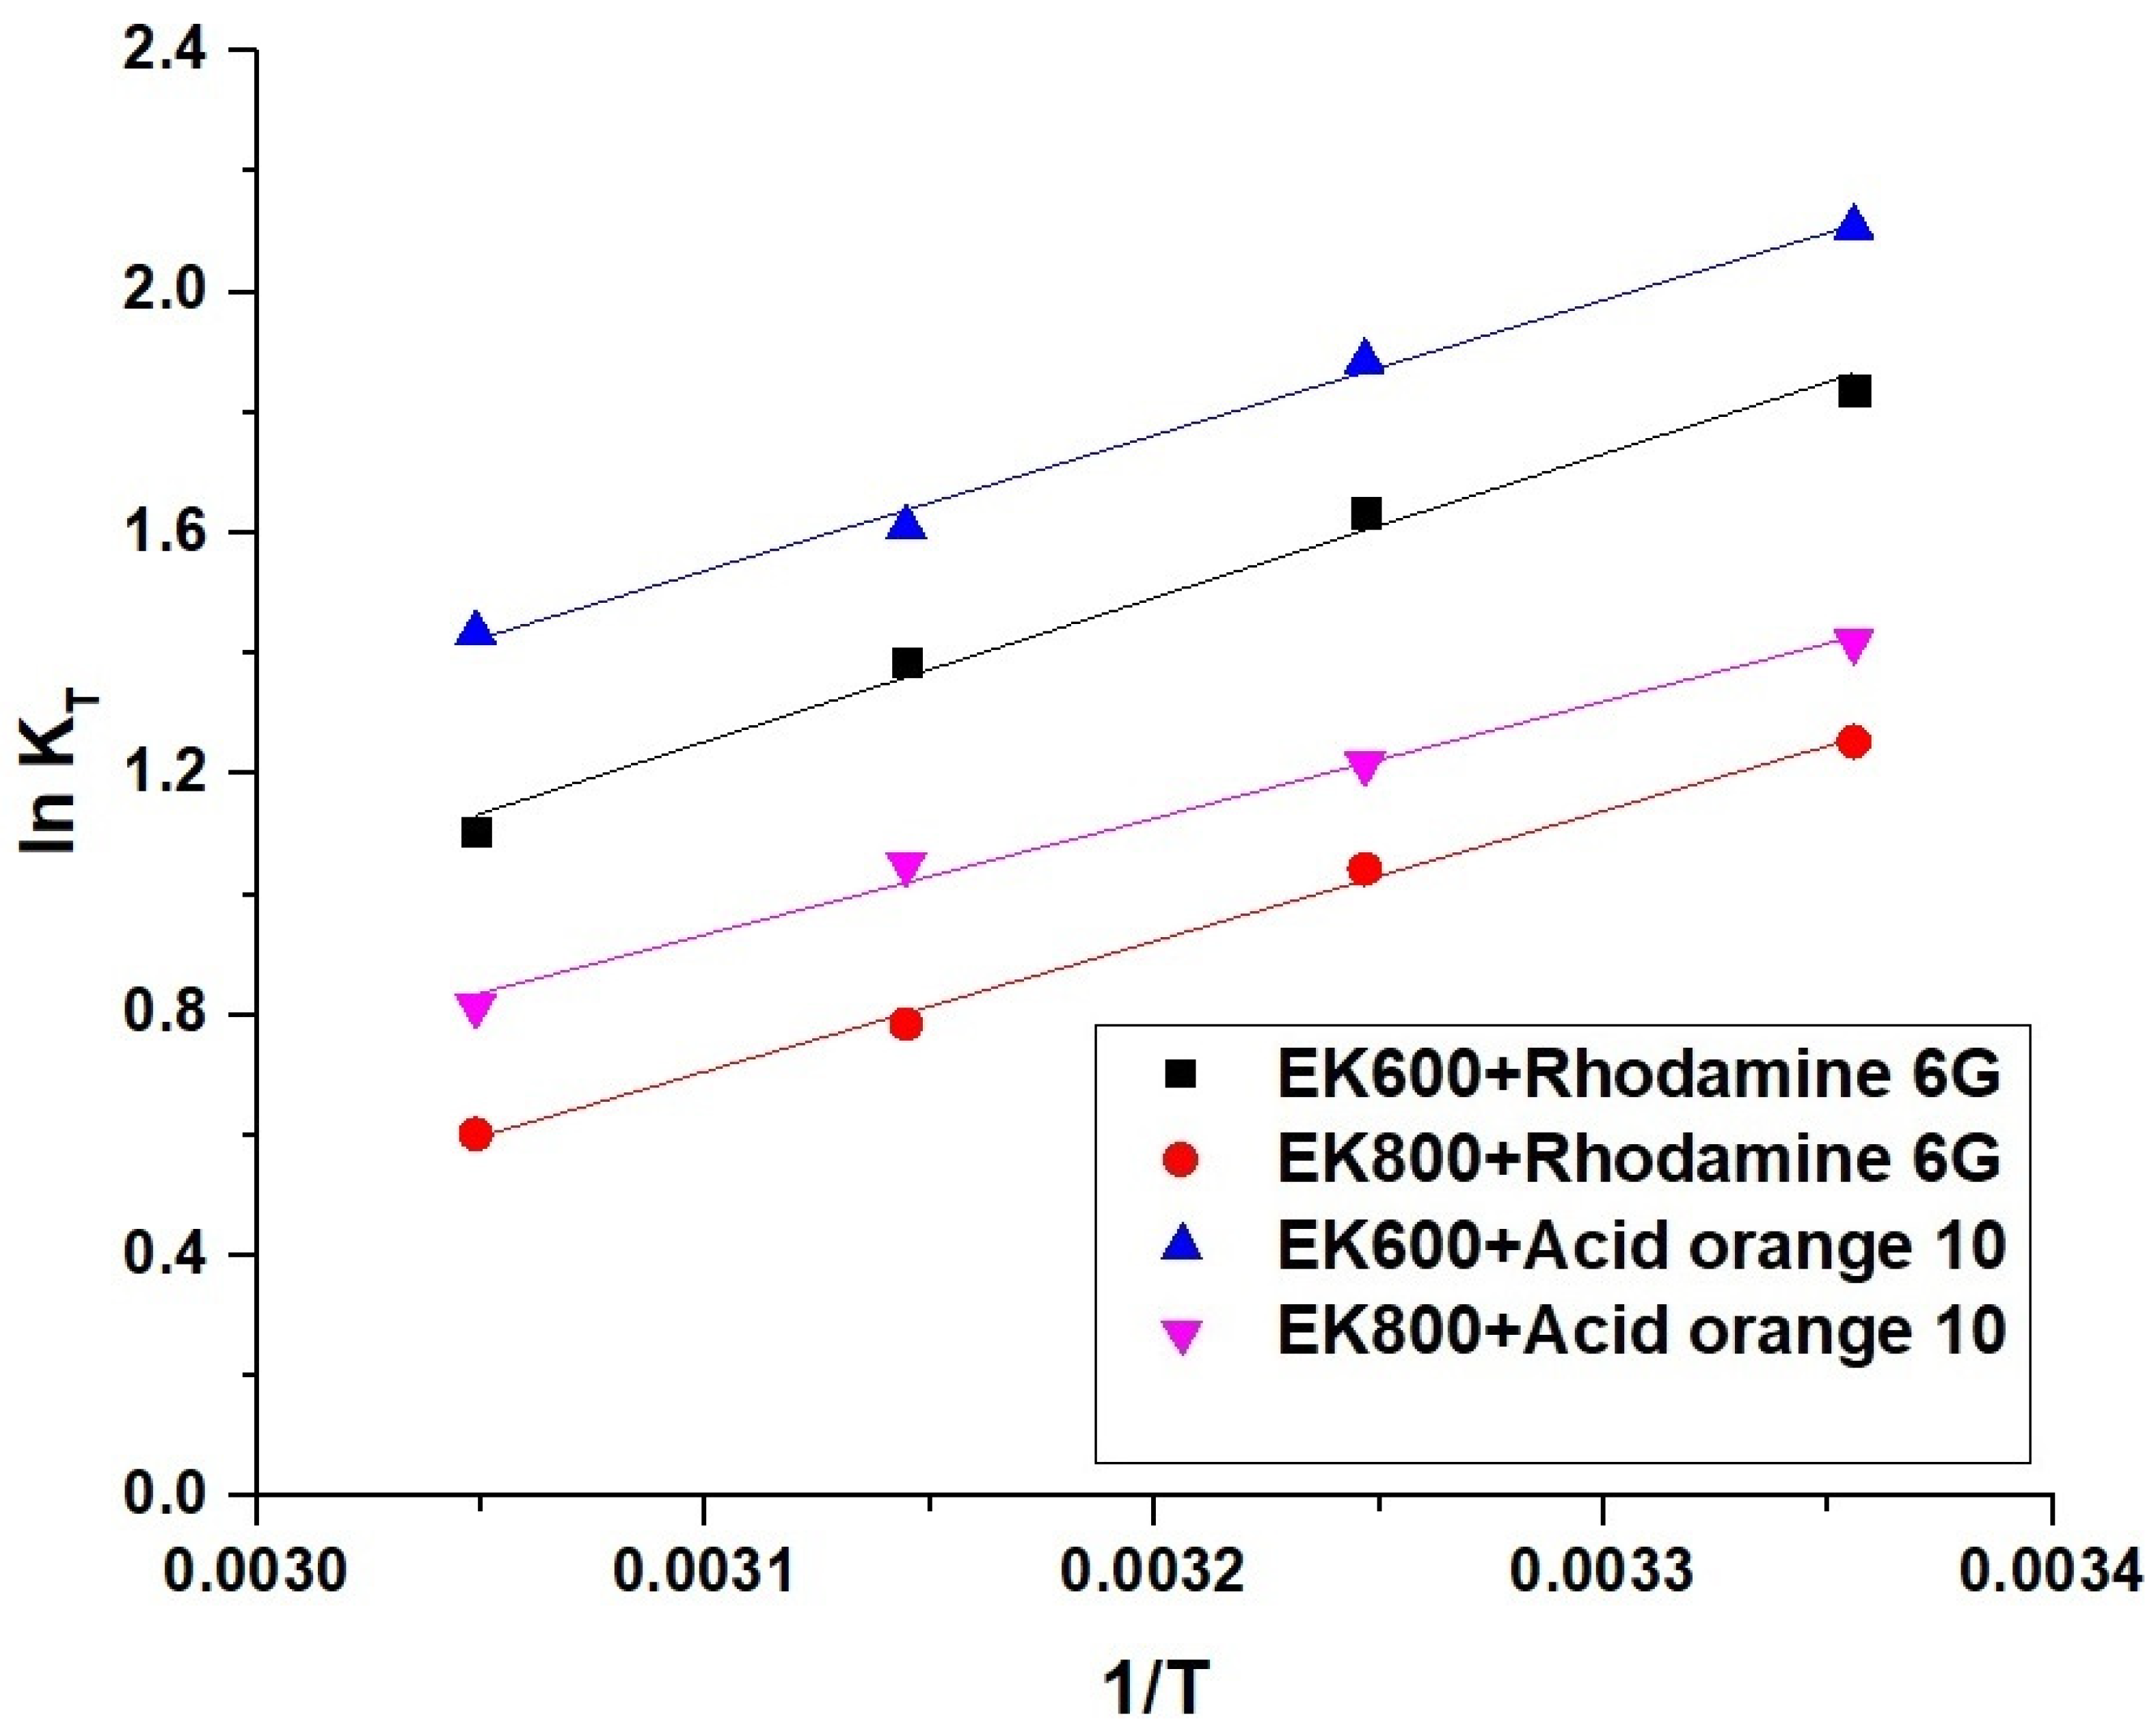
3.2.3. Effect of Temperature

Figure 11A,B represent the effect of temperature on the % U of rhodamine 6G and acid orange 10 dyes in addition to the removal capacity of the EK600 and EK800 adsorbents, respectively. Additionally, the results exhibited that the % U of rhodamine 6G and acid orange 10 dyes, in addition to the removal capacity of the EK600 and EK800 adsorbents, decreased when increasing the temperature from 298 to 328 kelvin. The % U of rhodamine 6G dye by the EK600 and EK800 adsorbents at 328 kelvin is 50.13 and 37.83%, respectively. Additionally, the removal capacity of the EK600 and EK800 adsorbents towards rhodamine 6G dye at 328 kelvin is 225.57 and 170.25 mg/g, respectively. In addition, the % U of acid orange 10 dye by the EK600 and EK800 adsorbents at 328 kelvin is 58.34 and 42.93%, respectively. Additionally, the removal capacity of the EK600 and EK800 adsorbents towards acid orange 10 dye at 328 kelvin is 262.53 and 193.17 mg/g, respectively.
The effect of solution temperature on the removal of rhodamine 6G and acid orange 10 dyes by the EK600 and EK800 adsorbents was examined using the thermodynamic constants, for example, ΔG° (change in free energy, kJ/mol), ΔH° (change in enthalpy, kJ/mol), and ΔS° (change in entropy, kJ/mol kelvin), which were estimated by Equations (5)–(7) [61].
l n K T = Δ S ° R Δ H ° R T
Δ G ° = Δ H ° T Δ S °
K T = O e Z e
R represents the universal gas constant (kJ/mol kelvin), whereas T represents the absolute temperature (kelvin). KT represents the distribution constant (L/g). In addition, Figure 12 depicts the linear variation of lnKT against 1/T, from which the thermodynamic constants can be estimated based on intercept and slope. Table 4 displays the thermodynamic constants for the removal of rhodamine 6G and acid orange 10 dyes by the EK600 and EK800 adsorbents. Negative ΔG° values indicated that the EK600 and EK800 adsorbents removed the rhodamine 6G and acid orange 10 dyes spontaneously. In addition, the negative ΔH° values indicated that the EK600 and EK800 adsorbents remove the rhodamine 6G and acid orange 10 dyes exothermically. Furthermore, the positive ΔS° values indicated that the rhodamine 6G and acid orange 10 dyes were removed by the EK600 and EK800 adsorbents in the direction of increasing system randomization. Moreover, the removal of rhodamine 6G and acid orange 10 dyes by EK600 and EK800 adsorbents is physical in nature, as the ΔH° values are less than 40 kJ/mol [61].

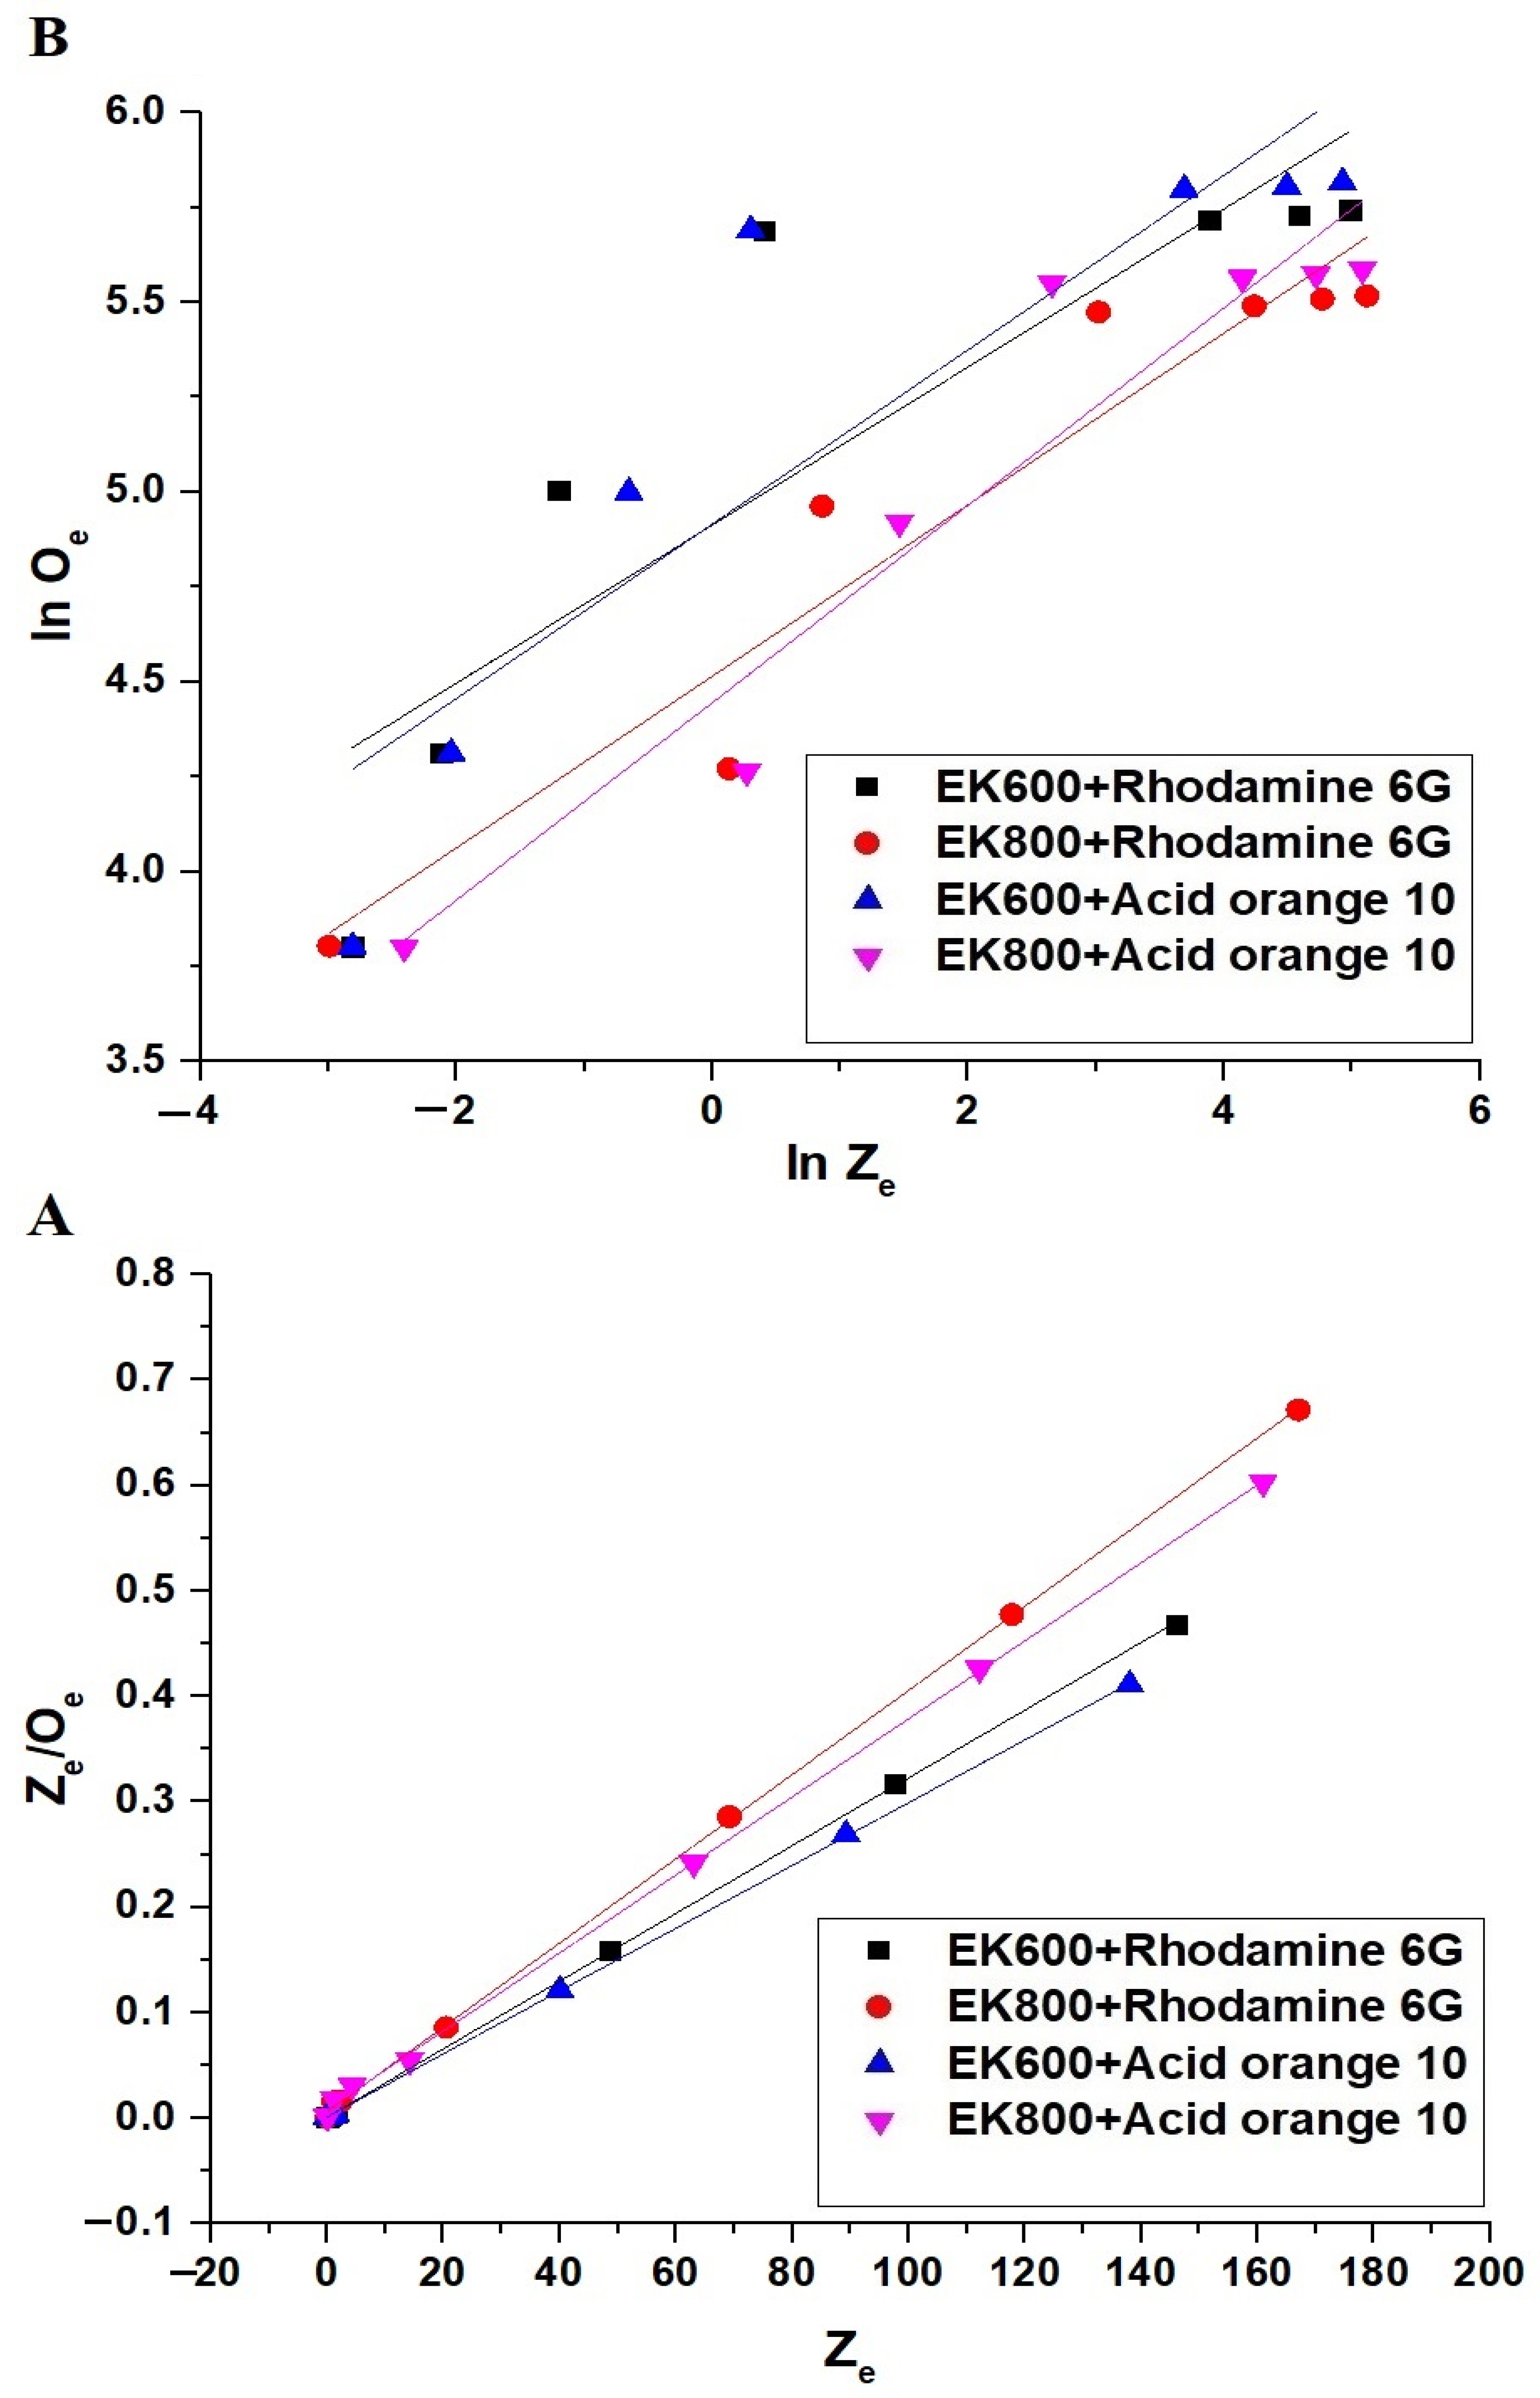
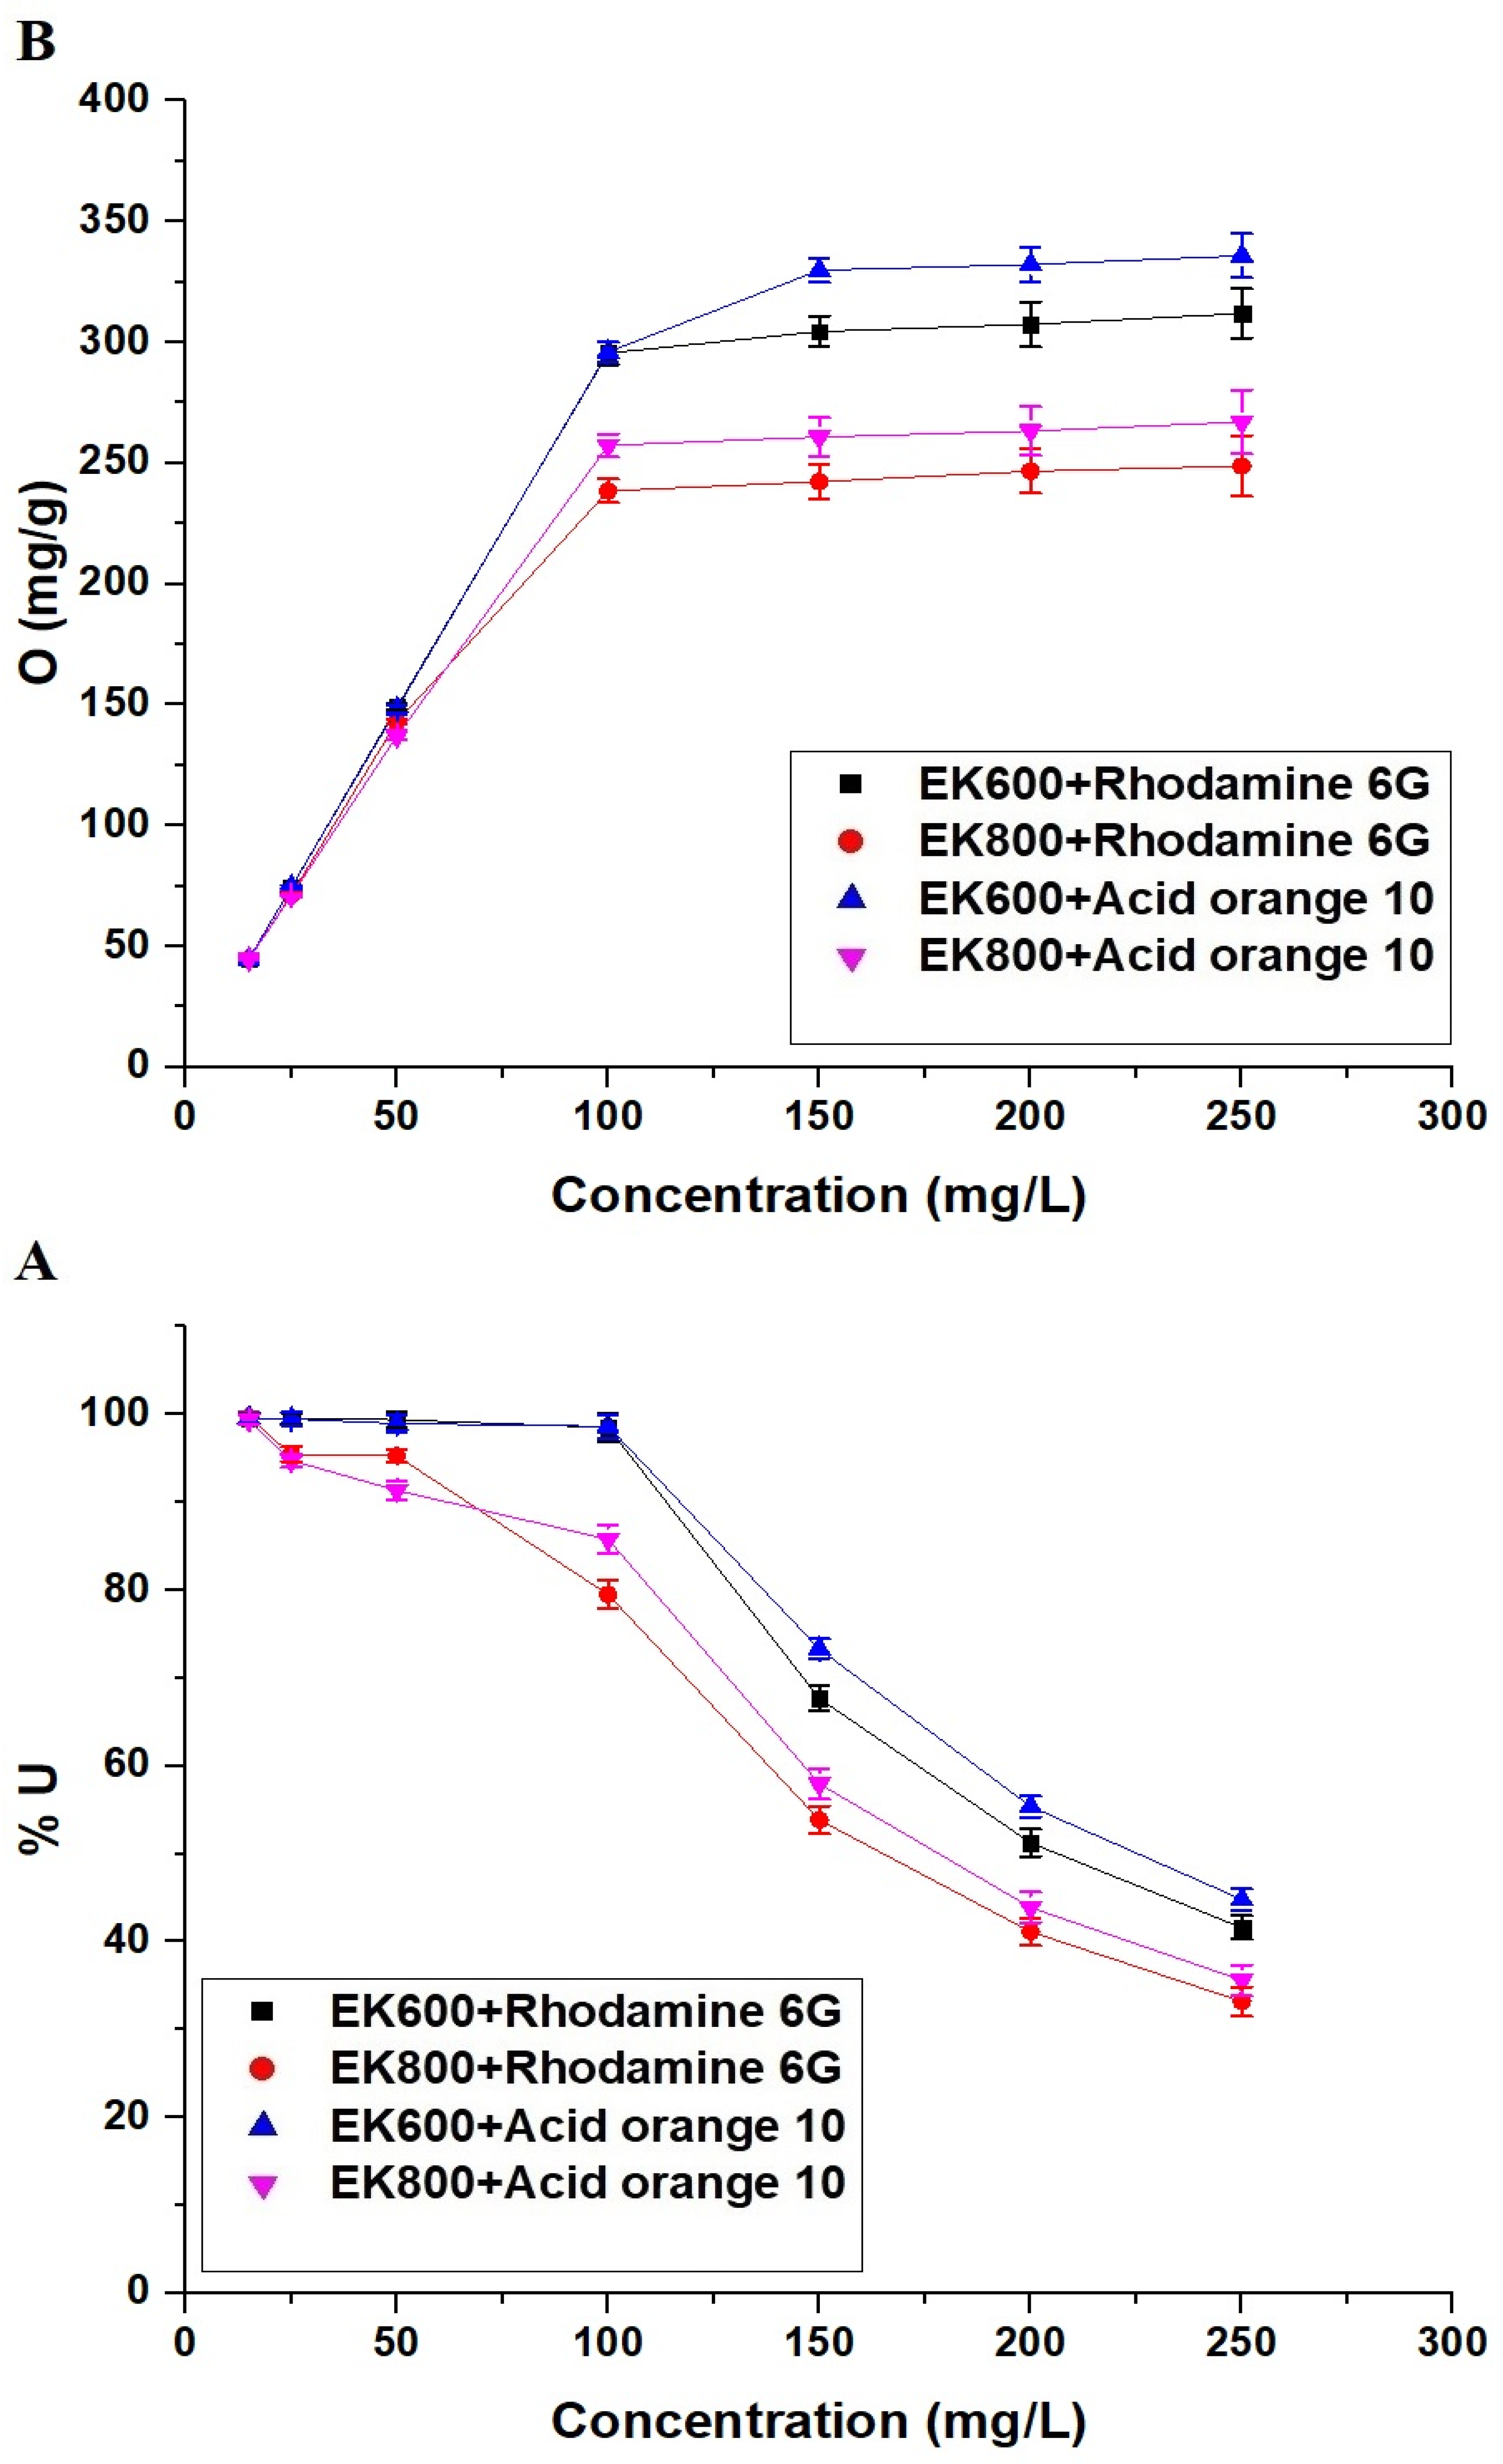
3.2.4. Effect of Dye Concentration

Figure 13A,B represent the effect of dye concentration on the % U of rhodamine 6G and acid orange 10 dyes in addition to the removal capacity of the EK600 and EK800 adsorbents, respectively. Additionally, the results exhibited that the % U of rhodamine 6G and acid orange 10 dyes decreased with increasing the concentration of dyes from 15 to 250 mg/L. Also, the removal capacity of the EK600 and EK800 adsorbents improved by increasing the initial concentration of dyes from 15 to 250 mg/L.
The Langmuir (Equation (8)) and Freundlich (Equation (9)) equilibrium equations [61] were used to examine the linear fitting of the obtained experimental data due to the removal of rhodamine 6G and acid orange 10 dyes by the EK600 and EK800 adsorbents, as indicated in Figure 14A,B, respectively.
Z e O e = 1 k 3 O m a x + Z e O m a x
l n O e = l n k 4 + 1 y l n Z e
where 1/y is the heterogeneity constant while k3 is the equilibrium constant of the Langmuir equation (L/mg). Also, k4 is the equilibrium constant of the Freundlich equation (mg/g)(L/mg)1/n, while Omax is the greatest removal capacity of the Langmuir equation (mg/g). Additionally, Equation (10) can be utilized to determine the Omax from the Freundlich equilibrium isotherm [61].
O m a x = k 4 Z o 1 / y
Table 5 displays the resultant constants and correlation coefficients (R2). In addition, the removal of rhodamine 6G and acid orange 10 dyes by the EK600 and EK800 adsorbents follows the Langmuir isotherm because the R2 values of the Langmuir isotherm are higher than the R2 values of the Freundlich isotherm. Additionally, the greatest removal capacity of the EK600 and EK800 adsorbents toward rhodamine 6G dye is 311.53 and 250.63 mg/g, respectively. Moreover, the greatest removal capacity of the EK600 and EK800 adsorbents towards acid orange 10 dye is 335.57 and 270.27 mg/g, respectively.
Additionally, the removal capacity of the EK600 and EK800 synthesized nanocomposites towards rhodamine 5G and acid orange 10 dyes was superior to that of many other adsorbents, as shown in Table 6 [49,50,51,52,53,54,55,56].

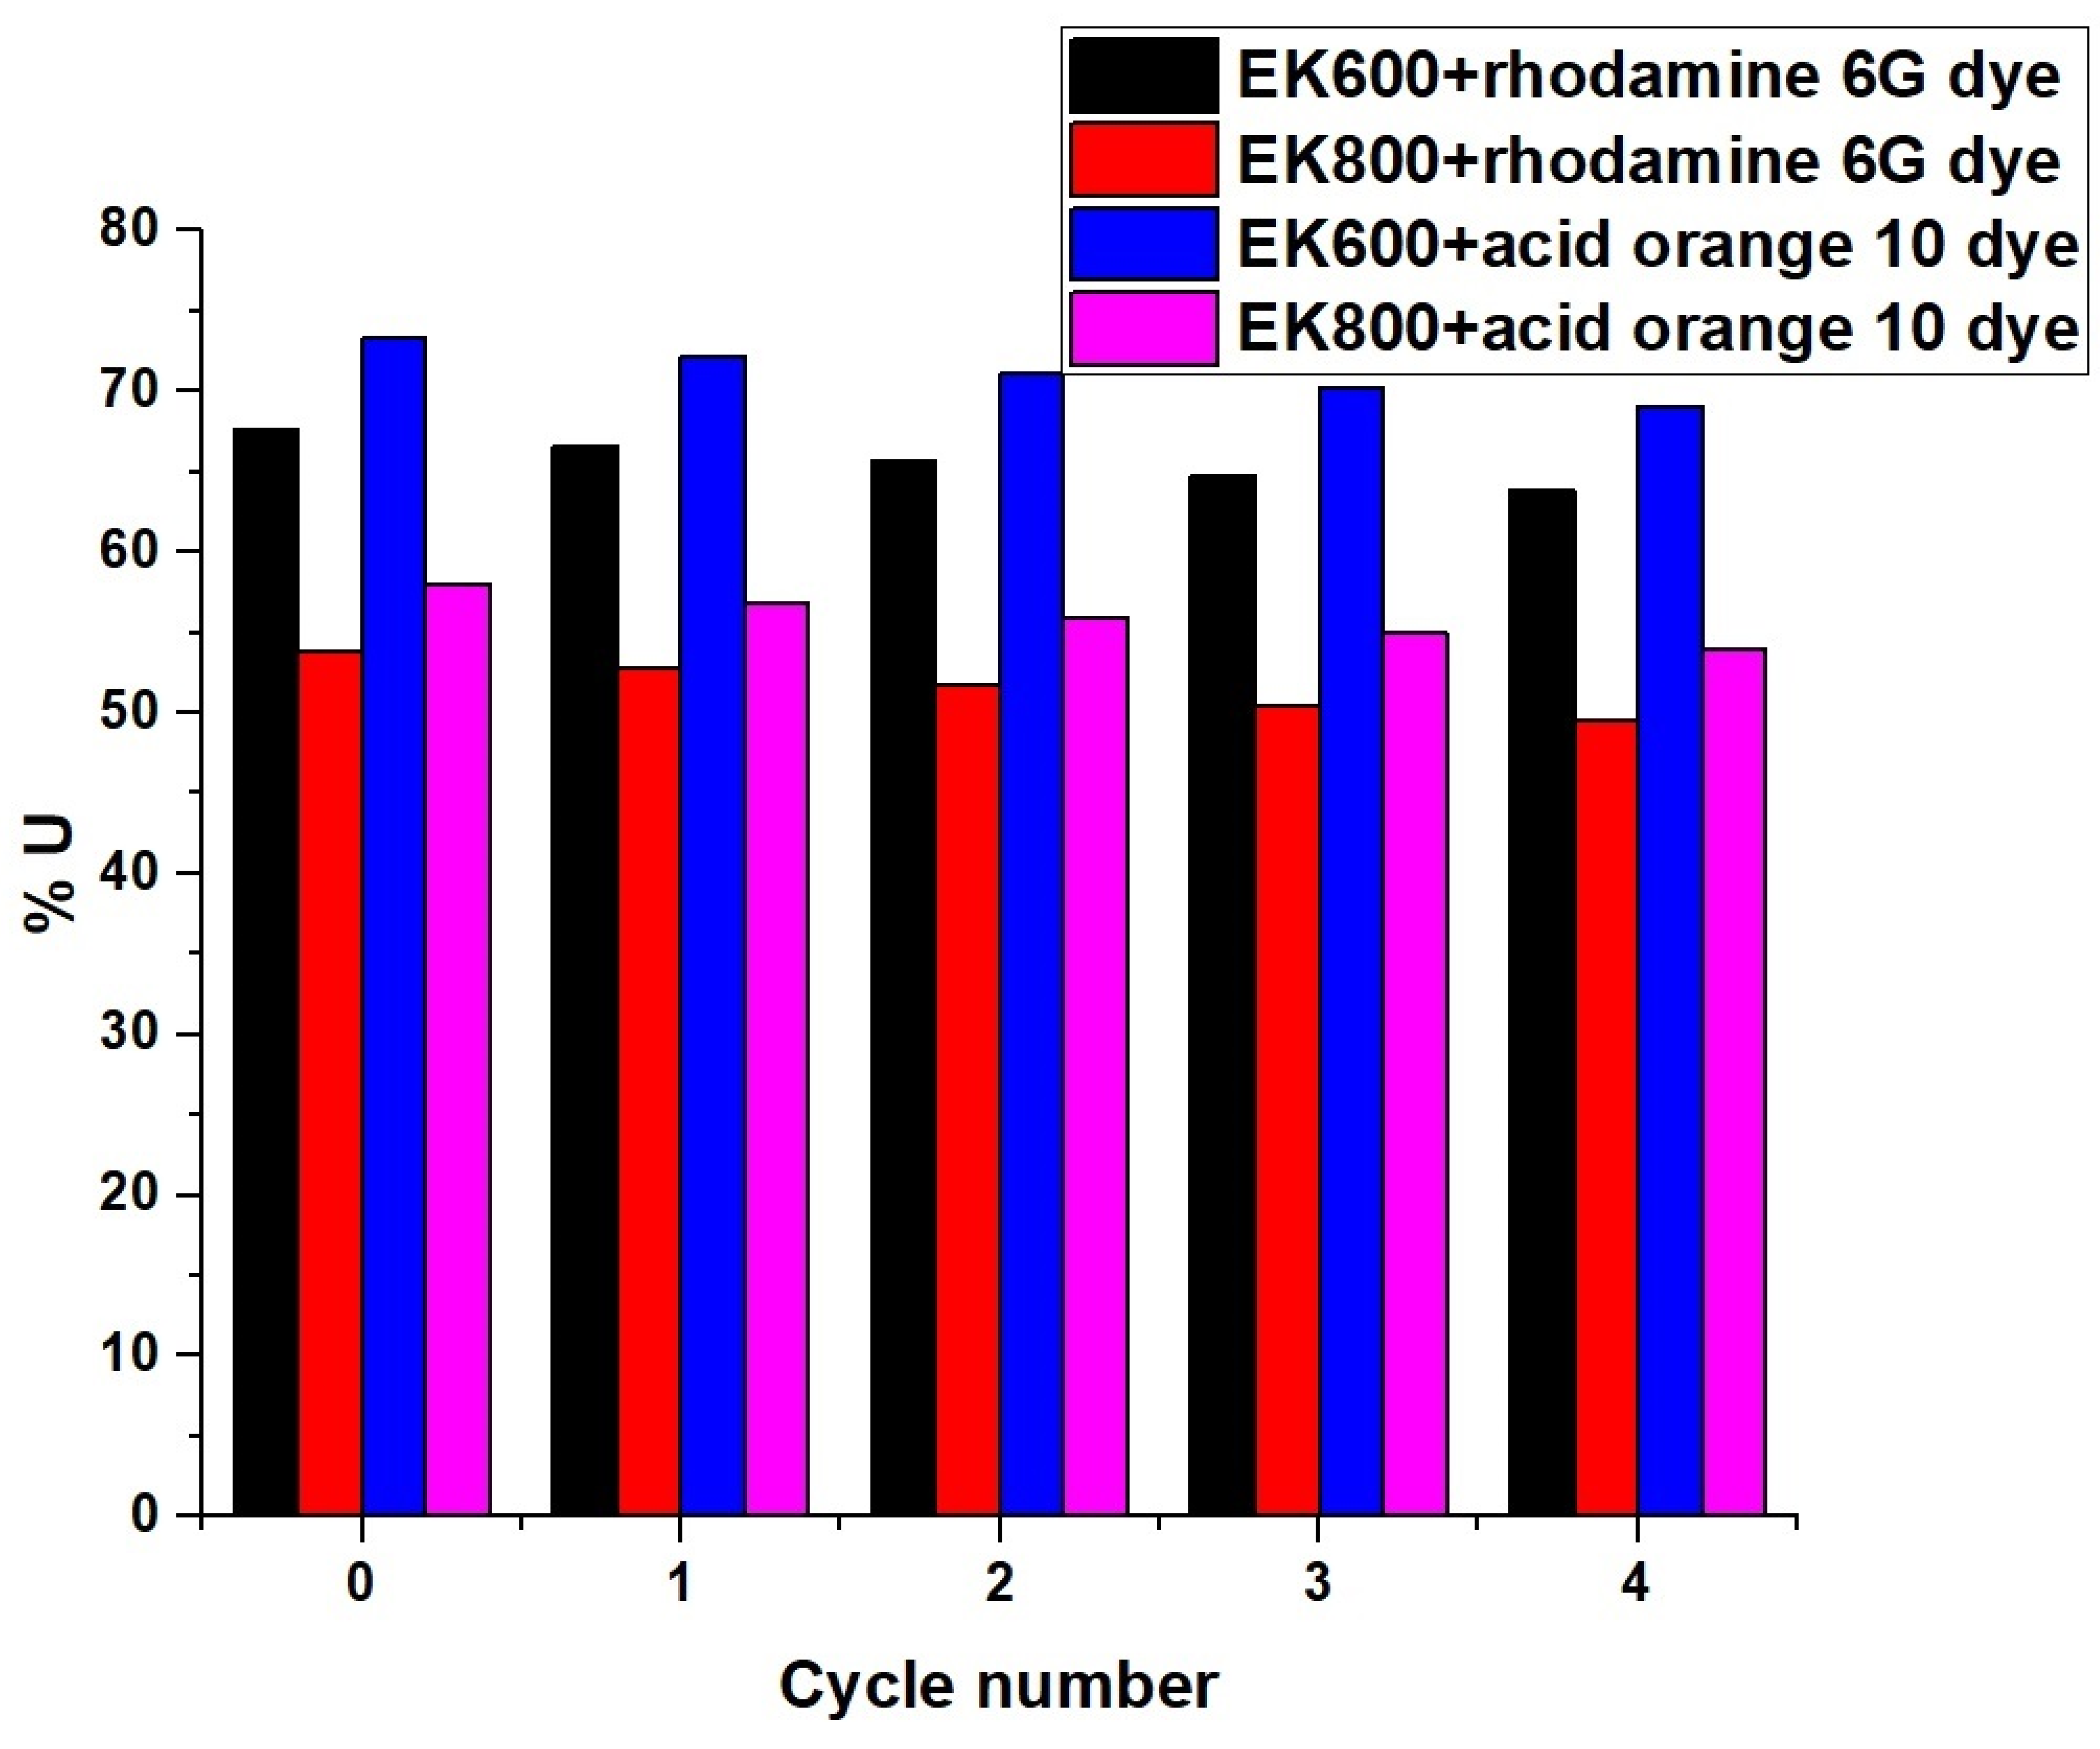
3.2.5. Effect of Desorption and Reusability

The EK600 and EK800 adsorbents were regenerated by subjecting them to a heat treatment at 550 °C for 2 hr, which completely removed rhodamine 6G or acid orange 10 dyes from their surfaces. Subsequently, the regenerated adsorbents were employed for four consecutive cycles to remove the studied dyes, following the experimental procedure outlined earlier. Figure 15 demonstrates that the percentage removal of rhodamine 6G or acid orange 10 dyes using the synthesized adsorbents remained fairly constant, indicating that these adsorbents can be reused multiple times without a significant loss in their efficiency.

4. Conclusions

The Pechini sol–gel method was utilized for the facile synthesis of ZrO2/CdMn2O4/CdO as novel nanocomposites at 600 and 800 °C. The nanocomposites, which were synthesized at 600 and 800 °C, were abbreviated as EK600 and EK800, respectively. Additionally, the XRD showed that the average crystal size of the EK600 and EK800 nanocomposites is 68.25 and 85.32 nm, respectively. Moreover, the BET surface area of the EK600 and EK800 nanocomposites is 46.33 and 38.49 m2/g, respectively. The greatest removal capacity of the EK600 and EK800 adsorbents towards acid orange 10 dye is 335.57 and 270.27 mg/g, respectively. Additionally, the greatest removal capacity of the EK600 and EK800 adsorbents toward rhodamine 6G dye is 311.53 and 250.63 mg/g, respectively.

Author Contributions

Conceptualization, E.A.A.; methodology, E.A.A., M.K. and G.S.E.-S.; formal analysis, E.A.A., G.S.E.-S. and H.S.A.; resources, E.A.A. and M.K.; writing—original draft preparation, H.S.A., F.K.A., M.S.B. and Z.A.; writing—review and editing, E.A.A., F.A.S. and F.K.A.; funding acquisition, H.S.A. All authors have read and agreed to the published version of the manuscript.

Funding

Princess Nourah bint Abdulrahman University Researchers Supporting Project number (PNURSP2023R185), Princess Nourah bint Abdulrahman University, Riyadh, Saudi Arabia.

Data Availability Statement

Not applicable.

Conflicts of Interest

The authors declare no conflict of interest.

References

  1. Hasanpour, M.; Hatami, M. Photocatalytic Performance of Aerogels for Organic Dyes Removal from Wastewaters: Review Study. J. Mol. Liq. 2020, 309, 113094. [Google Scholar] [CrossRef]
  2. Wazir, M.B.; Daud, M.; Ali, F.; Al-Harthi, M.A. Dendrimer Assisted Dye-Removal: A Critical Review of Adsorption and Catalytic Degradation for Wastewater Treatment. J. Mol. Liq. 2020, 315, 113775. [Google Scholar] [CrossRef]
  3. Chowdhury, M.F.; Khandaker, S.; Sarker, F.; Islam, A.; Rahman, M.T.; Awual, M.R. Current Treatment Technologies and Mechanisms for Removal of Indigo Carmine Dyes from Wastewater: A Review. J. Mol. Liq. 2020, 318, 114061. [Google Scholar] [CrossRef]
  4. Kadhom, M.; Albayati, N.; Alalwan, H.; Al-Furaiji, M. Removal of Dyes by Agricultural Waste. Sustain. Chem. Pharm. 2020, 16, 100259. [Google Scholar] [CrossRef]
  5. Gahlot, R.; Taki, K.; Kumar, M. Efficacy of Nanoclays as the Potential Adsorbent for Dyes and Metal Removal from the Wastewater: A Review. Environ. Nanotechn. Monit. Manag. 2020, 14, 100339. [Google Scholar] [CrossRef]
  6. Zeng, X.; Zhang, G.; Wen, J.; Li, X.; Zhu, J.; Wu, Z. Simultaneous Removal of Aqueous Same Ionic Type Heavy Metals and Dyes by a Magnetic Chitosan/Polyethyleneimine Embedded Hydrophobic Sodium Alginate Composite: Performance, Interaction and Mechanism. Chemosphere 2023, 318, 137869. [Google Scholar] [CrossRef]
  7. Vasiraja, N.; Saravana Sathiya Prabhahar, R.; Joshua, A. Preparation and Physio–Chemical Characterisation of Activated Carbon Derived from Prosopis Juliflora Stem for the Removal of Methylene Blue Dye and Heavy Metal Containing Textile Industry Effluent. J. Clean. Prod. 2023, 397, 136579. [Google Scholar] [CrossRef]
  8. Anastopoulos, I.; Ahmed, M.J.; Hummadi, E.H. Eucalyptus-Based Materials as Adsorbents for Heavy Metals and Dyes Removal from (Waste)Waters. J. Mol. Liq. 2022, 356, 118864. [Google Scholar] [CrossRef]
  9. Garba, Z.N.; Lawan, I.; Zhou, W.; Zhang, M.; Wang, L.; Yuan, Z. Microcrystalline Cellulose (MCC) Based Materials as Emerging Adsorbents for the Removal of Dyes and Heavy Metals–A Review. Sci. Total Environ. 2020, 717, 135070. [Google Scholar] [CrossRef]
  10. Ahmadian, M.; Jaymand, M. Interpenetrating Polymer Network Hydrogels for Removal of Synthetic Dyes: A Comprehensive Review. Coord. Chem. Rev. 2023, 486, 215152. [Google Scholar] [CrossRef]
  11. Bilal, M.; Ihsanullah, I.; Hassan Shah, M.U.; Bhaskar Reddy, A.V.; Aminabhavi, T.M. Recent Advances in the Removal of Dyes from Wastewater Using Low-Cost Adsorbents. J. Environ. Manag. 2022, 321, 115981. [Google Scholar] [CrossRef] [PubMed]
  12. Lan, D.; Zhu, H.; Zhang, J.; Li, S.; Chen, Q.; Wang, C.; Wu, T.; Xu, M. Adsorptive Removal of Organic Dyes via Porous Materials for Wastewater Treatment in Recent Decades: A Review on Species, Mechanisms and Perspectives. Chemosphere 2022, 293, 133464. [Google Scholar] [CrossRef]
  13. Al Naim, A.F. Mesoporous and Nanoflowers (ZnO2) via a Hydrothermal Technique for Dye Removal and Antibacterial Applications. Inorg. Chem. Commun. 2023, 151, 110575. [Google Scholar] [CrossRef]
  14. Aramesh, N.; Bagheri, A.R.; Bilal, M. Chitosan-Based Hybrid Materials for Adsorptive Removal of Dyes and Underlying Interaction Mechanisms. Int. J. Biol. Macromol. 2021, 183, 399–422. [Google Scholar] [CrossRef] [PubMed]
  15. Uddin, M.J.; Ampiaw, R.E.; Lee, W. Adsorptive Removal of Dyes from Wastewater Using a Metal-Organic Framework: A Review. Chemosphere 2021, 284, 131314. [Google Scholar] [CrossRef]
  16. Oyewo, O.A.; Elemike, E.E.; Onwudiwe, D.C.; Onyango, M.S. Metal Oxide-Cellulose Nanocomposites for the Removal of Toxic Metals and Dyes from Wastewater. Int. J. Biol. Macromol. 2020, 164, 2477–2496. [Google Scholar] [CrossRef]
  17. Bhattacharjee, C.; Dutta, S.; Saxena, V.K. A Review on Biosorptive Removal of Dyes and Heavy Metals from Wastewater Using Watermelon Rind as Biosorbent. Environ. Adv. 2020, 2, 100007. [Google Scholar] [CrossRef]
  18. Akbari, A.; Sabouri, Z.; Hosseini, H.A.; Hashemzadeh, A.; Khatami, M.; Darroudi, M. Effect of Nickel Oxide Nanoparticles as a Photocatalyst in Dyes Degradation and Evaluation of Effective Parameters in Their Removal from Aqueous Environments. Inorg. Chem. Commun. 2020, 115, 107867. [Google Scholar] [CrossRef]
  19. Ihsanullah, I.; Jamal, A.; Ilyas, M.; Zubair, M.; Khan, G.; Atieh, M.A. Bioremediation of Dyes: Current Status and Prospects. J. Water Process Eng. 2020, 38, 101680. [Google Scholar] [CrossRef]
  20. Hitam, C.N.C.; Jalil, A.A. A Review on Exploration of Fe2O3 Photocatalyst towards Degradation of Dyes and Organic Contaminants. J. Environ. Manag. 2020, 258, 110050. [Google Scholar] [CrossRef]
  21. Rahimi, B.; Rahimi, N.R.; Ebrahimi, A. Catalytic Reduction of Hazardous Acid Orange 10 Dye by BiVO4/TiO2 Nanocrystalline Heterojunction and Influence of Aeration, FeSO4, H2O2 and FeCl3 on Removal Efficiency: A Novel and Environmentally Friendly Process. Arab. J. Chem. 2022, 15, 104003. [Google Scholar] [CrossRef]
  22. Estrada-Cabrera, E.; Torres-Ferrer, L.R.; Luna-Barcenas, G.; Ramirez-Bon, R. Cellulose Dialysis Membrane Containing Raw Clinoptilolite Enhances the Removal of Rhodamine 6G from Aqueous Solutions. Microporous Mesoporous Mater. 2021, 321, 111113. [Google Scholar] [CrossRef]
  23. Merzouk, B.; Gourich, B.; Madani, K.; Vial, C.; Sekki, A. Removal of a Disperse Red Dye from Synthetic Wastewater by Chemical Coagulation and Continuous Electrocoagulation. A Comparative Study. Desalination 2011, 272, 246–253. [Google Scholar] [CrossRef]
  24. Nataraj, S.K.; Hosamani, K.M.; Aminabhavi, T.M. Nanofiltration and Reverse Osmosis Thin Film Composite Membrane Module for the Removal of Dye and Salts from the Simulated Mixtures. Desalination 2009, 249, 12–17. [Google Scholar] [CrossRef]
  25. Li, X.; Liu, T.; Zhang, Y.; Cai, J.; He, M.; Li, M.; Chen, Z.; Zhang, L. Growth of BiOBr/ZIF-67 Nanocomposites on Carbon Fiber Cloth as Filter-Membrane-Shaped Photocatalyst for Degrading Pollutants in Flowing Wastewater. Adv. Fiber Mater. 2022, 4, 1620–1631. [Google Scholar] [CrossRef]
  26. Zhai, H.; Liu, Z.; Xu, L.; Liu, T.; Fan, Y.; Jin, L.; Dong, R.; Yi, Y.; Li, Y. Waste Textile Reutilization Via a Scalable Dyeing Technology: A Strategy to Enhance Dyestuffs Degradation Efficiency. Adv. Fiber Mater. 2022, 4, 1595–1608. [Google Scholar] [CrossRef]
  27. Al-Bastaki, N. Removal of Methyl Orange Dye and Na2SO4 Salt from Synthetic Waste Water Using Reverse Osmosis. Chem. Eng. Process. Process Intensif. 2004, 43, 1561–1567. [Google Scholar] [CrossRef]
  28. Yuan, J.; Chen, Z.; Yu, Q.; Zhu, W.; Li, S.; Han, L.; Lu, X.; Li, S.; Wu, Y.; Lv, Z.; et al. Enhanced Electrochemical Removal of Dye Wastewater by PbO2 Anodes Using Halloysite Nanotubes with Different Surface Charge Properties. J. Electroanal. Chem. 2022, 923, 116816. [Google Scholar] [CrossRef]
  29. Bustos-Terrones, Y.A.; Hermosillo-Nevárez, J.J.; Ramírez-Pereda, B.; Vaca, M.; Rangel-Peraza, J.G.; Bustos-Terrones, V.; Rojas-Valencia, M.N. Removal of BB9 Textile Dye by Biological, Physical, Chemical, and Electrochemical Treatments. J. Taiwan Inst. Chem. Eng. 2021, 121, 29–37. [Google Scholar] [CrossRef]
  30. Abdelrahman, E.A.; Hegazey, R.M.; Ismail, S.H.; El-Feky, H.H.; Khedr, A.M.; Khairy, M.; Ammar, A.M. Facile Synthesis and Characterization of β-Cobalt Hydroxide/Hydrohausmannite/Ramsdellitee/Spertiniite and Tenorite/Cobalt Manganese Oxide/Manganese Oxide as Novel Nanocomposites for Efficient Photocatalytic Degradation of Methylene Blue Dye. Arab. J. Chem. 2022, 15, 104372. [Google Scholar] [CrossRef]
  31. Hegazey, R.M.; Abdelrahman, E.A.; Kotp, Y.H.; Hameed, A.M.; Subaihi, A. Facile Fabrication of Hematite Nanoparticles from Egyptian Insecticide Cans for Efficient Photocatalytic Degradation of Rhodamine B Dye. J. Mater. Res. Technol. 2020, 9, 1652–1661. [Google Scholar] [CrossRef]
  32. Alharbi, A.; Abdelrahman, E.A. Efficient Photocatalytic Degradation of Malachite Green Dye Using Facilely Synthesized Hematite Nanoparticles from Egyptian Insecticide Cans. Spectrochim. Acta-Part A Mol. Biomol. Spectrosc. 2020, 226, 117612. [Google Scholar] [CrossRef]
  33. Abdelrahman, E.A.; Hegazey, R.M.; Kotp, Y.H.; Alharbi, A. Facile Synthesis of Fe2O3 Nanoparticles from Egyptian Insecticide Cans for Efficient Photocatalytic Degradation of Methylene Blue and Crystal Violet Dyes. Spectrochim. Acta-Part A Mol. Biomol. Spectrosc. 2019, 222, 117195. [Google Scholar] [CrossRef] [PubMed]
  34. Abdelrahman, E.A.; Hegazey, R.M.; El-Azabawy, R.E. Efficient Removal of Methylene Blue Dye from Aqueous Media Using Fe/Si, Cr/Si, Ni/Si, and Zn/Si Amorphous Novel Adsorbents. J. Mater. Res. Technol. 2019, 8, 5301–5313. [Google Scholar] [CrossRef]
  35. Abdelrahman, E.A. Synthesis of Zeolite Nanostructures from Waste Aluminum Cans for Efficient Removal of Malachite Green Dye from Aqueous Media. J. Mol. Liq. 2018, 253, 72–82. [Google Scholar] [CrossRef]
  36. Abu-Nada, A.; Abdala, A.; McKay, G. Removal of Phenols and Dyes from Aqueous Solutions Using Graphene and Graphene Composite Adsorption: A Review. J. Environ. Chem. Eng. 2021, 9, 105858. [Google Scholar] [CrossRef]
  37. Yagub, M.T.; Sen, T.K.; Afroze, S.; Ang, H.M. Dye and Its Removal from Aqueous Solution by Adsorption: A Review. Adv. Colloid Interface Sci. 2014, 209, 172–184. [Google Scholar] [CrossRef] [PubMed]
  38. Shi, L.; Wang, Q.; Zhao, X.; Che, Y.; Liu, H.; Zuo, W.; Zhang, Y. The Methyl Blue Adsorption Performance and Mechanism of NaX Zeolite Synthesized from Huadian Oil Shale Ash. J. Taiwan Inst. Chem. Eng. 2023, 147, 104904. [Google Scholar] [CrossRef]
  39. Al-Jubouri, S.M.; Al-Jendeel, H.A.; Rashid, S.A.; Al-Batty, S. Green Synthesis of Porous Carbon Cross-Linked Y Zeolite Nanocrystals Material and Its Performance for Adsorptive Removal of a Methyl Violet Dye from Water. Microporous Mesoporous Mater. 2023, 356, 112587. [Google Scholar] [CrossRef]
  40. Aboelfetoh, E.F.; El-Attar, H.G.; Okba, E.A. Facile Synthesis of Magnetic and Porous Zeolite/SnFe2O4 Nanocomposite for Cationic and Anionic Dyes Deterioration. Microporous Mesoporous Mater. 2023, 357, 112611. [Google Scholar] [CrossRef]
  41. Ji, Y.; Xu, F.; Wei, W.; Gao, H.; Zhang, K.; Zhang, G.; Xu, Y.; Zhang, P. Efficient and Fast Adsorption of Methylene Blue Dye onto a Nanosheet MFI Zeolite. J. Solid State Chem. 2021, 295, 121917. [Google Scholar] [CrossRef]
  42. He, S.; Sun, J.; Jin, X.; Chen, Q.; Wu, X.; Tian, F.; Zhang, X.; Li, P.; Sheng, H. Adsorption Enhancement of Congo Red Dye from Wastewater Based on Edamame Shell Originated Activated Carbon by the Cations: Experimental and Theoretical Studies. Diam. Relat. Mater. 2023, 136, 109930. [Google Scholar] [CrossRef]
  43. Rimzim; Singh, J.; Mittal, S.; Singh, H. Robust Removal of Cationic Dyes by Zinc Ferrite Composites in Single and Ternary Dye Systems. Inorg. Chem. Commun. 2023, 153, 110756. [Google Scholar] [CrossRef]
  44. Salama, H.E.; Abdel Aziz, M.S. Non-Toxic Chitosan-Pyrazole Adsorbent Enriched with Greenly Synthesized Zinc Oxide Nanoparticles for Dye Removal from Wastewater. Int. J. Biol. Macromol. 2023, 241, 124632. [Google Scholar] [CrossRef] [PubMed]
  45. Inamdar, A.K.; Hulsure, N.R.; Kadam, A.S.; Thabet, A.E.; Shelke, S.B.; Inamdar, S.N. Cobalt Oxide Nanoparticles by Flame Pyrolysis for Efficient Removal of Mixed Dyes. Mater. Today Proc. 2023, in press. [Google Scholar] [CrossRef]
  46. Brandão, W.Q.; Maciel, B.G.; Lima, E.M.d.A.; Mojica-Sánchez, L.C.; da Silva, R.J.; de Melo, C.P. Carboxymethylcellulose Magnetic Composite for Adsorptive Removal of Cationic Toluidine Blue Dye. Mater. Chem. Phys. 2023, 303, 127782. [Google Scholar] [CrossRef]
  47. Oviedo, L.R.; Oviedo, V.R.; Dalla Nora, L.D.; da Silva, W.L. Adsorption of Organic Dyes onto Nanozeolites: A Machine Learning Study. Sep. Purif. Technol. 2023, 315, 123712. [Google Scholar] [CrossRef]
  48. Wen, Y.; Xie, Z.; Xue, S.; Long, J.; Shi, W.; Liu, Y. Preparation of Benzenesulfonyl Hydrazone Modified Guar Gum and Its Adsorption Properties for Dyes and Phytotoxicity Assays. Int. J. Biol. Macromol. 2023, 234, 123700. [Google Scholar] [CrossRef]
  49. Gollakota, A.R.K.; Munagapati, V.S.; Gautam, S.; Wen, J.C.; Shu, C.M. Hydrothermal Tuning of Morphology of Aluminophosphate (AlPO-14) Framework for the Adsorption of Rhodamine 6G Dye. Adv. Powder Technol. 2021, 32, 3002–3015. [Google Scholar] [CrossRef]
  50. Vanamudan, A.; Bandwala, K.; Pamidimukkala, P. Adsorption Property of Rhodamine 6G onto Chitosan-g-(N-Vinyl Pyrrolidone)/Montmorillonite Composite. Int. J. Biol. Macromol. 2014, 69, 506–513. [Google Scholar] [CrossRef]
  51. Annadurai, G.; Juang, R.S.; Lee, D.J. Adsorption of Rhodamine 6G from Aqueous Solutions on Activated Carbon. J. Environ. Sci. Heal.-Part A Toxic/Hazardous Subst. Environ. Eng. 2001, 36, 715–725. [Google Scholar] [CrossRef] [PubMed]
  52. Gollakota, A.R.K.; Volli, V.; Munagapati, V.S.; Wen, J.C.; Shu, C.M. Synthesis of Novel ZSM-22 Zeolite from Taiwanese Coal Fly Ash for the Selective Separation of Rhodamine 6G. J. Mater. Res. Technol. 2020, 9, 15381–15393. [Google Scholar] [CrossRef]
  53. Zheng, X.; Zheng, H.; Zhou, Y.; Sun, Y.; Zhao, R.; Liu, Y.; Zhang, S. Enhanced Adsorption of Orange G from Aqueous Solutions by Quaternary Ammonium Group-Rich Magnetic Nanoparticles. Colloids Surfaces A Physicochem. Eng. Asp. 2019, 580, 123746. [Google Scholar] [CrossRef]
  54. Arulkumar, M.; Sathishkumar, P.; Palvannan, T. Optimization of Orange G Dye Adsorption by Activated Carbon of Thespesia Populnea Pods Using Response Surface Methodology. J. Hazard. Mater. 2011, 186, 827–834. [Google Scholar] [CrossRef]
  55. Banerjee, S.; Dubey, S.; Gautam, R.K.; Chattopadhyaya, M.C.; Sharma, Y.C. Adsorption Characteristics of Alumina Nanoparticles for the Removal of Hazardous Dye, Orange G from Aqueous Solutions. Arab. J. Chem. 2019, 12, 5339–5354. [Google Scholar] [CrossRef]
  56. Imgharn, A.; Anchoum, L.; Hsini, A.; Naciri, Y.; Laabd, M.; Mobarak, M.; Aarab, N.; Bouziani, A.; Szunerits, S.; Boukherroub, R.; et al. Effectiveness of a Novel Polyaniline@Fe-ZSM-5 Hybrid Composite for Orange G Dye Removal from Aqueous Media: Experimental Study and Advanced Statistical Physics Insights. Chemosphere 2022, 295, 133786. [Google Scholar] [CrossRef]
  57. Shojaei, B.; Miri, R.; Bazyari, A.; Thompson, L.T. Asphaltene Adsorption on MgO, CaO, SiO2, and Al2O3 Nanoparticles Synthesized via the Pechini-Type Sol−Gel Method. Fuel 2022, 321, 124136. [Google Scholar] [CrossRef]
  58. Kang, J.; Gwon, Y.R.; Cho, S.K. Photoelectrochemical Water Oxidation on PbCrO4 Thin Film Photoanode Fabricated via Pechini Method: Various Solution-Processes for PbCrO4 Film Synthesis. J. Electroanal. Chem. 2020, 878, 114601. [Google Scholar] [CrossRef]
  59. Alhaji, A.; Razavi, R.S.; Ghasemi, A.; Loghman-Estarki, M.R. Modification of Pechini Sol–Gel Process for the Synthesis of MgO-Y2O3 Composite Nanopowder Using Sucrose-Mediated Technique. Ceram. Int. 2017, 43, 2541–2548. [Google Scholar] [CrossRef]
  60. Kumar, V.; Sharma, R.; Kumar, S.; Kaur, M.; Sharma, J.D. Enhancement in the Photocatalytic Activity of Bi2Ti2O7 Nanopowders Synthesised via Pechini vs Co-Precipitation Method. Ceram. Int. 2019, 45, 20386–20395. [Google Scholar] [CrossRef]
  61. Shah, R.K.; Naglah, A.M.; Al-Omar, M.A.; Almehizia, A.A.; AlReshaidan, S.; Subaihi, A.; Alharbi, A.; Hameed, A.M.; Alkabli, J.; Fetoh, M.E.; et al. Efficient Removal of Ni(II) Ions from Aqueous Solutions Using Analcime Modified with Dimethylglyoxime Composite. Arab. J. Chem. 2021, 14, 103197. [Google Scholar] [CrossRef]
Scheme 1. The practical steps for synthesizing the EK600 and EK800 nanocomposites.
Inorganics 11 00333 sch001
Scheme 2. The practical steps for removing the rhodamine 6G and acid orange 10 dyes using the EK600 and EK800 nanocomposites.
Inorganics 11 00333 sch002
Figure 1. The thermogravimetric analysis of the resulting powder before calcination.
Inorganics 11 00333 g001
Figure 2. Patterns of XRD for the EK600 (A) and EK800 (B) products.
Inorganics 11 00333 g002
Figure 3. Images of FE-SEM for the EK600 (A) and EK800 (B) products.
Inorganics 11 00333 g003
Figure 4. Patterns of EDS for the EK600 (A) and EK800 (B) products.
Inorganics 11 00333 g004
Figure 5. The relation between adsorbed volume and relative pressure for the EK600 (A) and EK800 (B) samples.
Inorganics 11 00333 g005
Figure 6. The BJH pore size distribution of the EK600 (A) and EK800 (B) samples.
Inorganics 11 00333 g006
Figure 7. The effect of solution pH on the % U of rhodamine 6G and acid orange 10 dyes (A) in addition to the removal capacity of the EK600 and EK800 adsorbents (B).
Inorganics 11 00333 g007
Scheme 3. Removal mechanism of rhodamine 6G and acid orange 10 dyes using the EK600 and EK800 adsorbents.
Inorganics 11 00333 sch003
Figure 8. FE-SEM analysis of the EK600 sample after the adsorption of rhodamine 6G (A) and acid orange 10 (B) dyes.
Inorganics 11 00333 g008
Figure 9. The effect of contact time on the % U of rhodamine 6G and acid orange 10 dyes (A) in addition to the removal capacity of the EK600 and EK800 adsorbents (B).
Inorganics 11 00333 g009
Figure 10. Pseudo-first-order (A) as well as pseudo-second-order (B) plots for the removal of rhodamine 6G and acid orange 10 dyes by the EK600 and EK800 adsorbents.
Inorganics 11 00333 g010
Figure 11. The effect of dye solution temperature on the % U of rhodamine 6G and acid orange 10 dyes (A) in addition to the removal capacity of the EK600 and EK800 adsorbents (B).
Inorganics 11 00333 g011
Figure 12. The plot of ln KT against 1/T for the removal of rhodamine 6G and acid orange 10 dyes by the EK600 and EK800 adsorbents.
Inorganics 11 00333 g012
Figure 13. The effect of concentration on the % U of rhodamine 6G and acid orange 10 dyes (A) in addition to the removal capacity of the EK600 and EK800 adsorbents (B).
Inorganics 11 00333 g013
Figure 14. Langmuir (A) and Freundlich (B) plots for the removal of rhodamine 6G and acid orange 10 dyes by the EK600 and EK800 adsorbents.
Inorganics 11 00333 g014
Figure 15. The effect of reusability of the EK600 and EK800 adsorbents.
Inorganics 11 00333 g015
Table 1. EDS analysis of the EK600 and EK800 samples.
Samples% O% Mn% Cd% Zr
EK60014.6821.9025.7137.71
EK80013.9821.6427.4336.95
Table 2. Surface textures of the EK600 and EK800 samples.
SampleBET Surface Area
(m2/g)
Total Pore Volume
(cc/g)
Average Pore Size
(nm)
EK60046.330.20378.79
EK80038.490.13987.27
Table 3. The obtained kinetic constants for the removal of rhodamine 6G and acid orange 10 dyes by the EK600 and EK800 adsorbents.
ConditionsPseudo-First OrderPseudo-Second Order
k1
(1/min)
Oe
(mg/g)
R2k2
(g/mg.min)
Oe
(mg/g)
R2
EK600+
Rhodamine 6G
0.1254313.600.99990.00022429.180.9955
EK800+
Rhodamine 6G
0.1081250.930.99960.00019371.750.9864
EK600+
Acid orange 10
0.1227342.680.99990.00018478.470.9927
EK800+
Acid orange 10
0.1024265.350.99990.00018392.160.9911
Table 4. The thermodynamic constants for the removal of rhodamine 6G and acid orange 10 dyes by the EK600 and EK800 adsorbents.
ConditionsΔH° (kJ/mol)ΔS°
(kJ/mol kelvin)
ΔG°
(kJ/mol)
298308318328
EK600+
Rhodamine 6G
−19.950.0514−35.26−35.78−36.29−36.81
EK800+
Rhodamine 6G
−18.070.0501−33.00−33.50−34.00−34.51
EK600+
Acid orange 10
−18.760.0453−32.26−32.71−33.16−33.62
EK800+
Acid orange 10
−16.180.0423−28.79−29.22−29.64−30.06
Table 5. The obtained equilibrium constants for the removal of rhodamine 6G and acid orange 10 dyes by the EK600 and EK800 adsorbents.
Langmuir IsothermFreundlich Isotherm
ConditionsOmax
(mg/g)
k3
(L/mg)
R2Omax
(mg/g)
k4
(mg/g)(L/mg)1/n
R2
EK600+
Rhodamine 6G
311.532.18370.9999386.22136.070.7504
EK800+
Rhodamine 6G
250.630.61960.9998283.5191.370.9159
EK600+
Acid orange 10
335.571.94770.9999431.32136.440.7905
EK800+
Acid orange 10
270.270.43020.9995313.6785.230.9118
Table 6. Comparison between the greatest removal capacity of the synthesized nanocomposites and that of other adsorbents in the literature.
AdsorbentO(mg/g) towards
Rhodamine 6G Dye
O(mg/g) towards Acid Orange 10 DyeRef.
Aluminophosphate208.11----[49]
Chitosan-g-(N-vinylpyrrolidone)/montmorillonite composite36.60----[50]
Activated carbon44.70----[51]
ZSM-22 zeolite195.30----[52]
Quaternary ammonium group-rich magnetic nanoparticles----98.70[53]
Activated carbon----17.60[54]
Alumina nanoparticles----93.30[55]
Polyaniline/Fe-ZSM-5 composite----217[56]
EK600311.53335.57This study
EK800250.63268.09This study
Disclaimer/Publisher’s Note: The statements, opinions and data contained in all publications are solely those of the individual author(s) and contributor(s) and not of MDPI and/or the editor(s). MDPI and/or the editor(s) disclaim responsibility for any injury to people or property resulting from any ideas, methods, instructions or products referred to in the content.

