Article

Circular Dichroism Spectroscopic Studies on Solution Chemistry of M(II)-Monensinates in Their Competition Reactions

1
Department of Inorganic and Analytical Chemistry, University of Szeged, 6720 Szeged, Hungary
2
Research & Development Department, Biovet Ltd., 4550 Peshtera, Bulgaria
3
Laboratory of Biocoordination and Bioanalytical Chemistry, Department of Analytical Chemistry, Faculty of Chemistry and Pharmacy, “St. Kl. Ohridski” University of Sofia, 1164 Sofia, Bulgaria
*
Author to whom correspondence should be addressed.
Inorganics 2023, 11(8), 334; https://doi.org/10.3390/inorganics11080334
Submission received: 11 July 2023 / Revised: 2 August 2023 / Accepted: 8 August 2023 / Published: 13 August 2023

Abstract

:
The chirality of the polyether ionophore monensic acid A can be successfully used to study its coordination ability in solution. A complementary approach to gain new insights into the complexation chemistry of the antibiotic (studied previously by circular dichroism (CD) spectroscopy in the ultraviolet range (UV-CD)) is presented. (1) Methods: The CD spectroscopy in the visible (VIS-CD) and near-infrared (NIR-CD) range is applied to evaluate the affinity of deprotonated monensic acid A (monensinate A) towards Ni(II) or Co(II) cations in methanolic solution. Competition experiments between a variety of colorless divalent metal ions for binding the ligand anion were also performed. (2) Results: The stability constants of the species observed in binary Ni(II)/Co(II)-monensinate systems and their distribution were reevaluated with the VIS- and NIR-CD techniques. The data confirmed the formation of mono and bis complexes depending on the metal-to-ligand molar ratio. The studies on the systems containing two competing divalent metal cations exclude the formation of ternary complex species but provide an opportunity to also calculate the stability constants of Zn(II), Mg(II), and Ca(II) monensinates. (3) Conclusions: The advantages of CD spectroscopy in the VIS-NIR range (“invisible” ligand and metal salts, “visible” chiral complex species) simplify the experimental dataset evaluation and increase the reliability of computed results.

Graphical Abstract

1. Introduction

The polyether ionophore monensin (monensic acid, MonH) discovered by Agtarap [1] is a well-known natural veterinary drug produced by Streptomyces cinnamonensis that prevents Eimeria coccidiosis in livestock [2]. Monensin was a target of numerous applied research [3,4,5,6,7,8,9]. In addition, it exhibits various antibacterial [10,11,12,13,14,15] and antiviral [16,17,18] activity. In some recent publications, its potential as an antitumor agent [19,20] was explored. Monensin was found to be active against various cancer cells via different mechanisms of action, such as autophagy inhibition [21], influencing cells’ signaling pathways [22,23,24,25], or enhancing reactive oxygen species (ROS) production [26,27]. The antibiotic belongs to the polyether monocarboxylic acid chemical family (Figure 1) and possesses the following important structural features: (i) “head-to-tail” cyclization through H-bonding between carboxylic and hydroxyl functions placed at both ends of its molecule; (ii) hydrophilic cage comprising internally oriented oxygen atoms; (iii) lipophilic exterior due to the alkyl substituents attached to the polyether backbone. The formed macrocycle is able to adopt a water molecule or monovalent metal cation in its cavity [28]. Crystal structures of the free monensic acid [29] as well as its Li(I) [30], Na(I) [31,32], K(I) [33], Rb(I) [34,35], and Ag(I) [30] complexes have been determined. Nuclear Magnetic Resonance (NMR) was applied to study the structure of the Na(I) [36] and Tl(I) [37] complexes. Solution studies revealed a strong preference for the antibiotic for sodium ions [38,39,40]. The entrapped Na(I) can be transferred through the lipid cell membranes both in electroneutral and electrogenic ways, explaining the antibacterial activity of monensin and its derivatives [41].
The antimicrobial mode of action of monensin appears to be sensitive to the local cation environment: it was found to be pH-dependent in the case of S. bovis [42] and is influenced by the presence of Mg(II) [43]. The latter observation can be at least partially explained by the possible interaction of monensinate with divalent metal ions, which is why we started systematic research on its complexation ability towards metal cations in different oxidation states. The studies performed led to the isolation and characterization of electroneutral coordination species whose composition and structure depend on the antibiotic form used (deprotonated monensin, Mon, or sodium monensinate, MonNa) and the nature of the target metal cation: [M(MonNa)2Cl2] (M = Mn(II), Co(II), Cu(II)) [44,45]; [M(Mon)(H2O)] (M = Hg(II)) [46]; [M(Mon)2(H2O)2] (M = Mg(II), Ca(II), Mn(II), Co(II), Ni(II), Cu(II), Zn(II), Cd(II)) [47,48,49,50]. A limited number of publications on the possible interaction of divalent metal ions with monensin is available in the literature [51,52,53,54,55,56]. Recent studies using synchrotron radiation circular dichroism spectroscopy in the ultraviolet wavelength range (UV-CD) have revealed that it can be successfully applied to evaluate the properties of monensinate complexes with M(I) and M(II) in methanolic solutions. The main advantages of the method consist in distinguishing the individual metal ions (especially the “colorless”) thanks to the conformational changes (albeit in some cases very fine) in the monensinate structure occurring upon complexation [57,58]. Moreover, the solution chemistry of the antibiotic in the presence of di- and trivalent metal cations seems to be much more intricate, involving a number of equilibria in which diverse coordination species may exist in addition to the already observed and isolated ones. Thus, at comparable or higher metal-to-ligand molar ratio, the ionophore is bound as [M(Mon)(H2O)]+ (M = Mg(II), Ca(II), Mn(II), Co(II), Ni(II), Zn(II), Cd(II)) [58]. The close CD spectral features of neutral and charged species imply that the monensinate anion retains its coordination mode similarly to that observed in [M(Mon)2(H2O)2]. The structure elucidation of the positively charged coordination compounds is still in progress, but their detection for the first time in solution was only possible by the explicit use of the UV-CD methodology. Although strong enough to discriminate, at a quality level, the binding of alkali and some divalent metal cations to monensinate anion, UV-CD spectroscopy has been found to display disadvantages in probing the competitive reactions between certain individual metal cations and the ionophore due to the small spectral difference between the corresponding neutral and positively charged complex species (leading to an increase in uncertainty from a quantification point of view).
To overcome the drawbacks that limit the reliable application of UV-CD for quantitative purposes in these systems, we developed a complementary approach based on CD-spectroscopy in the visible (VIS-CD) and near-infrared (NIR-CD) wavelength range. Our strategy implements the complexation of monensin with the “colored” cations of nickel(II) and cobalt(II), which, as will be shown later, exhibit well-defined and distinct spectral patterns when bound as [M(Mon)(H2O)]+ and [M(Mon)2(H2O)2], respectively. The observed properties of the mono- and bis-monensinates of Ni(II) and Co(II) were further exploited to study the competition with divalent metal cations of Mg(II), Ca(II), and Zn(II). Using the combined set of UV-, VIS-, and NIR-CD data, we shed new light on the properties of the divalent metal complexes of monensinate in methanolic solutions.

2. Results and Discussion

Due to the chirality of monensin molecules, circular dichroism spectroscopy is a useful method for studying its interactions in methanolic solutions. As an ionophore, monensin forms various complexes with metal ions. While the species containing colorless metal ions can be primarily studied using UV radiation, the colored metal ions can be chirally perturbed by the ligand and, thus, may exhibit optical activity in the range of the d-d electronic transitions. The appearance of a non-zero CD intensity in the wavelength region of the visible light unequivocally proves the interaction between the metal ion and monensinate anion, as none of these components produces a measurable CD spectrum by itself. This fact simplifies the evaluation of the spectral series recorded during the titration experiments varying the molar ratio of the ligand and the metal ion.

2.1. Binary Systems of Monensinate with Ni(II) or Co(II)

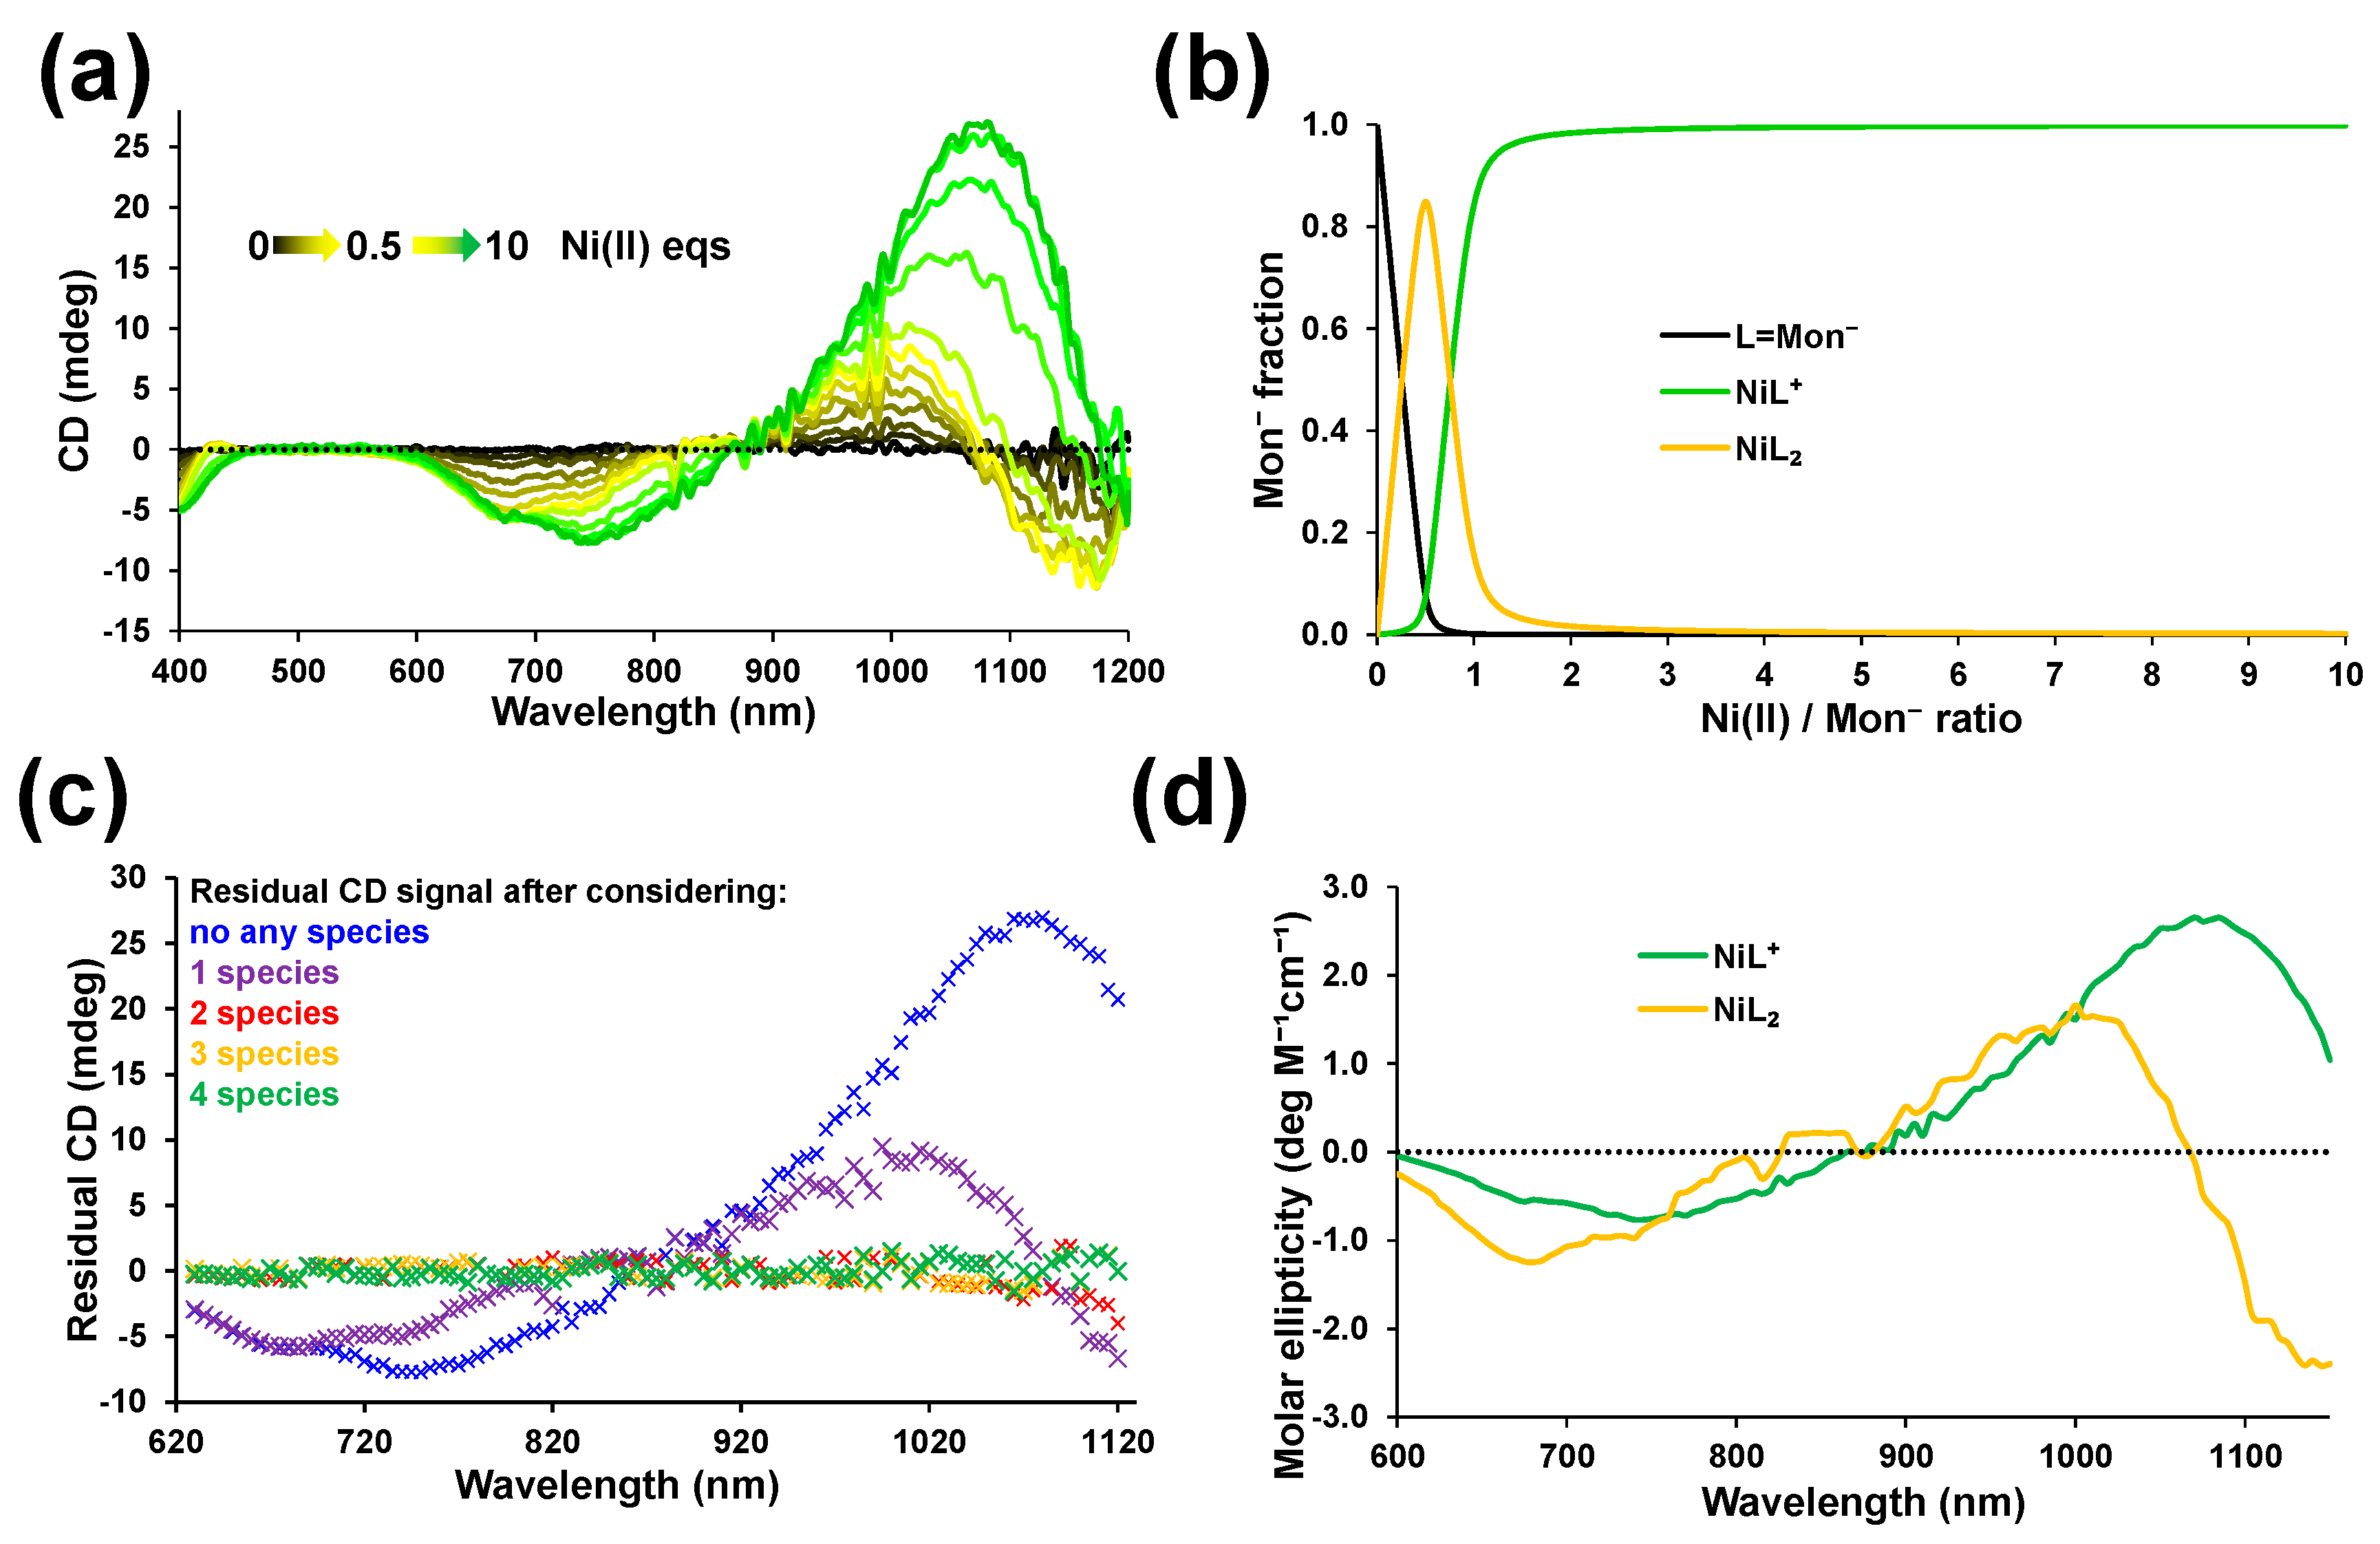
2.1.1. Interactions with Ni(II)

The stability of Ni(II) monensinates was found to be several orders of magnitude higher than that of other divalent metal complexes when evaluated with UV-CD spectroscopy [58]. This extremely high stability did not check up with the competitive properties of Ni(II) for monensinate. An ambiguity of the computed UV-CD data may, however, arise from the similarity of the spectra of the mono and bis complexes normalized to their ligand content. In the UV region, the main contribution to the optical activity is provided by the ligand itself, and, seemingly, its conformation is very similar when it is coordinated to the same metal ion, independent of the composition of the formed species. In order to overcome this shortcoming, we performed CD measurements using VIS and NIR radiation in the range from 400 to 1200 nm titrating monensinate anion (obtained by adding one equivalent of tetramethyl ammonium hydroxide (TMAOH) to MonH) with Ni(II) ions. The advantage of the extended range CD spectra is that it increases the number of useful (non-zero intensity) data points. The PSEQUAD program [59] fits the experimental changes of the absorbances vs. the changes of the concentrations instead of fitting the spectral pattern. These CD titration curves may have very different shapes at various wavelengths, which might be of advantage in complicated systems where certain species contribute to spectral changes at different wavelengths. This is not the case in binary systems, but it helps the evaluation of the competition experiments of metal ions forming colored complexes. To the best of our knowledge, this is the first experiment carried out in such broad wavelength ranges.
The spectra demonstrate substantial changes both in their shape and intensity during the titration, as shown in Figure 2a. While in the presence of excess monensinate, there are spectral minima at ~680 nm and ~1200 nm and a spectral maximum at ~990 nm, the picture changes to observe a minimum at ~750 nm and a maximum at ~1080 nm at Ni(II) ions excess.
The evaluation of the spectral data matrix by the MRA (matrix rank analysis) program [61] suggests that the consideration of only two species is enough to fully describe the experimental data (Figure 2c). These two species are [Ni(Mon)2(H2O)2] and [Ni(Mon)(H2O)]+ bis and mono complexes, respectively. By evaluating the visible and the NIR spectral ranges of the CD measurements together using the PSEQUAD program [59], the obtained apparent stabilities for the mono and bis complexes were logβ’ = 5.94 ± 0.07 and logβ’ = 9.81 ± 0.11, respectively. These data differ substantially from the previously published values but are more reliable due to the significant difference in the CD spectral patterns of the two colored complex species formed in the solution (Figure 2d). The distribution diagram of the system using the recalculated conditional stability constants is presented in Figure 2b. It shows that the major species at metal ion content close to the half equivalent of Ni(II) compared to the ligand is the [Ni(Mon)2(H2O)2] bis complex, while at metal ion excess, the quantitative formation of the mono complex is observed.
The visible and NIR-range absorbance measurements were also applied to study this system in addition to CD spectroscopy. The spectra, however, proved to be highly unstructured, and as such, they are not applicable for the study of Ni(II) (as well as Co(II), see below) complexes of monensinate due to the low sensitivity of spectrophotometry towards the formation of ML+ and ML2 complex species of these two transition metal ions (Figure S1). In the spectrophotometric titrations, the main contribution to the absorbance data is provided by the metal ions, as confirmed by the MRA evaluations (Figure S1b–d). This suggests that the spectra of the complexes are very similar to that of the uncomplexed metal ions.

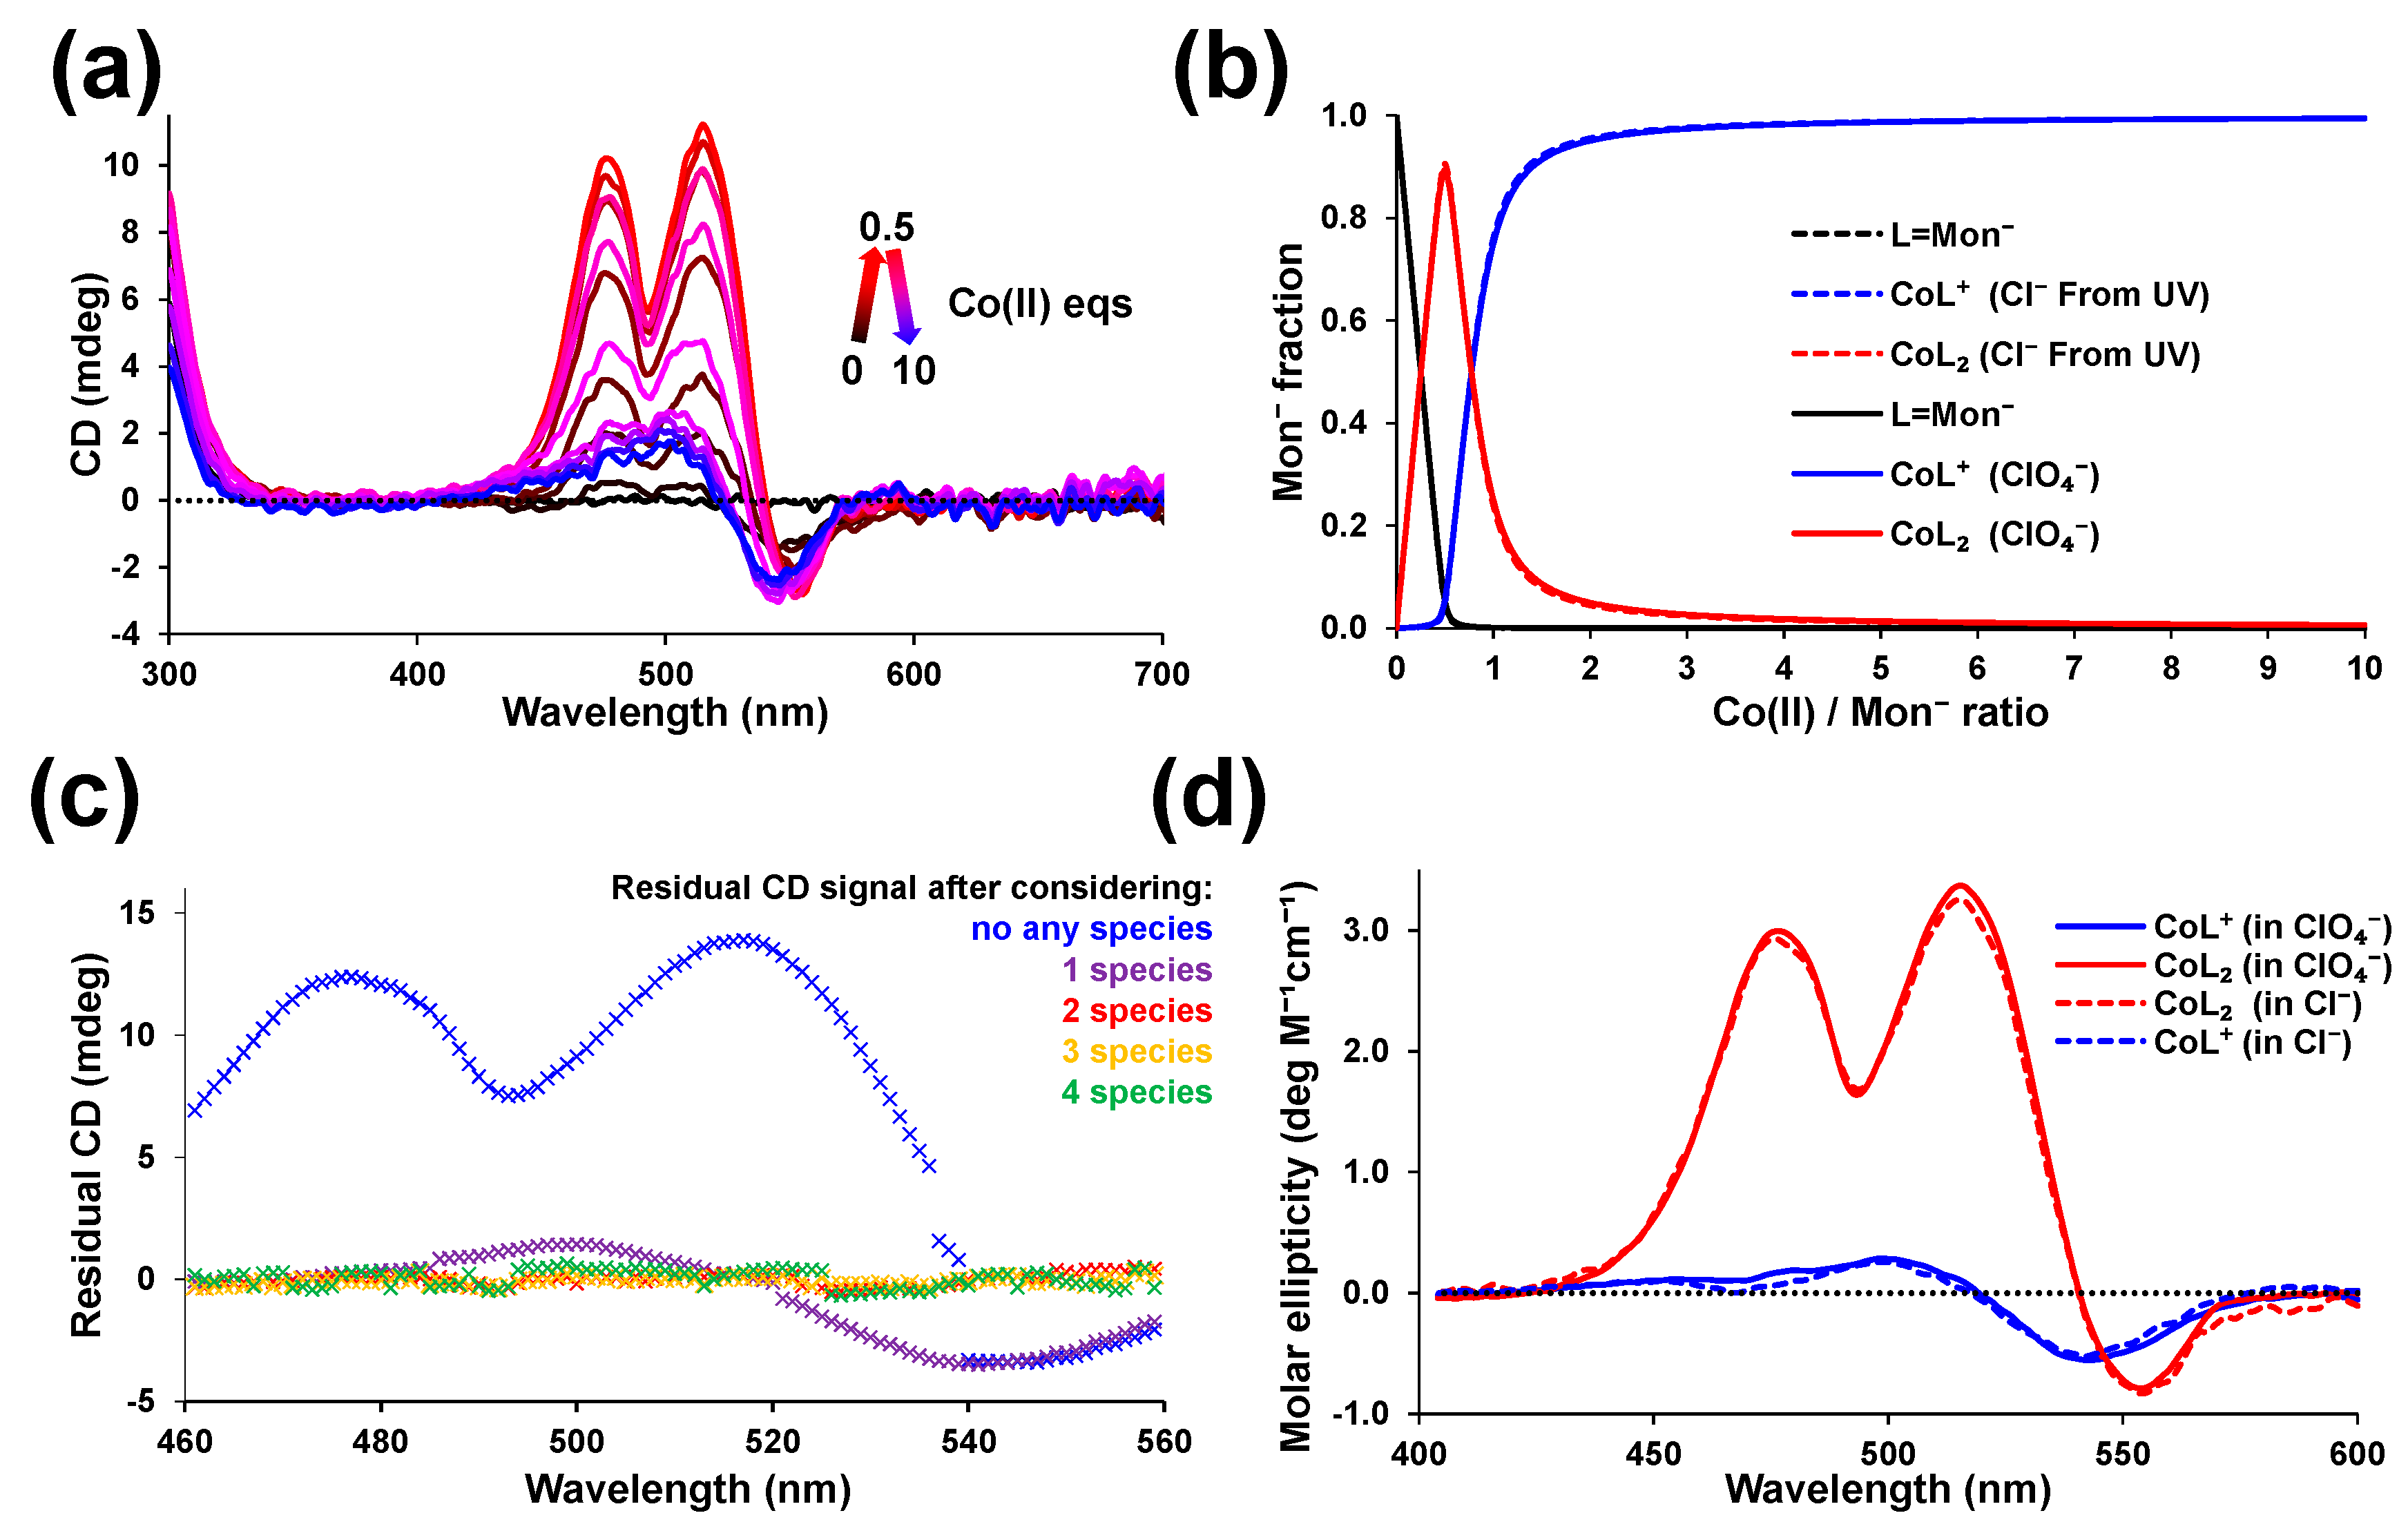
2.1.2. Interactions with Co(II)

The observed significant difference between the stability constants of the Ni(II)-monensinate species obtained by UV- and VIS/NIR-CD measurements prompted us to reevaluate the Co(II)-monensinate system as well. According to the characteristic light absorption of Co(II) complexes containing O-donor atoms, the CD measurements were performed in the range of 400–800 nm. During the titration of monensinate with Co(II) ions, the CD spectra containing two positive (~476 nm, ~515 nm) and one negative (~554 nm) bands were registered, with their intensity increasing up to the addition of 0.5 eqs of Co(II). These data agree well with the formation of the bis complex between Co(II) and monensinate (Figure 3a). By adding further Co(II) portions, the intensity of the spectra decreased, and a new spectral pattern appeared with a single local maximum (~498 nm) and a single local minimum (~543 nm). Similarly to Ni(II) complexes, the MRA evaluation of the Co(II) titration data suggested that the consideration of only two chirally active species, i.e., [Co(Mon)2(H2O)2] and [Co(Mon)(H2O)]+ is enough to describe the system (Figure 3c). This is also supported by the appearance of an isodichroic point around 550 nm in the range of the 0.5–10.0 equivalents of the added Co(II).
In contrast to Ni(II), for the Co(II)-monensinate system, the stability constants determined from the visible range show a good resemblance to the values calculated from the UV-CD data (Table 1). Thus, in line with the already known [58], a species distribution diagram can be drawn (Figure 3b). Nevertheless, the precision of these reevaluated data is better compared to that calculated previously. The molar ellipticity spectra computed for the bis and mono complexes correspond well with the spectra recorded at 0.5 eqs and 10 eqs Co(II) excess, respectively (Figure 3d).
In earlier experiments, we noticed that chloride anions exhibit significant affinity for binding Co(II) cations in methanol, as it was detected by UV-VIS spectrometry using 100 mM salt solutions (data not shown). Therefore, we studied the interaction of monensinate with CoCl2 and Co(ClO4)2, but no significant difference in the stability constants values or in the pattern of the molar CD spectra (Figure 3d) was observed. This means that Cl cannot compete for the metal ion with monensinate anion. In spite of the fact that a free coordination site is available around the metal ion in the ML+ complex, the Cl ion did not even alter the CD spectrum of the ML+ complex, as compared with the spectrum obtained in the presence of Co(ClO4)2. It suggests that the interaction with the counterion occurs only in a more concentrated solution.

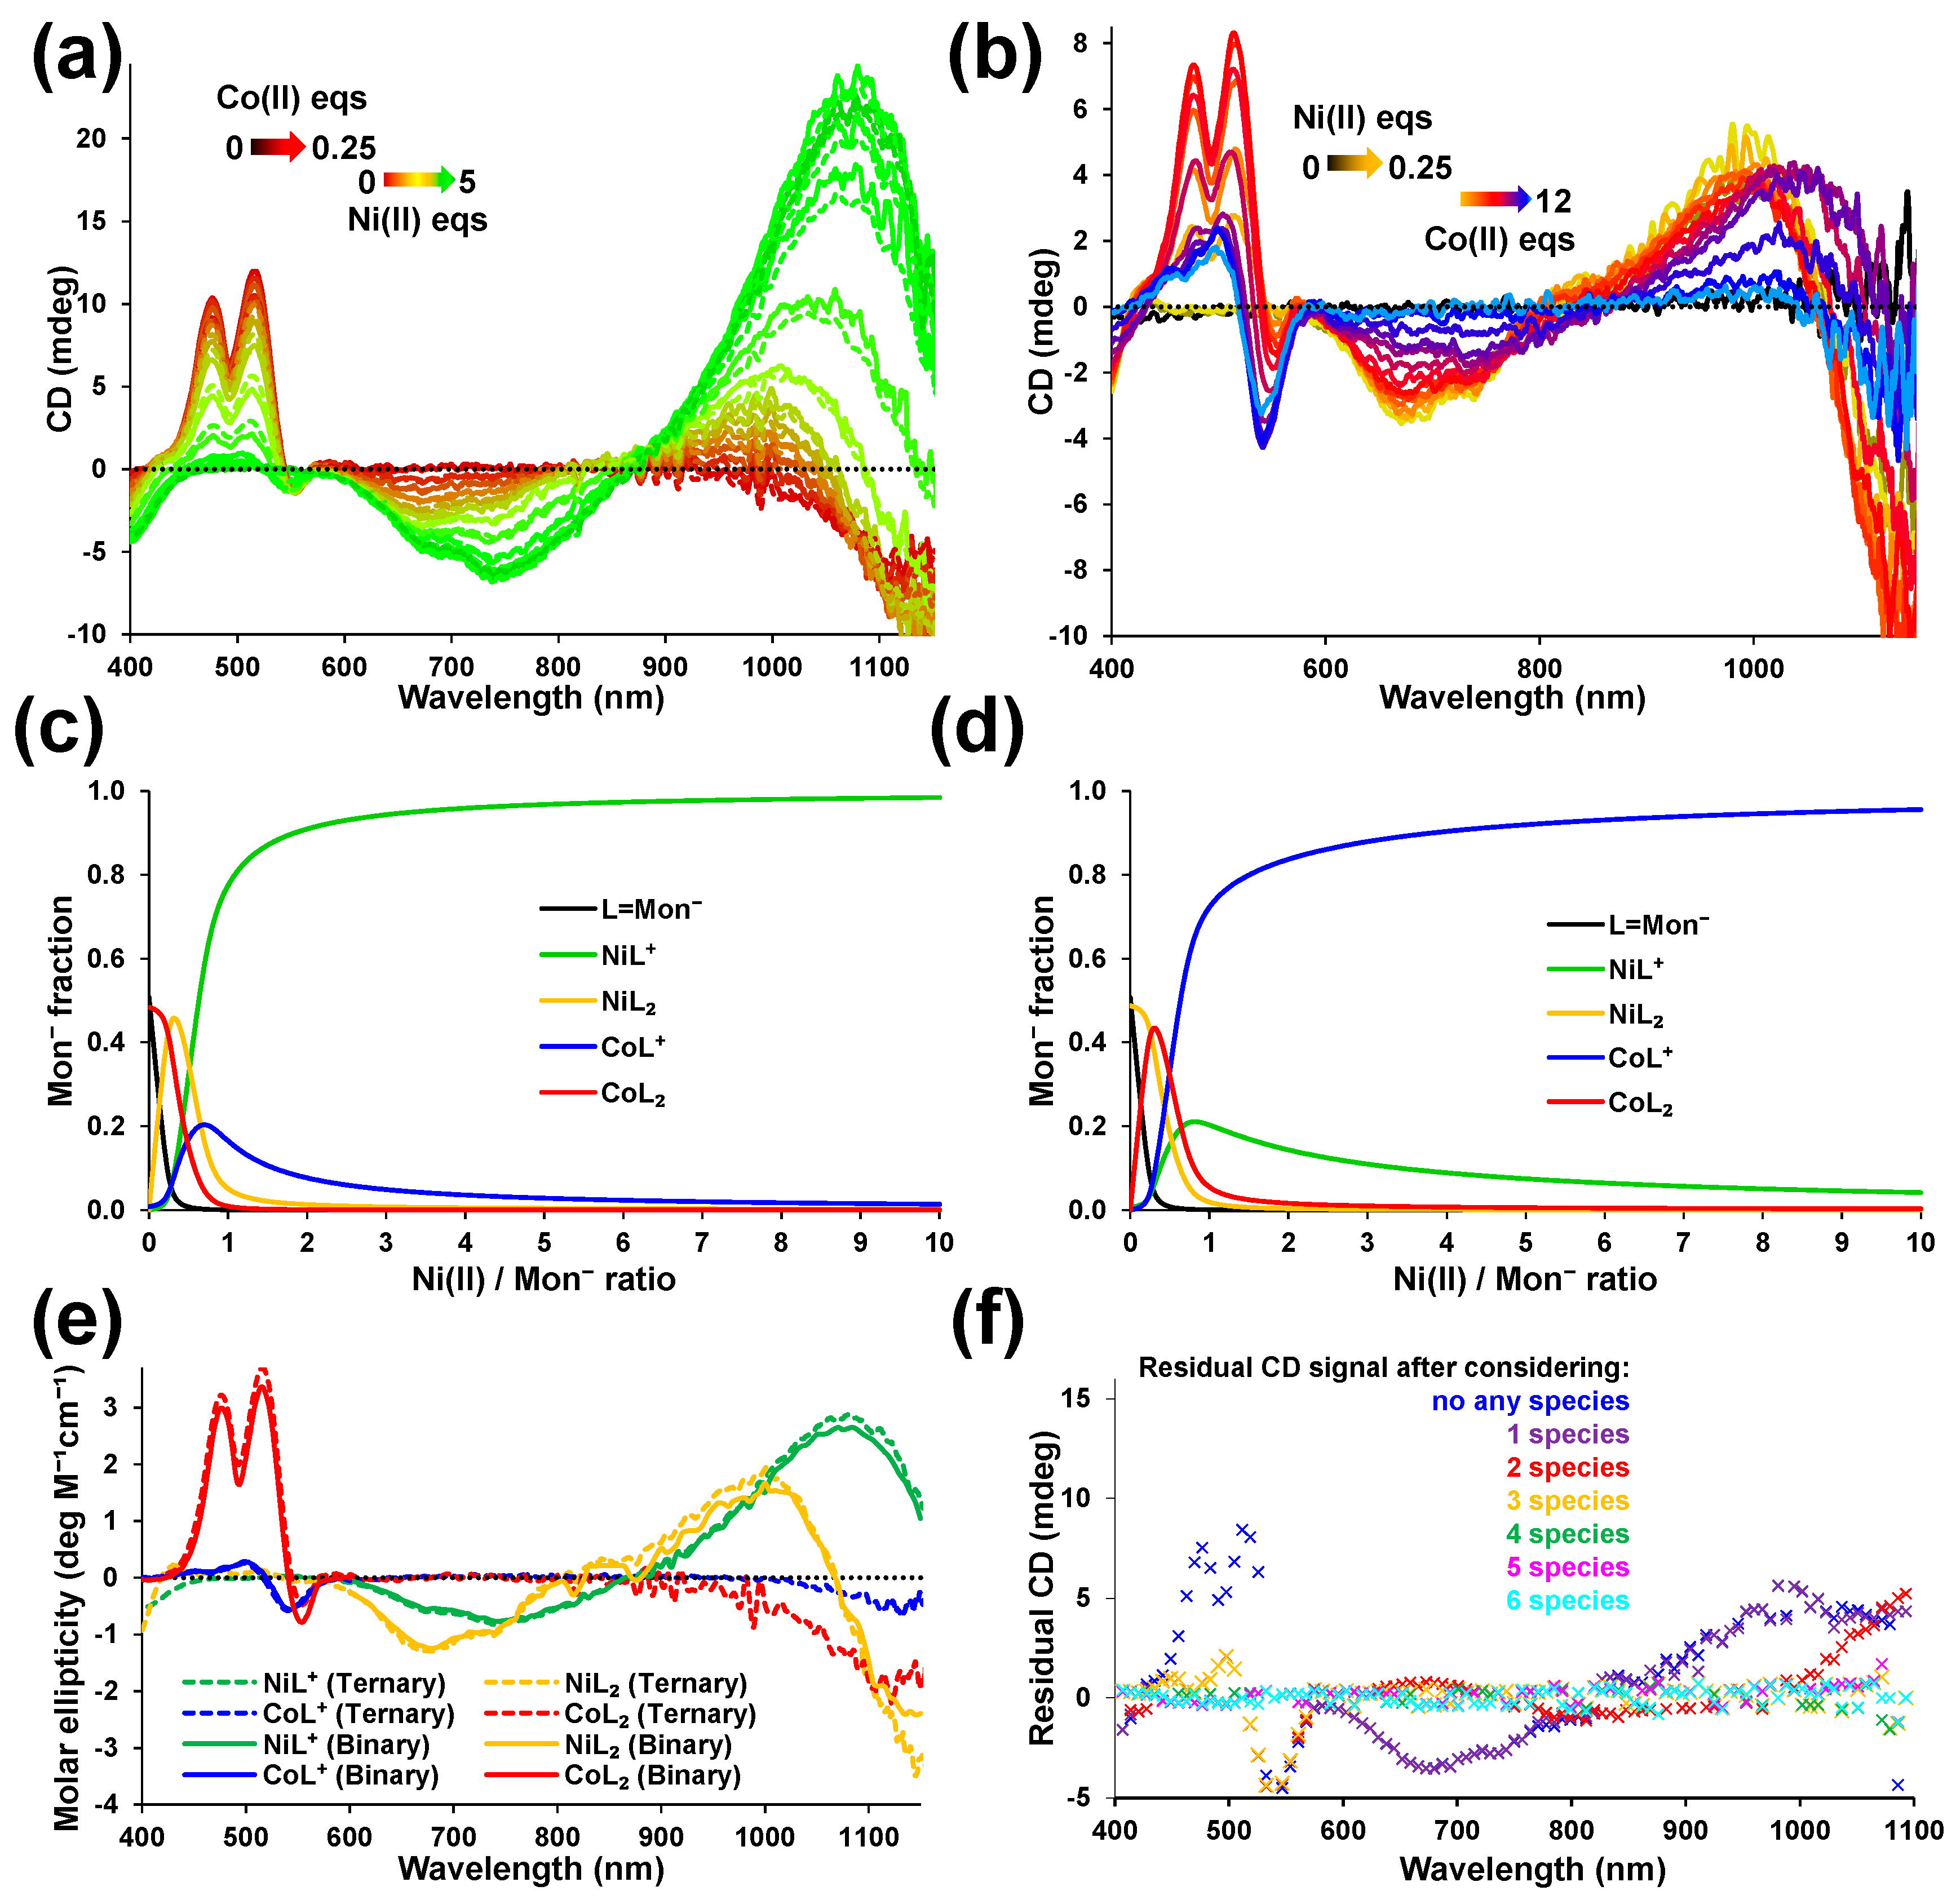
2.2. Competition between Ni(II) and Co(II) for Monensinate

After characterization of the binary systems, we performed experiments in the ternary systems containing monensinate, Ni(II), and Co(II) to check whether the new stability constants data can be applied to describe the competition between the metal ions for the ligand anion. In these experiments, the first 0.25–0.3 equivalents of Co(II) or Ni(II) were added to monensinate, and then these systems were titrated with increasing equivalents of the other metal ion. The changes were followed by CD spectroscopy in the 400–1200 nm range (Figure 4a,b). In this system, one can observe the NIR bands related to the Co(II) complexes. However, these are not characteristic, and therefore, we did not carry out measurements in this range in the binary system. However, since the Ni(II) complexes exert characteristic bands here, this range was also included in the competition experiments with Co(II). The two titration series could be well fitted simultaneously by the apparent stability constants determined for the binary Co(II) and Ni(II)-monensinate systems. The spectral intensities were allowed to refine during the calculations. As a result of these experiments, the measured (solid lines) and the calculated (dashed lines) spectra showed almost the same pattern at all titration points (Figure 4a,b). This observation was further supported by the fact that the molar CD spectra calculated for the modeled ternary systems are the same as those obtained from the corresponding binary systems (Figure 4e).
Based on these findings, it can be concluded that no ternary complex formation with chiral properties occurs at a level higher than the reliably detectable 10% in the course of the titrations. Nevertheless, the inclusion of all the mono and bis complexes (for both Ni(II) and Co(II)) was necessary to use to properly describe the experimental data. This is also clearly reflected in the MRA residual intensity curves, which do not become equal to the random noise until the fourth species is assumed to be present in the system (Figure 4f). These experiments proved that the competition reactions are useful to characterize the solution equilibria in the ternary systems of various metal ions and monensinate. Thus, such measurements can be applied in the studies of the monensinate complexes of colorless metal ions in competition with colored metal ions.

2.3. Competition between Ni(II) or Co(II) and Colorless Divalent Metal Ions for Monensinate

The colored Co(II) or Ni(II) monensinate complexes provide a chance to evaluate the complex formation of otherwise spectroscopically silent metal ions such as Zn(II), Ca(II), and Mg(II) in the wavelength range of the visible light (Figure 5). From a biological perspective, the study of Zn(II)-monensinate interactions is essential since Zn(II) is one of the most abundant transition metals in living organisms.
While evaluating the titrations of the Co(II)-monensinate system with colorless metal ions, the species matrix for the calculations shall be constructed with great care. The minimal number of species necessary to describe the formation processes cannot be decided by the MRA procedure since not all the complex species exert CD spectrum in the visible range in these systems. The fraction of the colorless species can only be deduced from the ratio of the complexes of the colored competitor. The goodness of fit significantly decreased in the case of Zn(II) and Mg(II) if only the mono-complex formation with the colorless metal ions was assumed (Figure S2). Therefore, in each case, the presence of both mono and bis complexes was also suggested (Table 2), similar to the competition reactions between Co(II) and Ni(II) ions.
The data presented in Table 2 are somewhat different from the stability data calculated previously from the UV-CD spectra. The study of the Ca(II) complexes is surprisingly successful by these competition experiments in spite of the lack of the CD spectra of these species. Here, we were able to determine the stabilities of both mono and bis complexes of Ca(II) in contrast to the previous results.
In the knowledge of the conditional stability values of the Zn(II)-monensinate complexes, it was also possible to evaluate the Ni(II)/Zn(II) and Zn(II)/Ni(II) competitive titrations as well, with an acceptable error. Based on the above data, no ternary complex formation was observed in either the Co(II)/Zn(II) or in the Ni(II)/Zn(II) containing systems (Figure 6).

3. Materials and Methods

3.1. Materials

Sodium monensinate A (MonNa) was supplied by Biovet Ltd. (Bulgaria), and monensic acid A was prepared as described earlier [62]. The substances were dissolved in pure analytical-grade methanol (VWR, Avantor, Hungary). Before CD-spectroscopic titrations, 1 equivalent of tetramethylammonium hydroxide (TMAOH) was added to the samples to deprotonate the carboxylic group of the ligand. The concentration of TMAOH was determined by acid–base titration.
The analytical grade metal(II) salts (CaCl2, MgCl2, CoCl2·6H2O, Co(ClO4)2·6H2O, Ni(ClO4)2·6H2O, Zn(ClO4)2·6H2O) were purchased from Sigma-Aldrich Chemie GmbH (Schnelldorf, Germany). Metal stock solutions were prepared in methanol, and the exact concentrations were determined by classical complexometric titrations using ethylenediamine tetraacetic acid.

3.2. CD Spectroscopy

A Jasco J-1500 spectrophotometer (JASCO Corporation, Tokyo, Japan) was used for circular dichroism spectroscopic measurements. A constant nitrogen flow was continuously applied during the experiments. In the wavelength range of 180–330 nm, utilized for determination of monensinate concentration, stepwise scanning mode was used, while within 300–1200 nm, the measurements were performed in a continuous scanning mode at 200 nm/min speed. In each measurement, 2 s response time was applied with 1 nm resolution. The samples were measured in 0.2 mm cylindrical quartz cuvette (Hellma, Müllheim, Germany) in the UV range and in 1 cm standard cuvettes in the visible range. Based on the intensity of the spectra, 3–10 accumulations were averaged. The PSEQUAD program was used for fitting the CD spectra and for calculations of the stability constants, species distribution diagrams, and molar CD spectra of the complexes [59].

3.3. Mathematical Treatment of the Experimental Data

Programs for the calculations of the stability constant fit the experimental data in an iterative approach based on the mass balance equations. Thus, the output strongly depends on the species matrix applied for the calculations. An unsatisfactory model will lead to distorted values of the stability constants and molar intensities (absorbance, ellipticity, etc.). When too many species are hypothesized, this also may happen since the increasing number of fitted parameters usually improve the overall fitting parameter, although these species may be present in negligible amounts. To make the decision about the number of independent species more straightforward, we carried out a matrix rank analysis (MRA) procedure with the CD data obtained for individual systems. This kind of treatment has the advantage that it is fully independent of chemical preconceptions. At the same time, large data sets, including more reliable chemical information, are difficult to handle without computer programs. The MRA program [61] applied by us was optimized to treat such large data matrices. In addition to the calculation of eigenvalues, the significance that depends on the initial estimation of the standard error of the measured data, this program provides the so-called residual intensity curves upon hypothesizing the presence of 0, 1, 2, … n species with independent intensity patterns. The procedure is based on the gradual elimination of the rows and/or columns of the data matrix. Briefly, after the (i–1)th elimination step, the P vector is calculated, and its ith element has the largest absolute value of the remainder intensity. A serial number of a row and column or directly the applied independent variables related to these numbers (i.e., the wavelength or the concentration) can be assigned to these elements. With m being the number of assumed independent species, we calculate Pm+1. Omitting this row (or column) and carrying out MRA again, the second most important row (or column) is found, and so on. The resulting Pm+1 can be plotted as it is shown in Figure 2c, Figure 3c, and Figure 4f. This means that the residual intensity curve in the procedure assuming m = 0 carries the total recorded intensity. When m = 1, 2, 3, … the intensity values related to the 1st, 1st, and 2nd, first three, … species are eliminated, respectively. The residual intensities belong to the remaining species. If a residual intensity curve has a random behavior, i.e., no systematic deviation from the zero line is observed, there is no need for consideration of further species. While this can be clearly observed in the figures, for justification of the results, we also carried out two sample F-tests on pairs of residual curves to see whether their deviations differ or not. The detailed results of these calculations are described in Figure S3.

4. Conclusions

Circular dichroism spectroscopy proved to be a useful tool for studying the complex formation of monensinate in solution. At the same time, the absorption spectra recorded in the visible range are unstructured, and their MRA analysis shows fewer colored species than were revealed by CD spectroscopy. The complementary CD measurements in the wavelength interval of the visible light allowed for accurate determination of the apparent stability constants of the mono and bis complexes formed with Ni(II) and Co(II) directly and with Zn(II), Mg(II), and Ca(II) indirectly through competition reactions. The newly determined constants reveal that Ni(II), Co(II), and Zn(II) complexes possess comparable stability with logβ’(ML) ~6 and logβ’(ML2) ~10, while Mg(II) and Ca(II) display lower stability with logβ’(ML) ~5 and logβ’(ML2) ~8. The data suggest that the impact of these divalent metal ions on the biological performance of monensin A shall be proportional to their local concentrations available for complex formation.

Supplementary Materials

The following supporting information can be downloaded at: https://www.mdpi.com/article/10.3390/inorganics11080334/s1, Figure S1: Representative spectroscopic titration of monensinate with (a) Ni(ClO4)2, (c) Co(ClO4)2, (e) CoCl2; cMonH = cTMAOH = 10.0 mM. Residual absorbance spectra obtained by the matrix rank analysis of Ni(ClO4)2, Co(ClO4)2, and CoCl2 titrations are plotted in panels (b), (d), and (f), respectively, assuming 0–4 absorbing species. The insets represent the magnified residual absorbance spectra assuming 1–4 absorbing species. Figure S2: Evaluation of the competition experiments of colorless divalent metal ions (Zn(II), Mg(II), and Ca(II)) with Co(II) for monensinate, assuming the formation of only mono complexes with the colorless metals. The insets represent the measured (solid) and simulated (dashed) CD spectra of titrations with (a) Zn(II), (c) Mg(II), and (e) Ca(II). cMonH = cTMAOH = 11.02 mM; 0.5 eqs Co(ClO4)2. The decrease of the ellipticity values at 512 nm, attributable to the decomposition of the CoL2 complex upon the addition of Zn(II), Mg(II), and Ca(II) ions, are plotted in panels (b), (d), and (f), respectively. Measured data points are represented by blue × symbols, while the black solid lines show the fitted titration curves based on PSEQUAD calculations. Figure S3: (a) Two sample F-tests carried out in a pairwise manner on the residual CD intensity curves obtained for the Ni(II)-monensinate system (one-tail evaluation, α = 0.05). Each residual intensity curve calculated by assuming m species was compared to the one assuming the maximal number of the species during the calculations. Here, the ratio of the calculated F-values and F critical value obtained from F statistics table was plotted vs. the number of assumed independent species. The values below 1.0 suggest that there is no significant difference between the variances of the compared data. The inset represents the enlarged plot with the value of 1.0 in the focus. (The labels of the axes are the same as the main figure.) Based on this evaluation, the curves obtained by assuming 0 and 1 species clearly differ from those assuming four species. This shows that including 0 or 1 chiral species is not enough to describe the data. The value calculated by assuming 3 species does not differ from that of containing 4 species, indicating that both represent the variance of the CD measurement itself without any chiral species. The relationship of the values obtained by assuming 2 and 4 species is ambiguous. F/Fcrit is around 1.0, but slightly higher. (b) The enlarged version of the residual CD intensity curves from Figure 2 of the main text, centered around the zero line. That lack of the systematic deviation of the data calculated assuming the presence of two independent chiral species from the zero value is clearly observed. It suggests that in spite of the statistical analysis giving a hint of the third species, it shall not be included in the further evaluation. The tendency of the F/Fcrit values is also in agreement with this suggestion.

Author Contributions

Conceptualization, I.P., B.H. and B.G.; investigation, B.H. and M.L.K.; synthesis of the ligand: I.P. and P.D.; data curation, B.H. and B.G.; Data evaluation: M.L.K. and B.H.; writing—original draft preparation, I.P., B.H. and B.G.; writing—review and editing, I.P., B.H. and B.G.; funding acquisition, B.H. and B.G. All authors have read and agreed to the published version of the manuscript.

Funding

This research was funded by the UNKP-21-3-SZTE-432 and ÚNKP-22-4-SZTE-491 New National Excellence Program of the Ministry for Culture and Innovation from the source of the National Research, Development, and Innovation Fund and by the Hungarian National Research, Development, and Innovation Office (GINOP-2.3.2-15-2016-00038, 2019-2.1111-TÉT-2019-00089, and K_16/120130). The support of ERASMUS+ is also acknowledged (M.L.K.).

Data Availability Statement

Not applicable.

Conflicts of Interest

The authors declare no conflict of interest. The funders had no role in the design of the study, in the collection, analyses or interpretation of data, in the writing of the manuscript, or in the decision to publish the results.

References

  1. Agtarap, A.; Chamberlin, J.W.; Pinkerton, M.; Steinrauf, L. The structure of monensic acid, a new biologically active compound. J. Am. Chem. Soc. 1967, 89, 5737–5739. [Google Scholar] [CrossRef]
  2. Chapman, H.D.; Jeffers, T.K.; Williams, R.B. Forty years of monensin for the control of coccidiosis in poultry. Poult. Sci. 2010, 89, 1788–1801. [Google Scholar] [CrossRef]
  3. Wischer, G.; Boguhn, J.; Steingaß, H.; Schollenberger, M.; Hartung, K.; Rodehutscord, M. Effect of monensin on in vitro fermentation of silages and microbial protein synthesis. Arch. Anim. Nutr. 2013, 67, 219–234. [Google Scholar] [CrossRef]
  4. Odongo, N.E.; Bagg, R.; Vessie, G.; Dick, P.; Or-Rashid, M.M.; Hook, S.E.; Gray, J.T.; Kebreab, E.; France, J.; McBride, B.W. Long-term effects of feeding monensin on methane production in lactating dairy cows. J. Dairy Sci. 2007, 90, 1781–1788. [Google Scholar] [CrossRef] [PubMed] [Green Version]
  5. de Jesus, E.F.; Del Valle, T.A.; Calomeni, G.D.; Silva, T.H.; Takiya, C.S.; Vendramini, T.H.A.; Paiva, P.G.; Silva, G.G.; Netto, A.S.; Rennó, F.P. Influence of a blend of functional oils or monensin on nutrient intake and digestibility, ruminal fermentation and milk production of dairy cows. Anim. Feed Sci. Technol. 2016, 219, 59–67. [Google Scholar] [CrossRef] [Green Version]
  6. Ghorbani, B.; Ghoorchi, T.; Amanlou, H.; Zerehdaran, S. Effects of using monensin and different levels of crude protein on milk production, blood metabolites and digestion of dairy cows. Asian-Australas. J. Anim. Sci. 2011, 24, 65–72. [Google Scholar] [CrossRef]
  7. Rezaei Ahvanooei, M.R.; Norouzian, M.A.; Piray, A.H.; Vahmani, P.; Ghaffari, M.H. Effects of monensin supplementation on lactation performance of dairy cows: A systematic review and dose-response meta-analysis. Sci. Rep. 2023, 13, 568. [Google Scholar] [CrossRef] [PubMed]
  8. Suzuki, K.; Tohda, K.; Aruga, H.; Matsuzoe, M.; Inoue, H.; Shirai, T. Ion-selective electrodes based on natural carboxylic polyether antibiotics. Anal. Chem. 1988, 60, 1714–1721. [Google Scholar] [CrossRef]
  9. Zahran, E.M.; Gavalas, V.; Valiente, M.; Bachas, L.G. Can temperature be used to tune the selectivity of membrane ion-selective electrodes? Anal. Chem. 2010, 82, 3622–3628. [Google Scholar] [CrossRef]
  10. Lowicki, D.; Huczynski, A. Structure and antimicrobial properties of monensin A and its derivatives: Summary of the achievements. Biomed. Res. Int. 2013, 2013, 742149. [Google Scholar] [CrossRef] [Green Version]
  11. Greenstein, R.J.; Su, L.; Whitlock, R.H.; Brown, S.T. Monensin causes dose dependent inhibition of Mycobacterium avium subspecies paratuberculosis in radiometric culture. Gut. Pathog. 2009, 1, 4. [Google Scholar] [CrossRef] [PubMed] [Green Version]
  12. Mimouni, M.; Khardli, F.Z.; Warad, I.; Ahmad, M.; Mubarak, M.S.; Sultana, S.; Hadda, T.B. Antimicrobial activity of naturally occurring antibiotics monensin, lasalocid and their metal complexes. J. Mater. Environ. Sci. 2014, 5, 207–214. [Google Scholar]
  13. Hendrick, S.H.; Kelton, D.F.; Leslie, K.E.; Lissemore, K.D.; Archambault, M.; Bagg, R.; Dick, P.; Duffield, T.F. Efficacy of monensin sodium for the reduction of fecal shedding of Mycobacterium avium subsp. paratuberculosis in infected dairy cattle. Prev. Vet. Med. 2006, 75, 206–220. [Google Scholar] [CrossRef]
  14. Rajendran, V.; Rohra, S.; Raza, M.; Hasan, G.M.; Dutt, S.; Ghosh, P.C. Stearylamine liposomal delivery of monensin in combination with free artemisinin eliminates blood stages of Plasmodium falciparum in culture and P. berghei infection in murine malaria. Antimicrob. Agents Chemother. 2015, 60, 1304–1318. [Google Scholar] [CrossRef] [Green Version]
  15. Lavine, M.D.; Arrizabalaga, G. Analysis of monensin sensitivity in Toxoplasma gondii reveals autophagy as a mechanism for drug induced death. PLoS ONE 2012, 7, e42107. [Google Scholar] [CrossRef] [Green Version]
  16. Lad, V.J.; Gupta, A.K. Effect of brefelidin A and monensin on Japanese encephalitis virus maturation and virus release from cells. Microbiol. Res. 2011, 2, e9. [Google Scholar] [CrossRef] [Green Version]
  17. Feneant, L.; Potel, J.; Francois, C.; Sane, F.; Douam, F.; Belouzard, S.; Calland, N.; Vausselin, T.; Rouille, Y.; Descamps, V.; et al. New insights into the understanding of Hepatitis C virus entry and cell-to-cell transmission by using the ionophore Monensin A. J. Virol. 2015, 89, 8346–8364. [Google Scholar] [CrossRef] [PubMed] [Green Version]
  18. Iacoangeli, A.; Melucci-Vigo, G.; Risuleo, G. The ionophore monensin inhibits mouse polyomavirus DNA replication and destabilizes viral early mRNAs. Biochimie 2000, 82, 35–39. [Google Scholar] [CrossRef]
  19. Rajendran, V.; Ilamathi, H.S.; Dutt, S.; Lakshminarayana, T.S.; Ghosh, P.C. Chemotherapeutic potential of monensin as an anti-microbial agent. Curr. Top. Med. Chem. 2018, 18, 1976–1986. [Google Scholar] [CrossRef]
  20. Markowska, A.; Kaysiewicz, J.; Markowska, J.; Huczyński, A. Doxycycline, salinomycin, monensin and ivermectin repositioned as cancer drugs. Bioorg. Med. Chem. Lett. 2019, 29, 1549–1554. [Google Scholar] [CrossRef]
  21. Choi, H.S.; Jeong, E.H.; Lee, T.G.; Kim, S.Y.; Kim, H.R.; Kim, C.H. Autophagy inhibition with monensin enhances cell cycle arrest and apoptosis induced by mTOR or epidermal growth factor receptor inhibitors in lung cancer cells. Tuberc. Respir. Dis. 2013, 75, 9–17. [Google Scholar] [CrossRef] [Green Version]
  22. Yao, S.; Wang, W.; Zhou, B.; Cui, X.; Yang, H.; Zhang, S. Monensin suppresses cell proliferation and invasion in ovarian cancer by enhancing MEK1 SUMOylation. Exp. Therap. Med. 2021, 22, 1390. [Google Scholar] [CrossRef] [PubMed]
  23. Tumova, L.; Pombinho, A.R.; Vojtechova, M.; Stancikova, J.; Gradl, D.; Krausova, M.; Sloncova, E.; Horazna, M.; Kriz, V.; Machonova, O.; et al. Monensin inhibits canonical Wnt signaling in human col-orectal cancer cells and suppresses tumor growth in multiple intestinal neoplasia mice. Mol. Cancer Ther. 2014, 13, 812–822. [Google Scholar] [CrossRef] [PubMed] [Green Version]
  24. Li, Y.; Sun, Q.; Chen, S.; Yu, X.; Jing, H. Monensin inhibits anaplastic thyroid cancer via disrupting mitochondrial respiration and AMPK/mTOR signaling. Anti-Cancer Agents Med. Chem. 2022, 22, 2539–2547. [Google Scholar] [CrossRef]
  25. Zhou, Y.; Deng, Y.; Wang, J.; Yan, Z.; Wei, Q.; Ye, J.; Zhang, J.; He, T.C.; Qiao, M. Effect of antibiotic monensin on cell prolifera-tion and IGF1R signaling pathway in human colorectal cancer cells. Annals Med. 2023, 55, 954–964. [Google Scholar] [CrossRef]
  26. Ketola, K.; Vainio, P.; Fey, V.; Kallioniemi, O.; Iljin, K. Monensin is a potent inducer of oxidative stress and inhibitor of androgen signaling leading to apoptosis in prostate cancer cells. Mol. Cancer Ther. 2010, 9, 3175–3185. [Google Scholar] [CrossRef] [Green Version]
  27. Kim, S.H.; Kim, K.Y.; Yu, S.N.; Park, S.G.; Yu, H.S.; Seo, Y.K.; Ahn, S.C. Monensin induces PC-3 prostate cancer cell apoptosis via ROS production and Ca2+ homeostasis disruption. Anticancer Res. 2016, 36, 5835–5843. [Google Scholar] [CrossRef] [PubMed] [Green Version]
  28. Agtarap, A.; Chamberlin, J.W. Monensin, a new biologically active compound. IV. Chem. Antimicrob. Agents Chemother. 1967, 7, 359–362. [Google Scholar]
  29. Lutz, W.K.; Winkler, F.K.; Dunitz, J.D. Crystal structure of the antibiotic monensin. Similarities and differences between free acid and metal complex. Helv. Chim. Acta 1971, 54, 1103–1108. [Google Scholar] [CrossRef]
  30. Walba, D.M.; Hermsmeier, M.; Haltiwanger, R.C.; Noordik, J.H. Crystal structures of monensin B lithium and silver salts. J. Org. Chem. 1986, 51, 245–247. [Google Scholar] [CrossRef]
  31. Duax, W.L.; Smith, G.D.; Strong, P.D. Complexation of metal ions by monensin. Crystal and molecular structure of hydrated and anhydrous crystal forms of sodium monensin. J. Am. Chem. Soc. 1980, 102, 6725–6729. [Google Scholar] [CrossRef]
  32. Almeida Paz, F.A.; Gates, P.J.; Fowler, S.; Gallimore, A.; Harvey, B.; Lopes, N.P.; Stark, C.B.W.; Staunton, J.; Klinowski, J.; Spencer, J.B. Sodium monensin dehydrate. Acta Cryst. 2003, E59, m1050–m1052. [Google Scholar] [CrossRef]
  33. Pangborn, W.; Duax, W.; Langs, D. The hydrated potassium complex of the ionophore monensin A. J. Am. Chem. Soc. 1987, 109, 2163–2165. [Google Scholar] [CrossRef]
  34. Yildirim, S.Ö.; McKee, V.; Khardli, F.Z.; Mimouni, M.; Hadda, T.B. Rubidium(I) monensinate dihydrate. Acta Cryst. 2007, E64, m154–m155. [Google Scholar] [CrossRef]
  35. Huczynski, A.; Ratajczak-Sitarz, M.; Katrusiak, A.; Brzezinski, B. Molecular structure of rubidium six-coordinated dihydrate complex with monensin A. J. Mol. Struct. 2008, 888, 224–229. [Google Scholar] [CrossRef]
  36. Turner, D.L. The conformation of the monensin-A-sodium complex in solution determined from self-consistent NOE distance constraints. J. Magn. Reson. B. 1995, 108, 137–142. [Google Scholar] [CrossRef]
  37. Briggs, R.W.; Hinton, J.F. Thallium-205 and proton nuclear magnetic resonance investigation of the complexation of thallium by the ionophores monensin and nigericin. Biochemistry 1978, 17, 55765582. [Google Scholar] [CrossRef]
  38. Cox, B.G.; van Truong, N.; Rzeszotarska, J.; Schneider, H. Rates and equilibria of alkali metal and silver ion complex formation with monensin in ethanol. J. Am. Chem. Soc. 1984, 106, 5965–5969. [Google Scholar] [CrossRef]
  39. Hoogerheide, J.G.; Popov, A.I. Study of monensin complexes with monovalent metal ions in anhydrous methanol solutions. J. Sol. Chem. 1978, 7, 357–372. [Google Scholar] [CrossRef]
  40. Hoogerheide, J.G.; Popov, A.I. A study of metal complexes of a naturally occurring macrocyclic ionophore-monensin. J. Sol. Chem. 1979, 8, 83–95. [Google Scholar] [CrossRef]
  41. Huczyński, A.; Janczak, J.; Łowicki, D.; Brzezinski, B. Monensin A acid complexes as a model of electrogenic transport of so-dium cation. Biochim. Biophys. Acta (BBA) Biomembr. 2012, 1818, 2108–2119. [Google Scholar] [CrossRef] [Green Version]
  42. Chow, J.M.; Russell, J.B. Effect of ionophores and pH on growth of Streptococcus bovis in batch and continuous culture. Appl. Environ. Microbiol. 1990, 56, 1588–1593. [Google Scholar] [CrossRef]
  43. Chirase, N.K.; Greene, L.W.; Schelling, G.T.; Byers, F.M. Effect of magnesium and potassium on microbial fermentation in a continuous culture fermentation system with different levels of monensin or lasalocid. J. Anim. Sci. 1987, 65, 1633–1638. [Google Scholar] [CrossRef] [Green Version]
  44. Dorkov, P.; Pantcheva, I.N.; Sheldrick, W.S.; Mayer-Figge, H.; Petrova, R.; Mitewa, M. Synthesis, structure and antimicrobial activity of manganese(II) and cobalt(II) complexes of the polyether ionophore antibiotic sodium monensin A. J. Inorg. BioChem. 2008, 102, 26–32. [Google Scholar] [CrossRef]
  45. Pantcheva, I.N.; Dorkov, P.; Atanasov, V.N.; Mitewa, M.; Shivachev, B.L.; Nikolova, R.P.; Mayer-Figge, H.; Sheldrick, W.S. Crystal structure and properties of the copper(II) complex of sodium monensin A. J. Inorg. Biochem. 2009, 103, 1419–1424. [Google Scholar] [CrossRef] [PubMed]
  46. Ivanova, J.; Pantcheva, I.N.; Mitewa, M.; Simova, S.; Mayer-Figge, H.; Sheldrick, W.S. Crystal structures and spectral properties of new Cd(II) and Hg(II) complexes of monensic acid with different coordination modes of the ligand. Centr. Eur. J. Chem. 2010, 8, 852–860. [Google Scholar] [CrossRef]
  47. Pantcheva, I.N.; Mitewa, M.I.; Sheldrick, W.S.; Oppel, I.M.; Zhorova, R.; Dorkov, P. First divalent metal complexes of the pol-yether ionophore monensin A: X-ray structures of [Co(Mon)2(H2O)2] and [Mn(Mon)2(H2O)2] and their properties. Curr. Drug Discov. Technol. 2008, 5, 154–161. [Google Scholar] [CrossRef]
  48. Pantcheva, I.N.; Zhorova, R.; Mitewa, M.; Simova, S.; Mayer-Figge, H.; Sheldrick, W.S. First solid state alkaline-earth complex-es of monensic A acid: X-ray crystal structure of [M(Mon)2(H2O)2] (M = Mg, Ca), spectral properties and cytotoxicity against Gram-positive bacteria. BioMetals 2010, 23, 59–70. [Google Scholar] [CrossRef] [PubMed]
  49. Pantcheva, I.N.; Ivanova, J.; Zhorova, R.; Mitewa, M.; Simova, S.; Mayer-Figge, H.; Sheldrick, W.S. Nickel(II) and zinc(II) dim-onensinates: Crystal structure, spectral properties and bactericidal activity. Inorg. Chim. Acta 2010, 363, 1879–1886. [Google Scholar] [CrossRef]
  50. Pantcheva, I.; Stamboliyska, R.; Nedzhib, A.; Dorkov, P. Spectral properties of copper(II) bis-monensinate. C. R. Acad. Bulg. Sci. 2022, 75, 519–526. [Google Scholar] [CrossRef]
  51. Hamidinia, S.A.; Shimelis, O.I.; Tan, B.; Erdahl, W.L.; Chapman, C.J.; Renkes, G.D.; Taylor, R.W.; Pfeiffer, D.R. Monensin mediates a rapid and selective transport of Pb(2+). Possible application of monensin for the treatment of Pb(2+) intoxication. J. Biol. Chem. 2002, 277, 38111–38120. [Google Scholar] [CrossRef] [Green Version]
  52. Hamidinia, S.A.; Tan, B.; Erdahl, W.L.; Chapman, C.J.; Taylor, R.W.; Pfeiffer, D.R. The ionophore nigericin transports Pb2+ with high activity and selectivity: A comparison to monensin and ionomycin. Biochemistry 2004, 43, 15956–15965. [Google Scholar] [CrossRef] [PubMed]
  53. Cox, B.G.; van Truong, N.; Rzeszotarska, J.; Schneider, H. Stability constants of complexes of monensin and lasalocid with alkali-metal and alkaline-earth-metal ions in protic and polar aprotic solvents. J. Chem. Soc. Faraday Trans. 1984, 80, 3275–3284. [Google Scholar] [CrossRef]
  54. Newbold, C.J.; Wallace, R.J.; Walker-Bax, N.D. Potentiation by metal ions of the efficacy of the ionophores, monensin and tetronasin, towards four species of ruminal bacteria. FEMS Microbiol. Lett. 2013, 338, 161–167. [Google Scholar] [CrossRef] [PubMed] [Green Version]
  55. Elsasser, T.H. Potential interactions of ionophore drugs with divalent cations and their function in the animal body. J. Anim. Sci. 1984, 59, 845–853. [Google Scholar] [CrossRef] [PubMed]
  56. Dubreuil, P.; Sauvageau, R. Intoxication chronique au cuivre chez des agneaux lourds par l’eau d’abreuvement. Can. Vet. J. 1993, 34, 428430. [Google Scholar]
  57. Nedzhib, A.; Kessler, J.; Bour, P.; Gyurcsik, B.; Pantcheva, I. Circular dichroism is sensitive to monovalent cation binding in monensin complexes. Chirality 2016, 28, 420–428. [Google Scholar] [CrossRef] [Green Version]
  58. Pantcheva, I.; Nedzhib, A.; Antonov, L.; Gyurcsik, B.; Dorkov, P. New insights into coordination chemistry of monensin to-wards divalent metal ions. Inorg. Chim. Acta 2020, 505, 119481. [Google Scholar] [CrossRef]
  59. Zékány, L.; Nagypál, I. PSEQUAD, A comprehensive program for the evaluation of potentiometric and/or spectrophotometric equilibrium data using analytical derivatives. In Computational Methods for the Determination of Formation Constants; Leggett, D.J., Ed.; Springer: New York, NY, USA, 1985; pp. 291–353. [Google Scholar] [CrossRef]
  60. Martinek, T.; Riddell, F.G.; Wilson, C.; Weller, C.T. The conformations of monensin-A metal complexes in solution determined by NMR spectroscopy. J. Chem. Soc. Perkin Trans. 2000, 2, 35–41. [Google Scholar] [CrossRef]
  61. Peintler, G.; Nagypál, I.; Jancsó, A.; Epstein, I.R.; Kustin, K. Extracting experimental information from large matrixes. 1. A new algorithm for the application of matrix rank analysis. J. Phys. Chem. A 1997, 101, 8013–8020. [Google Scholar] [CrossRef]
  62. Pinkerton, M.; Steinrauf, L.K. Molecular structure of monovalent metal cation complexes of monensin. J. Mol. Biol. 1970, 49, 533–546. [Google Scholar] [CrossRef] [PubMed]
Figure 1. Structure of monensic acid A.
Inorganics 11 00334 g001
Figure 2. (a) Titration of monensinate with Ni(II), followed by CD spectroscopy; cMonH = cTMAOH = 10.06 mM; Ni(ClO4)2 was used. (b) Species distribution diagram showing the partition of monensinate (L = Mon) calculated by the PSEQUAD program [59] from the ellipticity values recorded in the 600–1150 nm range. (c) Residual CD spectra obtained by the matrix rank analysis of the CD data matrix assuming 0–4 independent chiral species. (d) Molar ellipticity spectra of the obtained mono (NiL⁺) and bis (NiL₂) complexes from the calculations carried out by PSEQUAD. NiL⁺ represents the [Ni(Mon)(H₂O)]⁺ and NiL₂ the [Ni(Mon)₂(H₂O)₂] species (the water molecule is included in the cavity of each ligand, as it was shown previously by solution NMR experiments [46,48,49], in contrast to the complexes of monovalent metal ions, where this water molecule is replaced [60]).
Inorganics 11 00334 g002
Figure 3. (a) Representative titration of monensinate with Co(II) followed by CD spectroscopy; cMonH = cTMAOH = 9.53 mM; Co(ClO4)2 was used. (b) Species distribution diagram showing the partition of monensinate (solid lines), (L = Mon) calculated from the ellipticity values within the 400–600 nm range of three independent Co(II)-monensinate titrations by the PSEQUAD program [59]. Dashed lines represent the distribution diagram using the constants in [58]. (c) Residual CD spectra obtained by the matrix rank analysis of titrations assuming 0–4 chiral species. (d) Molar ellipticity spectra obtained for the mono and bis complexes from the PSEQUAD calculations. CoL⁺ represents the [Co(Mon)(H₂O)]⁺ mono complex, and CoL₂ the [Co(Mon)₂(H₂O)₂] bis complex.
Inorganics 11 00334 g003
Figure 4. Competition of Ni(II) and Co(II) for monensinate. The change of the CD spectra is shown by increasing the ratio of Ni(II) (a) or Co(II) (b). Measured spectra are shown by solid lines, while the spectra calculated with the help of the stability constants obtained from the binary systems are shown by dashed lines. cMonH = cTMAOH = 10.1 mM; Co(ClO4)2 and Ni(ClO4)2 were used in the experiments. Species distribution diagram showing the partition of monensinate (L = Mon) calculated for the Co(II)/Ni(II) (c) and Ni(II)/Co(II) (d) competition titrations. (e) Molar ellipticity spectra obtained for the mono and bis complexes from the PSEQUAD calculations of the ternary systems (dashed lines) and binary systems (solid lines). CoL⁺ and NiL+ represent the [Co(Mon)(H₂O)]⁺ and [Ni(Mon)(H₂O)]⁺ mono complexes, while CoL₂ and NiL₂ represent the [Co(Mon)₂(H₂O)₂] and [Ni(Mon)₂(H₂O)₂] bis complexes, respectively. (f) Residual CD spectra obtained by the matrix rank analysis of (b) titrations assuming 0–6 chiral species.
Inorganics 11 00334 g004
Figure 5. Competition experiments of colorless divalent metal ions (Zn(II), Mg(II), and Ca(II)) with Co(II) for monensinate. The decrease of the ellipticity values at 518 nm, attributable to the decomposition of the CoL2 complex upon the addition of Zn(II), Mg(II), and Ca(II) ions, are plotted in panels (a,c,e), respectively. Measured data points are represented by blue × symbols, while the black solid lines show the fitted titration curves based on PSEQUAD calculations. The insets represent the measured (solid) and simulated (dashed) CD spectra. cMonH = cTMAOH = 11.02 mM; 0.5 eqs Co(ClO4)2. Species distribution diagrams in panels (b,d,f) show the partition of monensinate (L = Mon) during the competition between Co(II) and Zn(II), Mg(II), or Ca(II), respectively.
Inorganics 11 00334 g005
Figure 6. Competition of Ni(II) and Zn(II) for monensinate. The change of the CD spectra is shown upon increasing the ratio of Zn(II) ions related to Ni(II) (a) and Ni(II) ions related to Zn(II) (b). The measured spectra (solid lines) are compared with the simulated spectra (dashed lines) using the stability constants obtained from the Co(II)-Zn(II) competition systems for Zn(II). CMonH = cTMAOH = 10.07 mM; Zn(ClO4)2 and Ni(ClO4)2 were used. (c) Molar ellipticity spectra calculated for the Ni(II) mono (NiL⁺) and bis (NiL₂) complexes evaluating the ternary (dashed lines) and binary systems (solid lines) by PSEQUAD.
Inorganics 11 00334 g006
Table 1. Conditional stability constants (shown as logβ’) of the monensinate complexes with Co(II) as computed from various CD spectroscopic data by PSEQUAD program [59].
logβ’[Co(Mon)(H₂O)]⁺[Co(Mon)₂(H₂O)₂]Ref
UV-range5.9 ± 0.510.2 ± 0.8[58]
VIS-range5.74 ± 0.029.93 ± 0.04This work
Table 2. Conditional stability constants (shown as logβ’) of monensinate complexes with various divalent metal ions obtained from the evaluation of CD spectroscopic Co(II)-competition titrations by PSEQUAD program [59].
Complex SpeciesZn(II)Mg(II)Ca(II)
[M(Mon)(H₂O)]⁺6.09 ± 0.024.81 ± 0.015.18 ± 0.01
[M(Mon)₂(H₂O)₂]10.12 ± 0.028.36 ± 0.018.40 ± 0.01
Disclaimer/Publisher’s Note: The statements, opinions and data contained in all publications are solely those of the individual author(s) and contributor(s) and not of MDPI and/or the editor(s). MDPI and/or the editor(s) disclaim responsibility for any injury to people or property resulting from any ideas, methods, instructions or products referred to in the content.

