Article

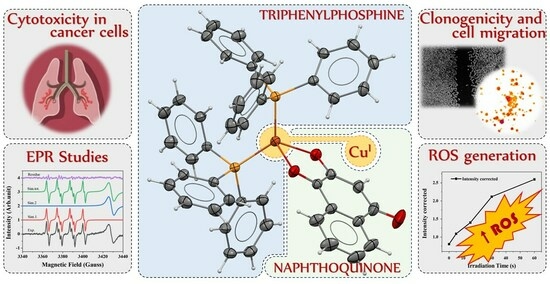
Copper(I)/Triphenylphosphine Complexes Containing Naphthoquinone Ligands as Potential Anticancer Agents

by
Celisnolia M. Leite
1,2,*,
João H. Araujo-Neto
3,
Adriana P. M. Guedes
1,
Analu R. Costa
2,
Felipe C. Demidoff
4,
Chaquip D. Netto
4,
Eduardo E. Castellano
2,
Otaciro R. Nascimento
2 and
Alzir A. Batista
1,*
1
Department of Chemistry, Federal University of São Carlos, São Carlos 13565-905, SP, Brazil
2
São Carlos Institute of Physics, University of São Paulo, São Carlos 13560-970, SP, Brazil
3
Institute of Chemistry, University of São Paulo, São Paulo 27930-560, SP, Brazil
4
Multidisciplinary Institute of Chemistry, Federal University of Rio de Janeiro, Macaé 35400-000, RJ, Brazil
*
Authors to whom correspondence should be addressed.
Inorganics 2023, 11(9), 367; https://doi.org/10.3390/inorganics11090367
Submission received: 25 July 2023 / Revised: 1 September 2023 / Accepted: 5 September 2023 / Published: 9 September 2023

Abstract

:
Four new Cu/PPh3/naphtoquinone complexes were synthesized, characterized (IR, UV/visible, 1D/2D NMR, mass spectrometry, elemental analysis, and X-ray diffraction), and evaluated as anticancer agents. We also investigated the reactive oxygen species (ROS) generation capacity of complex 4, considering the well-established photochemical property of naphthoquinones. Therefore, employing the electron paramagnetic resonance (EPR) “spin trap”, 5,5-dimethyl-1-pyrroline N-oxide (DMPO) technique, we identified the formation of the characteristic •OOH species (hydroperoxyl radical) adduct even before irradiating the solution containing complex 4. As the irradiation progressed, this radical species gradually diminished, primarily giving rise to a novel species known as •DMPO-OH (DMPO + •OH radical). These findings strongly suggest that Cu(I)/PPh3/naphthoquinone complexes can generate ROS, even in the absence of irradiation, potentially intensifying their cytotoxic effect on tumor cells. Interpretation of the in vitro cytotoxicity data of the Cu(I) complexes considered their stability in cell culture medium. All of the complexes were cytotoxic to the lung (A549) and breast tumor cell lines (MDA-MB-231 and MCF-7). However, the higher toxicity for the lung (MRC5) and breast (MCF-10A) non-tumoral cells resulted in a low selectivity index. The morphological analysis of MDA-MB-231 cells treated with the complexes showed that they could cause decreased cell density, loss of cell morphology, and loss of cell adhesion, mainly with concentrations higher than the inhibitory concentration of 50% of cell viability (IC50) values. Similarly, the clonogenic survivance of these cells was affected only with concentrations higher than the IC50 values. An antimigratory effect was observed for complexes 1 and 4, showing around 20–40% of inhibition of wound closure in the wound healing experiments.

Graphical Abstract

1. Introduction

Cancer is one of the leading causes of death, including premature death, in most countries [1]. The early detection and treatment of cancer at its advanced stages continues to pose immense challenges for the scientific community [2,3]. Among the diverse array of cancer types, breast cancer predominantly affects women [4,5]. These types of cancers exhibit substantial biological and clinical heterogeneity, resulting in varied responses to therapeutic agents and distinct prognoses [6,7]. While most breast tumors respond to hormone therapy, triple-negative (TN) breast cancer is an aggressive subtype without a targeted therapy, often requiring personalized treatment [8,9]. Similarly, lung cancer, characterized by its high aggressiveness, metastasis, and heterogeneity, can originate in various locations within the bronchial tree, leading to variable symptoms and signs depending on its anatomical site. Lung cancers are frequently diagnosed in the metastatic stage, limiting treatment options to palliative care [10,11,12,13].
The advancement of more efficient chemotherapeutic agents for treating these cancers aims to overcome limitations such as side effects and acquired resistance. Due to the success of cisplatin in treating various cancer types, researchers have extensively explored metal-based compounds in numerous studies as potential candidates for metallopharmaceuticals [14,15,16]. These compounds have shown promising antitumor activity through various mechanisms, including engaging in biomolecular interactions and generating reactive oxygen species [17,18]. Hence, different metals and ligands have been employed by researchers in the development of new compounds that can be used for the treatment of this disease. Copper, for example, an endogenous metal that plays a significant role in some cancer-related processes, has been widely employed to synthesize coordination compounds that target cancer cells [19,20,21]. Some of these copper compounds can efficiently generate reactive oxygen species (ROS) that can subsequently attack essential molecules such as proteins, lipids, and DNA, being a critical stimulus for apoptosis [22,23]. On the other hand, other complexes interfere with the cell cycle, potentially inducing regulated cell death [24,25]. Furthermore, some copper complexes possess outstanding photophysical characteristics, making them ideal candidates for photodynamic therapy (PDT) and photothermal therapy (PTT) [26,27].
Researchers commonly employ naphthoquinones as ligands in synthesizing new metal complexes. These ligands belong to the quinone group, organic molecules with diverse and important biological properties. In clinical medicine, several quinones, including daunorubicin, doxorubicin, idarubicin, mitomycin-C, and others, are utilized in cancer chemotherapy. One of the factors pointed out for the antitumor property of these molecules is due to the capacity that these molecules possess to induce oxidative stress by the intracellular generation of ROS, leading the cells to death by apoptosis [28]. Therefore, this study aims to discover new compounds as potential drug candidates through the synthesis and characterization of Cu–PPh3 complexes with naphthoquinone ligands, as well as initial in vitro studies to ascertain the effects of the compounds on breast and lung cancer cells.

2. Results and Discussion

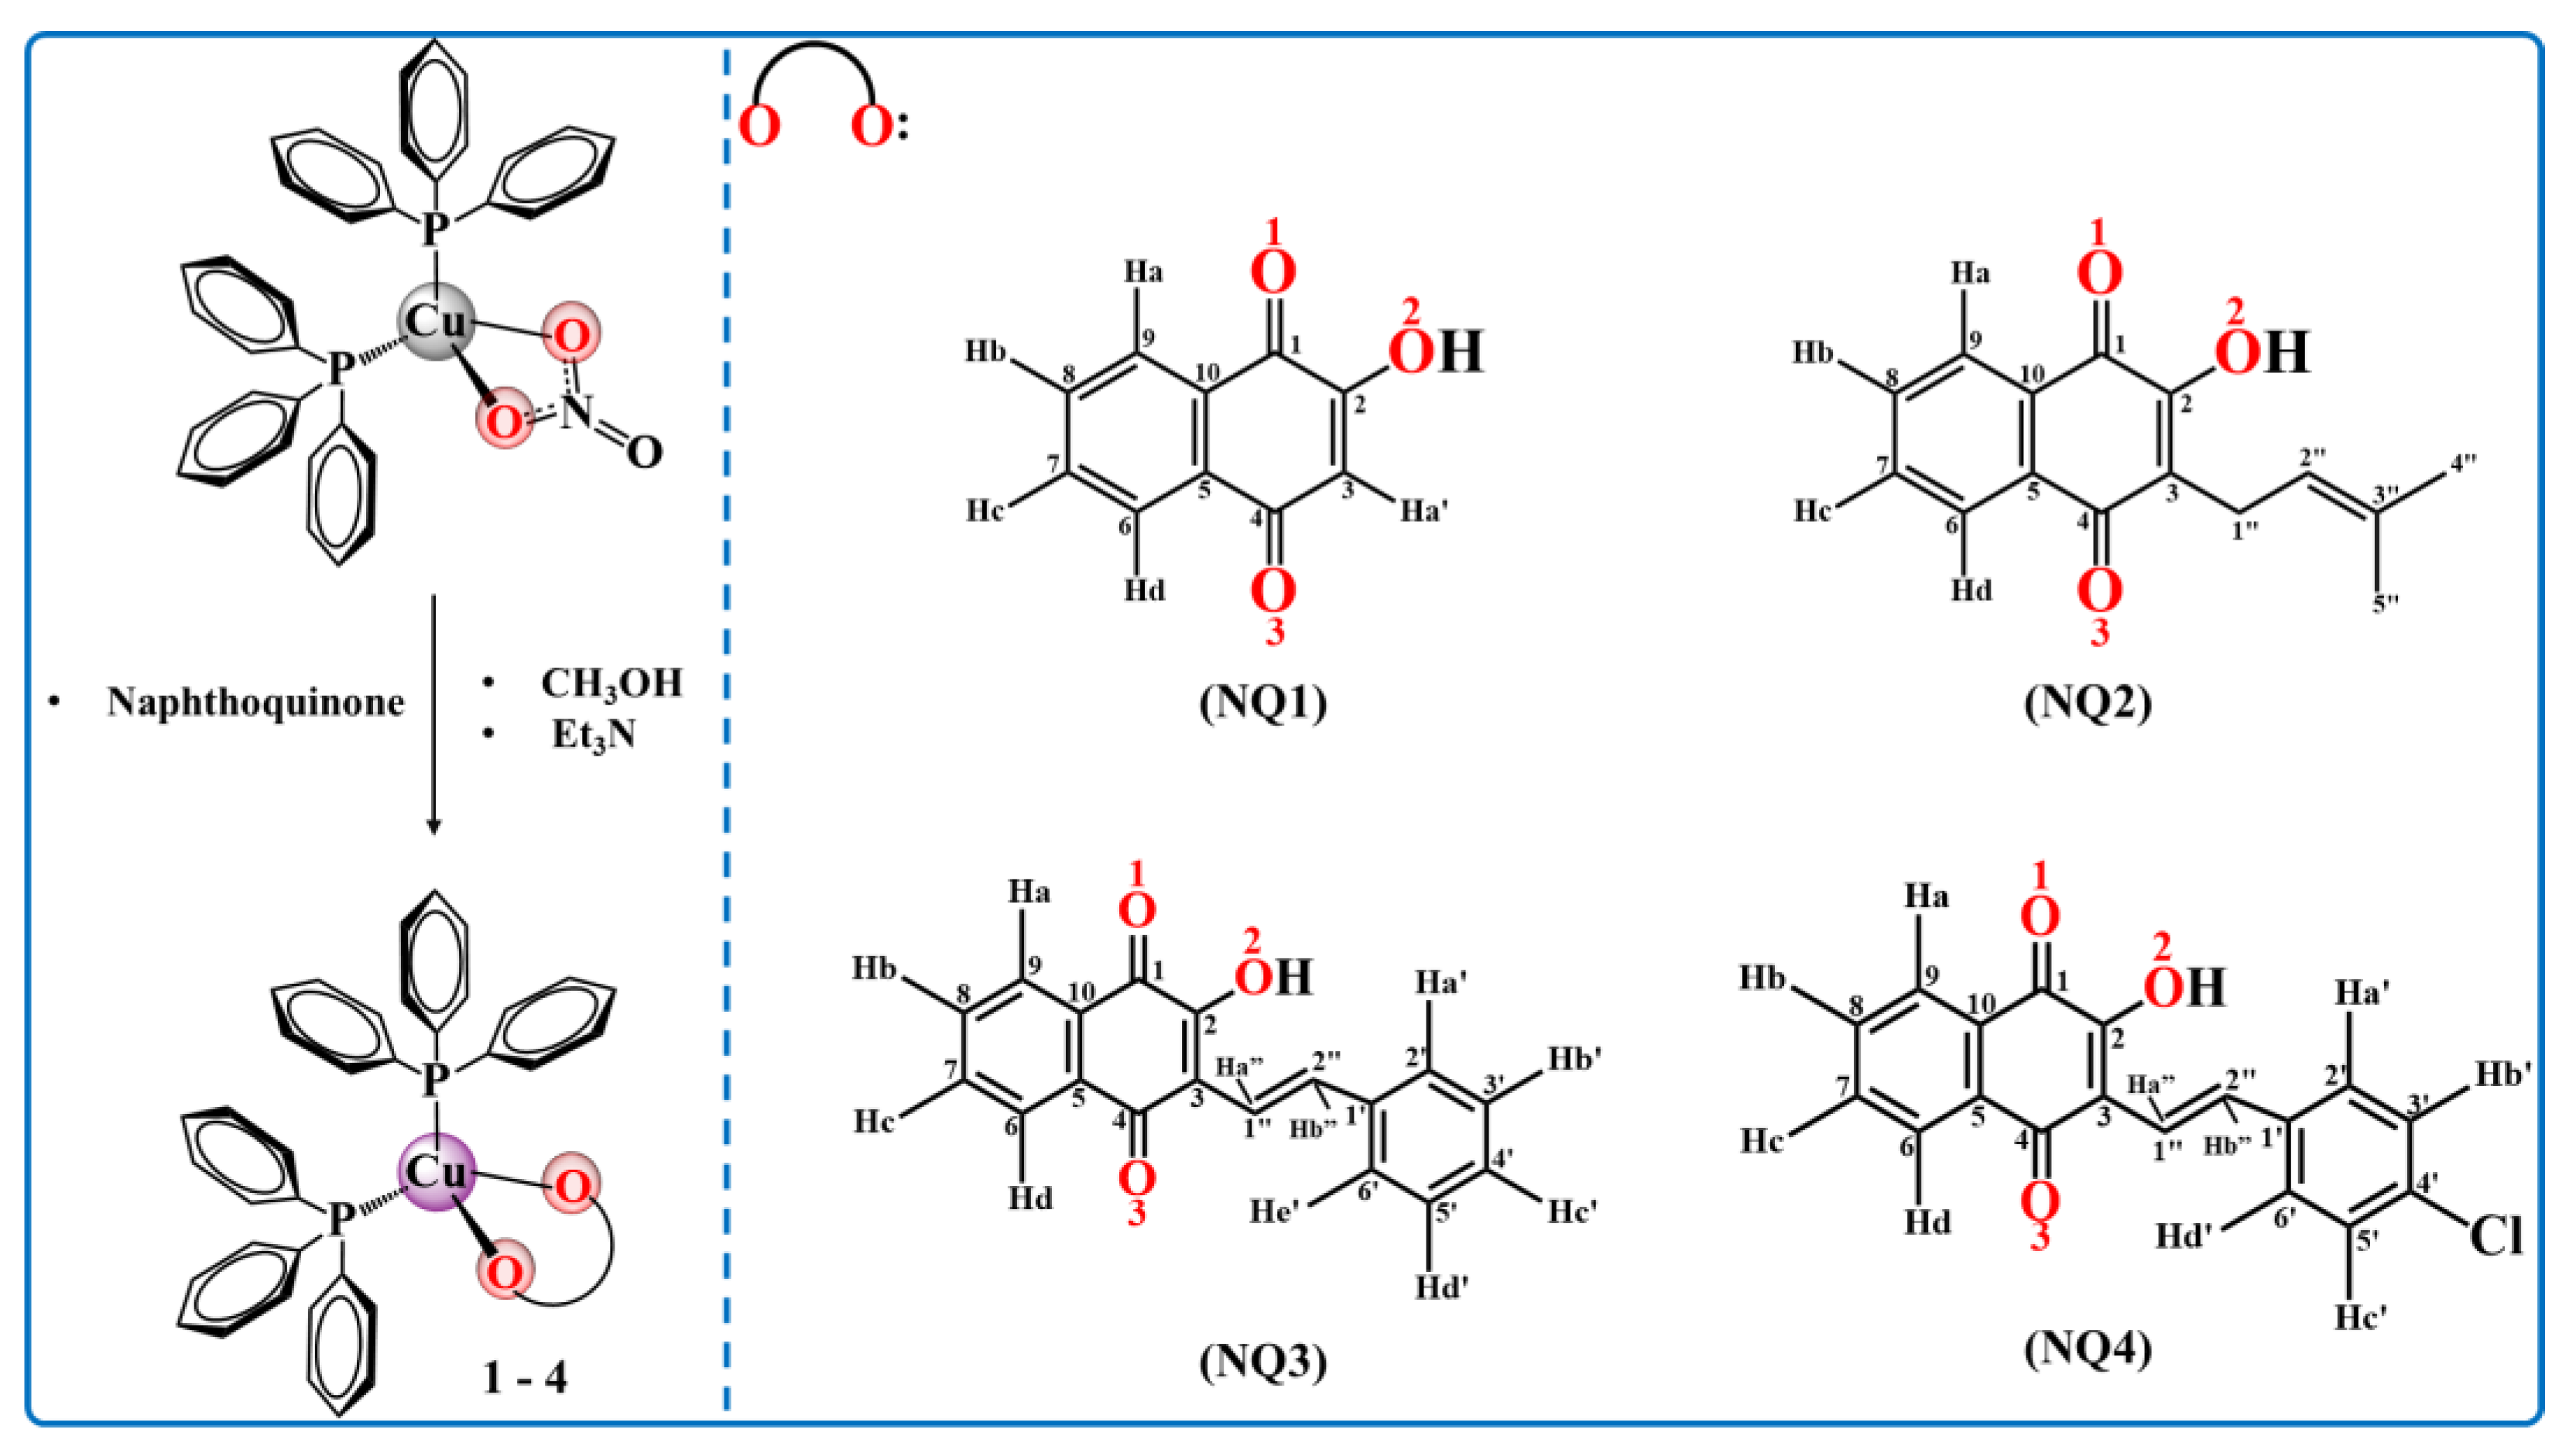
2.1. Syntheses of the Compounds

Complexes (14) were synthesized with good yields by reacting the precursor [Cu(NO3)(PPh3)2] with the respective naphthoquinone (NQ) ligand in a 1:2 ratio in methanol/triethylamine (Et3N) (Scheme 1). The use of a weak base was necessary to deprotonate the naphthoquinone for enhancing the exchange of the chloride atoms by the bidentate O-O ligand.

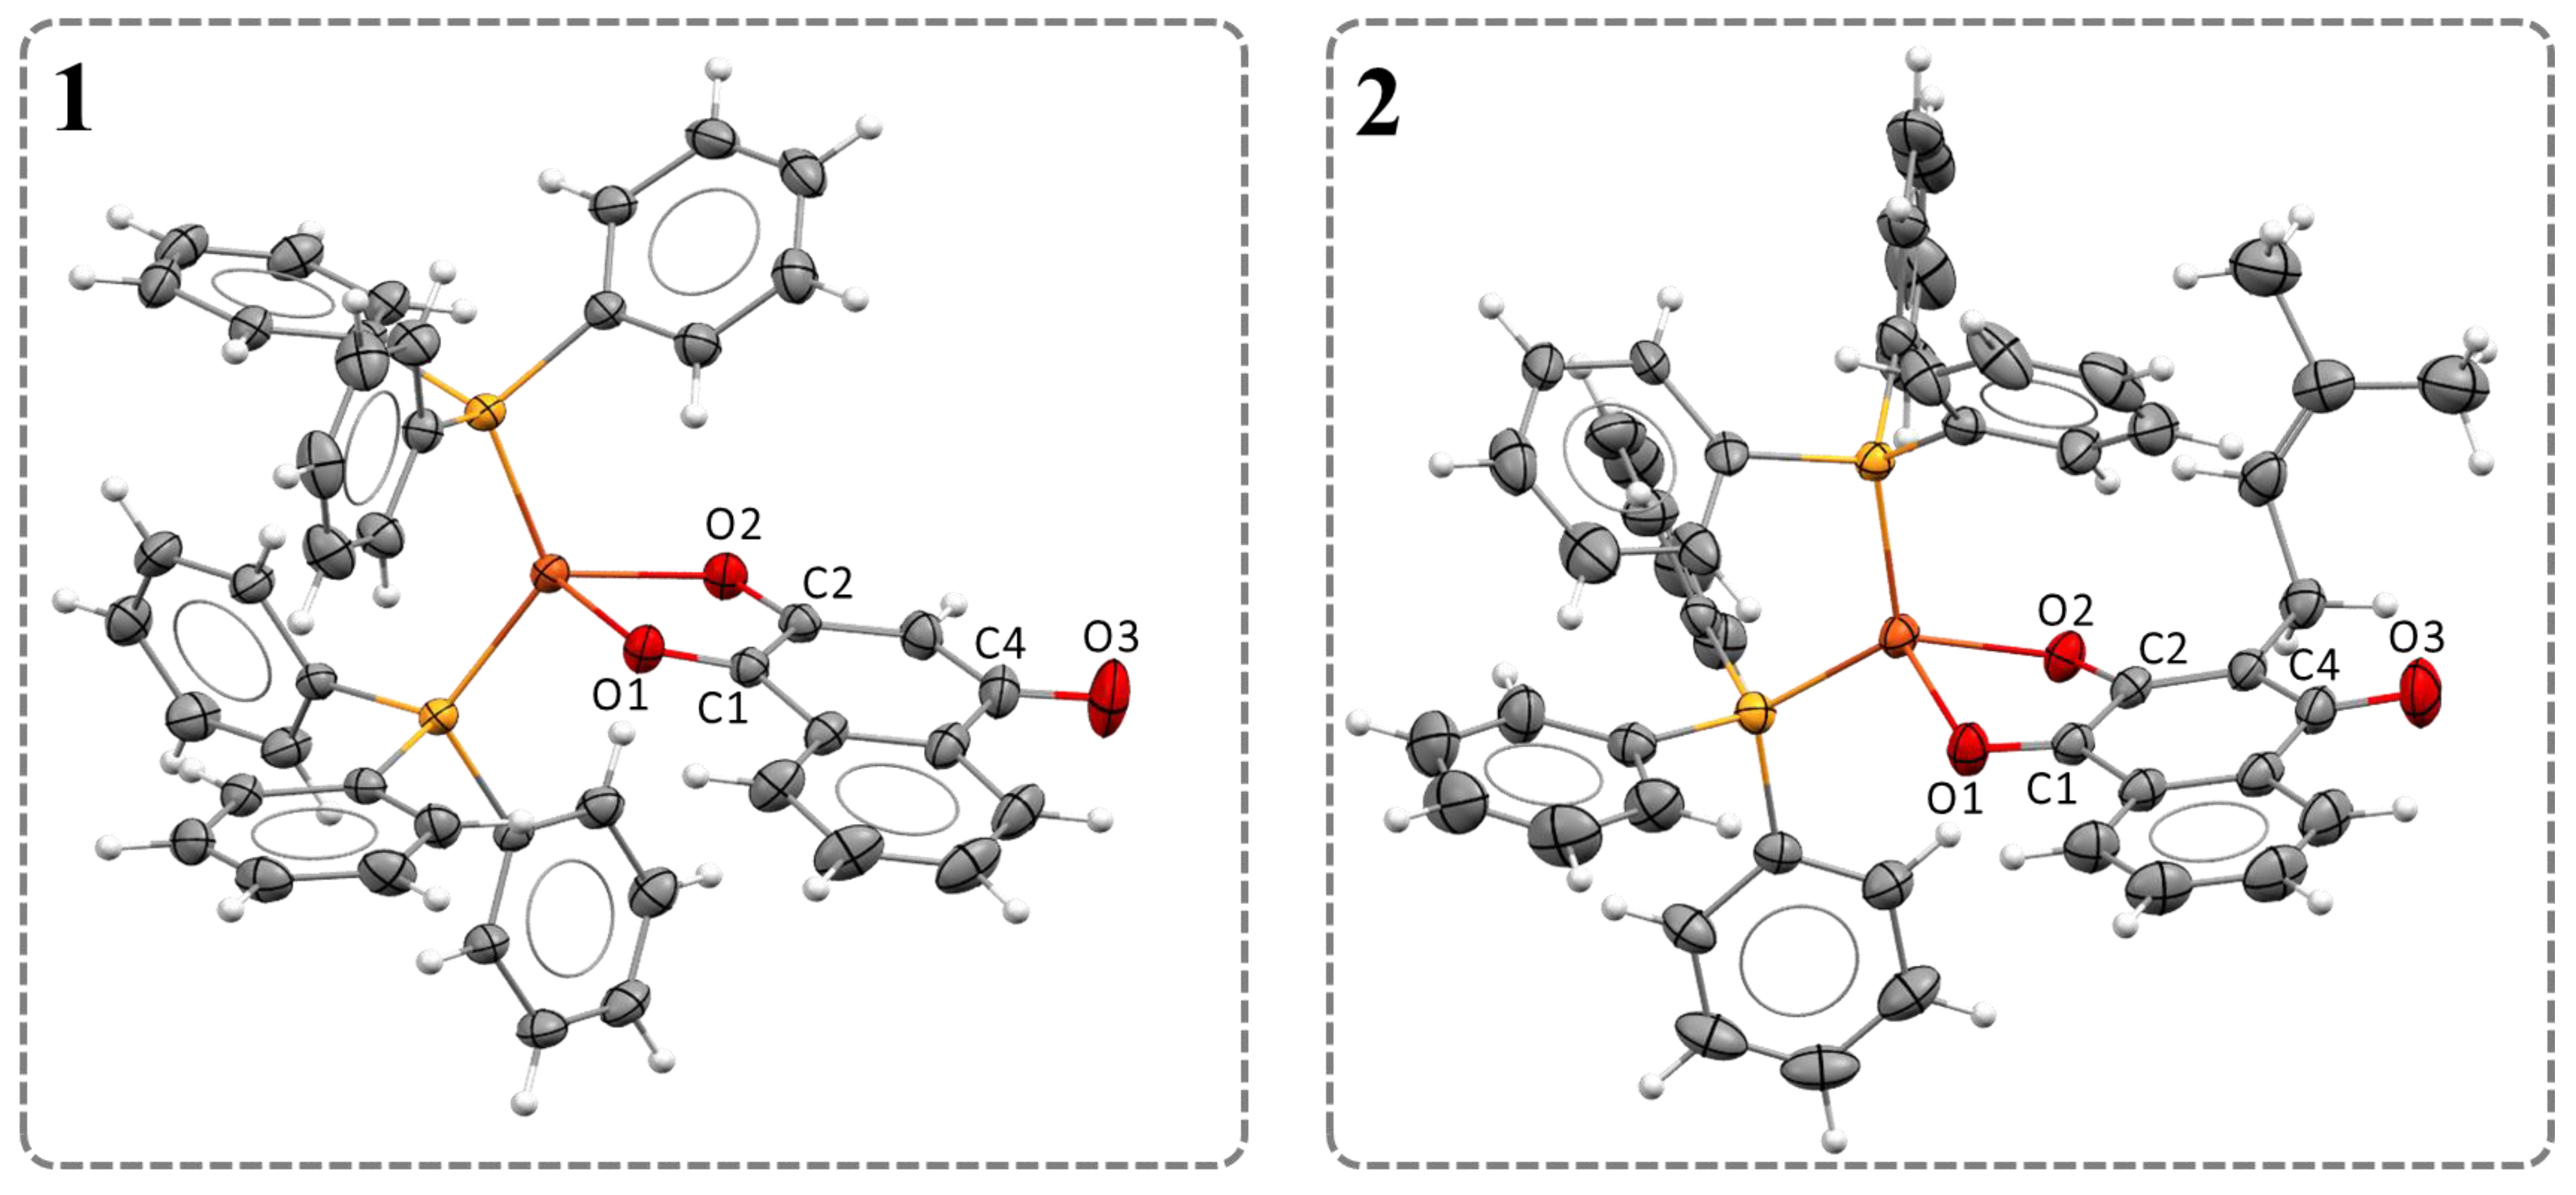
2.2. Structural Studies

The crystal structures of complexes 1 and 2 showed the coordination of naphthoquinones to the metal center in a bidentate manner via phenolic and carbonyl oxygen atoms (Figure 1). The complexes exhibited a distorted tetrahedral geometry (Table 1). The bond angles of naphthoquinone to copper, O1-Cu-O2 (76.81(6) and 77.14(4)°), are similar to those found for the α-ketocarboxylate ligand in a Cu(I) complex, where the O-Cu-O angle is 79.18° [29]. The P1-Cu-P2 bond angles of 127.67(2)° (1) and 118.84(2)° (2) are more open. One factor that explains this deviation from the regular tetrahedron is the steric effects imposed by the two triphenylphosphine ligands, which tend to move apart due to their bulk. The bond distances concerning the Cu-O and Cu-P bonds are similar to values already reported in the literature for other copper complexes, including oxidation states I and II [30,31,32,33,34,35]. The selected bond distances and angles are summarized in Table 1.
Complexes 1 and 2 exhibited the same trends observed for the bond lengths of bidentate-coordinated naphthoquinone ligands in numerous metal complexes, whose most pronounced change is in the bond length corresponding to the distance of the C2-O2 bond compared to the free ligands (Table 1) [36,37,38]. Literature suggests that the decrease in the CO bond occurs due to the sharing of electrons in the σ bond between the metal and the ligand, making it stronger and shorter [39]. The crystal data collection and structural refinement parameters for the complexes are summarized in Table S1.
In the FTIR spectra of the free ligands, the ν(O-H) stretch is observed at around 3200 cm−1. In the complexes, these stretching vibrations are absent, as illustrated in Figure 2a for complex 1, indicating the anionic nature of the naphthoquinone ligands during coordination with the metal center [40]. The bidentate (O, O) and anionic coordination modes have limited literature for Cu(I) complexes [29], making this research an important report for this type of coordination to the metal center. However, for other metal centers, including Cu(II) complexes, the bidentate (O, O) coordination is commonly described in the literature [36,37,38,41,42,43]. The region between 1640 and 1680 cm−1 displays intense vibrational modes for naphthoquinone ligands, corresponding to the ν(C1=O1) and ν(C4=O3) stretching. Upon the complexation of the ligand to the metal, an increase in the electron density in the antiligand orbital of the carbonyl group leads to a shift of these bands towards lower frequencies in the IR spectra. These findings are consistent with the X-ray diffraction results, which reveal a slight elongation of these bonds after the coordination of the ligand to the metal. The vibrational mode of the C2–O2 bond, after the complexation of the ligand to the metal, shifts to the higher frequency region due to the electron sharing, between the Cu(I) and oxygen atom, which makes the C2–O2 bond stronger, corroborating with what was observed in the X-ray diffraction data. The assignment of the vibrational modes referring to the C1=O1, C2–O2, and C4=O3 bonds before and after coordination of the naphthoquinone ligand to Cu(I) are presented in Table S2.
The ligands and complexes exhibit ν(C–H) bands at around 2950 cm−1. The stretching of C=C bonds occurs in the range of 1600–1450 cm−1, while the out-of-plane angular deformation of the =C–H bond can be observed between 900 and 690 cm−1. Complexes 14 exhibit vibrational modes between 540 and 430 cm−1, corresponding to the typical P–CAromatic bonds of the triphenylphosphine ligand and Cu–P bonds [44,45,46]. Figures S1–S4 show the spectra of all complexes showing these vibrational modes.
The complexes were also analyzed via 1D and 2D NMR spectroscopy at different nuclei, such as phosphorus(31P), carbon (13C), and hydrogen (1H). The 31P(1H) NMR spectra of the complexes exhibited only one signal, around −1.0 ppm (Figure 2b). This single signal indicates the equivalence of the phosphorus atoms of the triphenylphosphine ligands, as they are bound to the metal center in a tetrahedral arrangement confirmed by X-ray diffraction [30,47]. The proposed structures for the complexes are consistent with their 1H NMR spectra. The analysis of the spectra confirms that the triphenylphosphine ligands are present in a 2:1 ratio concerning the naphthoquinone ligand, as illustrated in Figure 2c for complex 1. The absence of the signal of the OH group from the naphthoquinones, observed for all four compounds, evidences the anionic nature of the ligands when coordinated with the copper, and corroborates with the results observed in the FTIR spectra of the complexes. The 13C(1H) NMR spectra of the complexes show the most deshielded signal, corresponding to the carbons of the C1=O1, C2–O2, and C4=O3 groups from the naphthoquinone ligand. Figures S5–S23 present the NMR spectra and correlation maps for the compounds.
Complexes 1 and 2 exhibit intense bands in their electronic spectra, with λmax values of approximately 260 nm. These bands correspond to the transitions of IL: the π→π* nature of the ligands naphthoquinones (benzenoid and quinonoid systems) and PPh3 and MLCT (Cu→π*naphthoquinone) [48,49]. Theoretical studies suggest that in Cu(I)–PPh3 complexes, the triphenylphosphine ligand plays a crucial role in the stabilization of the Cu(I) center [50]. The spectra of complexes 1 and 2 also exhibit extended characteristic bands in the region between 300 and 550 nm, which can be attributed to the overlapping n→π*-type and intramolecular charge transfer (ICT) transitions from the substituent to the quinone ring, which is an electron acceptor [51].
The electronic spectra of complexes 3 and 4 display intense bands with an absorption maximum of approximately 260 nm, which are from the combined transitions of an IL nature, namely π→π* of the naphthoquinone and PPh3 ligands, as well as MLCT transitions (Cu→πnaphthoquinone). The compounds also display a band with an absorption maximum of approximately 330 nm, referring to the π→π transitions of the styryl group of the naphthoquinones [52]. The band, which appears at approximately 370 nm, with strong molar absorptivity, can be attributed to the intramolecular charge transfer, from the substituent to the quinone ring, which acts as an electron acceptor. Finally, the low energy broad bands are observed in the visible regions, assignable to n→π* transitions of the carbonyl group of the quinone [53,54,55]. The electronic spectra for all complexes and the assignments of their transition bands are presented in Figures S24 and S25, and in Table S3.
We also examined the well-known photochemical properties of the naphthoquinone ligands, which generate reactive oxygen species that can potentially be involved in cell death mechanisms [56,57]. Representatively, we focused our analysis on complex 4. In this case, in order to examine its photochemical behavior, we prepared solutions of complex 4 in dimethyl sulfoxide solvent (DMSO) and subjected them to irradiation with LED (375 nm). Subsequently, we analyzed the samples using the electron paramagnetic resonance (EPR) technique. Additionally, we assessed the photochemical stability of complex 4 using UV–Vis spectroscopy. Figure 3a shows the absorption spectrum of this complex after irradiation, revealing a decrease in absorption in all of its bands. Exhaustive photolysis of the complex led to an intense reduction of the absorption bands and the appearance of an isosbestic point, indicating the formation of more than one species (Figure 3b). Upon cessation of light exposure, the system did not return to its original state (Figure 3b). Furthermore, the photolysis also resulted in the loss of coloration of the solution (Figure 3c). These results indicate the photodegradation of complex 4. Additionally, we noted that this process is oxygen-dependent, as no changes were observed in the spectrum of complex 4 in an argon atmosphere (Figure 3d).
We used a “spin trap” 5,5-dimethyl-1-pyrroline N-oxide (DMPO) experiment to detect ROS via the EPR technique. Reactive oxygen species cannot be directly detected via EPR due to their brief lifetimes. Nevertheless, they rapidly react with spin trappers, such as DMPO, giving rise to stable spin adducts. These adducts can then be characterized through the EPR spectrum. We monitored a solution of complex 4 via EPR spectra in the presence of oxygen and LED (375 nm) irradiation at different time intervals, and the results are presented in Figure 4. It is interesting to note that the process of ROS formation was initiated even before irradiation (Figure 4a). We identified the characteristic adduct of the ·OOH species (hydroperoxyl radical) in DMSO. We identified this adduct by simulating the spectrum obtained experimentally (Figure 4b) and determining its hyperfine coupling constants as AN = 1.297 mT (36.16 MHz), AH1 = 1.053 mT (29.37 MHz), and AH2 = 0.133 mT (3.71 MHz). These constants correspond to those reported in the literature for the DMPO–OOH adduct [58,59]. The ROS formation process was enhanced as the exposure time of the solution of complex 4 under irradiation increased, as observed in Figure 4c. We also observed a significant reduction in the DMPO–OOH adduct, while a predominantly new species attributed to the DMPO–OH adduct was formed. The EPR parameters obtained for the radical adducts are shown in Table S4.
The DMPO–OH adduct is well-known for producing a distinctive EPR signal characterized by 1:2:2:1 line intensities that arise from nearly equal hyperfine coupling values of ANAH ≈ 1.49 mT in water-based solutions [60]. However, the spectral characteristics of the ·DMPO–OH adduct in DMSO showed a different EPR pattern, as depicted in Figure 4d, with hyperfine coupling constants AN = 1.395 mT (38.89 MHz) and AH = 1.181 mT (32.93 MHz). In a previous study, Zalibera et al. investigated the thermal generation of stable adducts with superhyperfine structures [61]. These researchers showed that a sample containing the DMPO–OH adduct in an aqueous solution displays a typical EPR pattern with constants AN = 1.493 mT and AH = 1.474 mT.
However, when the sample is diluted with DMSO in a 1:1 (v/v) ratio, the EPR pattern exhibits six lines resembling the radical adduct observed in the sample containing complex 4 and the DMPO. The authors attributed these differences to the lower dielectric permittivity of the DMSO/water mixture compared to pure water, which influences the hyperfine coupling constants. As a result, the observed signals deviate from the classical 1:2:2:1 line intensity pattern.
Although further studies are necessary to comprehend the mechanism of ROS formation in this system, we identified four spectral components in the EPR spectra measured at 77K (liquid N2) and room temperature (Figures S26–S28 and Table S5). These findings indicate the formation of Cu (II) species. These preliminary results show that Cu(I)–PPh3–naphthoquinone complexes have the potential to generate reactive oxygen species even before irradiation, and may have their cytotoxic action on tumor cells enhanced by the formation of these species. Additionally, studies to improve the stability of the complexes under biological conditions, such as changing the PPh3 by bidentate phosphines or encapsulation of the complexes, may enable the use of these compounds as photosensitizers for photodynamic therapy targeting skin cancer.

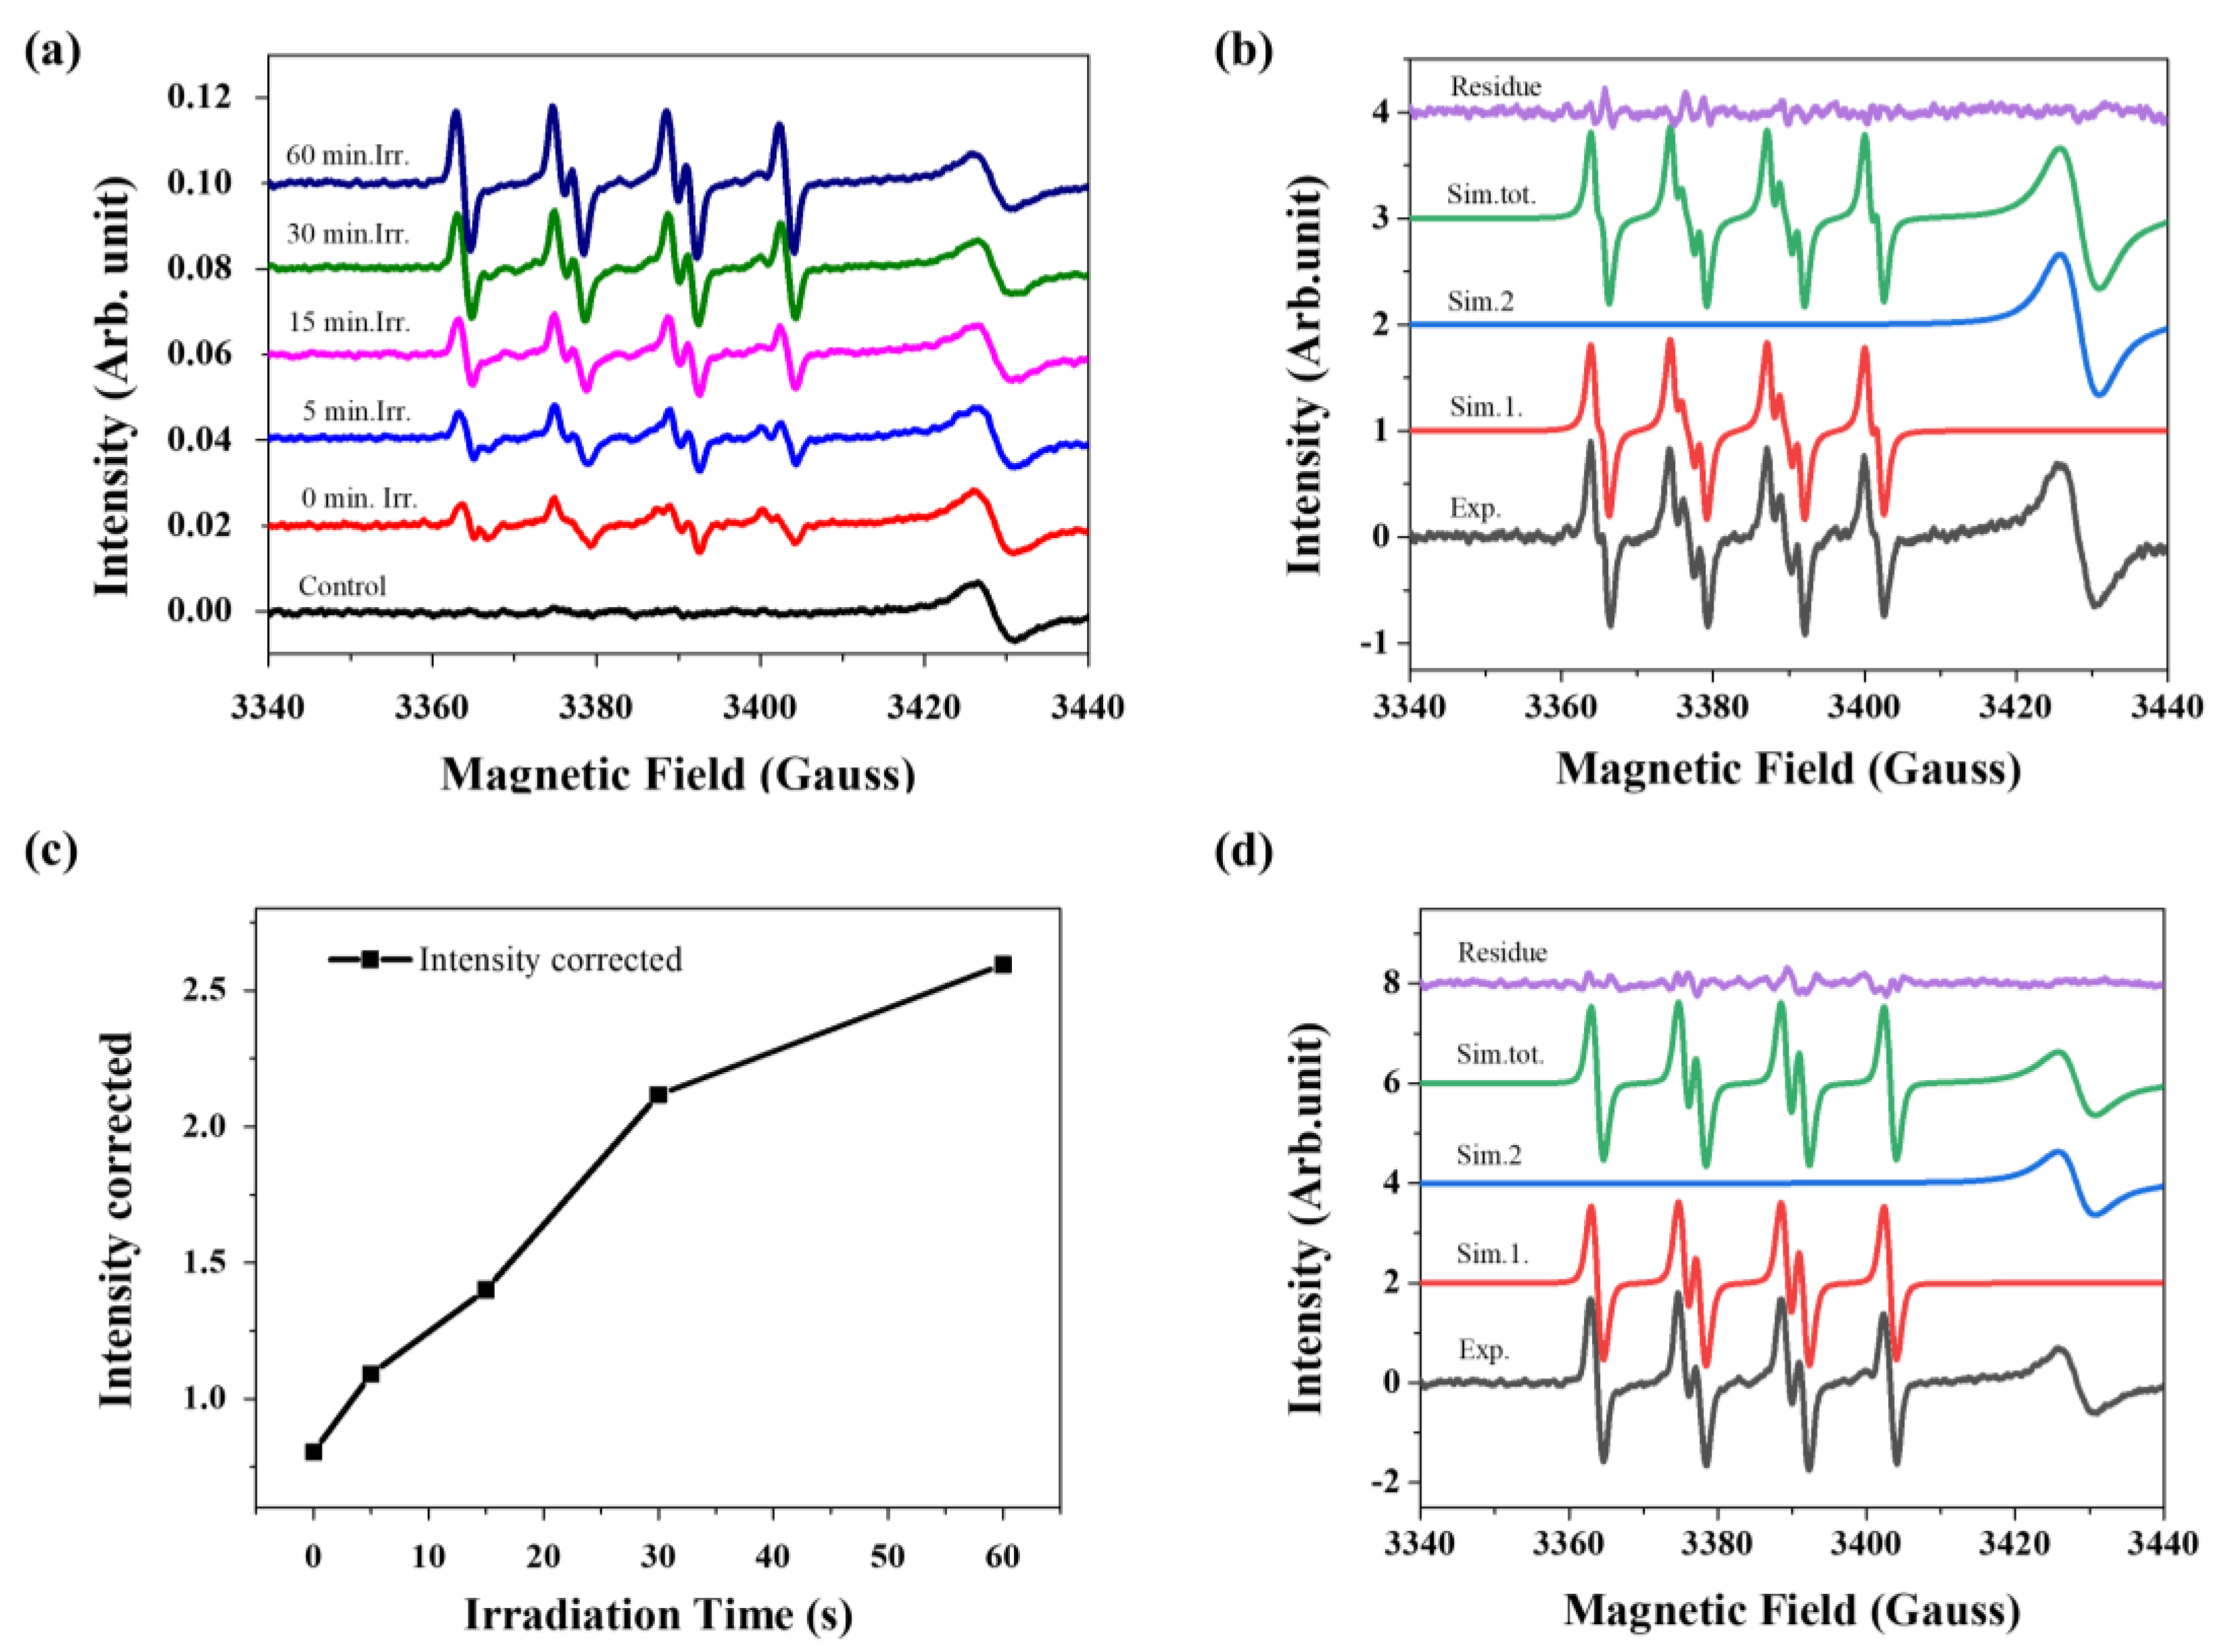
3. Biological Studies

The in vitro cytotoxicity of the complexes against tumor cell lines (MCF-7, MDA-MB-231 and A549) and non-tumor cell lines (MCF-10A and MRC-5) was evaluated using the MTT method. The results were expressed as IC50 values (inhibitory concentration of 50% of cell viability), and are described in Table 2. The concentration–response curves are shown in Figure S29. The cytotoxic effects presented by the complexes were similar in all cell lines. These results may be related to the instability of these compounds in the culture medium, as shown by the results of 31P{1H} NMR (Figure S30) and UV–Vis spectrophotometry (Figure S31), which may result in the same active species. All of the complexes were more toxic than cisplatin in the tested cells, although the high toxicity to the non-tumoral cells resulted in low values of the selectivity index. As the complexes displayed similar cytotoxicity in all of the cell lines tested, we chose only complexes 1 and 4 to undergo further biological investigations in the MDA-MB-231 cell line. Therefore, we evaluated the ability of complexes 1 and 4 to alter cell morphology, impede colony formation, and inhibit cell migration using the wound healing assay.
The cytotoxicities of complexes 1 and 4 at the 24 h time point on the MDA-MB-231 cell line [7 ± 1 μM (1) and 6.4 ± 0.2 (4), respectively] were also evaluated. The IC50 values of the complexes at this time were similar to those obtained at 48 h, showing that their cytotoxic effect is not time-dependent.
The morphological analysis of MDA-MB-231 cells treated with complexes 1 and 4 at different concentrations showed that the complexes could cause decreased cell density, loss of cell morphology (appearance of rounded cells), and loss of cell adhesion, especially at concentrations higher than the IC50 (Figure 5). The exposure time of the cells to the complexes did not intensify these effects, which supports the observations made in the cell viability assay. Therefore, these changes indicate that complexes 1 and 4 induce cell death in MDA-MB-231 cells, and this effect is not dependent on time. The similarity of the results displayed by complexes 1 and 4 shows that the variation in the substituents of the naphthoquinone ligand does not influence the toxicity against analyzed cells.
The colony formation assay results demonstrated that complexes 1 and 4 inhibited the area and intensity of colonies at the 2 × IC50 concentration (Figure 6 and Figure S32). These results suggest that complexes 1 and 4 can interfere with the growth, development, and proliferation of MDA-MB-231 cells and exhibit cytotoxicity only at concentrations above the IC50.
Cell migration is a process related to metastasis, which is one of the main causes of death in cancer [62,63]. Thus, the development of drugs that are capable of inhibiting cell migration is an important strategy for cancer therapy. For this reason, we investigated the ability of complexes 1 and 4 to inhibit cell migration using the wound healing assay [64,65]. This assay involves scratching a cell monolayer with approximately 90% of confluence, followed by treatment with solutions of the complexes. In order to observe the effect of inhibition of cell migration, the concentrations of the complexes used were below their IC50 concentrations. Mitomycin C, an antiproliferative agent, was used to prevent cell proliferation during the evaluation of wound closure [66]. The results of these experiments showed that complex 1 inhibited cell migration after 48 h of treatment.
The presence of the complex prevented complete closure of the scratch wound, resulting in an inhibition of around 20% wound closure compared to the negative control (Figure 7). On the other hand, complex 4 was more effective, with an inhibition of around 40% after 24 h of treatment at a concentration of 1/2IC50, and this inhibition persisted after 48 h (Figure 7).

4. Experimental Section

4.1. Materials

The precursor [Cu(NO3)(PPh3)2] was synthesized according to previous related studies in the literature [67]. The CuNO3·3H2O, triphenylphosphine (PPh3), triethylamine (Et3N) and lawsone (NQ1) were used as received from Sigma-Aldrich. The salts used for buffer preparation and MTT (3-(4,5-dimethylthiazol-2-yl)-2,5-diphenyltetrazolium bromide) were purchased from Sigma-Aldrich. All the solvents used in this study were purified using standard methods. The lapachol (NQ2) was kindly provided by Dr. Diogo Moreira from the Gonzalo Muniz Institute (IGM-FIOCRUZ—Salvador, Brazil) and the ligands NQ3 (3-styryl-lausone) and NQ4 (4-chloro-3-styryl-lausone) were synthesized by the group of Prof. Dr. Chaquip Daher Netto (UFRJ—Macaé, Brazil).

4.2. Physical Measurements

1D and 2D nuclear magnetic resonance (NMR) experiments were recorded on a Bruker DRX-400 spectrometer (9.4 T). 1H and 13C(1H) chemical shifts in chloroform (CD3Cl) or acetone were referenced to the peak of residual nondeuterated solvent [(1H) δ7.26, (13C(1H) δ 77.16 for CD3Cl, and (1H) δ2.09, and (13C(1H) δ 205.87 for (CD3)2CO]. The 31P(1H) NMR spectrometry was carried out in chloroform or acetone, and the chemical shifts were referenced to an external 85% H3PO4 standard at 0.00 ppm. Elemental analyses were performed on a FISIONS Instrument EA 1108 CHNS (Thermo Scientific, Waltham, MA, USA) elemental analyzer at the Analytical Laboratory at the Federal University of São Carlos, São Carlos (SP). Conductivity measurements in acetonitrile solutions (1.0 mM) of the complexes were carried out on a Meter Lab CDM2300 conductivity meter using a cell of constant 0.089 cm−1. The UV−visible (UV−Vis) spectra were recorded on a Hewlett-Packard diode array −8452 A spectrophotometer in acetonitrile solutions (UV Cutoff of 190 nm) with a 1.0 cm quartz cell in the range of 200−800 nm. FTIR spectra in the range of 4000 and 200 cm−1 were recorded using as KBr pellets on a Bomem–Michelson FT-MB-102 instrument.

4.3. Syntheses of the Copper Complexes

In a two-mouth flask containing 5 mL of methanol previously deaerated for 1 h, the naphthoquinone ligand (0.30 mmol) and 50 μL of triethylamine were added. After 10 min of stirring, 0.10 g (0.15 mmol) of [Cu(NO3)(PPh3)2] was added to the flask. The mixture was stirred at room temperature for 1 h, and a solid formed with shades ranging from purple (1 and 2) to dark blue (3 and 4). Then, the solid was filtered, washed with methanol, and dried under vacuum.
[Cu(NQ1)PPh3)2] (1). Purple solid. Yield (78%). Elemental analysis (%) calc. for: exp. (calc.) C, 72.36 (72.58); H, 4.94 (4.63). Molar conductance (dichloromethane): 0.20 S cm2 mol−1. IR (KBr, cm−1): (υ(C-H)) 3053, (υ(C4=O3)) 1641, (υ(C1=O1)) 1587, (υ(C2-O2)) 1094, (υ(C-P)/(Cu-P)) 519, 507, 494. 31P{1H} NMR (162 MHz, CDCl3, 298 K) [ppm, (multiplicity)]: −1.0 (s). 1H NMR (400 MHz, CDCl3, 298 K) [ppm, (multiplicity, integral, J (Hz), assignation)]: 6.05 (s, 1H, Ha’ da NQ1); 7.16–7.24 (m, 12H, Hortho of PPh3); 7.25–7.34 (m, overlapped signals: 12H, Hmetha of PPh3 and 6H, Hpara of PPh3); 7.43 (t, J = 7.5 Hz, 1H, Hc of NQ1); 7.63 (t, J = 7.5 Hz, 1H, Hb of NQ1); 7.80 (d, J = 7.6 Hz, 1H, Hd of NQ1); 8.06 (d, J = 7.6 Hz, 1H, Ha of NQ1). 13C{1H} NMR (100 MHz, CDCl3, 298 K) [ppm, (multiplicity, J (Hz), assignation)]: 108.7 (C3 of NQ1); 125.8 (C6 of NQ1); 125.9 (C9 of NQ1); 128.8 (Cortho of PPh3); 130.0 (CH of PPh3); 130.4 (C7 of NQ1); 130.6 (C10 of NQ1); 132.5 (Cquaternary of PPh3); 133.8 (CH of PPh3); 134.4 (C8 of NQ1); 135.4 (C5 of NQ1); 170.2 (C2 of NQ1); 184.5 (C1 of NQ1); 188.8 (C4 of NQ1).
[Cu(NQ2)PPh3)2] (2): Purple solid. Yield (80%). Elemental analysis (%) calc. for: exp. (calc.): C, 73.72 (73.86); H, 5.51 (5.23). Molar conductance (dichloromethane): 0.07 S cm2 mol−1. IR (KBr, cm−1): (υ(C-H)) 3049, 2907; (υ(C4=O3)) 1628; (υ(C1=O1)) 1583; (υ(C2-O2)) 1095; (υ(C-P)/(Cu-P)) 514, 505, 490. 31P{1H} NMR (162 MHz, CDCl3, 298 K) [ppm, (multiplicity)]: −1.4 (s). 1H NMR (400 MHz, CDCl3, 298 K) [ppm, (multiplicity, integral, J (Hz), assignation)]: 1.56 (s, 3H, CH3 of NQ2); 1.74 (s, 3H, CH3 of NQ2); 3.35 (d, J = 7.0 Hz, 2H, CH2 of NQ2); 5.25–5.33 (m, 1H, CH of NQ2); 7.16–7.24 (m, 12H, Hortho of PPh3); 7.27–7.39 (m, overlapped signals: 12H, Hmetha of PPh3, 6H, Hpara of PPh3 e 1H, Hb of NQ2); 7.57 (t, J = 7.5 Hz, 1H, Hc of NQ2); 7.72 (t, J = 7.6 Hz, 1H, Ha of NQ2); 8.04 (d, J = 7.6 Hz, 1H, Hd of NQ2). 13C{1H} NMR (100 MHz, CDCl3, 298 K) [ppm, (multiplicity, J (Hz), assignation)]: 18.1 (CH3 of NQ2); 23.1 (CH2 da NQ2); 26.0 (CH3 of NQ2); 120.9 (C3 of NQ2); 123.9 (CH of NQ2); 125.3 (C9 of NQ2); 125.9 (C6 of NQ2); 128.7 (Cortho of PPh3); 129.9 (CH of PPh3); 130.3 (Cquaternary of NQ2); 130.6 (C5 of NQ2); 132.7 (C8 of NQ2); 132.9 (Cquaternary of NQ2); 133.9 (CH of PPh3); 134.0 (C7 of NQ2); 135.5 (C10 of NQ2); 167.7 (C2 of NQ2); 182.5 (C4 of NQ2); 188.3 (C1 of NQ2).
[Cu(NQ3)PPh3)2] (3): Blue solid. Yield (79%). Elemental analysis (%) calc. for: exp. (calc.): C, 75.04 (75.12); H, 5.12 (4.79). Molar conductance (dichloromethane): 0.12 S cm2 mol−1. IR (KBr, cm−1): (υ(C-H)) 3051, 3017; (υ(C4=O3)) 1628; (υ(C1=O1)) 1584; (υ(C2-O2)) 1094; (υ(C-P)/(Cu-P)) 513, 490. 31P{1H} NMR (162 MHz, (CD3)2CO, 298 K) [ppm, (multiplicity)]: −1.4 (s). 1H NMR (400 MHz, (CD3)2CO, 298 K) [ppm, (multiplicity, integral, J (Hz), assignation)]: 7.15 (t, 1H, Hc’ of NQ3); 7.27–7.35 (m, overlapped signals: 2H, Hb’/d’ of NQ3 and 12H, Hortho of PPh3); 7.37–7.45 (m, overlapped signals: 18H, Hmetha/para of PPh3); 7.49 (t, J = 7.7 Hz, 2H, Ha’/e’ of NQ3); 7.56 (t, J = 7.5 Hz, 1H, Hb of NQ3); 7.68–7.75 (m, overlapped signals: 2H, Ha” and Hc da NQ3); 7.88 (d, J = 7.6 Hz, 1H, Ha of NQ3); 8.03 (d, J = 7.8 Hz, 1H, Hd of NQ3); 8.38 (d, J = 16.2 Hz, 1H, Hb” of NQ3). 13C{1H} NMR (100 MHz, (CD3)2CO, 298 K) [ppm, (multiplicity, J (Hz), assignation)]: 117.8 (C1′ of NQ3); 123.7 (CH of NQ3); 126.2 (C9 of NQ3); 126.8 (C2′/C6′ of NQ3); 126.9 (C6 of NQ3); 127.0 (C4′ of NQ3); 129.5 (C3′/C5′ of NQ3); 129.8 (overlapped signals: CH of NQ3 e Cortho of PPh3); 131.1 (CH of PPh3); 131.8 (C5 of NQ3); 132.0 (C8 of NQ3); 133.5 (Cquaternary of PPh3); 134.6 (CH of PPh3); 135.4 (C7 of NQ3); 135.7 (C10 of NQ3); 141.7 (C3 of NQ3); 168.3 (C2 of NQ3); 182.8 (C4 of NQ3); 188.5 (C1 of NQ3).
[Cu(NQ4)PPh3)2] (4): Blue solid. Yield (80%). Elemental analysis (%) calc. for: exp. (calc.): C, 72.12 (72.24); H, 4.74 (4.49). Molar conductance (dichloromethane): 0.13 S cm2 mol−1. IR (KBr, cm−1): (υ(C-H)) 3049, 3013; (υ(C4=O3)) 1626; (υ(C1=O1)) 1582; (υ(C2-O2)) 1093; (υ(C-P)/(Cu-P)) 515, 507. 31P{1H} NMR (162 MHz, (CD3)2CO, 298 K) [ppm, (multiplicity)]: −1.2 (s). 1H NMR (400 MHz, (CD3)2CO, 298 K) [ppm, (multiplicity, integral, J (Hz), assignation)]: 7.27–7.36 (m, overlapped signals: 2H, Hb’/c’ of NQ4 e 12H, Hortho of PPh3); 7.36–7.44 (m, overlapped signals: 18H, Hmetha/para of PPh3); 7.47 (d, J = 8.2 Hz, 2H, Ha’/d’ of NQ4); 7.56 (d, 21H, Hb of NQ4); 7.67–7.76 (m, 2H, Ha”/Hc of NQ4); 7.88 (d, J = 7.7 Hz, 1H, Ha of NQ4); 8.03 (d, J = 7.5 Hz, 1H, Hd of NQ4); 8.33 (d, J = 16.3 Hz, 1H, Hb” of NQ4). 13C{1H} NMR (100 MHz, (CD3)2CO, 298 K) [ppm, (multiplicity, J (Hz), assignation)]: 117.5 (C1′ of NQ4); 124.6 (CH of NQ4); 126.3 (C9 of NQ4); 126.9 (C6 of NQ4); 128.0 (CH of NQ4); 128.2 (C2′/C6′ of NQ4); 129.5 (C3′/C5′ of NQ4); 129.8 (Cortho of PPh3); 131.2 (CH of PPh3); 131.8 (C5 of NQ4); 131.9 (C4′ of NQ4); 132.1 (C8 of NQ4); 133.5 (Cquaternary of PPh3); 134.6 (CH of PPh3); 135.6 (C7 of NQ4); 135.7 (C10 of NQ4); 140.6 (C3 of NQ4); 168.6 (C2 of NQ4); 182.7 (C4 of NQ4); 188.5 (C1 of NQ4).

4.4. Stability of Complexes in Culture Medium

The stability of complexes 14 in Dulbecco’s Modified Eagle’s Medium (DMEM) without phenol red, in the presence of 10% fetal bovine serum (FBS), was assessed using UV–Vis spectroscopy and 31P(1H) NMR. Stock solutions of the complexes (0.5 mM) were prepared in DMSO, and then diluted with culture medium to obtain final solutions of 10 μM of the complexes at 0.5% DMSO (v/v) for UV–Vis analyses. For the 31P(1H) NMR spectroscopic assays, saturated solutions of the complexes were prepared with 90% DMSO and 10% culture medium. The samples were analyzed with the UV–Vis technique immediately after preparation of the solutions, and after 2, 4, 24, 48, and 72 h. For the 31P(1H) NMR experiments, the measurements were carried out immediately after preparation of the solutions, and after 24 and 48 h.

4.5. X-ray Crystallography

The complexes (1, CCDC code 2279524 and 2, CCDC code 2279525) were crystallized in methanolic/dichloromethane solutions via slow evaporation of the solvents. The measurements of single crystals with X-ray diffraction were performed on a Rigaku XtaLAB mini II diffractometer (Rigaku Oxford Diffraction, distributed in Warriewood, Australia) with graphite monochromated Mo Kα radiation (λ = 0.71073 Å). Cell refinements were carried out using CrysAlisPro v.42 software, and the structures were obtained with the intrinsic phasing method using the SHELXT program. The Gaussian method was used for the absorption corrections. The tabular and structural representations were generated by OLEX2 and MERCURY, respectively.

4.6. EPR Measurements

The EPR spectroscopy experiments were performed at room temperature using a Varian E109 spectrometer operating in X-band (9.5 GHz). The compound, 5,5 dimethyl 1-pyrroline N-oxide (DMPO, 40 mmol L−1), was used as a spin trap to verify the formation of ROS by complex 4 (10 µM solution) in DMSO. The solution of the complex was irradiated in a quartz cuvette with LED (375 nm) at certain time intervals (0, 5, 15, 30, and 60 min). Then, aliquots were collected and transferred to a quartz cuvette that contained the Cr (III) standard, which remained fixed on the outside of the cuvette throughout all of the measurements. A solution of DMPO (40 mM) in DMSO was measured as a control. The experimentally obtained spectra were simulated to obtain the EPR parameters such as the line width, absorption signal area, value of the hyperfine constants, and the g value, using the EasySpin program in the Matlab 7.5 (R2007b) environment. The experimental conditions were 0.25 G modulation, 20 mW power, time constant 0.128 s, and 10 scans.

4.7. Cell Culture

The MDA-MB-231 cell lines (triple-negative human breast tumor) were cultured in DMEM supplemented with 10% FBS. The MCF-7 cell line (human breast tumor cells) was cultured in Roswell Park Memorial Institute (RPMI) 1640 medium supplemented with 10% FBS. The MCF-10A cell line (non-tumor epithelial human breast cells) was cultured in Dulbecco’s modified Eagle medium nutrient mixture F-12 (DMEM F-12) supplemented with 5% horse serum, EGF (20 ng mL−1), hydrocortisone (0.5 μg mL−1), insulin (0.01 mg mL−1), and 1% penicillin/streptomycin. All of the cell lines were maintained in a humidified incubator at 37 °C and 5% CO2.

4.8. Cell Viability Assay

For this experiment, 1.5 × 10⁴ cells/well were seeded into 96-well plates and incubated at 37 °C in 5% CO2 overnight to allow for cell adhesion. Copper complexes were dissolved in DMSO, and 0.75 μL was added to each well to achieve a final concentration of 0.5% DMSO/well. The concentration range for the copper complexes was 25–0.3 μM. The cells that were treated with 0.5% DMSO served as the negative control. The treated cells were then incubated for 48 h. After the treatment, MTT (50 μL, 1 mg/mL in culture medium) was added to each well, and the plate was incubated for an additional 3 h. Cell viability was detected by the reduction of MTT to purple formazan in live cells. The formazan crystals were solubilized in isopropanol (150 μL/well), and the optical density of each well was measured using a multi-scanner automatic reader at a wavelength of 540 nm. The IC50 value was obtained from the analysis of the absorbance data from three independent experiments conducted in triplicate.

4.9. Cell Morphology

MDA-MB-231 cells were seeded (0.5 × 10⁵ cells/well) in a 12-well plate and incubated at 37 °C in 5% CO2 overnight. The cell morphology was examined at 0, 24, and 48 h after treatment of the cells with complexes 1 and 4 at concentrations of ½ × IC50, IC50, and 2 × IC50 on an inverted microscope (Nikon, T5100) with a 10× objective.

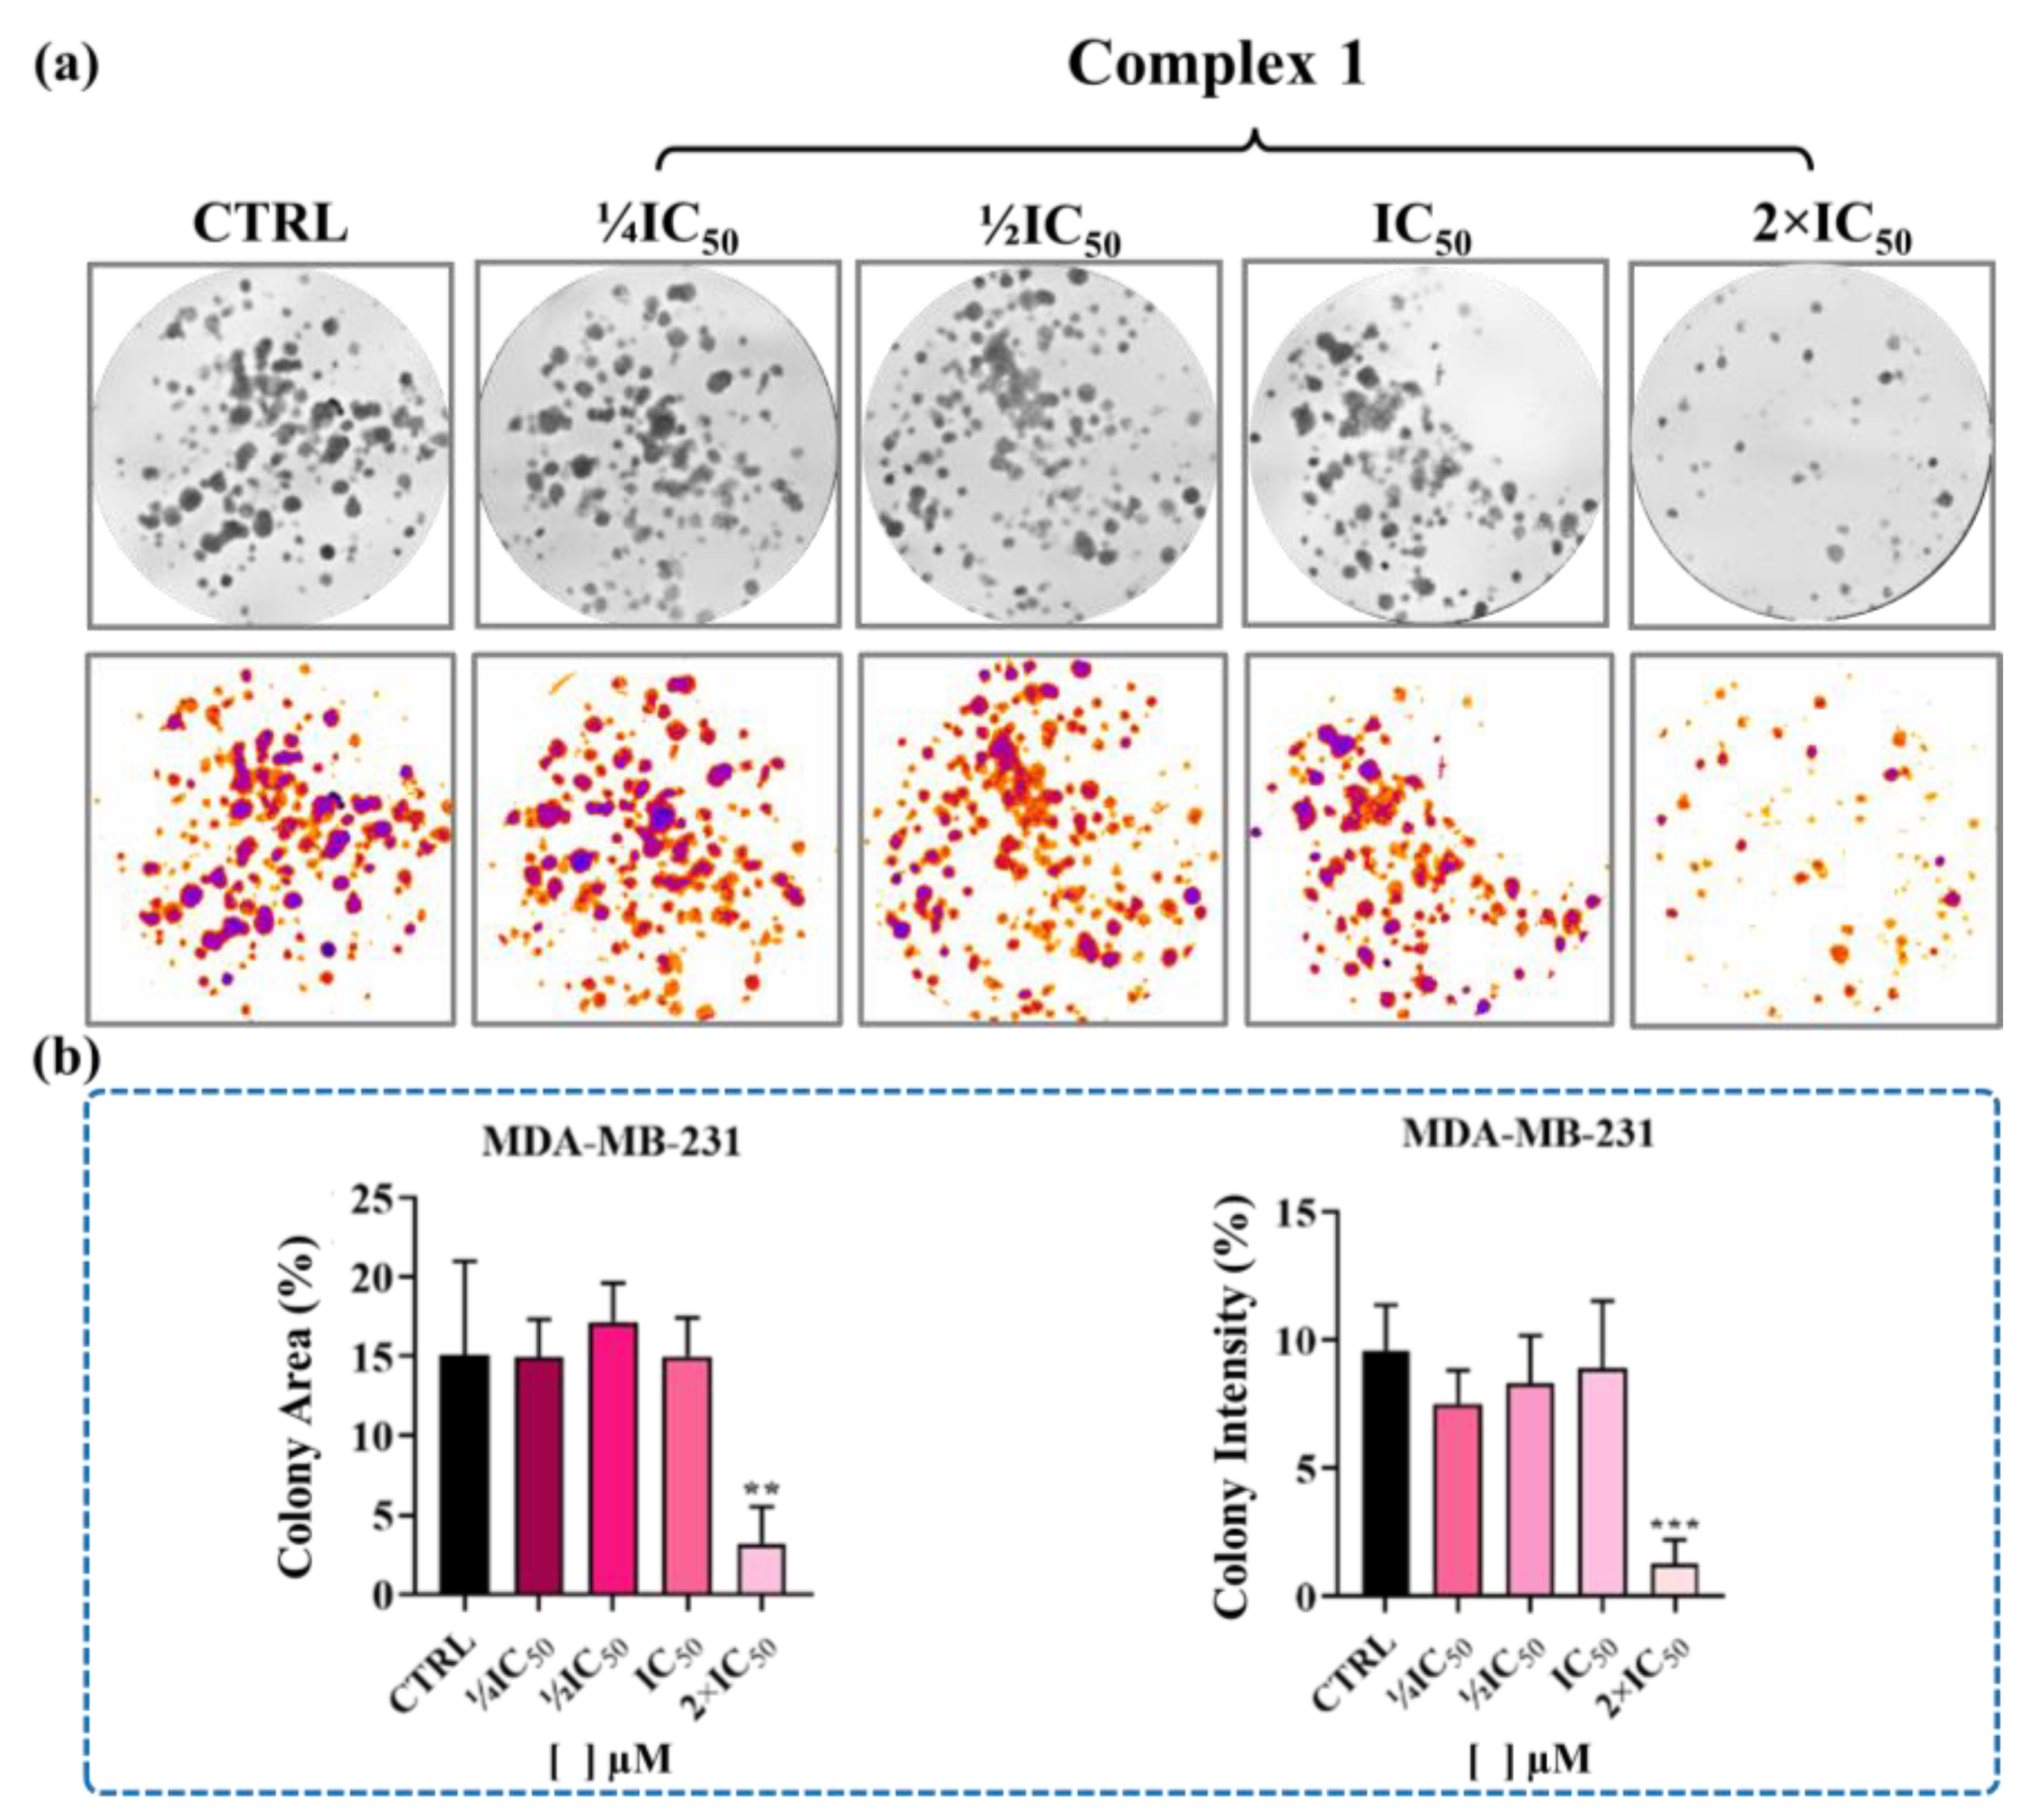
4.10. Colony Formation

A density of 300 cells/well of the MDA-MB-231 cell line was seeded into a 6-well plate and incubated at 37 °C in 5% CO2 for 24 h to cell adhesion. Then, the cells were treated with complexes 1 and 4 at concentrations of ¼ × IC50, ½ × IC50, IC50, and 2 × IC50 for 48 h. The medium was replaced with fresh medium without any complex, and the cells were incubated for 10 days. Then, the cells were washed with PBS, fixed with methanol and acid acetic (3:1) for 5 min, and stained with a kit for fast differential staining in hematology Instant Prov (Newprov Products for Laboratóry Ltda, Pinhais, PR, Brazil). The relative survival was calculated using ImageJ software version 1.53t, using the plugin “ColonyArea” that measures the area and intensity of each colony in the selected image.

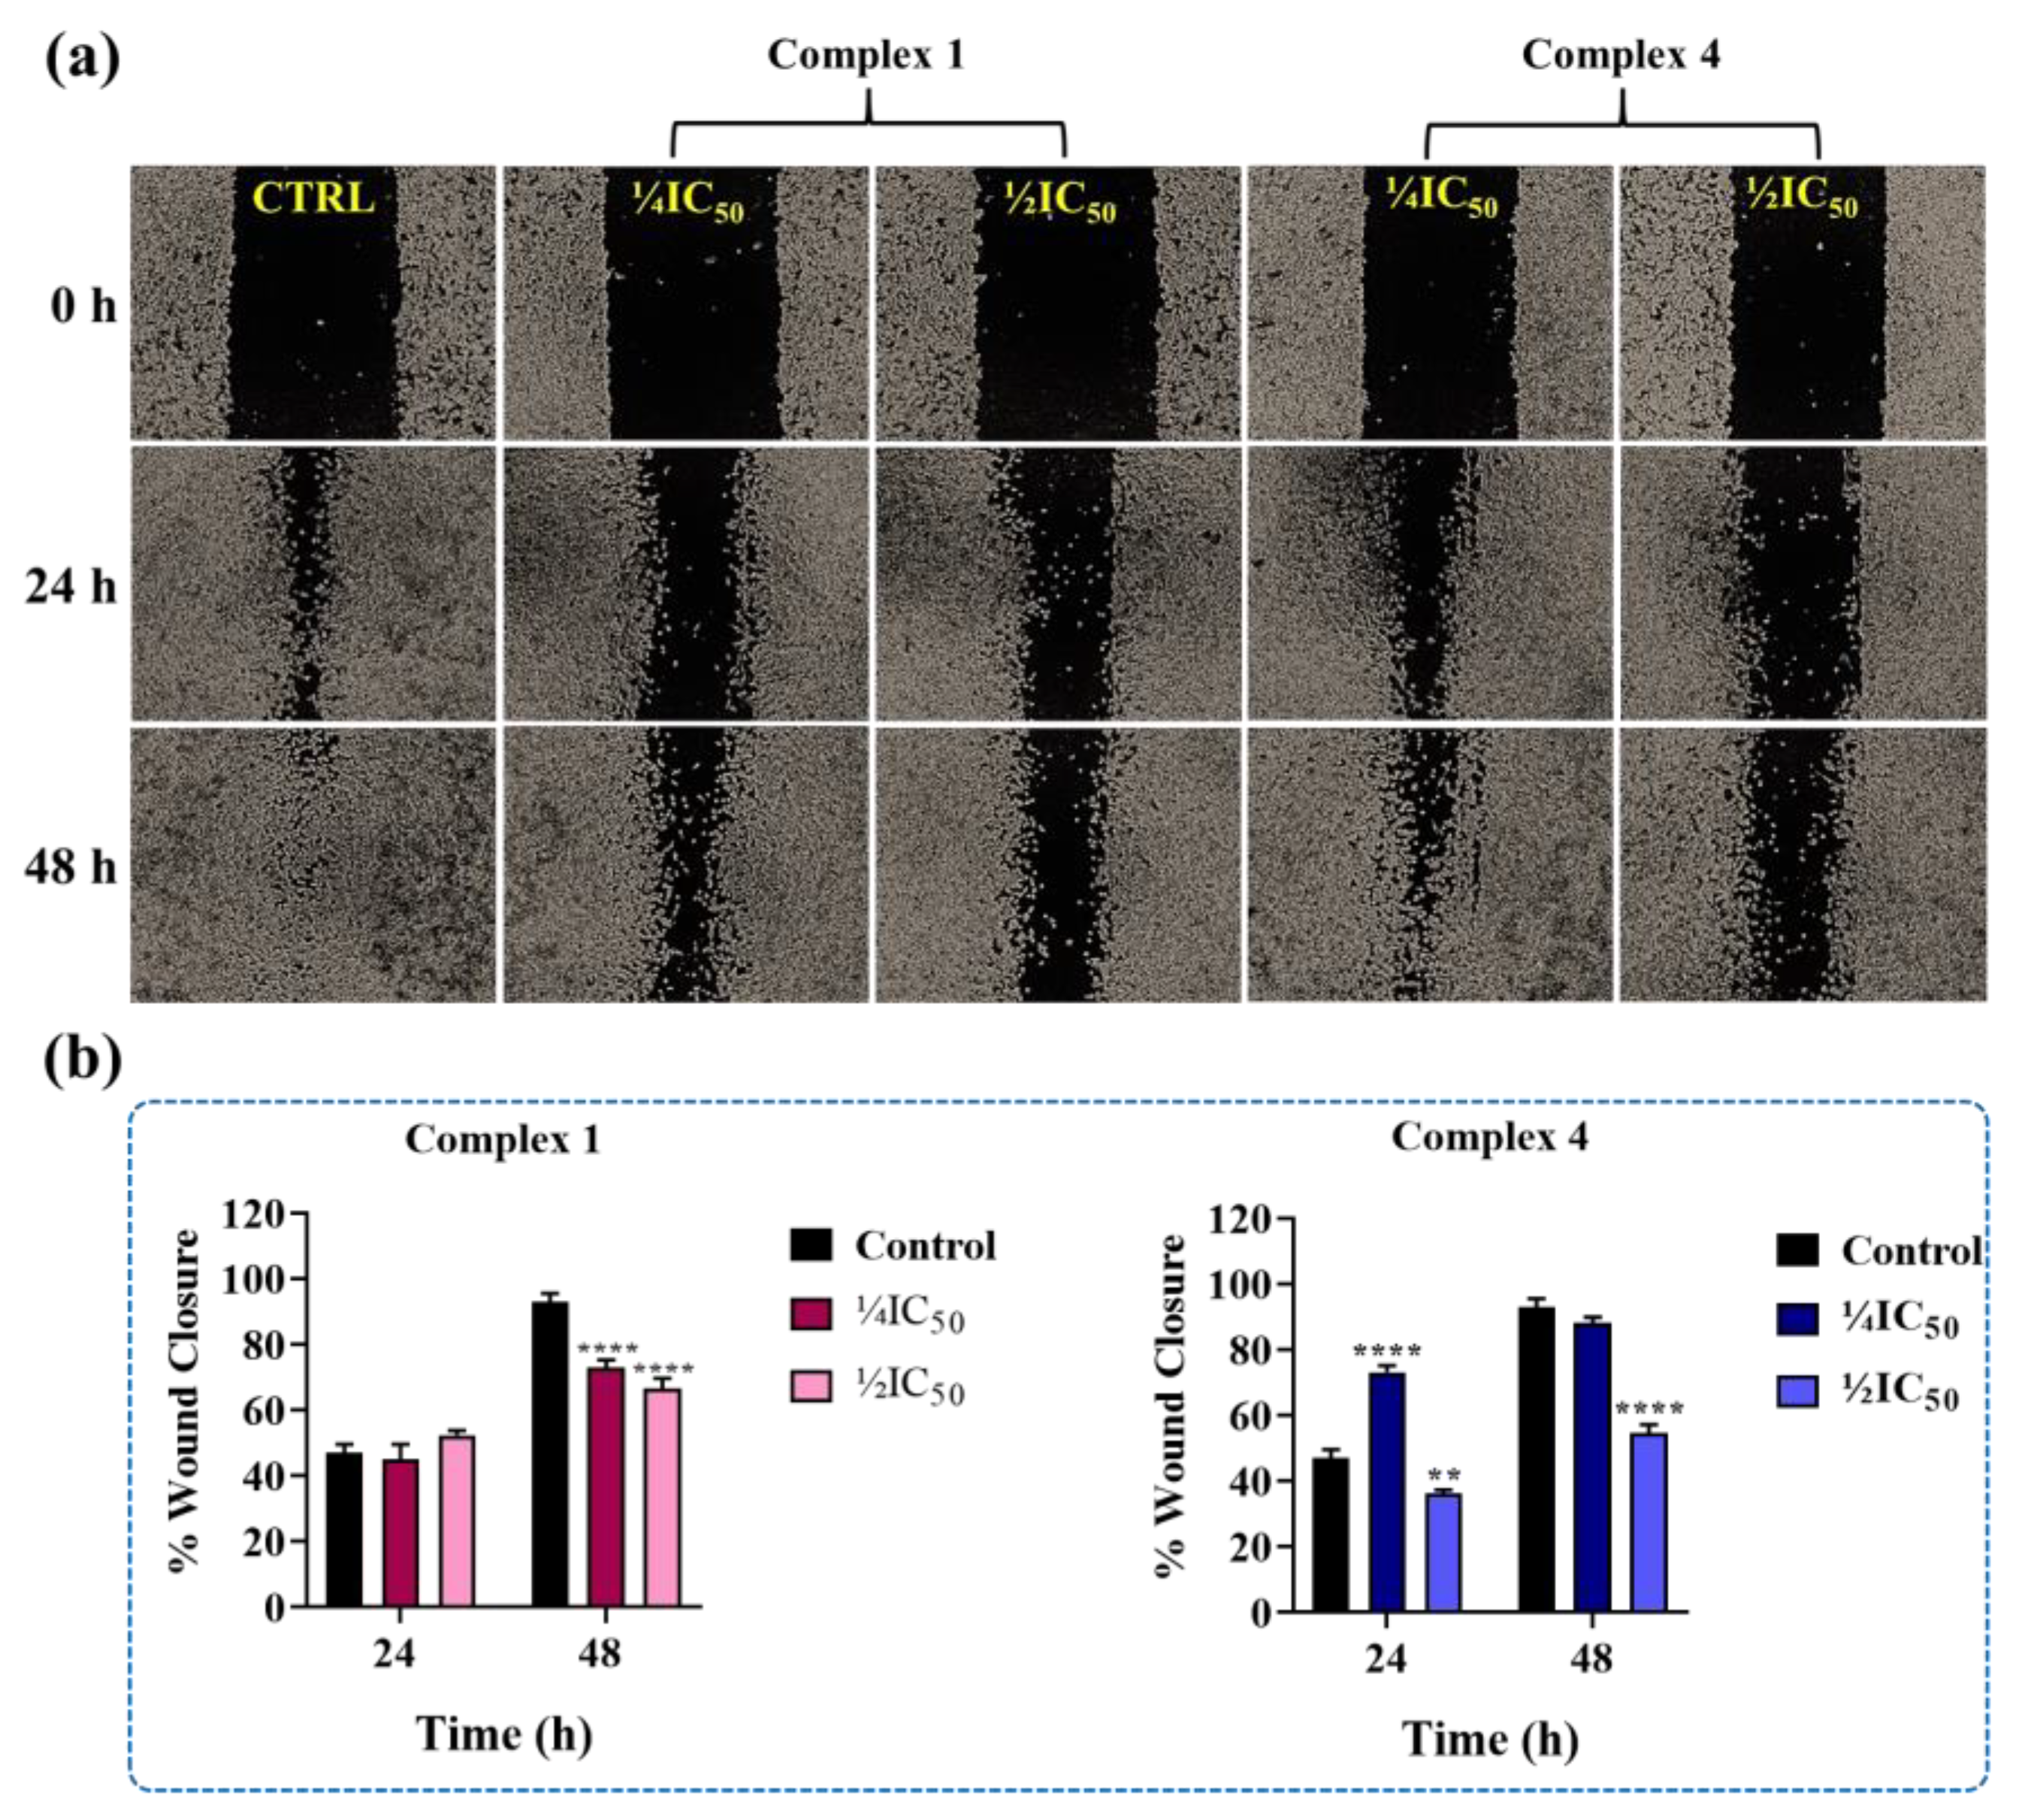
4.11. Scratch Assay (Wound Healing)

MDA-MB-231 cells were seeded at a density of 2 × 10⁵ cells/well in 12-well plates and incubated in a humidified oven at 37 °C with 5% CO2 until the culture reached about 90% confluence. Then, a stripe was made in the center of each well using a tip with a maximum volume of 200 μL and a ruler. Carefully, the wells were washed with PBS to remove cell fragments and detached cells from the scratched area. The cells were pre-treated with Mitomine C (10 µg/mL) for 2 h. When the Mitomycin C was removed, the cells were treated with complexes 1 and 4 at concentrations of ¼ × IC50 and ½ × IC50. Images of the stripe from each well were captured at four different fields at 0 h, 24 h, and 48 h after treatment, using an inverted microscope (Nikon, T5100) coupled with a camera (Moticam 1000-1.3 Megapixels Live Resolution). The area of the stripe closure by cell migration was measured using ImageJ software, and the percentage of stripe closure was calculated using the following equation:
% W o u n d   C l o s u r e = [ ( A t = 0 h A t = h ) ] × 100
where At=0h is the measure of the scratched area at time 0 h, and At=Δh is the measure of the scratched area at 24 or 48 h. The experiment was performed in triplicate. The cells treated with 0.5% DMSO were the negative control.

5. Conclusions

This study presented the synthesis, characterization, and biological evaluation of four Cu(I)/PPh3/naphthoquinone complexes. The crystal structures of the complexes revealed the bidentate coordination of naphthoquinones to the metal center via phenolic and carbonyl oxygen atoms, resulting in distorted tetrahedral geometries. The FTIR and NMR spectroscopic analyses of the complexes confirmed the coordination modes of the ligands to the metal. The electronic spectra of the complexes displayed characteristic bands corresponding to ligand-to-metal charge transfer transitions and intramolecular charge transfer transitions. Furthermore, the photochemical properties of complex 4 were investigated, demonstrating the oxygen-dependent photodegradation and generation of reactive oxygen species (ROS) upon irradiation. The EPR analysis confirmed the formation of ·OOH and ·OH adducts, indicating the potential of these complexes to generate ROS and enhanced cytotoxicity. In terms of biological studies, the complexes exhibited cytotoxic effects against tumor cell lines (MCF-7, MDA-MB-231, and A549) and non-tumor cell lines (MCF-10A and MRC-5), with higher toxicity compared to cisplatin. However, the complexes also showed significant toxicity to non-tumoral cells, resulting in low selectivity indices. Complexes 1 and 4 were further investigated using the MDA-MB-231 cell line, showing that these complexes induced cell death, inhibited colony formation, and demonstrated their ability to inhibit cell migration. Overall, this study highlights the potential of Cu(I)–PPh3–naphthoquinone complexes as cytotoxic agents with the ability to induce cell death and inhibit cell migration. Further studies are warranted to enhance the stability of these complexes and explore their potential as photosensitizers for photodynamic therapy.

Supplementary Materials

The following supporting information can be downloaded at: https://www.mdpi.com/article/10.3390/inorganics11090367/s1. Figure S1. FTIR spectra for the naphthoquinone ligand (NQ4) and complex 1. Figure S2. FTIR spectra for the naphthoquinone ligand (NQ2) and complex 2. Figure S3. FTIR spectra for the naphthoquinone ligand (NQ3) and complex 3. Figure S4. FTIR spectra for the naphthoquinone ligand (NQ4) and complex 4. Figure S5. 1H-1H COSY NMR of the aromatic region of complex 1, in CDCl3. Figure S6. 13C(1H) NMR spectrum of complex 1, in CDCl3. Figure S7. 1H–13C HMBC NMR of complex 1, in CDCl3. Figure S8. 1H–13C HSQC NMR of complex 1, in CDCl3. Figure S9. 1H NMR spectrum of complex 2, in CDCl3. Figure S10. 1H–1H COSY NMR of complex 2, in CDCl3. Figure S11. 13C(1H) NMR spectrum of complex 2, in CDCl3. Figure S12. 1H–13C HMBC NMR of complex 2, in CDCl3. Figure S13. 1H–13C HSQC NMR of complex 2, in CDCl3. Figure S14. 1H NMR spectrum of complex 3, in (CD3)2CO. Figure S15. 1H–1H COSY NMR of complex 3, in (CD3)2CO. Figure S16. 13C(1H) NMR spectrum of complex 3, in (CD3)2CO. Figure S17. 1H–13C HMBC NMR of complex 3, in (CD3)2CO. Figure S18. 1H–13C HSQC NMR of complex 3, in (CD3)2CO. Figure S19. 1H NMR spectrum of complex 4, in (CD3)2CO. Figure S20. 1H–1H COSY NMR of complex 4, in (CD3)2CO. Figure S21. 13C(1H) NMR spectrum of complex 4, in (CD3)2CO. Figure S22. 1H–13C HMBC NMR of complex 4, in (CD3)2CO. Figure S23. 1H–13C HSQC NMR of complex 4, in (CD3)2CO. Figure S24. UV-vis absorbance for samples of the precursor complex, complexes 1 and 2, and their respective naphthoquinone ligands, in acetonitrile. Figure S25. UV-vis absorbance for samples of the precursor complex, complexes 3 and 4, and their respective naphthoquinone ligands, in acetonitrile. Figure S26. EPR spectra of compound 4 reacted with DMPO in DMSO solvent at 77K. Figure S27. EPR spectra of compound 4b reacted with DMPO in DMSO solvent at room temperature. Figure S28. EPR spectra of Complex 4 reacted with DMPO in DMSO solvent at room temperature. Figure S29. Cytotoxicity of complexes. Figure S30. 31P(1H) NMR spectra in DMSO/Culture medium 9:1 of the complexes 1, 2, 3, and 4 at different times. Figure S31. UV-vis spectra in DMSO/Culture medium 1:199 of the complexes 1, 2, 3, and 4 at different times. Figure S32. Clonogenic survival of MDA-MB-231 cells treated with different concentrations of complex 4 for 48 h. Table S1. Crystal data and structure refinement parameters obtained for the complexes 1 and 2. Table S2. Tentative assignment of the vibrational frequencies (cm−1) of the ν(C1=O1 ν(C2-O2) and ν(C4=O3) stretches for the free and after coordinated naphthoquinone ligands, and the respective shifts (Δ) after coordination. Table S3. Maximum absorption wavelength (λ, nm), molar absorptivity (ε, mol−1L cm−1), and tentative assignment of the bands of the ligands NQ1 NQ4 and their respective complexes 14 in acetonitrile solution. Table S4. EPR parameters obtained from simulation of the experimental spectra of the DMPO-•OOH and DMPO-•OH adducts. Table S5. EPR parameters obtained from simulation of the spectrum measured at 77K temperature (liquid N2), with four spectral components.

Author Contributions

Conceptualization, A.A.B. and C.M.L.; methodology, C.M.L.; validation, O.R.N. and E.E.C.; investigation, A.P.M.G., F.C.D., C.M.L., J.H.A.-N., A.R.C., O.R.N., C.D.N., E.E.C., and A.A.B.; writing—original draft preparation, C.M.L., J.H.A.-N. and A.A.B.; supervision, A.A.B. All authors have read and agreed to the published version of the manuscript.

Funding

This research was funded by FAPESP (grants 2022/11924-8, 2020/14561-8 and 2017/15850-0), CNPq, and CAPES.

Data Availability Statement

Crystallographic data were deposited at the Cambridge Crystallographic Data Centre as a supplementary publication (CCDC 2279524 for complex 1 and CCDC 2279525 for complex 2). Copies of the data can be obtained, free of charge, via www.ccdc.cam.ac.uk/conts/ retrieving.html (or from the Cambridge Crystallographic Data Centre, CCDC, 12 Union Road, Cambridge CB2 1EZ, UK; fax: +44-1223-336033; or e-mail: [email protected]).

Acknowledgments

The authors thank Gianella Facchin, Facultad de Química, Facultad de Química, Univer sidad de la República, Montevideo, Uruguay, for the invitation.

Conflicts of Interest

The authors declare no conflict of interest.

References

  1. Bray, F.; Laversanne, M.; Weiderpass, E.; Soerjomataram, I. The Ever-Increasing Importance of Cancer as a Leading Cause of Premature Death Worldwide. Cancer 2021, 127, 3029–3030. [Google Scholar] [CrossRef]
  2. Crosby, D.; Bhatia, S.; Brindle, K.M.; Coussens, L.M.; Dive, C.; Emberton, M.; Esener, S.; Fitzgerald, R.C.; Gambhir, S.S.; Kuhn, P.; et al. Early Detection of Cancer. Science 2022, 375, eaay9040. [Google Scholar] [CrossRef] [PubMed]
  3. Somarelli, J.A.; DeGregori, J.; Gerlinger, M.; Heng, H.H.; Marusyk, A.; Welch, D.R.; Laukien, F.H. Questions to Guide Cancer Evolution as a Framework for Furthering Progress in Cancer Research and Sustainable Patient Outcomes. Med. Oncol. 2022, 39, 137. [Google Scholar] [CrossRef] [PubMed]
  4. Garreffa, E.; Arora, D. Breast Cancer in the Elderly, in Men and during Pregnancy. Surgery 2022, 40, 139–146. [Google Scholar] [CrossRef]
  5. Smolarz, B.; Nowak, A.Z.; Romanowicz, H. Breast Cancer—Epidemiology, Classification, Pathogenesis and Treatment (Review of Literature). Cancers 2022, 14, 2569. [Google Scholar] [CrossRef]
  6. Rossi, C.; Cicalini, I.; Cufaro, M.C.; Consalvo, A.; Upadhyaya, P.; Sala, G.; Antonucci, I.; Del Boccio, P.; Stuppia, L.; De Laurenzi, V. Breast Cancer in the Era of Integrating “Omics” Approaches. Oncogenesis 2022, 11, 17. [Google Scholar] [CrossRef]
  7. Kavan, S.; Kruse, T.A.; Vogsen, M.; Hildebrandt, M.G.; Thomassen, M. Heterogeneity and Tumor Evolution Reflected in Liquid Biopsy in Metastatic Breast Cancer Patients: A Review. Cancer Metastasis Rev. 2022, 41, 433–446. [Google Scholar] [CrossRef]
  8. Mehraj, U.; Mushtaq, U.; Mir, M.A.; Saleem, A.; Macha, M.A.; Lone, M.N.; Hamid, A.; Zargar, M.A.; Ahmad, S.M.; Wani, N.A. Chemokines in Triple-Negative Breast Cancer Heterogeneity: New Challenges for Clinical Implications. Semin. Cancer Biol. 2022, 86, 769–783. [Google Scholar] [CrossRef]
  9. Fusco, N.; Sajjadi, E.; Venetis, K.; Ivanova, M.; Andaloro, S.; Guerini-Rocco, E.; Montagna, E.; Caldarella, P.; Veronesi, P.; Colleoni, M.; et al. Low-Risk Triple-Negative Breast Cancers: Clinico-Pathological and Molecular Features. Crit. Rev. Oncol. Hematol. 2022, 172, 103643. [Google Scholar] [CrossRef]
  10. Herbst, R.S.; Morgensztern, D.; Boshoff, C. The Biology and Management of Non-Small Cell Lung Cancer. Nature 2018, 553, 446–454. [Google Scholar] [CrossRef]
  11. Marino, F.Z.; Bianco, R.; Accardo, M.; Ronchi, A.; Cozzolino, I.; Morgillo, F.; Rossi, G.; Franco, R. Molecular Heterogeneity in Lung Cancer: From Mechanisms of Origin to Clinical Implications. Int. J. Med. Sci. 2019, 16, 981–989. [Google Scholar] [CrossRef] [PubMed]
  12. De Sousa, V.M.L.; Carvalho, L. Heterogeneity in Lung Cancer. Pathobiology 2018, 85, 96–107. [Google Scholar] [CrossRef] [PubMed]
  13. Testa, U.; Castelli, G.; Pelosi, E. Lung Cancers: Molecular Characterization, Clonal Heterogeneity and Evolution, and Cancer Stem Cells. Cancers 2018, 10, 248. [Google Scholar] [CrossRef] [PubMed]
  14. Gamberi, T.; Hanif, M. Metal-Based Complexes in Cancer Treatment. Biomedicines 2022, 10, 2573. [Google Scholar] [CrossRef] [PubMed]
  15. Ndagi, U.; Mhlongo, N.; Soliman, M.E. Metal Complexes in Cancer Therapy—An Update from Drug Design Perspective. Drug Des. Devel. Ther. 2017, 11, 599–616. [Google Scholar] [CrossRef]
  16. Paprocka, R.; Wiese-Szadkowska, M.; Janciauskiene, S.; Kosmalski, T.; Kulik, M.; Helmin-Basa, A. Latest Developments in Metal Complexes as Anticancer Agents. Coord. Chem. Rev. 2022, 452, 85–94. [Google Scholar] [CrossRef]
  17. Li, X.; Wang, Y.; Li, M.; Wang, H.; Dong, X. Metal Complexes or Chelators with ROS Regulation Capacity: Promising Candidates for Cancer Treatment. Molecules 2022, 27, 148. [Google Scholar] [CrossRef]
  18. Neethu, K.S.; Sivaselvam, S.; Theetharappan, M.; Ranjitha, J.; Bhuvanesh, N.S.P.; Ponpandian, N.; Neelakantan, M.A.; Kaveri, M.V. In Vitro Evaluations of Biomolecular Interactions, Antioxidant and Anticancer Activities of Nickel(II) and Copper(II) Complexes with 1:2 Coordination of Anthracenyl Hydrazone Ligands. Inorganica Chim. Acta 2021, 524, 120419. [Google Scholar] [CrossRef]
  19. Guan, D.; Zhao, L.; Shi, X.; Ma, X.; Chen, Z. Copper in Cancer: From Pathogenesis to Therapy. Biomed. Pharmacother. 2023, 163, 114791. [Google Scholar] [CrossRef]
  20. Wang, C.; Yang, X.; Dong, C.; Chai, K.; Ruan, J.; Shi, S. Cu-Related Agents for Cancer Therapies. Coord. Chem. Rev. 2023, 487, 215156. [Google Scholar] [CrossRef]
  21. Ji, P.; Wang, P.; Chen, H.; Xu, Y.; Ge, J.; Tian, Z.; Yan, Z. Potential of Copper and Copper Compounds for Anticancer Applications. Pharmaceuticals 2023, 16, 234. [Google Scholar] [CrossRef]
  22. Singh, N.K.; Kumbhar, A.A.; Pokharel, Y.R.; Yadav, P.N. Anticancer Potency of Copper(II) Complexes of Thiosemicarbazones. J. Inorg. Biochem. 2020, 210, 111134. [Google Scholar] [CrossRef] [PubMed]
  23. Castillo-Rodríguez, R.A.; Palencia, G.; Anaya-Rubio, I.; Gallardo-Pérez, J.C.; Jiménez-Farfán, D.; Escamilla-Ramírez, Á.; Zavala-Vega, S.; Cruz-Salgado, A.; Cervantes-Rebolledo, C.; Gracia-Mora, I.; et al. Anti-Proliferative, pro-Apoptotic and Anti-Invasive Effect of the Copper Coordination Compound Cas III-La through the Induction of Reactive Oxygen Species and Regulation of Wnt/β-Catenin Pathway in Glioma. J. Cancer 2021, 12, 5693–5711. [Google Scholar] [CrossRef] [PubMed]
  24. da Silva, D.A.; De Luca, A.; Squitti, R.; Rongioletti, M.; Rossi, L.; Machado, C.M.L.; Cerchiaro, G. Copper in Tumors and the Use of Copper-Based Compounds in Cancer Treatment. J. Inorg. Biochem. 2022, 226, 111634. [Google Scholar] [CrossRef] [PubMed]
  25. Chen, M.; Chen, X.; Huang, G.; Jiang, Y.; Gou, Y.; Deng, J. Synthesis, Anti-Tumour Activity, and Mechanism of Benzoyl Hydrazine Schiff Base-Copper Complexes. J. Mol. Struct. 2022, 1268, 133730. [Google Scholar] [CrossRef]
  26. Jiang, Y.; Huo, Z.; Qi, X.; Zuo, T.; Wu, Z. Copper-Induced Tumor Cell Death Mechanisms and Antitumor Theragnostic Applications of Copper Complexes. Nanomedicine 2022, 17, 303–324. [Google Scholar] [CrossRef]
  27. Jung, H.S.; Koo, S.; Won, M.; An, S.; Park, H.; Sessler, J.L.; Han, J.; Kim, J.S. Cu(Ii)-BODIPY Photosensitizer for CAIX Overexpressed Cancer Stem Cell Therapy. Chem. Sci. 2023, 14, 1808–1819. [Google Scholar] [CrossRef]
  28. Wellington, K.W. Understanding Cancer and the Anticancer Activities of Naphthoquinones-a Review. RSC Adv. 2015, 5, 20309–20338. [Google Scholar] [CrossRef]
  29. Hong, S.; Huber, S.M.; Gagliardi, L.; Cramer, C.C.; Tolman, W.B. Copper(I)-α-Ketocarboxylate Complexes: Characterization and O 2 Reactions That Yield Copper-Oxygen Intermediates Capable of Hydroxylating Arenes. J. Am. Chem. Soc. 2007, 129, 14190–14192. [Google Scholar] [CrossRef]
  30. Mohd Zubir, M.Z.; Jamaludin, N.S.; Abdul Halim, S.N. Hirshfeld Surface Analysis of Some New Heteroleptic Copper(I) Complexes. J. Mol. Struct. 2019, 1193, 141–150. [Google Scholar] [CrossRef]
  31. Cabrera, A.R.; Gonzalez, I.A.; Cortés-Arriagada, D.; Natali, M.; Berke, H.; Daniliuc, C.G.; Camarada, M.B.; Toro-Labbé, A.; Rojas, R.S.; Salas, C.O. Synthesis of New Phosphorescent Imidoyl-Indazol and Phosphine Mixed Ligand Cu(i) Complexes-Structural Characterization and Photophysical Properties. RSC Adv. 2016, 6, 5141–5153. [Google Scholar] [CrossRef]
  32. Villarreal, W.; Colina-Vegas, L.; Visbal, G.; Corona, O.; Corrêa, R.S.; Ellena, J.; Cominetti, M.R.; Batista, A.A.; Navarro, M. Copper(I)-Phosphine Polypyridyl Complexes: Synthesis, Characterization, DNA/HSA Binding Study, and Antiproliferative Activity. Inorg. Chem. 2017, 56, 3781–3793. [Google Scholar] [CrossRef] [PubMed]
  33. Meza-Morales, W.; Machado-Rodriguez, J.C.; Alvarez-Ricardo, Y.; Obregón-Mendoza, M.A.; Nieto-Camacho, A.; Toscano, R.A.; Soriano-García, M.; Cassani, J.; Enríquez, R.G. A New Family of Homoleptic Copper Complexes of Curcuminoids: Synthesis, Characterization and Biological Properties. Molecules 2019, 24, 910. [Google Scholar] [CrossRef] [PubMed]
  34. Małecki, J.G.; Maroń, A.; Palion, J.; Nycz, J.E.; Szala, M. A Copper(I) Phosphine Complex with 5,7-Dinitro-2-Methylquinolin-8-Ol as Co-Ligand. Transit. Met. Chem. 2014, 39, 755–762. [Google Scholar] [CrossRef]
  35. Aliaga-Alcalde, N.; Marqués-Gallego, P.; Kraaijkamp, M.; Herranz-Lancho, C.; Den Dulk, H.; Görner, H.; Roubeau, O.; Teat, S.J.; Weyhermüller, T.; Reedijk, J. Copper Curcuminoids Containing Anthracene Groups: Fluorescent Molecules with Cytotoxic Activity. Inorg. Chem. 2010, 49, 9655–9663. [Google Scholar] [CrossRef] [PubMed]
  36. Aguirrechu-Comerón, A.; Oramas-Royo, S.; Pérez-Acosta, R.; Hernández-Molina, R.; Gonzalez-Platas, J.; Estévez-Braun, A. Preparation of New Metallic Complexes from 2-Hydroxy-3-((5-Methylfuran-2-Yl)Methyl)-1,4-Naphthoquinone. Polyhedron 2020, 177, 114280. [Google Scholar] [CrossRef]
  37. Oliveira, K.M.; Peterson, E.J.; Carroccia, M.C.; Cominetti, M.R.; Deflon, V.M.; Farrell, N.P.; Batista, A.A.; Correa, R.S. Ru(Ii)-Naphthoquinone Complexes with High Selectivity for Triple-Negative Breast Cancer. Dalt. Trans. 2020, 49, 16193–16203. [Google Scholar] [CrossRef]
  38. Oliveira, K.M.; Liany, L.-D.; Corrêa, R.S.; Deflon, V.M.; Cominetti, M.R.; Batista, A.A. Selective Ru(II)/Lawsone Complexes Inhibiting Tumor Cell Growth by Apoptosis. J. Inorg. Biochem. 2017, 176, 66–76. [Google Scholar] [CrossRef]
  39. Chaquin, P.; Canac, Y.; Lepetit, C.; Zargarian, D.; Chauvin, R. Estimating Local Bonding/Antibonding Character of Canonical Molecular Orbitals from Their Energy Derivatives. The Case of Coordinating Lone Pair Orbitals. Int. J. Quantum Chem. 2016, 116, 1285–1295. [Google Scholar] [CrossRef]
  40. Salunke-Gawali, S.; Pereira, E.; Dar, U.A.; Bhand, S. Metal Complexes of Hydroxynaphthoquinones: Lawsone, Bis-Lawsone, Lapachol, Plumbagin and Juglone. J. Mol. Struct. 2017, 1148, 435–458. [Google Scholar] [CrossRef]
  41. Majdi, C.; Duvauchelle, V.; Meffre, P.; Benfodda, Z. An Overview on the Antibacterial Properties of Juglone, Naphthazarin, Plumbagin and Lawsone Derivatives and Their Metal Complexes. Biomed. Pharmacother. 2023, 162, 114690. [Google Scholar] [CrossRef]
  42. Kosiha, A.; Parthiban, C.; Ciattini, S.; Chelazzi, L.; Elango, K.P. Metal Complexes of Naphthoquinone Based Ligand: Synthesis, Characterization, Protein Binding, DNA Binding/Cleavage and Cytotoxicity Studies. J. Biomol. Struct. Dyn. 2018, 36, 4170–4181. [Google Scholar] [CrossRef] [PubMed]
  43. Selvaraj, F.S.S.; Samuel, M.; Karuppiah, A.K.; Raman, N. Transition Metal Complexes Incorporating Lawsone: A Review. J. Coord. Chem. 2022, 75, 2509–2532. [Google Scholar] [CrossRef]
  44. Oladipo, S.D.; Mocktar, C.; Omondi, B. In Vitro Biological Studies of Heteroleptic Ag(I) and Cu(I) Unsymmetrical N,N′-Diarylformamidine Dithiocarbamate Phosphine Complexes; the Effect of the Metal Center. Arab. J. Chem. 2020, 13, 6379–6394. [Google Scholar] [CrossRef]
  45. Fan, W.W.; Li, Z.F.; Li, J.B.; Yang, Y.P.; Yuan, Y.; Tang, H.Q.; Gao, L.X.; Jin, Q.H.; Zhang, Z.W.; Zhang, C.L. Synthesis, Structure, Terahertz Spectroscopy and Luminescent Properties of Copper (I) Complexes with Bis(Diphenylphosphino)Methane and N-Donor Ligands. J. Mol. Struct. 2015, 1099, 351–358. [Google Scholar] [CrossRef]
  46. Wu, Y.; Han, X.; Qu, Y.; Zhao, K.; Wang, C.; Huang, G.; Wu, H. Two Cu(I) Complexes Constructed by Different N-Heterocyclic Benzoxazole Ligands: Syntheses, Structures and Fluorescent Properties. J. Mol. Struct. 2019, 1191, 95–100. [Google Scholar] [CrossRef]
  47. Leite, C.M.; Honorato, J.; Martin, A.C.B.M.; Silveira, R.G.; Colombari, F.M.; Amaral, J.C.; Costa, A.R.; Cominetti, M.R.; Plutin, A.M.; Aguiar, D.; et al. Experimental and Theoretical DFT Study of Cu(I)/N,N-Disubstituted-N′-acylthioureato Anticancer Complexes: Actin Cytoskeleton and Induction of Death by Apoptosis in Triple-Negative Breast Tumor Cells. Inorg. Chem. 2022, 61, 664–677. [Google Scholar] [CrossRef]
  48. Gunasekaran, N.; Bhuvanesh, N.S.P.; Karvembu, R. Synthesis, Characterization and Catalytic Oxidation Property of Copper(I) Complexes Containing Monodentate Acylthiourea Ligands and Triphenylphosphine. Polyhedron 2017, 122, 39–45. [Google Scholar] [CrossRef]
  49. Idriss, K.A.; Sedaira, H.; Hashem, E.Y.; Saleh, M.S.; Soliman, S.A. The Visible Absorbance Maximum of 2-Hydroxy-1,4-Naphthoquinone as a Novel Probe for the Hydrogen Bond Donor Abilities of Solvents and Solvent Mixtures. Monatshefte Fur Chem. 1996, 127, 29–42. [Google Scholar] [CrossRef]
  50. McCormick, T.; Jia, W.L.; Wang, S. Phosphorescent Cu(I) Complexes of 2-(2′-Pyridylbenzimidazolyl) Benzene: Impact of Phosphine Ancillary Ligands on Electronic and Photophysical Properties of the Cu(I) Complexes. Inorg. Chem. 2006, 45, 147–155. [Google Scholar] [CrossRef] [PubMed]
  51. Ibis, C.; Sahinler Ayla, S.; Babayeva, E. Reactions of Quinones with Some Amino Alcohols, Thiols and a UV-Vis Study. Phosphorus Sulfur Silicon Relat. Elem. 2020, 195, 474–480. [Google Scholar] [CrossRef]
  52. Sørensen, T.; Nielsen, M. Synthesis, UV/Vis Spectra and Electrochemical Characterisation of Arylthio and Styryl Substituted Ferrocenes. Open Chem. 2011, 9, 610–618. [Google Scholar] [CrossRef]
  53. Verma, S.K.; Singh, V.K. Synthesis, Electrochemical, Fluorescence and Antimicrobial Studies of 2-Chloro-3-Amino-1,4-Naphthoquinone Bearing Mononuclear Transition Metal Dithiocarbamate Complexes [M{κ2S,S-S2C–Piperazine–C2H4N(H)ClNQ}n]. RSC Adv. 2015, 5, 53036–53046. [Google Scholar] [CrossRef]
  54. Win, T.; Bittner, S. Novel 2-Amino-3-(2,4-Dinitrophenylamino) Derivatives of 1,4-Naphthoquinone. Tetrahedron Lett. 2005, 46, 3229–3231. [Google Scholar] [CrossRef]
  55. Záliš, S.; Fiedler, J.; Pospíšil, L.; Fanelli, N.; Lanza, C.; Lampugnani, L. Electron Transfer in Donor–Acceptor Molecules of Substituted Naphtoquinones: Spectral and Redox Properties of Internal Charge Transfer Complexes. Microchem. J. 1996, 54, 478–486. [Google Scholar] [CrossRef] [PubMed]
  56. Sutovsky, Y.; Likhtenshtein, G.I.; Bittner, S. Synthesis and Photochemical Behavior of Donor-Acceptor Systems Obtained from Chloro-1,4-Naphthoquinone Attached to Trans-Aminostilbenes. Tetrahedron 2003, 59, 2939–2945. [Google Scholar] [CrossRef]
  57. Nowicka, B.; Walczak, J.; Kapsiak, M.; Barnaś, K.; Dziuba, J.; Suchoń, A. Impact of Cytotoxic Plant Naphthoquinones, Juglone, Plumbagin, Lawsone and 2-Methoxy-1,4-Naphthoquinone, on Chlamydomonas Reinhardtii Reveals the Biochemical Mechanism of Juglone Toxicity by Rapid Depletion of Plastoquinol. Plant Physiol. Biochem. 2023, 197, 107660. [Google Scholar] [CrossRef]
  58. Pieta, P.; Petr, A.; Kutner, W.; Dunsch, L. In Situ ESR Spectroscopic Evidence of the Spin-Trapped Superoxide Radical, O2{radical Dot}-, Electrochemically Generated in DMSO at Room Temperature. Electrochim. Acta 2008, 53, 3412–3415. [Google Scholar] [CrossRef]
  59. Clément, J.L.; Ferré, N.; Siri, D.; Karoui, H.; Rockenbauer, A.; Tordo, P. Assignment of the EPR Spectrum of 5,5-Dimethyl-1-Pyrroline N-Oxide (DMPO) Superoxide Spin Adduct. J. Org. Chem. 2005, 70, 1198–1203. [Google Scholar] [CrossRef] [PubMed]
  60. Shoji, T.; Li, L.; Abe, Y.; Ogata, M.; Ishimoto, Y.; Gonda, R.; Mashino, T.; Mochizuki, M.; Uemoto, M.; Miyata, N. DMPO-OH Radical Formation from 5,5-Dimethyl-1-Pyrroline N-Oxide (DMPO) in Hot Water. Anal. Sci. 2007, 23, 219–221. [Google Scholar] [CrossRef]
  61. Zalibera, M.; Rapta, P.; Staško, A.; Brindzová, L.; Brezová, V. Thermal Generation of Stable Spin Trap Adducts with Super-Hyperfine Structure in Their EPR Spectra: An Alternative EPR Spin Trapping Assay for Radical Scavenging Capacity Determination in Dimethylsulphoxide. Free Radic. Res. 2009, 43, 457–469. [Google Scholar] [CrossRef] [PubMed]
  62. Massagué, J.; Obenauf, A.C. Metastatic Colonization by Circulating Tumour Cells. Nature 2016, 529, 298–306. [Google Scholar] [CrossRef] [PubMed]
  63. Fares, J.; Fares, M.Y.; Khachfe, H.H.; Salhab, H.A.; Fares, Y. Molecular Principles of Metastasis: A Hallmark of Cancer Revisited. Signal Transduct. Target. Ther. 2020, 5, 28. [Google Scholar] [CrossRef] [PubMed]
  64. Jonkman, J.E.N.; Cathcart, J.A.; Xu, F.; Bartolini, M.E.; Amon, J.E.; Stevens, K.M.; Colarusso, P. An Introduction to the Wound Healing Assay Using Live-Cell Microscopy. Cell Adhes. Migr. 2014, 8, 440–451. [Google Scholar] [CrossRef]
  65. Stamm, A.; Reimers, K.; Strauß, S.; Vogt, P.; Scheper, T.; Pepelanova, I. In Vitro Wound Healing Assays—State of the Art. BioNanoMaterials 2016, 17, 79–87. [Google Scholar] [CrossRef]
  66. Al Habash, A.; Aljasim, L.A.; Owaidhah, O.; Edward, D.P. A Review of the Efficacy of Mitomycin C in Glaucoma Filtration Surgery. Clin. Ophthalmol. 2015, 9, 1945–1951. [Google Scholar] [CrossRef]
  67. Jardine, F.H.; Vohra, A.G.; Young, F.J. Copper(I) Nitrato and Nitrate Complexes. J. Inorg. Nucl. Chem. 1971, 33, 2941–2945. [Google Scholar] [CrossRef]
Scheme 1. Route of synthesis of complexes 14.
Inorganics 11 00367 sch001
Figure 1. Crystal structures of complexes 1 and 2 (CCDC codes 2279524 and 2279525, respectively, thermal ellipsoids at 30%).
Inorganics 11 00367 g001
Figure 2. Characterization of the complexes. (a) FTIR spectra of complex 1 and its respective naphthoquinone ligand in the region of 3800–2600 cm−1, (b) 31P(1H) NMR spectra for complexes 1 and 2 in CDCl3 and 3 and 4 in (CD3)2OD, and (c) 1H NMR spectrum of complex 1 in CDCl3, and assignment of signals referring to the complex.
Inorganics 11 00367 g002
Figure 3. Photochemical stability of complex 4. (a) UV–Vis spectra of a solution of complex 4 in DMSO in the presence of O2 (open system) after irradiation with LED light (375 nm) at different times; (b) UV–Vis spectra of complex 4 in DMSO monitored before and after 19 h of irradiation with LED light (375 nm) and after irradiation ceased; (c) photographs of the cuvettes at the beginning and after 19 h of irradiation with LED light (375 nm); and (d) UV–Vis spectra of a solution of complex 4b in DMSO irradiated at different times in the absence of O2 (solution saturated with argon).
Inorganics 11 00367 g003
Figure 4. EPR analysis. (a) EPR spectra of a solution of complex 4 (10 µM) and DMPO (40 mM) in DMSO, obtained over 60 min of irradiation showing the formation of DMPO–OOH and DMPO-OH adducts; (b) experimental and simulated EPR spectra of a solution of complex 4 (10 µM) and DMPO (40 mM) in DMSO before irradiation, showing the formation of DMPO–OOH adduct; (c) graphic representation of the increase in the EPR signal intensity as a function of irradiation exposure time of the solution of complex 4; and (d) experimental and simulated EPR spectra of a solution of complex 4 (10 µM) and DMPO (40 mM) in DMSO before irradiation, showing the formation of DMPO–OH adduct.
Inorganics 11 00367 g004
Figure 5. MDA-MB-231 cell morphology 48 h after treatment at 1/2IC50, IC50, and 2 × IC50 concentrations of complexes 1 and 4.
Inorganics 11 00367 g005
Figure 6. Clonogenic survival of MDA-MB-231 cells treated with different concentrations of complex 1 for 48 h. (a) Representation of wells and thresholds for the experiment, and (b) graphical quantifications of colony areas and intensities. Data represent the mean ± SD of assays in triplicate. Significance at ** p < 0.01, and *** p < 0.001 levels using ANOVA and Dunnet’s test.
Inorganics 11 00367 g006
Figure 7. Complex 4 effects on MDA-MB-231 cell migration. (a) Representative images obtained in the wound healing assay, in which the effects of complexes 1 and 4 on MDA-MB-231 cell migration were evaluated. The objective used in the experiment had a magnification of 4×. (b) Graphical representation of the percentages of wound closure after 24 and 48 h of incubation with the complexes. Data represent the mean ± SD of triplicate assays. Significance at ** p < 0.01, and **** p < 0.0001 levels using ANOVA and Dunnet’s test.
Inorganics 11 00367 g007
Table 1. Selected interatomic distances and bond angles for complexes 1 and 2.
Bond Lengths (Å)LigandsComplexesBond
Angles (°)
Complexes
NQ1 *NQ2 **1212
Cu1–P1--2.243(4)2.208(5)P1–Cu1–P2127.67(2)118.84(2)
Cu1–P2--2.244(4)2.259(5)P1–Cu1–O1102.92(4)114.28(4)
Cu1–O1--2.227(1)2.228(2)O2–Cu1–P2116.03(4)109.92(5)
Cu1–O2--2.034(1)2.015(1)O2–Cu1–P1114.65(4)123.69(5)
C1–O11.2171.2261.224(2)1.227(2)O2–Cu1–O177.14(4)76.81(6)
C2–O21.3351.3461.273(2)1.278(2)O1–Cu1–P2100.04(4)103.99(5)
C4–O31.2261.2251.230(2)1.237(3)---
* CCDC 1268837, ** CDCC 1189905.
Table 2. In vitro cytotoxicity of complexes 14 against the MDA-MB-231, MCF7, and A549 tumor cell lines, as well as the MCF-10A and MRC-5 non-tumor cell lines, after 48 h of incubation.
Inhibitory Concentration of 50% of Cell Viability, IC50 (μM)
MCF7MDA-MB-231MCF-10AA549MRC-5SI1 *SI2 *SI3 *
115 ± 35.5 ± 0.35.9 ± 0.23.6 ± 0.32.7 ± 0.20.41.10.8
29 ± 16.5 ± 0.34.4 ± 0.86.1 ± 0.43.3 ± 0.20.50.70.5
311 ± 37.2 ± 0.35.4 ± 0.34.4 ± 0.12.8 ± 0.10.50.80.6
47 ± 27.9 ± 0.14.0 ± 0.24.5 ± 0.13.4 ± 0.20.6 0.50.8
Cu(NO3)2·3H2O>25>25>25>25>25---
PPh3>25>25>25>25>25---
NQ>25>25>25>25>25---
Cisplatin13.9 ± 2.010.2 ± 0.223.9 ± 0.714.4 ± 1.429.9 ± 0.81.72.32.1
* Selectivity index for breast (SI1 = IC50 MCF-10A/MCF7 and SI2 = IC50 MCF-10A/MDA-MB-231) and lung (SI3 = IC50 MRC-5/ IC50 A549) cell lines. PPh3: triphenylphosphine; NQ: naphthoquinone.
Disclaimer/Publisher’s Note: The statements, opinions and data contained in all publications are solely those of the individual author(s) and contributor(s) and not of MDPI and/or the editor(s). MDPI and/or the editor(s) disclaim responsibility for any injury to people or property resulting from any ideas, methods, instructions or products referred to in the content.

