Article

Deciphering Interactions Involved in Immobilized Metal Ion Affinity Chromatography and Surface Plasmon Resonance for Validating the Analogy between Both Technologies

by
Rachel Irankunda
1,*,
Jairo Andrés Camaño Echavarría
1,
Cédric Paris
2,
Katalin Selmeczi
3,
Loïc Stefan
4,
Sandrine Boschi-Muller
5,
Laurence Muhr
1 and
Laetitia Canabady-Rochelle
1,*
1
Université de Lorraine, CNRS, LRGP, F-54000 Nancy, France
2
Université de Lorraine, LIBio, F-54000 Nancy, France
3
Université de Lorraine, CNRS, L2CM, F-54000 Nancy, France
4
Université de Lorraine, CNRS, LCPM, F-54000 Nancy, France
5
Université de Lorraine, CNRS, IMoPA, F-54000 Nancy, France
*
Authors to whom correspondence should be addressed.
Inorganics 2024, 12(1), 31; https://doi.org/10.3390/inorganics12010031
Submission received: 16 November 2023 / Revised: 22 December 2023 / Accepted: 24 December 2023 / Published: 16 January 2024
(This article belongs to the Special Issue Women’s Special Issue Series: Inorganics)

Abstract

:
Various peptides can be obtained through protein enzymatic hydrolysis. Immobilized metal ion affinity chromatography (IMAC) is one of the methods which can be used to separate metal chelating peptides (MCPs) in a hydrolysate mixture. In this context, this work aims to understand deeply the interactions in IMAC and surface plasmon resonance (SPR) in order to validate experimentally the analogy between both technologies and to be further able to perform IMAC modeling in the next work using peptide sorption isotherm parameters obtained from SPR. Indeed, chromatography modeling can be used to predict separation of MCPs in IMAC and the knowledge of peptide sorption isotherm obtained from SPR is a crucial step. For this purpose, 22 peptides were selected and investigated in IMAC using HisTrap X-Ni2+ and HiFliQ NTA-Ni2+ columns and were also studied in SPR as well. Results showed that peptides with histidine residues had good affinity to Ni2+, while the high positive charge of peptides was responsible of ionic interactions. Further, most of the peptides with good retention time in IMAC showed a good affinity in SPR as well, which validated experimentally the SPR-IMAC analogy.

Graphical Abstract

1. Introduction

Bioactive peptides naturally encrypted within protein sequences can be produced by enzymatic hydrolysis of animal or plant proteins. Proteolysis is widely used to produce hydrolysates. These complex mixtures of peptides present various biofunctional and biological activities, such as antimicrobial, antioxidant, anticarcinogenic, antitumoral, antidiabetic and mineral absorption activities [1]. Among the biofunctional peptides, the so-called metal chelating peptides (MCPs) are endowed with the ability to complex metal ions involving some metal-coordination bonds, which confers them various potential applications. Indeed, according to the metal ion complexed, MCPs can be used in various domains, notably in health to transport metals like iron, calcium and zinc in the body [1], in cosmetics and in food systems to avoid lipid oxidation [2]. The MCPs are produced from various protein resources such as soybean [3,4], sesame [5], whey [6] and tilapia and its co-products [7].
Despite their huge potentials, the recovery of MCPs in hydrolysates is challenging due to their low concentration in these complex mixtures of peptides, constituted from 10 to 100 various peptide sequences. Separation techniques such as IMAC are often used to recover biofunctional peptides in hydrolysates [1]. Over the past decades, IMAC has been used to purify and separate proteins (e.g., recombinant proteins) and polypeptides based on the interaction between proteins and immobilized metal ions like Ni2+, Cu2+, Co2+ [8,9]. For recombinant protein separation, histidine tag is commonly added to their C- or N-terminus part in order to increase their affinity to metal ion immobilized onto the chromatographic phase, thus improving their yield of purification. More recently, IMAC has been developed to separate MCPs from protein hydrolysates based on the differences in peptide affinity to a given immobilized metal ion, such as Fe3+ [3,4,10], Ca2+ [4], Zn2+ [5,6] or Cu2+ [6]. Peptidemetal ion affinity depends on the peptide size, number, position and nature of the amino-acid (AA) residues present in a peptide sequence and can be predicted based on the theory of hard and soft acid and base (HSAB). According to this HSAB theory [9], metals behave like Lewis acids, while peptides behave like Lewis bases, both classified in three categories: hard, borderline and soft. This theory helps to predict which metal ion can form the most stable complex with a peptide, based on the type of residues present in the sequence. Therefore, AA residues having carboxylate groups (glutamic acid and aspartic acid) are more likely to chelate metals such as Fe3+ since both are classified in the hard acidbase groups; sulfur (thiolate or thioether) groups (cysteine, methionine) are more prone to chelate metals like Cu+, both classified in soft acidbase groups, while imidazole and indole groups (histidine, tryptophane) are more likely to chelate Cu2+, Ni2+, Co2+, or Zn2+, which belong to the borderline acidbase group. In this study, we are interested in peptides that can chelate Ni2+ (Ni2+ being a borderline Lewis acid) and thus contain His and Trp residues according to the HSAB theory. Nevertheless, it should be noted that the complexation of metals by the indole ring of Trp is rarely observed in proteins [11].
In the meantime, other methods based on a peptide/proteinmetal ion interactions as in IMAC have been developed to screen MCPs in hydrolysates, among them the phage surface display [12], the electrically switchable nanolever technology [13] and surface plasmon resonance [14,15,16]. SPR is an optical biosensor which enables to quantify the interaction between a peptide/protein and an immobilized metal ion [17]. As main advantages, this technology uses a low quantity of sample and buffer and enables a quick investigation of the presence of MCPs in hydrolysates, which is a crucial step before launching time-consuming separation.
Due to the advantages and efficacy of SPR stated above, our team recently initiated an approach to predict peptides concentration profile at the outlet of the column during their separation in IMAC [15,18]. In this approach, IMAC chromatography was modeled using a transport-dispersive model and peptide binding affinity constants (KA). These peptide binding affinity constants (KA) were obtained from SPR sorption isotherms and used as model input data considering the theoretical SPR-IMAC analogy. Indeed, SPR and IMAC are notably based on peptidemetal ion interactions and present various similarities, especially when they use the same metal ion (e.g., Ni2+, Fe3+, Cu2+) immobilized on the same complexing agent (e.g., nitrilotriacetic acid (NTA)) fixed onto a support and the same loading buffer and elution buffer as well [15]. However, IMAC is used for MCP separation, while SPR can be used for MCP screening only.
Therefore, this work aims to decipher the phenomenon of peptidemetal ion complexation occurring inside an IMAC chromatographic column with a deeper investigation using SPR (a technology also based on peptide–metal ion interaction) in order to be further able to predict peptide separation in IMAC. For this purpose, synthetic peptides—potentially Ni2+ chelating peptides present in pea proteins—were investigated for their affinity for Ni2+ in IMAC and SPR, respectively, with the better understanding of interactions helping to experimentally validate the analogy between SPR and IMAC.

2. Materials and Methods

2.1. Synthetic Peptides Investigated and Other Chemicals

The peptide sequences investigated in IMAC and SPR were obtained from in silico proteolysis of pea (Pisum Sativum) proteins. Pea proteins were chosen for their absence of allergens compared to other plant proteins like soy, according to the Official Journal of the European Union [19]. Major pea proteins, like legumin, vicilin, albumin and convicilin, were identified in the literature [20,21,22] and their sequences were obtained from UniProtKB (protein sequences presented in Supplementary Data S1).
From these pea protein sequences, peptides were obtained by in silico enzymatic proteolysis, and potential Ni2+ chelating peptides were identified based on HSAB theory; they presented at least one histidine or tryptophan in their sequences, which might lead to Ni2+ complexation [17]. In addition, they were selected as small-sized Ni2+-chelating peptides (MCPs, 2–10 amino-acid residues), less subject to further in vivo hydrolysis that could reduce their activities [23]. In the end, 16 peptides theoretically endowed with various Ni2+ metal-chelation capacities and 4 peptides with potentially no affinity for Ni2+ (without histidine/tryptophan, negative control) were selected and synthetized by Genecust (Dudelange, Luxemburg). In addition, 2 peptides, GHHHHHHHHAY (GH8AY) and HHHHHH, were used as positive controls since HHHHHH is a good Ni2+ chelating peptide commonly used as a tag for recombinant protein purification [24] and GH8AY presents a high number of histidine and shows a good affinity for Ni2+ [25]. The synthetized peptides, the protein from which they are derived and their physico-chemical properties (molecular weight, MW; isoelectric point, IP; and percentage of global charge at pH 7.4) are summarized in Table 1. In addition, their chemical structures are illustrated in Figure 1. Pea protein names and sequences were obtained from UniprotKB, and the molecular weight and isoelectrical point were calculated from PepCalc free software (https://pepcalc.com).
The percentage of global charge at pH 7.4 was determined by ACD/Percepta Software version 14.0 (ACD/Labs) (https://www.acdlabs.com/), which can calculate the acid dissociation constants (pKa) of all ionizable groups in the sequence under standard conditions. The predictions of pKa values are based on a database of more than 20,000 compounds. The plot of percentage of net charge as a function of pH can be generated based on the pKa values. From these data, at pH 7.4, all percentages of positive, negative and zwitter-ionic charges (i.e., considered as globally neutral) were summed up (%) to obtain the percentage of global positive charges and global negative charges of the peptides and are presented in Table 1.
Concerning other chemicals, the following were purchased from Sigma Aldrich (St Louis, MO, USA): potassium phosphate monobasic (KH2PO4), nickel (II) sulfate (NiSO4.X H2O), imidazole bio–Ultra GC > 99.5%, hydrochloric acid 37% (HCl), ethylenediamine tetra acetic acid disodium salt dihydrate (EDTA-Na2⋅2H2O). Others, namely sodium hydroxide (NaOH), sodium chloride (NaCl) and di-sodium hydrogen phosphate dodecahydrate (Na2HPO4⋅12H2O), were purchased from VWR Chemicals (Leuven, Belgium). Ultrapure water (18.2 MΩ/cm) was obtained using a Milli-Q System (Millipore, Bay City, MI, USA). Specifically, for SPR experiments, 500 μM NiCl2 Biacore kit solution, 50 μM EDTA Biacore kit solution and BIA-maintenance kit solution were provided by GE Healthcare (Uppsala, Sweden). Sodium dodecyl sulfate (SDS) and Tween® 20 were provided by Sigma Aldrich (St Louis, MO, USA).

2.2. Immobilized Metal Ion Affinity Chromatography

2.2.1. HPLC Equipment and IMAC Columns Used

IMAC experiments were carried out using an HPLC system (LC-20AD, Shimadzu, Japan) at a flow rate of 1 mL/min, an oven temperature set at 25 °C and a Diode Array Detector (SPD-M20A, Shimadzu, Japan). Three wavelengths were selected: 214 nm and 232 nm (i.e., peptide bonds) and 280 nm (aromatic ring) [26]. For each observed peak, fractions were collected using a fraction collector (FRC-10A, Shimadzu, Japan) and analyzed by LC-MS (Section 2.3) in order to confirm the peptide presence and the absence of impurities.
The 22 peptides were studied in IMAC and experiments were carried out with two different columns in order to understand various interactions well: HiFliQ NTA-Ni2+ (Generon, Slough, UK; NTA as complexing agent) and HisTrap™FF crude (GE Healthcare Bio- Sciences, Sweden; unknown complexing agent). HisTrap X-Ni2+ and HiFliQ NTA-Ni2+ nomenclature was used for columns loaded with Ni2+, which were used to investigate the peptide–metal ion interactions. In addition, all of the 22 peptides were also analyzed on two columns without Ni2+ as control columns and HisTrap X and HiFliQ NTA nomenclature was used in this latter case. These control experiments were performed in order to determine whether there were interactions between the peptide and other parts of the column like the matrix or the complexing agent. For the majority of peptides, these interactions were not observed or were very weak since peptides were directly eluted from the columns. Different experiments were required to investigate these former interactions in IMAC, while in SPR these former interactions and direct interactions between the peptide and Ni2+ could be obtained within one experiment.
Regarding other columns specifications, both columns had a volume of 1 mL, their binding capacity was 40 mg or 50–75 mg of 6xHis-tagged protein for HiFliQ NTA-Ni2+ and HisTrap X-Ni2+, respectively (Supplementary Data S2 for other specifications).
The HiFliQ NTA-Ni2+ column was initially selected since the metal ion complexing agent was known (NTA) and identical to the one used on the SPR sensor chip, enabling a real analogy between IMAC and SPR. Yet, due to the absence of retention on HiFliQ NTA-Ni2+ of some peptides, a second IMAC column, the HisTrap X-Ni2+, was investigated as well. Yet, in this latter case, the metal ion complexing agent (X) and its denticity were not communicated by the manufacturer.

2.2.2. IMAC Cycle and Elution Program

An IMAC cycle is composed of 4 main steps: equilibration, injection + unbound component removal, elution and washing. For each peptide investigated, the IMAC column was first equilibrated using the PBS 1X pH 7.4 buffer (Na2HPO4.12H2O 6.7 mM; KH2PO4 1.25 mM; NaCl 15 mM) (equilibration step). Fifty μL of peptide solutions prepared at 20 mM in PBS 1X buffer was loaded (injection), and then the PBS 1X buffer was injected for 5 min to remove unbound components. For eluting peptides that have affinity for Ni2+, a gradient of imidazole was used, from 0 to 600 mM imidazole (prepared in PBS 1X pH 7.4) for 60 min. Finally, extra binding peptides were removed by 600 mM imidazole for 5 min (washing step) and the column was equilibrated using the PBS 1X pH 7.4 buffer for the next run (equilibration step).
Note that during the unbound component removal phase and gradient elution step, the fractions were collected and identified by mass spectrometry in order to confirm or not the presence of the peptide or an impurity in the collected fraction.
After 10 peptides assays using HisTrap X-Ni2+, the column was stripped with 50 mM EDTA in PBS 1X pH 7.4 buffer to remove the immobilized Ni2+ and regenerated with 100 mM NiSO4 in PBS 1X pH 7.4 buffer according to the provider specifications. Meanwhile, after 5 peptide assays, HiFliQ NTA-Ni2+ was stripped with 100 mM EDTA pH 8 and regenerated with 10 mM NiSO4 solution according to the provider specifications.

2.2.3. Treatment of IMAC Data

For each peptide series investigated, a blank was first studied, i.e., PBS 1X buffer injected only without sample in order to correct the deviation of the baseline in elution phase due to the slight imidazole absorbance at the wavelengths investigated (214 nm and 232 nm). Thus, a baseline correction was systematically applied to each peptide chromatogram by subtracting the blank at the wavelength of interest. Then, for each investigated peptide and for each column, a retention time (tR, min) was determined corresponding to the maximum of the peak.

2.3. LC-MS

To confirm the presence of a peptide in fractions collected in IMAC experiments during the gradient elution step and to ensure that the peak was not related to any impurities, fractions were analyzed on a Thermo Scientific UHPLC-HRMS system composed of a Vanquish™ liquid chromatography unit coupled to a photodiode array detector (PDA) and an Orbitrap ID-X™ Tribrid™ high-resolution mass spectrometer operating in electrospray ionization mode (ESI).
For each collected fraction, 10 µL was injected on a Thermo Scientific™ Acclaim™ 120 C18 column (100 mm × 2.1 mm–2.2 µm) maintained at 40 °C. The flow rate was set at 200 µL.min−1 and mobile phases consisted of water modified with trifluoroacetic acid (0.1%) for A and acetonitrile modified with trifluoroacetic acid (0.1%) for B. Peptides were eluted using a 10 min gradient from 5% to 98% of B before a 5 min column wash at 98% of B, and finally followed by a 6 min equilibration step at 5% of B. Mass analysis was carried out in ESI positive ion mode (ESI+) and mass spectrometry conditions were as follows: spray voltage was set at 3.5 kV; source gases were set at 35, 7 and 10 (in arbitrary units.min−1) for sheath gas, auxiliary gas and sweep gas, respectively; vaporizer temperature and ion transfer tube temperature were both set at 300 °C. MS scans were performed from 150 to 2000 m/z at 7.5 K resolution (at 200 m/z, FWHM) with following parameters: RF-lens, 35%; maximum injection time, 50 ms; data type, profile; normalized AGC target, 25%. The mass spectrometer calibration was performed using the Thermo Scientific Pierce TM FlexMix TM calibration solution. MS data acquisition was carried out with the Xcalibur v. 3.0 software (Thermo Scientific, Waltham, MA, USA). For all 22 peptides investigated, the peak associated with the dead time of the HPLC system for IMAC was observed around 1.2 min. The non-retained peptides were detected in this peak at 1.2 min, and other peptides were detected in another peak and their tR value was used for their classification.

2.4. Surface Plasmon Resonance

SPR experiments were carried out on a Biacore X100 instrument (GE Healthcare, Uppsala, Sweden) using an NTA sensor chip (GE Healthcare, Uppsala, Sweden) at 25 °C as described in the literature [14]. Briefly, Ni2+ was first loaded on the NTA sensor chip using a 500 μM NiCl2 Biacore kit solution. The running buffer was a PBS 1X (pH 7.4, 0.005% Tween® 20) prepared from PBS 10X buffer (67 mM Na2HPO4·2H2O, 12.5 mM KH2PO4, 150 mM NaCl, pH 6.6). The flow rate was set at 20 μL/min, the running buffer was filtered onto a 0.22 μm membrane (low protein binding, non-pyrogenic, PALL) and two channels were available on the chip, one previously loaded with Ni2+ for investigating the interactions between the peptides and Ni2+ and another one without Ni2+ for investigating interactions between peptides and the matrix or complexing agent.
In order to study the binding affinity of a peptide, seven concentrations varying from 10−6 M to 10−2 M depending on the peptide were prepared in the running buffer and each concentration was loaded onto the Ni2+-NTA chip to evaluate the affinity of the peptide for Ni2+ already immobilized on NTA. The chip surface was regenerated with a 500 mM imidazole solution prepared using ultrapure water, followed by a second regeneration with EDTA solution prepared by adding 87 μL of EDTA solution at 50 μM (Biacore kit solution) in 10 mL running buffer (PBS 1X). After each cycle, the SPR chip surface was washed with SDS 0.5% v/v at a flow rate of 40 μL/min followed by an extra wash with 50 μM EDTA and equilibrated with the running buffer before studying the next peptide concentration.
For each peptide concentration, the response (Resonance Unit, R.U.) was recorded as a function of time (s) to form a sensorgram (Figure 2A), and then the response at equilibrium was taken to build a sorption isotherm (response as a function of peptide concentration, Figure 2A). The isotherm was fitted with a 1:1 binding model using BIAevaluation software version 4.1. in order to determine the dissociation constant (KD, M). The equation of 1:1 binding model is as follows:
R = R m a x C K D + C
where R is a response during steady state phase (R.U.), C is the peptide concentration (M) and Rmax is the saturation response (R.U.).

2.5. Statistical Analysis

Statistical analysis was performed using Statgraphics 19® Centurion (Statgraphics Technologies, Inc., The Plains, VA, USA). Mean values and standard deviations were introduced to Statgraphics; multiple sample comparisons using Bonferroni were performed to determine statistical differences between peptides retention times. The significance was evaluated statistically at p < 0.05 significance level.

3. Results and Discussion

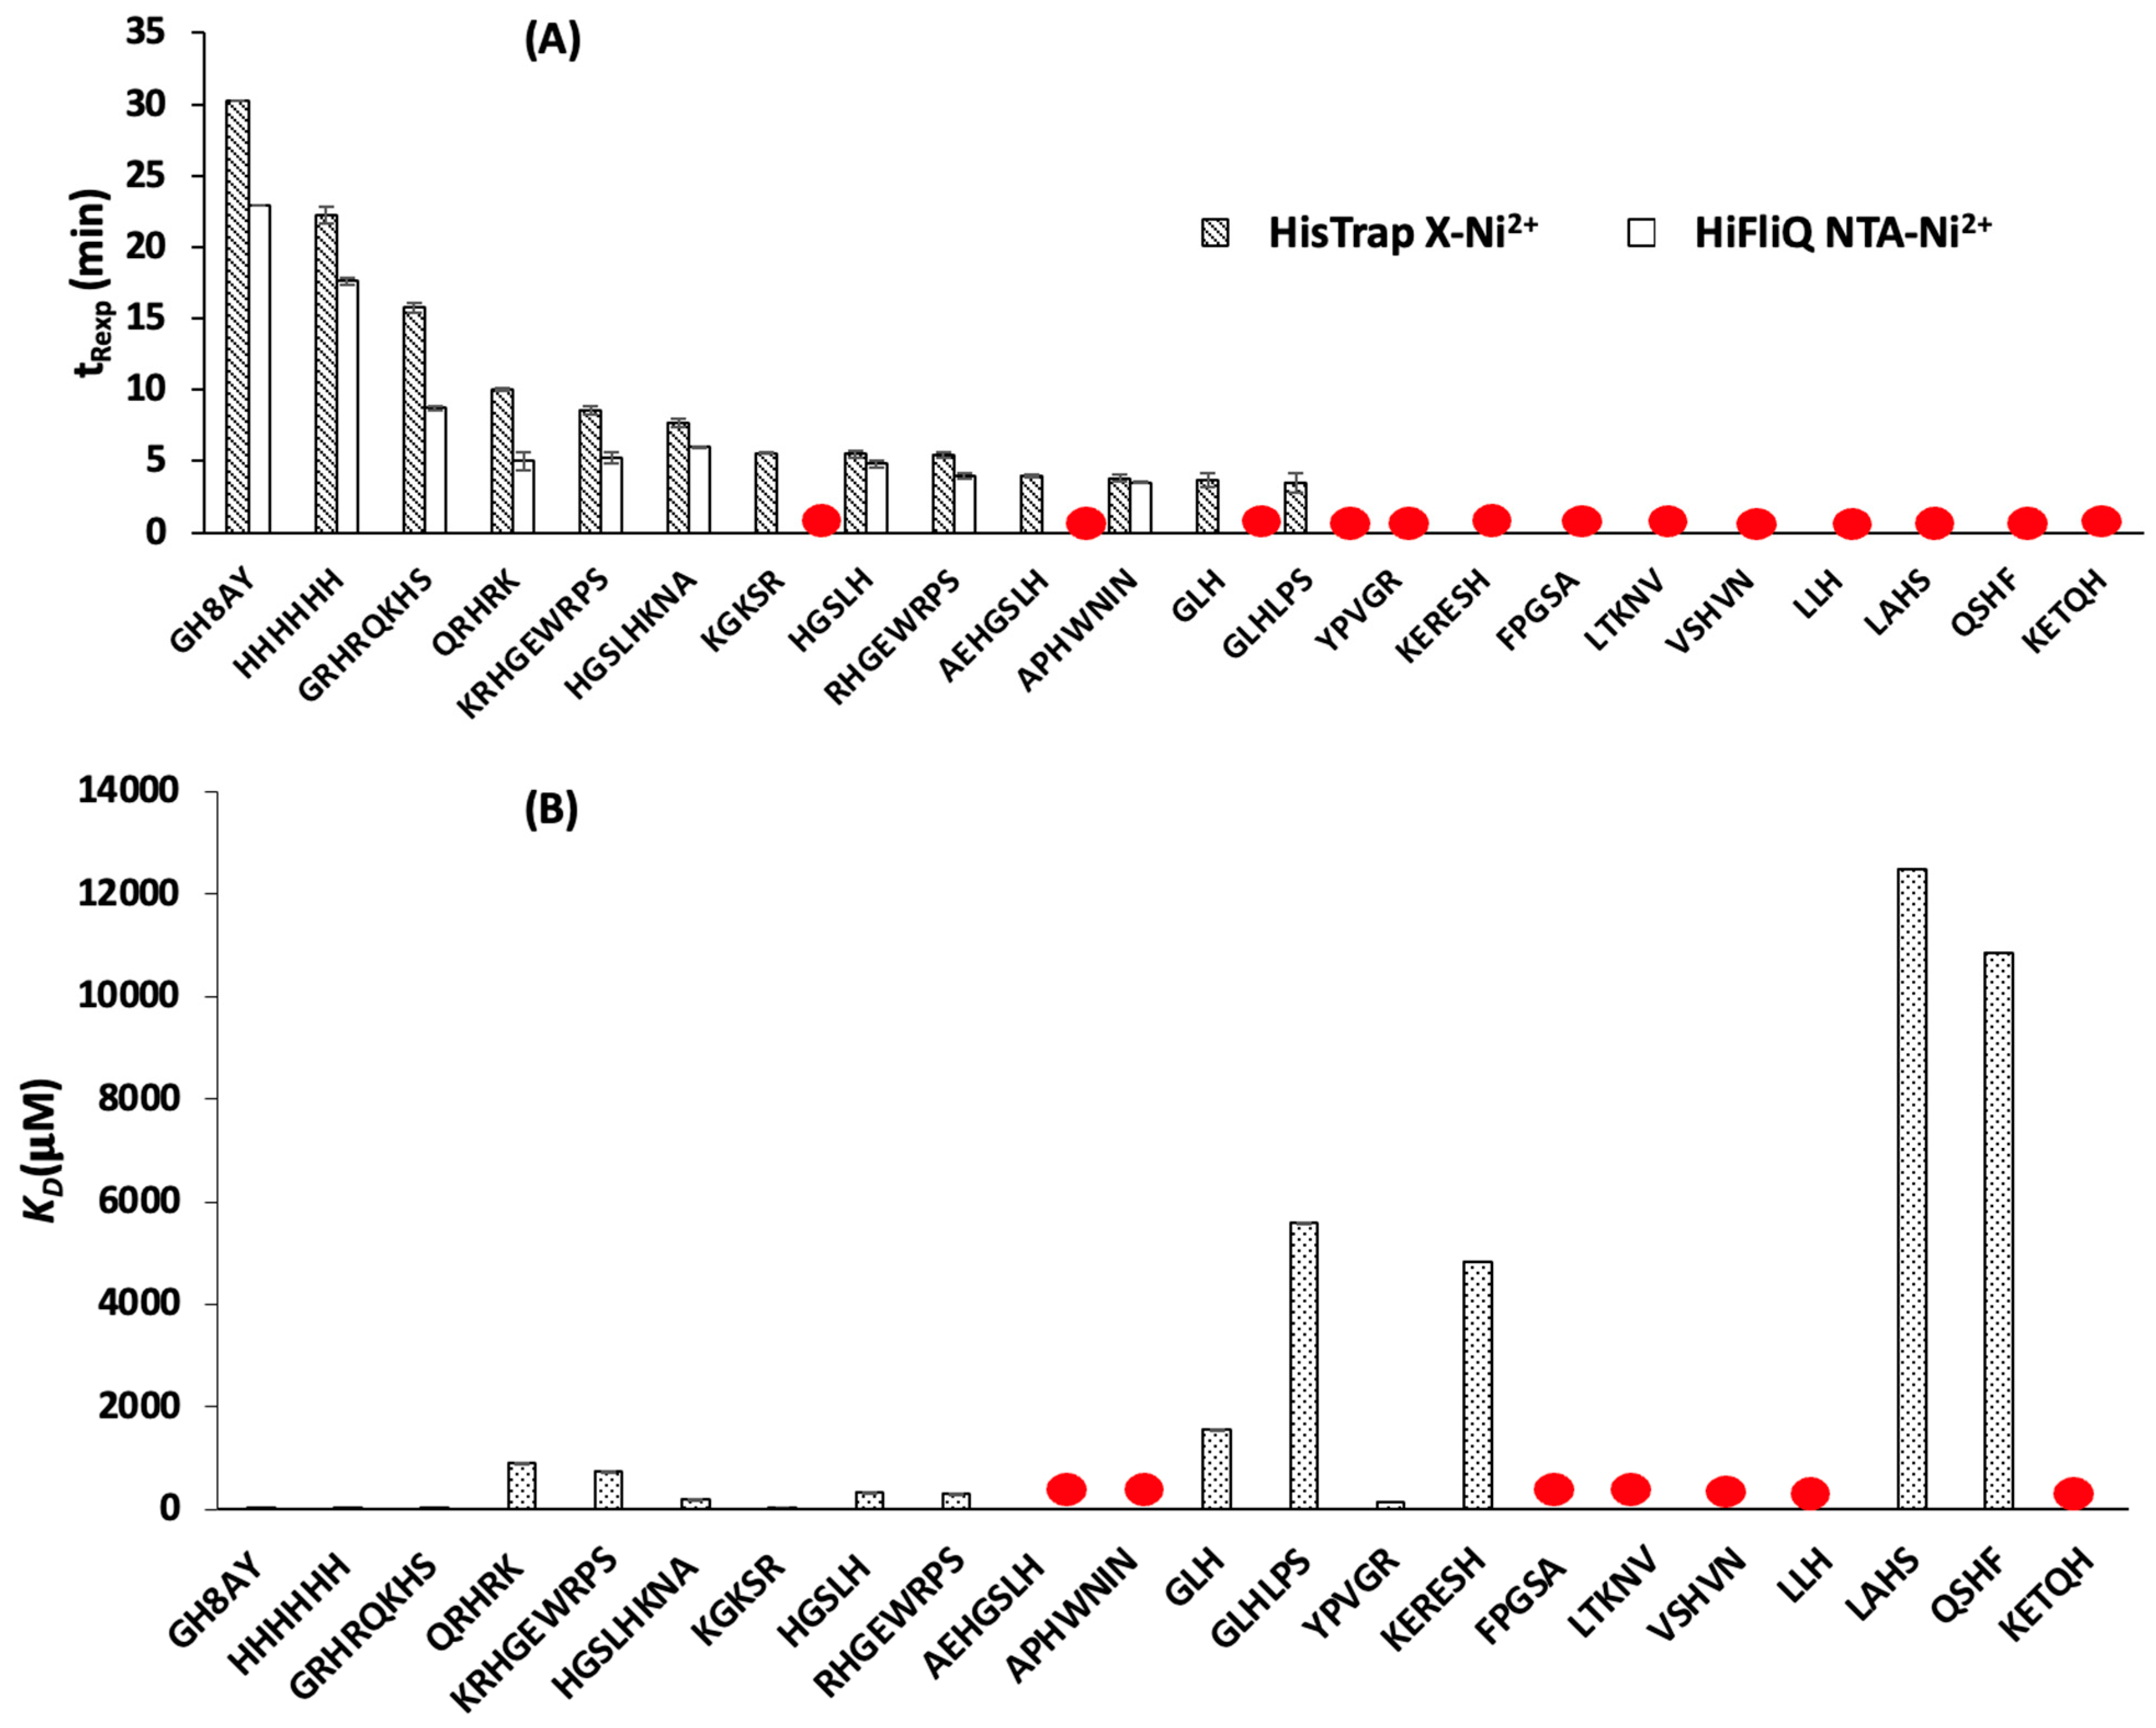
3.1. Determination of Peptide Retention Time Using IMAC

3.1.1. Peptide Retention Time Using HisTrap X-Ni2+ Column

From IMAC experiments performed on 22 peptides using the HisTrap X-Ni2+ column, peptides can be classified in 4 groups according to their retention times (tR): group 1 varying between 15 min and 31 min (GH8AY, HHHHHH and GRHRQKHS), group 2 varying within 5 min and 10 min (QRHRK, KRHGEWRPS, HGSLHKNA, KGKSR, HGSLH, RHGEWRPS), group 3 with retention times less than 4 min (AEHGSLH, APHWNIN, GLH, GLHLPS) and finally, group 4 with peptides not retained on the HisTrap X-Ni2+ column (YPVGR, KERESH, LLH, VSHVN, QSHF, LAHS, KETQH, LTKNV, FPGSA). Results are summarized in Table 2.
In IMAC, the higher the retention time (tR) of the peptide in the column is, the stronger the interaction between the peptide and the immobilized metal ion is and thus the higher the imidazole concentration required for peptide elution is. Therefore, HHHHHH used as positive control in this study is well retained in the column, with a high retention time (tR) of 22.20 min. The good affinity of HHHHHH for Ni2+ is in agreement with the literature since this peptide is used in the purification of recombinant proteins as a His-tag [27] due to the presence of multi-histidine residues (Figure 1A) [28]. Concerning other peptides belonging to the same group 1 as HHHHHH, i.e., GH8AY and GRHRQKHS, these sequences also showed high retention times and thus have a good affinity for Ni2+. Generally, the affinity for Ni2+ depends on the composition of the peptide sequences, i.e., the number of histidine or tryptophan and their position in the sequence [27,29]. Therefore, the good affinity for Ni2+ observed for HHHHHH, GH8AY and GRHRQKHS is due to the presence of more than one histidine residue; in addition, these histidine residues are separated with 3 other AA residues in the case of peptide GRHRQKHS (Figure 1B), which can facilitate the formation of the peptide-Ni2+ complex by macrochelate arrangement. Concerning HHHHHH and GH8AY, both peptides contain many histidine residues with a possibility to form a complex from two non-vicinal H, thus leading to high affinity for Ni2+. In addition to having at least 2 H in their sequence, group 1 peptides present a high percentage of positive charges (greater than 70%, Table 1) at pH 7.4.
In addition, group 2 is divided into two subgroups: the first one is composed by peptides QRHRK, KRHGEWRPS (Figure 1C) and HGSLHKNA (Figure 1D), while the second one is composed by KGKSR, HGSLH and RHGEWRPS. These latter peptides have retention times smaller than those of group 1, which are referred to as having a medium affinity for Ni2+. To explain the trend in the first subgroup, notably the tR value of QRHRK (10.01 min, 1 H residue) being higher than that of HGSLHKNA (7.71 min, 2 H residues), the overall positive charge of the peptide QRHRK must be considered; this latter peptide is closer in amino acid composition to peptide GRHRQKHS of group 1. Indeed, the retention time of a peptide depends not only on the number of H present in the sequence but also on the global positive charge of the peptide and the global charge of the X-Ni2+ complex on the surface of the solid phase, which might be negative, leading to ionic interactions. Thus, QRHRK and KRHGEWRPS peptides having one histidine but also 100% positive charges at pH 7.4 (Table 1) were retained at the same level as HGSLHKNA having 2 H but a lower percentage of positive charges (65%) at the same pH. This lower percentage of overall positive charges can explain the lower retention time of HGSLHKNA (tR = 7.71 min and 65% of positive charges at pH 7.4) compared to the GRHRQKHS peptide of group 1 (tR = 15.79 min and 100% of positive charges at pH 7.4). To explain the trend in the second subgroup, with the exception of KGKSR (Figure 1H), peptides HGSLH and RHGEWRPS (Figure 1E) present two potential complexing AA residues: either 2H or 1H with a weak complexing residue W, and their common point is an overall positive charge less than 45%. Again, to explain the unusual behavior of KGKSR, which does not contain H, one must consider the positive charges of this peptide (100% at pH 7.4) to explain its higher retention time (tR = 5.57 min) compared to other peptides without histidine (not retained, group 4, Table 2).
In group 3, peptides AEHGSLH, APHWNIN, GLH (Figure 1F) and GLHLPS (Figure 1G) showed lower retention times, allowing us to consider their lower affinity for Ni2+ than group 2. With the exception of AEHGSLH, these peptides present 1H or 1H with a weak complexing residue W and an overall positive charge less than 35%. Peptide AEHGSLH has the lower positive charge (11%), which explains its lower retention time despite having 2H.
Meanwhile, the higher positive charge at pH 7.4 observed for peptides of group 1, 2 or 3 is mainly due to the presence of arginine (Arg, R) and lysine (Lys, K) residues, which remain protonated on a large pH range (pKa of side chain of Arg is 12.10, and the one of Lys is 10.67). Indeed, the data demonstrate that the 100% positively charged KRHGEWRPS peptide with potentially two metal complexing AA residues (H or W) shows good retention time (8.58 min, group 2); however, this retention time is reduced by decreasing the positive charges when the lysine (K) residue is removed from this latter sequence to give the peptide RHGEWRPS (5.41 min, 44% of positive charges, group 2). The same behavior is observed for peptide HGSLHKNA (7.71 min, 65% of positive charges, group 2) and peptide HGSLH (5.48 min, 26% of positive charges, group 2, Table 1 and Table 2) without KNA residues at the C-term. According to Karavelas and colleagues [30], Lys residue does not participate in forming a coordination complex between Lys-containing peptides and Ni2+ in solution. The lack of coordination complex formation involving Lys residues is explained by the fact that the ε-amino function of Lys is too far to form stable chelate with another donor atom of the sequence [31]. Thus, the presence of Lys residues in the peptides GRHRQKHS, QRHRK, KRHGEWRPS, HGSLHKNA and KGKSR might increase retention time rather due to ionic interactions with a negatively charged X-Ni2+ complex of the solid phase surface and not due to direct coordination interaction with Ni2+. However, the presence of Glu (E) in the sequences did not improve the tR values in IMAC since Glu is a hard base and Ni2+ is a borderline acid, and thus they do not form a strong coordination interaction. In addition, Glu decreased the overall positive charge of the peptide AEHGSLH (tR = 3.93 min, 11% of positive charges) versus peptide HGSLH (tR = 5.48 min, 26% of positive charges) due to the low pKa value (4.25) of COOH group on the side chain of Glu.
Peptides in group 4 are not retained at all in the HisTrap column despite the presence of His residues in the sequences for some of them (i.e., KERESH, VSHVN, LLH, LAHS, KETQH, QSHF). This can be explained by the low percentage of positive charges at pH 7.4 (<20–30%, Table 1) for peptides with only one His in their sequence and by the insufficient positive charges (<100%) for the peptides without H or W in their sequence (YPVGR, FPGSA, LTKNV, Table 1 and Table 2), in agreement with the literature [28,32]. One H residue in the sequence is not enough when imidazole is used as elution buffer, meaning that imidazole, commonly used as competitive agent, is suitable to investigate only multi-His-containing peptides with higher affinities for Ni2+ [28,33]. Therefore, the peptides of group 4 have very low affinity for Ni2+ and a very low imidazole concentration should be used to elute them.
In addition, as reported by Sun and co-workers [29], other parameters can affect peptide–metal interactions, such as pH, ionic strength and buffer composition, which may be involved in the separation. In the study presented here, the pH was set at 7.4 and ionic interactions were reduced using 15 mM NaCl in the loading and elution buffers. This NaCl concentration, initially selected to be in the same condition as SPR experiments, may not be enough to prevent ionic interactions and should be further optimized. Indeed, the concentration of NaCl between 300 mM and 1000 mM is generally used in IMAC in order to minimize ionic interactions [9,34]. It has also been reported that the increase in NaCl improves the yield of the elution of peptides in a complex mixture of peptides [33]. Ren and colleagues studied the separation of 14 peptides in mixture and only 10 peptides were eluted with a buffer containing 100 mM NaCl, while 13 of 14 peptides were eluted with a 500 mM NaCl-containing buffer.
Taken altogether, in the analytical conditions implemented for IMAC with the HisTrap X-Ni2+ column, the retention time is mainly influenced by the number of histidine and the overall positive charge of the peptide at pH 7.4. In the defined groups from 1 to 4 (vide supra), the tR decreases when the number of histidine and/or the percentage of positive charges at pH 7.4 decrease. Additional comparisons of peptides can be added to support this statement, as shown for these peptides in different groups (i) at the same level (100%) of positive charges with a different number of H: tR GRHRQKHS (group 1, 2 H, 100% of positive charges, 15.8 min) > tR QRHRK (group 2, 1 H, 100% of positive charges, 10 min) > tR KGKSR (group 2, 0 H, 100% of positive charges, 5.6 min); or (ii) at the same number of histidines in the sequence with different percentages of positive charges: tR HGSLHKNA (group 2, 2 H, 65% of positive charges, 7.71 min) > tR HGSLH (group 2, 2 H, 26% of positive charges, 5.48 min). More, W residues might not have a high influence on the peptide retention time considering that the KRHGEWRPS peptide was less retained (1 H and 1 W, 8.6 min) than the peptide QRHRK (1 H only, 10.01 min), knowing that both peptides are 100% positively charged at pH 7.4. If the indole part on the side chain of tryptophan had played a role in metal ion complexation, the retention time of KRHGEWRPS (1 H + 1 W, 100% of positive charges, 8.6 min) should have been closer to that of GRHRQKHS (group 1, 2 H, 100% of positive charges, 15.8 min).

3.1.2. Peptide Retention Time Using HiFliQ NTA-Ni2+ Column

Using the HiFliQ NTA-Ni2+ column, peptides can be classified in three groups named I, II and III (Table 2). The group I with peptides GH8AY, HHHHHH, and GRHRQKHS have tR varying between 8 min and 23 min. In addition, group II is constituted of peptides HGSLHKNA, KRHGEWRPS, QRHRK, HGSLH, RHGEWRPS and APHWNIN, which showed retention times between 3 min and 7 min. Finally, other peptides in group III (KGKSR, AEHGSLH, GLH, GLHLPS, YPVGR, KERESH, FPGSA, LTKNV, VSHVN, LLH, LAHS, QSHF, KETQH) were not retained. The retention of peptides on Ni2+ in HiFliQ NTA-Ni2+ generally follows the same trends as for the HisTrap X-Ni2+ (Figure 3A), but peptides were more retained on this latter column. Indeed, peptide KGKSR, which was in group 2 for HisTrap X-Ni2+, is not retained on HiFliQ NTA-Ni2+, and peptides in group 3 (AEHGSLH, APHWNIN, GLH, GLHLPS), which had low retention times in HisTrap X-Ni2+, are no longer retained on HiFliQ NTA-Ni2+, except peptide APHWNIN. Comparing peptide retention times between the two columns, it is observed that the differences in peptide retention times are important for peptides which have a high affinity for Ni2+ (GH8AY, HHHHHH, GRHRQKHS and QRHRK) with a mean delta tR of 6.0 min, while the differences are moderate for other peptides with a mean delta tR of 1.5 min. This difference in retention times—and thus indirectly in peptide affinities for Ni2+—is due to the fact that the columns may have different complexing agents: NTA in the HiFliQ NTA-Ni2+ column and an unknown complexing agent in the HisTrap X-Ni2+ one.
Whatever the column used, HiFliQ NTA-Ni2+ or HisTrap-X-Ni2+, it was generally observed that peptides with more histidine and a high percentage of global positive charges at pH 7.4—due to the presence of lysine and arginine residues in their sequences—are more retained. This indirectly indicates that they have a good affinity for Ni2+, which is in agreement with previous studies on immobilized Ni2+ chelation by peptides using IMAC and SPR [17,27], but arginine and lysine might be responsible of ionic interactions in the presence of X-Ni2+.

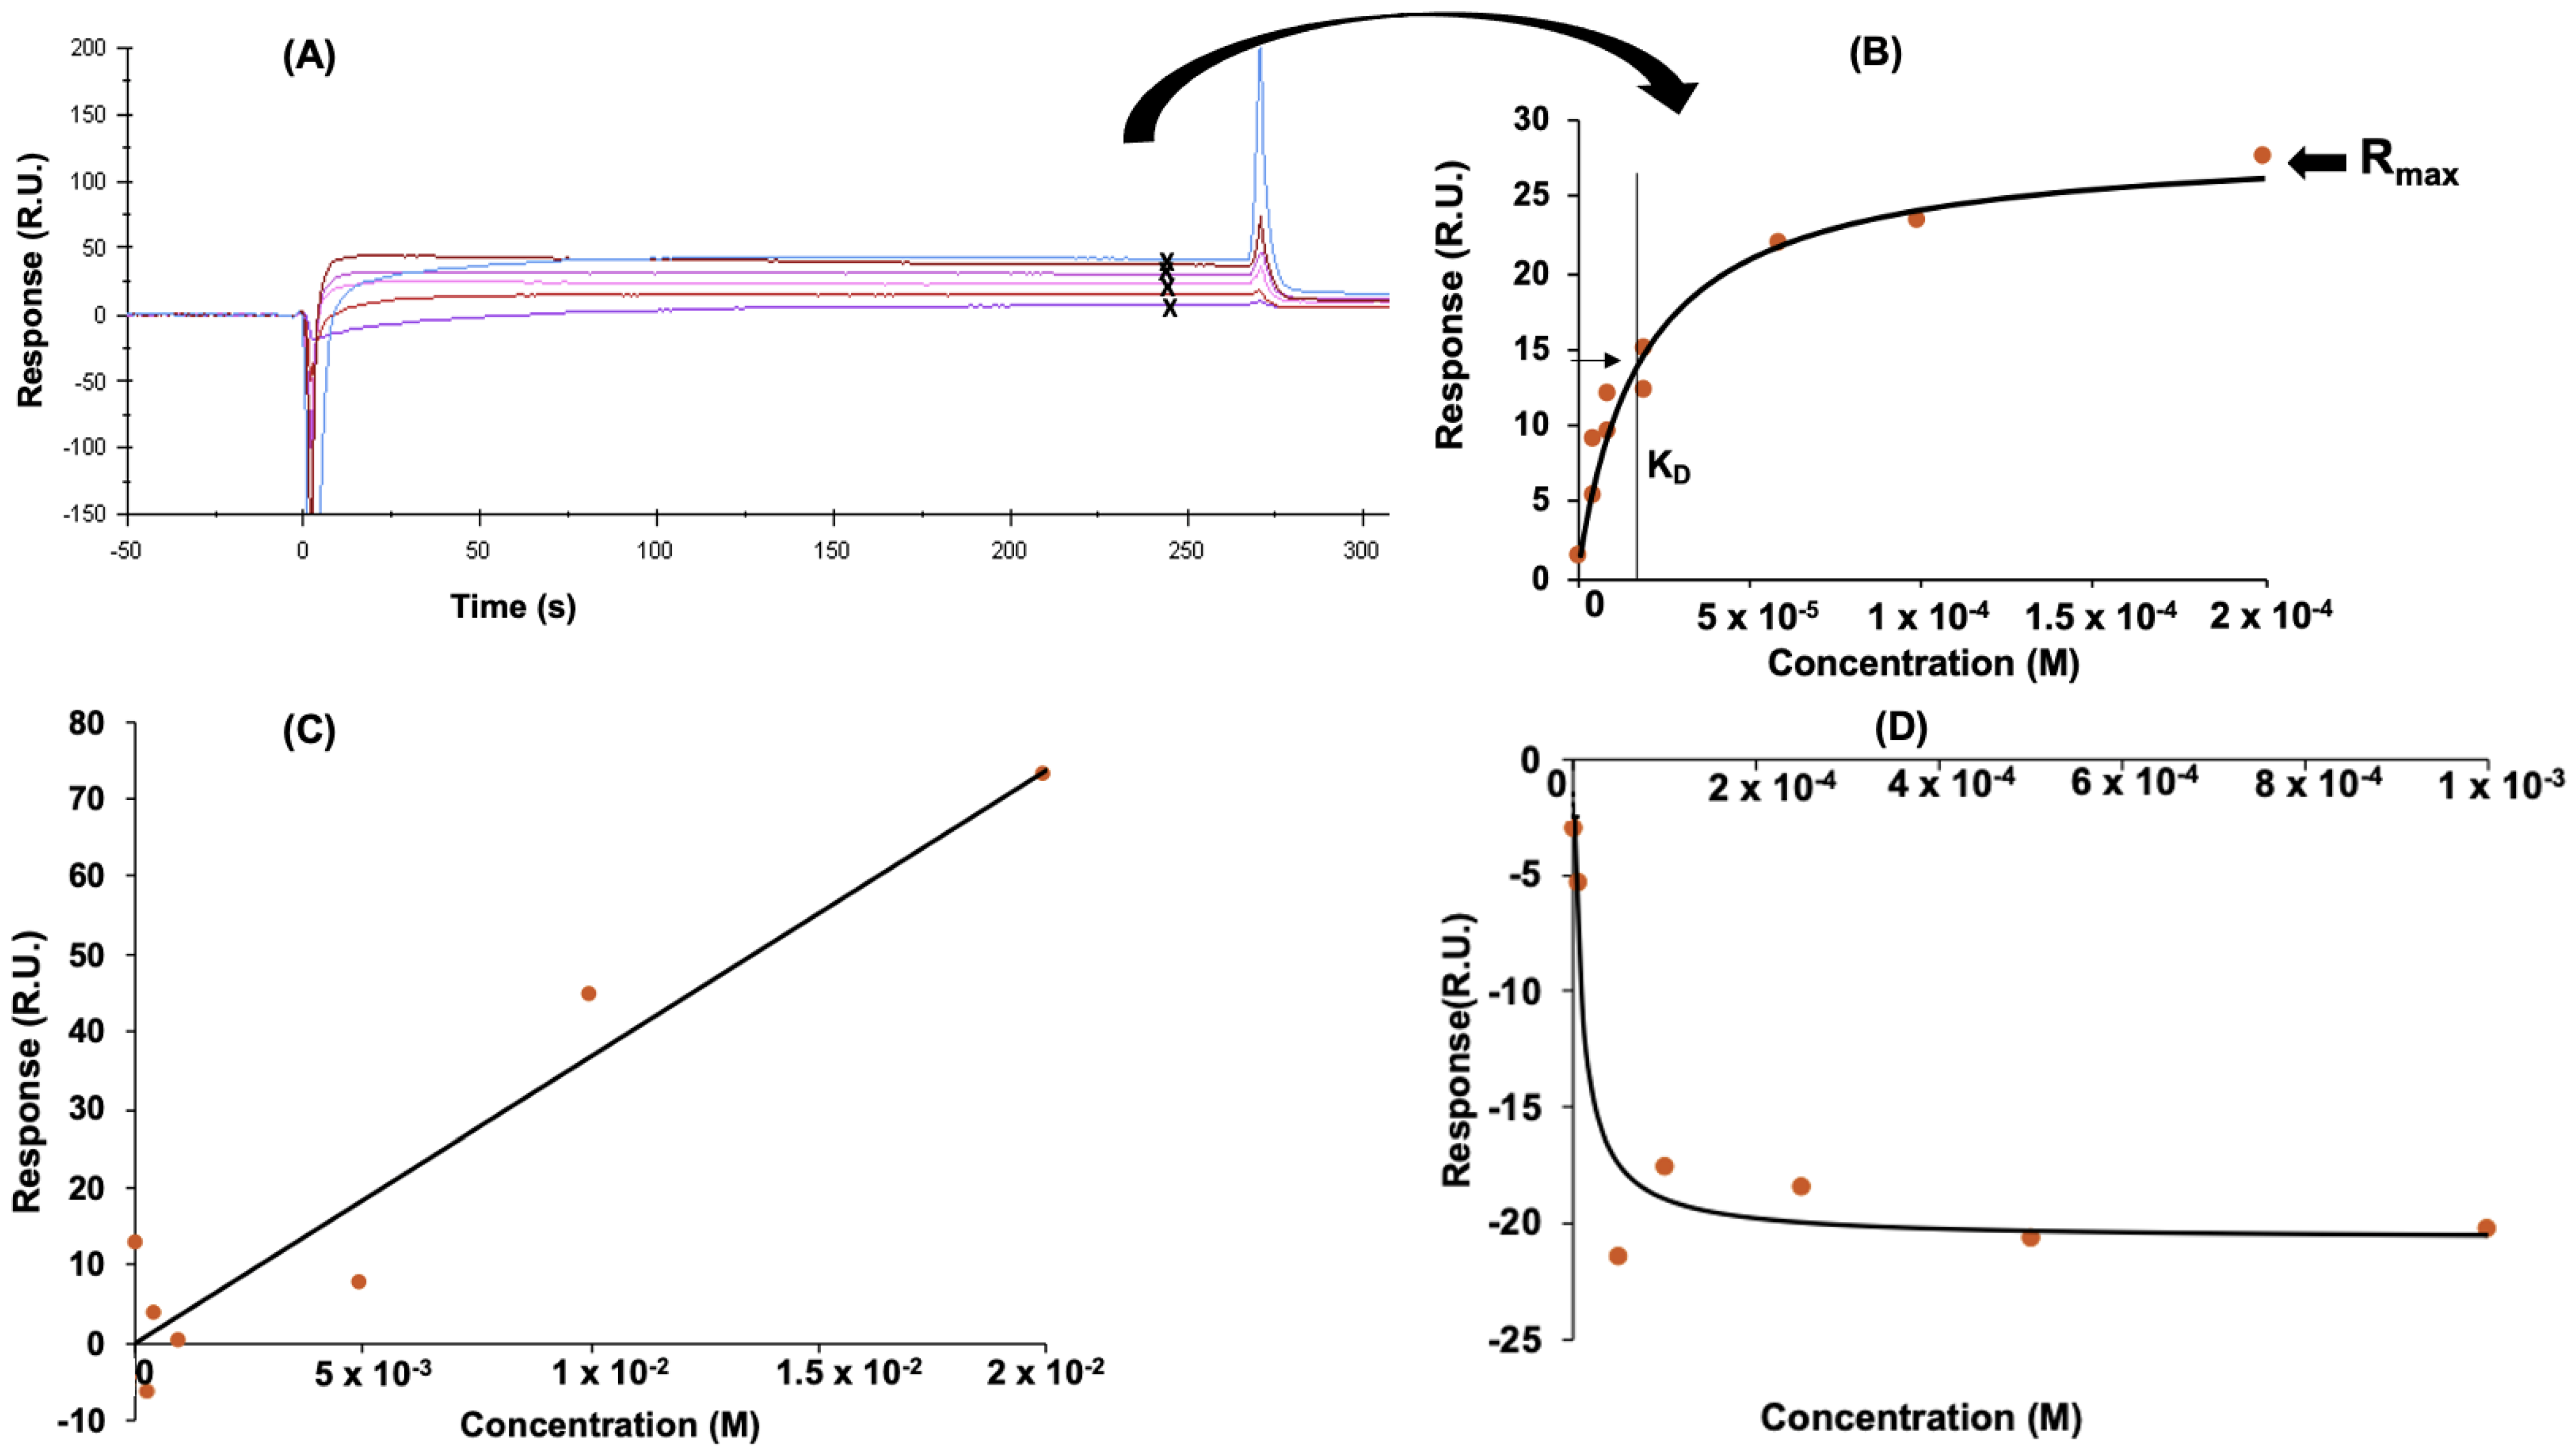
3.2. Determination of Peptide Affinity Parameters Using SPR

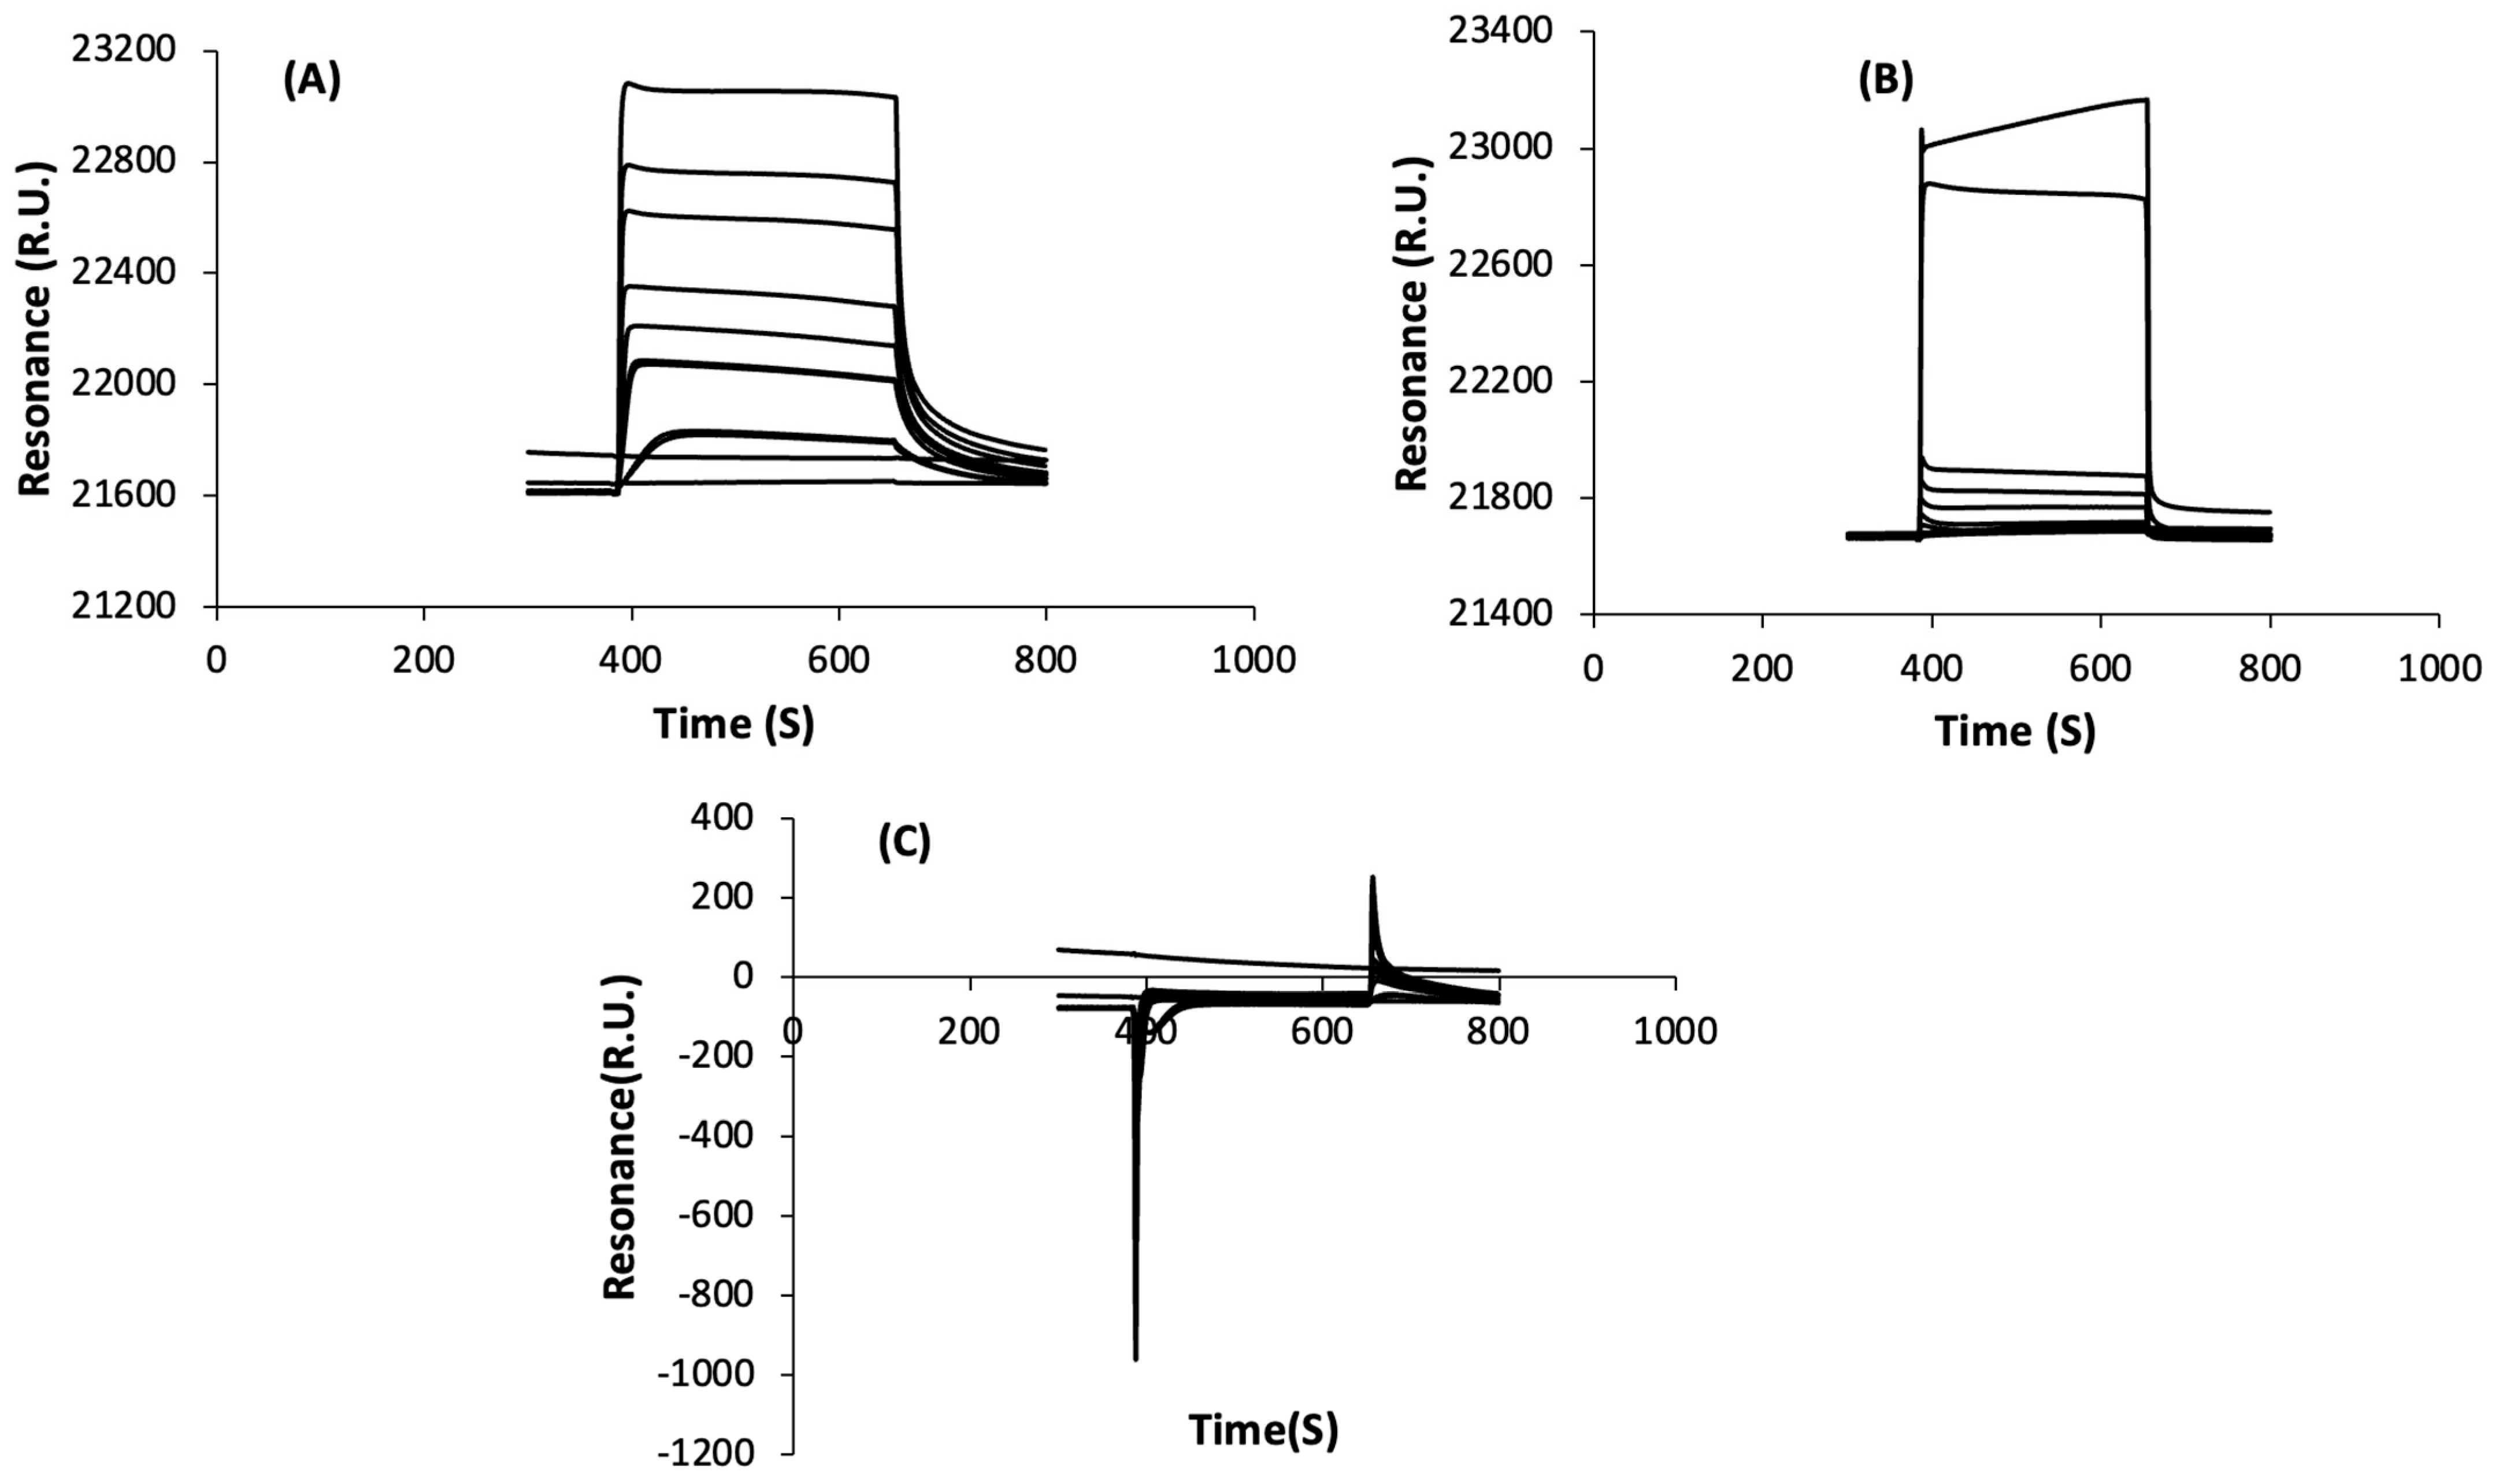
3.2.1. Non-Specific Interactions

The term specific interactions will be used for interactions between the peptide and Ni2+, while non-specific stands for interactions between the peptide and other parts (matrix, complex agent). SPR results were treated by observing at the channel which gives both interactions (active channel, with Ni2+) and the channel which represents non-specific interactions (reference channel, without Ni2+) in order to understand the effect of non-specific interactions on peptide retention time. Indeed, the retention time of a peptide in IMAC is obtained considering both specific and non-specific interactions in the column. The 22 peptides were investigated for their affinity for Ni2+ immobilized on an NTA chip. Examples of a peptide sensorgram on the active channel (Figure 4A), sensorgram on a reference channel (Figure 4B) and sensorgram for only specific interactions (Figure 4C) are presented below. In some cases, the response measured on the reference channel (without Ni2+) is higher than the response on the active channel (with Ni2+), which can lead to a negative response for a reference-subtracted sensorgram, which is supposed to illustrate only specific interactions. However, it is important to emphasize that the non-specific bindings are not necessarily perfectly corrected by this former subtraction, since the non-specific bindings might not occur in the same way on the active channel and on the reference channel, thus complicating the discussion of results where higher responses are observed on the reference channel [35]. Considering the reference-subtracted sensorgram, the AEHGSLH and APHWNIN peptide isotherms obtained were inverse and all responses were negative, which can be associated with non-specific bindings. For other peptides like GRHRQKHS, HGSLH and HGSLHKNA, some corrected responses were negative and others were positive, but the overall isotherm still has the Langmuir isotherm shape, as expected. For others, like FPGSA or LTKNV, the responses are negative and there is no correlation between the points of the isotherm, and thus the peptides do not have affinity for Ni2+ in the concentration range investigated. Therefore, the negative response might not always refer to non-specific interactions. In addition, the fact that peptides with low molecular weight lead to low responses (overall, if they have little affinity for Ni2+) might prevent the results from being very accurate.

3.2.2. Specific Interactions

Each peptide was studied in the range of concentrations that helps to obtain a sorption isotherm as described in Section 2.4 (Figure 2B). From their sorption isotherm, KD were obtained by fitting a 1:1 binding model and are summarized in Table 3, and the evolution of KD is illustrated on Figure 3B. The KD values are reliable when they are lower than half of the maximum concentration studied.
The significance of the fitted KD is expressed by standard error (SE) and this SE should be lower than 10% of the KD value, otherwise KD can have a wide range of values [36]. In these experiments, all peptides investigated show high values of SE (greater than 10% of the KD), making it difficult to evaluate if one peptide has a higher affinity for Ni2+ compared to another one. Therefore, the affinity of peptides for Ni2+ is evaluated by groups of peptides, as described hereafter. First, group A, with KD less than 85 μM taking into account the standard errors for fitting the data (SE), is composed of peptides HHHHHH, GH8AY, GRHRQKHS and KGKSR. Secondly, group B, with KD varying between 94 and 1200 μM, is composed of peptides YPVGR, HGSLHKNA, RHGEWRPS, HGSLH, QRHRK and KRHGEWRPS. Then, group C, with KD higher than 1200 μM, is composed of peptides GLH, KERESH, GLHLPS, QSHF and LAHS. Finally, group D is composed of peptides VSHVN, APHWNIN, AEHGSLH, KETQH, LLH, FPGSA and LTKNV, for which it was not possible to determine the KD in the range of concentrations investigated. From KD values, the corresponding association constant (KA, M−1) was also calculated as KA = 1/KD. The maximum resonance at equilibrium (Rmax, R.U.) was obtained generally for the highest peptide concentration. Results are summarized in Table 3. The lower the dissociation constant (KD) is or the higher the affinity constant (KA) is, the better the affinity of peptides for Ni2+ is.
Concerning group A, peptides HHHHHH, GH8AY, GRHRQKHS and KGKSR showed lower KD compared to other peptides and thus higher affinity for Ni2+. This affinity of peptides for Ni2+ can be explained by the presence of two or more amino-acid residues with aromatic rings (i.e., histidine, H) in their sequence. Indeed, according to the literature, HHHHHH was expected to have a good affinity for Ni2+ since it showed a lower KD (0.014 ± 0.001) μM in previous studies [24,37] and GH8AY showed a good affinity for Ni2+ according to the literature [25]. The peptide GRHRQKHS shows affinity for Ni2+ due to the presence of H at the third position and the presence of a second H at the n + 4 position from the first H. According to former studies [17,24], two histidines separated by three residues (position n: n + 4) is a position that favors the affinity of a peptide for Ni2+. In addition, arginine (R) and lysine (K) residues can also participate to increase affinity via ionic interactions with the NTA-Ni2+ complex (negatively charged) due to their positive charges as explained in Section 3.1.2. Therefore, KGKSR shows a noticeable affinity due to the presence of two lysine (K) residues and one arginine (R) residues, which lead to the 100% positive charges of this sequence at pH 7.4 (Table 1).
In addition, the peptides of group B (YPVGR, HGSLHKNA, RHGEWRPS, HGSLH, QRHRK and KRHGEWRPS) also show moderate affinity for Ni2+. These peptides present at least two histidine (H) and/or tryptophan (W) residues that influenced their ability to chelate Ni2+ with, sometimes, additional arginine (R) or lysine (K) that can participate to form other interactions, except peptide YPVGR. Indeed, the affinity of YPVGR might be due to the presence of arginine (R) and tyrosine (Y), which is an amino acid also reported to contribute to metal binding [29,38] due to the presence of an aromatic ring and a hydroxyl group on its side chain.
A third group of peptides, C, comprising GLH, KERESH, GLHLPS, QSHF and LAHS sequences shows very low affinity for Ni2+ since the saturation has not been reached in the range of concentrations investigated (maximum concentration: 30,000 μM). The lower affinity for Ni2+ observed for these peptides is due to the presence of only one histidine residue in their sequences. In addition, the KD values of peptides KERESH, GLHLPS and LAHS might not be reliable since they are higher or closer to half of the maximum concentration studied for each peptide [36].
Further, the last group, D, constitutes peptides VSHVN, APHWNIN, AEHGSLH, KETQH, LLH, FPGSA and LTKNV and does not show affinity for Ni2+ in the range of concentrations studied. For some peptides, the saturation was not attained and the isotherm was a straight line upward (Figure 2C), which means unknown interactions are increasing and higher concentrations might be needed to reach saturation. For other peptides, negative responses are observed and kept decreasing as the concentration increased (inversed isotherms (Figure 2D) or straight lines downward. Therefore, non-specific interactions, i.e., affinity for the matrix or NTA, are important compared to the affinity for Ni2+. Indeed, AEHGSLH and APHWNIN show the same behaviors with inverse isotherms, characteristic of non-specific interactions increasing with peptide concentration (Figure 2D). These peptides with their respective AE and AP motif at their N-terminal part can probably bother the formation of a complex with Ni2+. Indeed, the study of Bal and colleagues [39] reported that alanine (A) at the N-terminus of a peptide can destabilize the complex formed between Cu2+ and a peptide; yet, Cu2+ and Ni2+ are transition metals having the same behaviors according to the HSAB theory. In addition, the proline residue (P) at positions 2, 3 or 4 is known to slow down the metal complexation by inducing the peptide chain to bend [39]. In addition, proline was reported to hinder the deprotonation of the N-terminus, sometimes involved in metal complexation [31]. As for KETQH and LLH, their histidine at the C-terminal might complicate its accessibility to Ni2+ binding, while FPGSA and LTKNV do not contain any histidine to enhance Ni2+ chelation.

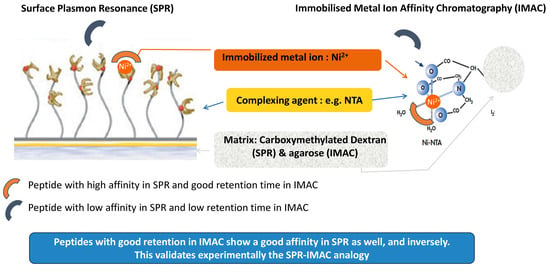
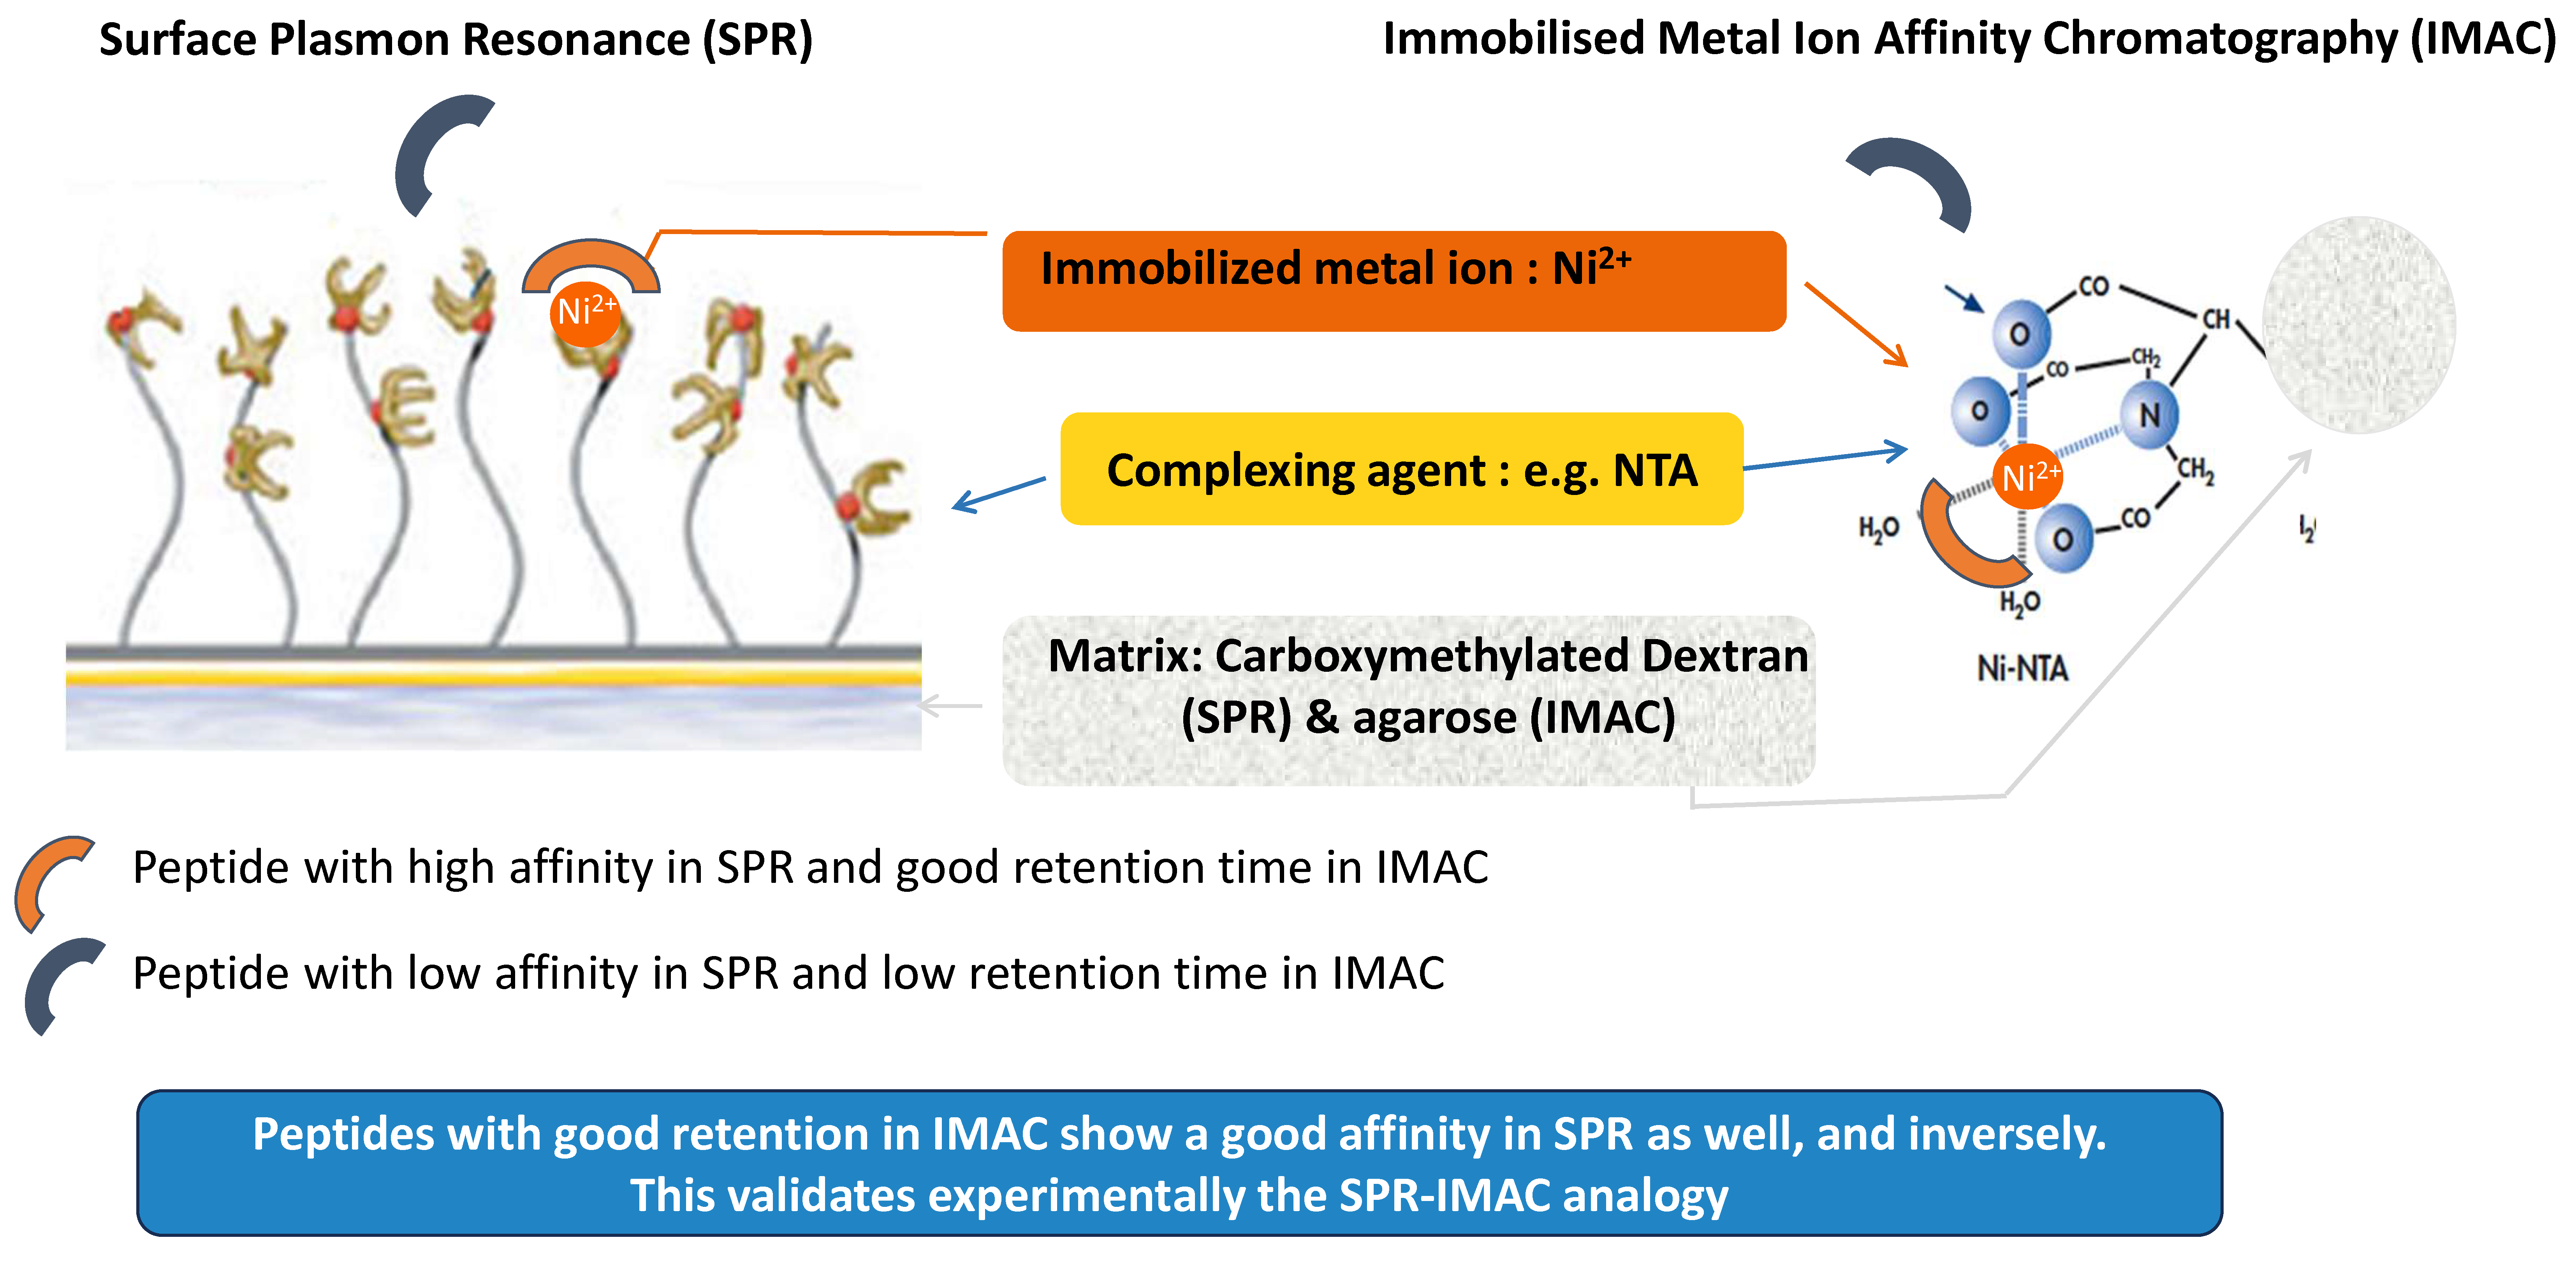
3.3. Understanding the Peptide-Ni2+ Interaction Based on the Analogy between SPR and IMAC

Considering that NTA is a complexing agent used on SPR chips, the HiFliQ NTA-Ni2+ column might be a good choice for IMAC experiments to study the SPR-IMAC analogy well. Unfortunately, peptides are better retained in the HisTrap X-Ni2+ column, and thus more data are available for this latter column (Figure 3A).
To understand peptide-Ni2+ complexation in both SPR and IMAC, the comparison was made between the value of retention times for each peptide in IMAC and the corresponding values of KA determined in SPR. For this purpose, various trends characterizing the IMAC-SPR analogy were drawn between groups of peptides determined in the IMAC HisTrap X-Ni2+ (groups 1, 2, 3, and 4) and HiFliQ NTA-Ni2+ (groups I, II, III) and those determined in SPR (groups A, B, C, and D) (Table 4).
The first couple, 1A, is composed of peptides GH8AY, GRHRQKHS and HHHHHH, which have high constant affinity in SPR and are also highly retained in IMAC since they are eluted with a high quantity of imidazole compared to the other peptides. The second couple, 2B, constitutes peptides QRHRK, KRHGEWRPS, HGSLHKNA, HGSLH and RHGEWRPS, which have moderate affinity for Ni2+ in SPR and are also well retained in IMAC. The third couple, 3C, is composed of the peptides GLH and GLHPS, which have low affinity for Ni2+ in SPR and have low retention in IMAC as well. The fourth couple, 4D, concerns peptides FPGSA, LTKNV, VSHVN, LLH and KETQH, which have no affinity for Ni2+ in SPR and are not retained in IMAC.
However, beyond these direct and major trends correlating IMAC and SPR, sometimes trends are not so obvious with some exceptions observed for peptides having lower/no affinity for Ni2+ in IMAC (group 3, 4) or SPR (C, D). These peptides are KGKSR (2A), AEHGSLH (3D), APHWNIN (3D), YPVGR (4B), KERESH (4C), LAHS (4C) and QSHF (4C). It can be observed that some peptides can have lower retention in IMAC and do not have any affinity for Ni2+ in SPR (AEHGSLH and APHWNIN). Inversely, some peptides are not retained in IMAC but they show low affinity for Ni2+ in SPR (KERESH, LAHS and QSHF).
Concerning HiFliQ NTA-Ni2+, a similar trend was observed and couples are illustrated in Table 4, where couple IA contains peptides with higher affinities that are the same as those for couple 1A, and couple IIB contains peptides with moderate affinities, like for couple 2B. Due to less data for this HiFliQ NTA-Ni2+ column, other peptides are in couple IIIC or IIID with very low/no affinities.
The main exceptions concern KGKSR and YPVGR (two peptides without H); despite their good affinity constant in SPR, KGKSR is eluted with a low quantity of imidazole for the HisTrap X-Ni2+ column and it is not retained in the HiFliQ NTA-Ni2+ column, while YPVGR is not retained in either column. Indeed, for these two peptides, the affinity determined in SPR mainly involves weak ionic interactions with Ni2+, which cannot be corrected even with the signal observed on the reference channel (uncharged in Ni2+). Yet, in IMAC, these weak ionic interactions between Ni2+ and peptides (KGKSR or YPVGR) are easily destroyed upon elution with imidazole (a competitive agent), which explains their low/absence of retention.
Taken all together, these results demonstrate experimentally for the first time the analogy between SPR and IMAC. Indeed, for around 70% of the peptides investigated in the HisTrap X-Ni2+ and for around 60% of peptides studied in the HiFliQ NTA-Ni2+, peptides which have good affinity for immobilized Ni2+ in SPR also have a good affinity for Ni2+ in IMAC, and peptides without affinity for Ni2+ in SPR do not have a good affinity for Ni2+ in IMAC, as is illustrated in Figure 3. In addition, the analogy is clear for peptides with higher affinity for Ni2+ in SPR or IMAC.

4. Conclusions

Among the 22 peptides investigated in IMAC and SPR, 70% (HisTrap X-Ni2+) and 60% (HiFliQ NTA-Ni2+) of the peptides validated the analogy between IMAC and SPR: peptides with high retention times in IMAC were also endowed with a high affinity for Ni2+ in SPR. Both in IMAC and SPR, the affinity for immobilized Ni2+ depends on the position and the number of histidine (H) residues present in the sequence, while tryptophan (W) residues have very low/no impact. In addition, the high percentages of global positive charges at pH 7.4, which is due to the presence of lysine (K) and arginine (R) residues in the sequences, were also responsible of high peptide retention times in IMAC and high affinities in SPR, which is related to ionic interactions. Therefore, an increase in the NaCl concentration will be further considered to decrease ionic interactions so that coordination interactions between the peptide and the immobilized metal ion can be observed solely. This will improve the SPR-IMAC correlations for further chromatographic simulation.
In addition, since the affinity of peptides is also related to the charge of the Ni(II)-peptide complexes present at pH 7.4, it would be useful to also investigate the charge and composition of the supposed Ni(II)-peptide complexes formed at 7.4 by various analytical techniques to go deeper in the interpretation of SPR and IMAC results, notably via pH potentiometry measurement.

Supplementary Materials

The following supporting information can be downloaded at: https://www.mdpi.com/article/10.3390/inorganics12010031/s1, Data S1: Pea protein sequences from UniprotKB; Data S2: IMAC column specifications.

Author Contributions

R.I.: conceptualization, investigation, formal analysis, writing—original draft; J.A.C.E.: conceptualization, investigation, formal analysis, writing—review & editing; C.P.: conceptualization, investigation, formal analysis, writing—review & editing; K.S.: conceptualization, formal analysis, writing—review & editing; L.S.: formal analysis, writing—review & editing; S.B.-M.: conceptualization, formal analysis; L.M.: supervision, writing—review & editing; L.C.-R.: conceptualization, supervision, project administration, funding acquisition, writing—review & editing. All authors have read and agreed to the published version of the manuscript.

Funding

The authors acknowledge financial support from the “Impact Biomolecules” project of the “Lorraine Université d’Excellence” (in the context of the “Investissements d’avenir” program implemented by the French National Research Agency—ANR project number 15-004). Also, they would like to thank the financial support of ANR JCJC MELISSA (2020) and an MESR grant from the French ministry (2020).

Data Availability Statement

Data are contained within the article.

Acknowledgments

The authors acknowledge technical support in chromatography on the ASIA platform (Université de Lorraine-INRAE; https://a2f.univ-lorraine.fr/en/asia-2/). The authors also thank the PASM platform for the use of the Thermo Scientific UHPLC-HRMS system (Plateau d’Analyse Structurale et Métabolique-SF4242 EFABA, F-44505 Vandoeuvre-lès-Nancy).

Conflicts of Interest

The authors declare no conflicts of interest. The funders had no role in the design of the study; in the collection, analyses, or interpretation of data; in the writing of the manuscript; or in the decision to publish the results.

References

  1. Guo, L.; Harnedy, P.A.; Li, B.; Hou, H.; Zhang, Z.; Zhao, X.; FitzGerald, R.J. Food protein-derived chelating peptides: Biofunctional ingredients for dietary mineral bioavailability enhancement. Trends Food Sci. Technol. 2014, 37, 92–105. [Google Scholar] [CrossRef]
  2. Yesiltas, B.; García-Moreno, P.J.; Gregersen, S.; Olsen, T.H.; Jones, N.C.; Hoffmann, S.V.; Marcatili, P.; Overgaard, M.T.; Hansen, E.B.; Jacobsen, C. Antioxidant peptides derived from potato, seaweed, microbial and spinach proteins: Oxidative stability of 5% fish oil-in-water emulsions. Food Chem. 2022, 385, 132699. [Google Scholar] [CrossRef]
  3. Lv, Y.; Liu, Q.; Bao, X.; Tang, W.; Yang, B.; Guo, S. Identification and Characteristics of Iron-Chelating Peptides from Soybean Protein Hydrolysates Using IMAC-Fe3+. J. Agric. Food Chem. 2009, 57, 4593–4597. [Google Scholar] [CrossRef] [PubMed]
  4. Lv, Y.; Bao, X.; Liu, H.; Ren, J.; Guo, S. Purification and characterization of caclium-binding soybean protein hydrolysates by Ca2+/Fe3+ immobilized metal affinity chromatography (IMAC). Food Chem. 2013, 141, 1645–1650. [Google Scholar] [CrossRef]
  5. Wang, C.; Li, B.; Ao, J. Separation and identification of zinc-chelating peptides from sesame protein hydrolysate using IMAC-Zn2+ and LC–MS/MS. Food Chem. 2012, 134, 1231–1238. [Google Scholar] [CrossRef] [PubMed]
  6. Caetano-Silva, M.E.; Simabuco, F.M.; Bezerra, R.M.N.; da Silva, D.C.; Barbosa, E.A.; Moreira, D.C.; Brand, G.D.; de Almeida Leite, J.R.d.S.; Pacheco, M.T.B. Isolation and Sequencing of Cu-, Fe-, and Zn-Binding Whey Peptides for Potential Neuroprotective Applications as Multitargeted Compounds. J. Agric. Food Chem. 2020, 68, 12433–12443. [Google Scholar] [CrossRef] [PubMed]
  7. Kangsanant, S.; Thongraung, C.; Jansakul, C.; Murkovic, M.; Seechamnanturakit, V. Purification and characterisation of antioxidant and nitric oxide inhibitory peptides from Tilapia (Oreochromis niloticus) protein hydrolysate. Int. J. Food Sci. Technol. 2015, 50, 660–665. [Google Scholar] [CrossRef]
  8. Sulkowski, E. Purification of proteins by IMAC. Trends Biotechnol. 1985, 3, 1–7. [Google Scholar] [CrossRef]
  9. Ueda, E.K.M.; Gout, P.W.; Morganti, L. Current and prospective applications of metal ion–protein binding. J. Chromatogr. A 2003, 988, 1–23. [Google Scholar] [CrossRef]
  10. Caetano-Silva, M.E.; Bertoldo-Pacheco, M.T.; Paes-Leme, A.F.; Netto, F.M. Iron-binding peptides from whey protein hydrolysates: Evaluation, isolation and sequencing by LC–MS/MS. Food Res. Int. 2015, 71, 132–139. [Google Scholar] [CrossRef]
  11. Yamauchi, O.; Odani, A.; Takani, M. Metal–amino acid chemistry. Weak interactions and related functions of side chain groups. J. Chem. Soc. Dalton Trans. 2002, 18, 3411–3421. [Google Scholar] [CrossRef]
  12. Braun, R.; Bachmann, S.; Schönberger, N.; Matys, S.; Lederer, F.; Pollmann, K. Peptides as biosorbents—Promising tools for resource recovery. Res. Microbiol. 2018, 169, 649–658. [Google Scholar] [CrossRef] [PubMed]
  13. El Hajj, S.; Sepúlveda Rincón, C.T.; Girardet, J.-M.; Cakir-Kiefer, C.; Stefan, L.; Zapata Montoya, J.E.; Boschi-Muller, S.; Gaucher, C.; Canabady-Rochelle, L. Electrically switchable nanolever technology for the screening of metal-chelating peptides in hydrolysates. J. Agric. Food Chem. 2021, 69, 8819–8827. [Google Scholar] [CrossRef]
  14. Canabady-Rochelle, L.L.S.; Selmeczi, K.; Collin, S.; Pasc, A.; Muhr, L.; Boschi-Muller, S. SPR screening of metal chelating peptides in a hydrolysate for their antioxidant properties. Food Chem. 2018, 239, 478–485. [Google Scholar] [CrossRef]
  15. Irankunda, R.; Camaño Echavarría, J.A.; Paris, C.; Stefan, L.; Desobry, S.; Selmeczi, K.; Muhr, L.; Canabady-Rochelle, L. Metal-Chelating Peptides Separation Using Immobilized Metal Ion Affinity Chromatography: Experimental Methodology and Simulation. Separations 2022, 9, 370. [Google Scholar] [CrossRef]
  16. El Hajj, S.; Irankunda, R.; Andrés Camaño Echavarría, J.; Arnoux, P.; Paris, C.; Stefan, L.; Gaucher, C.; Boschi-Muller, S.; Canabady-Rochelle, L. Metal-chelating activity of soy and pea protein hydrolysates obtained after different enzymatic treatments from protein isolates. Food Chem. 2023, 405, 134788. [Google Scholar] [CrossRef] [PubMed]
  17. Bernaudat, F.; Bülow, L. Rapid evaluation of nickel binding properties of His-tagged lactate dehydrogenases using surface plasmon resonance. J. Chromatogr. A 2005, 1066, 219–224. [Google Scholar] [CrossRef] [PubMed]
  18. Muhr, L.; Pontvianne, S.; Selmeczi, K.; Paris, C.; Boschi-Muller, S.; Canabady-Rochelle, L. Chromatographic separation simulation of metal-chelating peptides from surface plasmon resonance binding parameters. J. Sep. Sci. 2020, 43, 2031–2041. [Google Scholar] [CrossRef] [PubMed]
  19. García Arteaga, V.; Apéstegui Guardia, M.; Muranyi, I.; Eisner, P.; Schweiggert-Weisz, U. Effect of enzymatic hydrolysis on molecular weight distribution, techno-functional properties and sensory perception of pea protein isolates. Innov. Food Sci. Emerg. Technol. 2020, 65, 102449. [Google Scholar] [CrossRef]
  20. Boye, J.; Zare, F.; Pletch, A. Pulse proteins: Processing, characterization, functional properties and applications in food and feed. Food Res. Int. 2010, 43, 414–431. [Google Scholar] [CrossRef]
  21. Tamm, F.; Herbst, S.; Brodkorb, A.; Drusch, S. Functional properties of pea protein hydrolysates in emulsions and spray-dried microcapsules. Food Hydrocoll. 2016, 58, 204–214. [Google Scholar] [CrossRef]
  22. Lam, A.C.Y.; Can Karaca, A.; Tyler, R.T.; Nickerson, M.T. Pea protein isolates: Structure, extraction, and functionality. Food Rev. Int. 2018, 34, 126–147. [Google Scholar] [CrossRef]
  23. Hou, Y.; Wu, Z.; Dai, Z.; Wang, G.; Wu, G. Protein hydrolysates in animal nutrition: Industrial production, bioactive peptides, and functional significance. J. Anim. Sci. Biotechnol. 2017, 8, 24. [Google Scholar] [CrossRef]
  24. Knecht, S.; Ricklin, D.; Eberle, A.N.; Ernst, B. Oligohis-tags: Mechanisms of binding to Ni2+-NTA surfaces. J. Mol. Recognit. 2009, 22, 270–279. [Google Scholar] [CrossRef] [PubMed]
  25. Kermani, B.G.; Kozlov, I.; Melnyk, P.; Zhao, C.; Hachmann, J.; Barker, D.; Lebl, M. Using support vector machine regression to model the retention of peptides in immobilized metal-affinity chromatography. Sens. Actuators B Chem. 2007, 125, 149–157. [Google Scholar] [CrossRef]
  26. Sofer, G.K.; Hagel, L. Handbook of Process Chromatography: A Guide to Optimization, Scale up, and Validation; Academic Press: San Diego, CA, USA, 1997. [Google Scholar]
  27. Block, H.; Maertens, B.; Spriestersbach, A.; Brinker, N.; Kubicek, J.; Fabis, R.; Labahn, J.; Schäfer, F. Methods in Enzymology; Elsevier: Amsterdam, The Netherlands, 2009; pp. 439–473. [Google Scholar]
  28. Ren, D.; Penner, N.A.; Slentz, B.E.; Regnier, F.E. Histidine-Rich Peptide Selection and Quantification in Targeted Proteomics. J. Proteome Res. 2004, 3, 37–45. [Google Scholar] [CrossRef]
  29. Sun, X.; Chiu, J.-F.; He, Q.-Y. Application of immobilized metal affinity chromatography in proteomics. Expert Rev. Proteom. 2005, 2, 649–657. [Google Scholar] [CrossRef] [PubMed]
  30. Karavelas, T.; Mylonas, M.; Malandrinos, G.; Plakatouras, J.C.; Hadjiliadis, N.; Mlynarz, P.; Kozlowski, H. Coordination properties of Cu(II) and Ni(II) ions towards the C-terminal peptide fragment –ELAKHA– of histone H2B. J. Inorg. Biochem. 2005, 99, 606–615. [Google Scholar] [CrossRef] [PubMed]
  31. Sóvágó, I.; Ősz, K. Metal ion selectivity of oligopeptides. Dalton Trans. 2006, 32, 3841–3854. [Google Scholar] [CrossRef] [PubMed]
  32. Mesmin, C.; Domon, B. Improvement of the Performance of Targeted LC–MS Assays through Enrichment of Histidine-Containing Peptides. J. Proteome Res. 2014, 13, 6160–6168. [Google Scholar] [CrossRef] [PubMed]
  33. Ren, D.; Penner, N.A.; Slentz, B.E.; Mirzaei, H.; Regnier, F. Evaluating Immobilized Metal Affinity Chromatography for the Selection of Histidine-Containing Peptides in Comparative Proteomics. J. Proteome Res. 2003, 2, 321–329. [Google Scholar] [CrossRef] [PubMed]
  34. Cheung, R.C.F.; Wong, J.H.; Ng, T.B. Immobilized metal ion affinity chromatography: A review on its applications. Appl. Microbiol. Biotechnol. 2012, 96, 1411–1420. [Google Scholar] [CrossRef] [PubMed]
  35. GE Healthcare. Biacore X100 Getting Started 28-9615-81 Edition AA. 2009. Available online: http://www.molekulske-interakcije.si/data/equipment/GettingStarted.pdf (accessed on 17 March 2023).
  36. GE Healthcare. Biacore X100 Handbook BR-1008-10 Edition AB. 2007. Available online: https://www.imb.sinica.edu.tw/core/biophysicals/form/Biacore_X100_2_0_Handbook.pdf (accessed on 17 March 2023).
  37. Nieba, L.; Nieba-Axmann, S.E.; Persson, A.; Hämäläinen, M.; Edebratt, F.; Hansson, A.; Lidholm, J.; Magnusson, K.; Karlsson, Å.F.; Plückthun, A. BIACORE Analysis of Histidine-Tagged Proteins Using a Chelating NTA Sensor Chip. Anal. Biochem. 1997, 252, 217–228. [Google Scholar] [CrossRef]
  38. Fischer, M.; Leech, A.P.; Hubbard, R.E. Comparative Assessment of Different Histidine-Tags for Immobilization of Protein onto Surface Plasmon Resonance Sensorchips. Anal. Chem. 2011, 83, 1800–1807. [Google Scholar] [CrossRef]
  39. Bal, W.; Dyba, M.; Kozlowski, H. ChemInform Abstract: The Impact of the Amino Acid Sequence on the Specificity of Copper(II) Interactions with Peptides Having Non-Coordinating Side-Chains. ChemInform 1997, 44, 467–476. [Google Scholar] [CrossRef]
Figure 1. Chemical structures of some synthetic peptides investigated by IMAC and SPR, with histidine and tryptophan residues, functional groups being highlighted with red circle. Peptides in panels (AE) have more than two His or Trp residues that confer them the ability to chelate Ni2+; peptides in panels (F,G) have one His that confers low ability to chelate Ni2+, while peptides in panels (H,I) do not have His or Trp.
Inorganics 12 00031 g001
Figure 2. Surface plasmon resonance: (A) example of sensorgram with a color line used for each investigated concentration, x meaning values at equilibrium; (B) sorption isotherm for a peptide (with good affinity) studied, plotted from response collected at equilibrium; (C) example of an isotherm for a peptide without affinity or very low affinity where saturation is not attained (peptide KETQH); (D) example of an isotherm where KD could not be calculated due to the presence of high aspecific interactions compared to specific interactions (peptide AEHGSLH). For panel (BD), the red points represent the experimental data, and the black line represents the fitted data.
Inorganics 12 00031 g002
Figure 3. Comparison between retention times of investigated peptides in HisTrap X-Ni2+ and HiFliQ NTA-Ni2+ columns (A) and peptide-binding dissociation constants, with the red signs indicating peptides with KD not determined and peptides not retained (B).
Inorganics 12 00031 g003
Figure 4. Example of peptide sensorgram for channel with Ni2+ (specific + aspecific interactions) (A); peptide sensorgram on reference channel (without Ni2+, aspecific interactions) (B); and corrected sensorgram (difference of response between 2 previous channels) (C).
Inorganics 12 00031 g004
Table 1. Synthetic peptides investigated and selected from pea protein sequences with their theoretical physico-chemical properties. Pea protein names and sequences were obtained from UniprotKB; the molecular weight and isoelectrical point were calculated from PepCalc software, while the percentage of global charges at pH 7.4 was calculated using Percepta software. n.c.: not concerned.
UniprotKB PepCalcPercepta
Protein CodeProtein NamePeptide Sequencen ResiduesMW (g/mol)Iso-Electric Point (PI)% of Global Charge at pH 7.4
n.cn.cGHHHHHHHHAY 111406.438.2180% +, 3% -
n.cn.cHHHHHH6840.877.9770% +, 6% -
P05692Leguminin JGRHRQKHS 81005.1212.13100% +
O24294_PEALegumin (Minor small)QRHRK 5723.912.13100% +
P13915ConvicilinKRHGEWRPS91152.2711.22100% +
P02857Leguminin AHGSLHKNA 8862.959.8865% +, 0% -
P02857Leguminin AKGKSR 5574.6711.57100% +
P02857Leguminin AHGSLH5549.597.7226% +, 25% -
P13915ConvicilinRHGEWRPS81024.0910.3944% +, 0% -
P02857Leguminin AAEHGSLH 7749.776.0511% +, 48% -
P05692Leguminin JAPHWNIN7850.92 7.8820% +, 21% -
P05692Leguminin JGLH3325.367.8134% +, 13% -
P05692Leguminin JGLHLPS6622.717.8019% +, 21% -
P05692legumin JYPVGR5590.679.5752% +, 0% -
O24294_PEALegumin (Minor small)KERESH6784.827.6024% +, 27% -
P13918vicilinFPGSA 5477.51 3.380%-, 56% -
P62926Albumin-1 ALTKNV 5573.68 10.1270% +, 0% -
O24294_PEALegumin (Minor small)VSHVN5554.607.7818% +, 25% -
Q7M1N3_PEALegumin L1 beta chain LLH3381.477.8134% +, 13% -
O24294_PEALegumin (Minor small)LAHS4426.477.8122% +, 19% -
P13918VicilinQSHF4517.537.5215%+, 34% -
P13918vicilinKETQH5641.677.6024% +, 26% -
Table 2. Retention times of peptides investigated with HisTrap X-Ni2+ and HiFiQ NTA-Ni2+ columns and their corresponding groups. Letters (a–h) indicate statistically significant differences (p < 0.05) between samples.
PeptidesHisTrap X-Ni2+ Mean tR (min)GroupHiFliQ NTA-Ni2+ Mean tR (min)Group
GH8AY30.25 ± 0 g122.93 ± 0 hI
HHHHHH22.20 ± 0.58 f117.62 ± 0.23 gI
GRHRQKHS15.79 ± 0.34 e18.72 ± 0.18 eI
QRHRK10.01 ± 0.06 d25.01 ± 0.62 c,dII
KRHGEWRPS8.58 ± 0.29 c25.24 ± 0.36 c,dII
HGSLHKNA7.71 ± 0.29 c26.02 ± 0.05 dII
KGKSR5.57 ± 0.02 b2not retainedIII
HGSLH5.48 ± 0.20 b24.82 ± 0.24 b,cII
RHGEWRPS5.41 ± 0.19 b23.98 ± 0.22 a,bII
AEHGSLH3.93 ± 0.09 a3not retainedIII
APHWNIN3.81 ± 0.22 a33.50 ± 0.04 aII
GLH3.68 ± 0.46 a3not retainedIII
GLHLPS3.44 ± 0.67 a3not retainedIII
YPVGRnot retained4not retainedIII
KERESH4III
FPGSA4III
LTKNV4III
VSHVN4III
LLH4III
LAHS4III
QSHF4III
KETQH4III
Table 3. Peptide binding affinity data obtained using SPR and the range of concentrations in which peptides were investigated. n.d.: Not determined.
GroupPeptideKD (μM)SE (KD) (μM)Rmax (R.U.)SE (Rmax) (R.U.)Concentration Range (µM)
AHHHHHH 0.727.0197.9027.000.4–50
AGH8AY 1.10.5164.8110.01–100
AGRHRQKHS 18.74.928.701.901–200
AKGKSR 45.637.024.97.620–5000
BYPVGR156.6420.01595–5000
BHGSLHKNA 195.564.072.385.705–1000
BRHGEWRPS303.9210.081.31420–1000
BHGSLH 341.574.038.402.205–5000
BQRHRK 910.0230.064.305.3020–5000
BKRHGEWRPS737.9250.0366.33020–5000
CGLH1567.0760.019.302.920–5000
CKERESH4835.05400.076.925500–10,000
CGLHLPS5586.05700.054.522100–10,000
CQSHF10,840.013,000.086.9251000–30,000
CLAHS12,480.05400.0105.82350–15,000
DVSHVNn.dn.dn.dn.d100–10,000
DAPHWNINn.dn.dn.dn.d5–5000
DAEHGSLH n.dn.dn.dn.d5–10,000
DKETQHn.dn.dn.dn.d50–20,000
DLLHn.dn.dn.dn.d100–30,000
DFPGSA n.dn.dn.dn.d1–10,000
DLTKNVn.dn.dn.dn.d1–10,000
Table 4. Investigation of the validity of the analogy between IMAC and SPR. Comparison is based on couples formed based on groups of peptides in IMAC (group 1, 2, 3, 4 for HisTrap X-Ni2+ and group I, II, III for HiFliQ NTA-Ni2+) and SPR (group A, B, C, D).
PeptideHisTrap X-Ni2+HiFliQ NTA-Ni2+
GH8AY1AIA
HHHHHH1AIA
GRHRQKHS1AIA
QRHRK2BIIB
KRHGEWRPS2BIIB
HGSLHKNA2BIIB
KGKSR2AIIIA
HGSLH2BIIB
RHGEWRPS2BIIB
AEHGSLH3DIIID
APHWNIN3DIID
GLH3CIIIC
GLHLPS3CIIIC
YPVGR4BIIIB
KERESH4CIIIC
FPGSA4DIIID
LTKNV4DIIID
VSHVN4DIIID
LLH4DIIID
LAHS4CIIIC
QSHF4CIIIC
KETQH4DIIID
Disclaimer/Publisher’s Note: The statements, opinions and data contained in all publications are solely those of the individual author(s) and contributor(s) and not of MDPI and/or the editor(s). MDPI and/or the editor(s) disclaim responsibility for any injury to people or property resulting from any ideas, methods, instructions or products referred to in the content.

