Article

Facile Synthesis and Characterization of Manganese Ferrite Nanoparticles for the Successful Removal of Safranine T Dye from Aqueous Solutions

by
Zahrah Alhalili
1,* and
Ehab A. Abdelrahman
2,3,*
1
Department of Chemistry, College of Science and Humanities, Shaqra University, Shaqra 11961, Saudi Arabia
2
Department of Chemistry, College of Science, Imam Mohammad Ibn Saud Islamic University (IMSIU), Riyadh 11623, Saudi Arabia
3
Chemistry Department, Faculty of Science, Benha University, Benha 13518, Egypt
*
Authors to whom correspondence should be addressed.
Inorganics 2024, 12(1), 30; https://doi.org/10.3390/inorganics12010030
Submission received: 1 December 2023 / Revised: 5 January 2024 / Accepted: 8 January 2024 / Published: 15 January 2024
(This article belongs to the Section Inorganic Materials)

Abstract

:
Safranine T dye causes health problems such as skin and respiratory irritations. Hence, the safranine T dye was efficiently removed from aqueous media employing a simply synthesized manganese ferrite (MnFe2O4) nanoadsorbent. The synthesis of manganese ferrite nanoparticles was carried out by the pechini sol–gel approach using tartaric acid to serve as a chelating agent in addition to 1,2-propanediol to serve as a crosslinker. The TEM analysis showed that the shape of MnFe2O4 nanoparticles is semi-spherical, with an average particle size of 19.32 nm that coincides well with that measured from the XRD (18.89 nm). Further, the several factors that influenced the removal process of safranine T dye were examined, such as time, dye concentration, pH, and temperature. The ideal experimental conditions that achieved the highest safranine T dye removal percentage are pH 8, 80 min, and 298 K. The maximum adsorption capacity of MnFe2O4 nanoparticles towards safranine T dye equals 334.45 mg/g. The removal process of safranine T dye by manganese ferrite nanoparticles was chemical, exothermic, and well defined through the Langmuir equilibrium sorption isotherm in addition to the pseudo-second-order model. The synthesized manganese ferrite nanoparticles have the ability to be reused many times without losing their efficiency.

1. Introduction

Dyes and pigments find widespread application in industries such as leather, textile, plastics, printing, pharmaceuticals, rubber, cosmetics, paper, food, and carpet manufacturing to impart color to their products. Annually, over 10,000 distinct dyes, totaling approximately 7 × 10⁵ tons, are manufactured for diverse industrial processes [1,2,3]. Due to their intricate aromatic structure, many dyes exhibit high resistance to degradation through chemical, physical, and biological treatments. The release of wastewater containing dyes into water bodies presents a significant pollution issue, as these dyes impart undesirable color to the water, diminishing sunlight penetration and reducing gas solubility [4,5]. Safranin T is an organic dye soluble in water, extensively employed in the textile industry. Nevertheless, exposure to Safranin T dye can result in eye burns, potentially causing permanent harm to the cornea and conjunctiva in both human and rabbit eyes. Additionally, contact with Safranin T dye can lead to irritation of the skin and respiratory tract [6]. Hence, it is imperative to treat industrial wastewaters containing such dyes before releasing them into the environment. Various physical and chemical methods, including flocculation [7,8], adsorption [9,10], membrane filtration [11,12], coagulation [13,14], precipitation [15,16], ozonation [17,18], electrochemical techniques [19,20], and fungal decolonization [21,22], have been thoroughly explored for the removal of dyes from aquatic environments. Within these methods, adsorption has demonstrated superiority over other techniques in eliminating dyes and organic pollutants from process or waste effluents. This superiority is credited to its initial affordability, high effectiveness, uncomplicated design, and operational simplicity. However, a notable drawback of this approach is the elevated cost associated with adsorbents, thereby increasing the overall treatment expenses [23,24]. Using magnetic metal oxides for the removal of heavy metals and dyes offers several advantages such as low cost, ease of synthesis, high adsorption capacity, ease of separation from the treated solution using magnet, and regenerability [25]. Several methods can be employed for preparing magnetic metal oxides such as co-precipitation [26], sol–gel [27], hydrothermal [28,29], spray pyrolysis [30], solid state reaction [31], electrochemical [32], and chemical vapor deposition [33]. The pechini sol–gel method for preparing magnetic metal oxides offers several advantages, such as low crystal size, tailored morphology, low cost, scalability, and high adsorption properties [23,25]. Hence, in this paper, the pechini sol–gel approach was used for the synthesis of MnFe2O4 nanoparticles using tartaric acid to serve as a chelating agent in addition to 1,2-propanediol to serve as a crosslinker. The synthesized MnFe2O4 nanoparticles were characterized using several tools such as Fourier-transform infrared spectroscopy (FTIR), X-ray diffraction (XRD), transmission scanning electron microscopy (TEM), energy-dispersive X-ray spectroscopy (EDS), and scanning electron microscopy (SEM). Further, the synthesized MnFe2O4 nanoparticles were utilized for the adsorption of safranine T dye from aqueous media. Also, the impacts of pH, contact time, temperature, concentration, and reusability were investigated. Manganese ferrite nanoparticles offer distinct advantages that render them appealing for safranine T dye removal. Being a magnetic material, these nanoparticles facilitate effortless separation from a solution through the application of an external magnetic field. This characteristic streamlines the recovery and reusability of the adsorbent, diminishing operational expenses and enhancing the environmental friendliness of the process. Moreover, manganese ferrite nanoparticles typically exhibit a substantial surface area, providing numerous active sites for adsorption and ensuring the efficient extraction of contaminants from a solution. Notably, these nanoparticles are recognized for their chemical stability, a pivotal attribute for effective adsorbents, enabling them to withstand diverse chemical conditions without significant degradation, thereby ensuring prolonged performance. Depending on the synthesis method and the availability of raw materials, MnFe2O4 nanoparticles may represent a cost-effective adsorbent compared to certain alternatives, making economic considerations paramount in the selection of adsorbents for large-scale applications.

2. Experimental

2.1. Materials

1,2-propanediol (C3H8O2), iron(III) nitrate nonahydrate (Fe(NO3)3·9H2O), manganese(II) nitrate tetrahydrate (Mn(NO3)2·4H2O), hydrochloric acid (HCl), tartaric acid (C4H6O6), sodium hydroxide (NaOH), potassium nitrate (KNO3), and safranine T dye (C20H19ClN4) were obtained from Sigma-Aldrich.

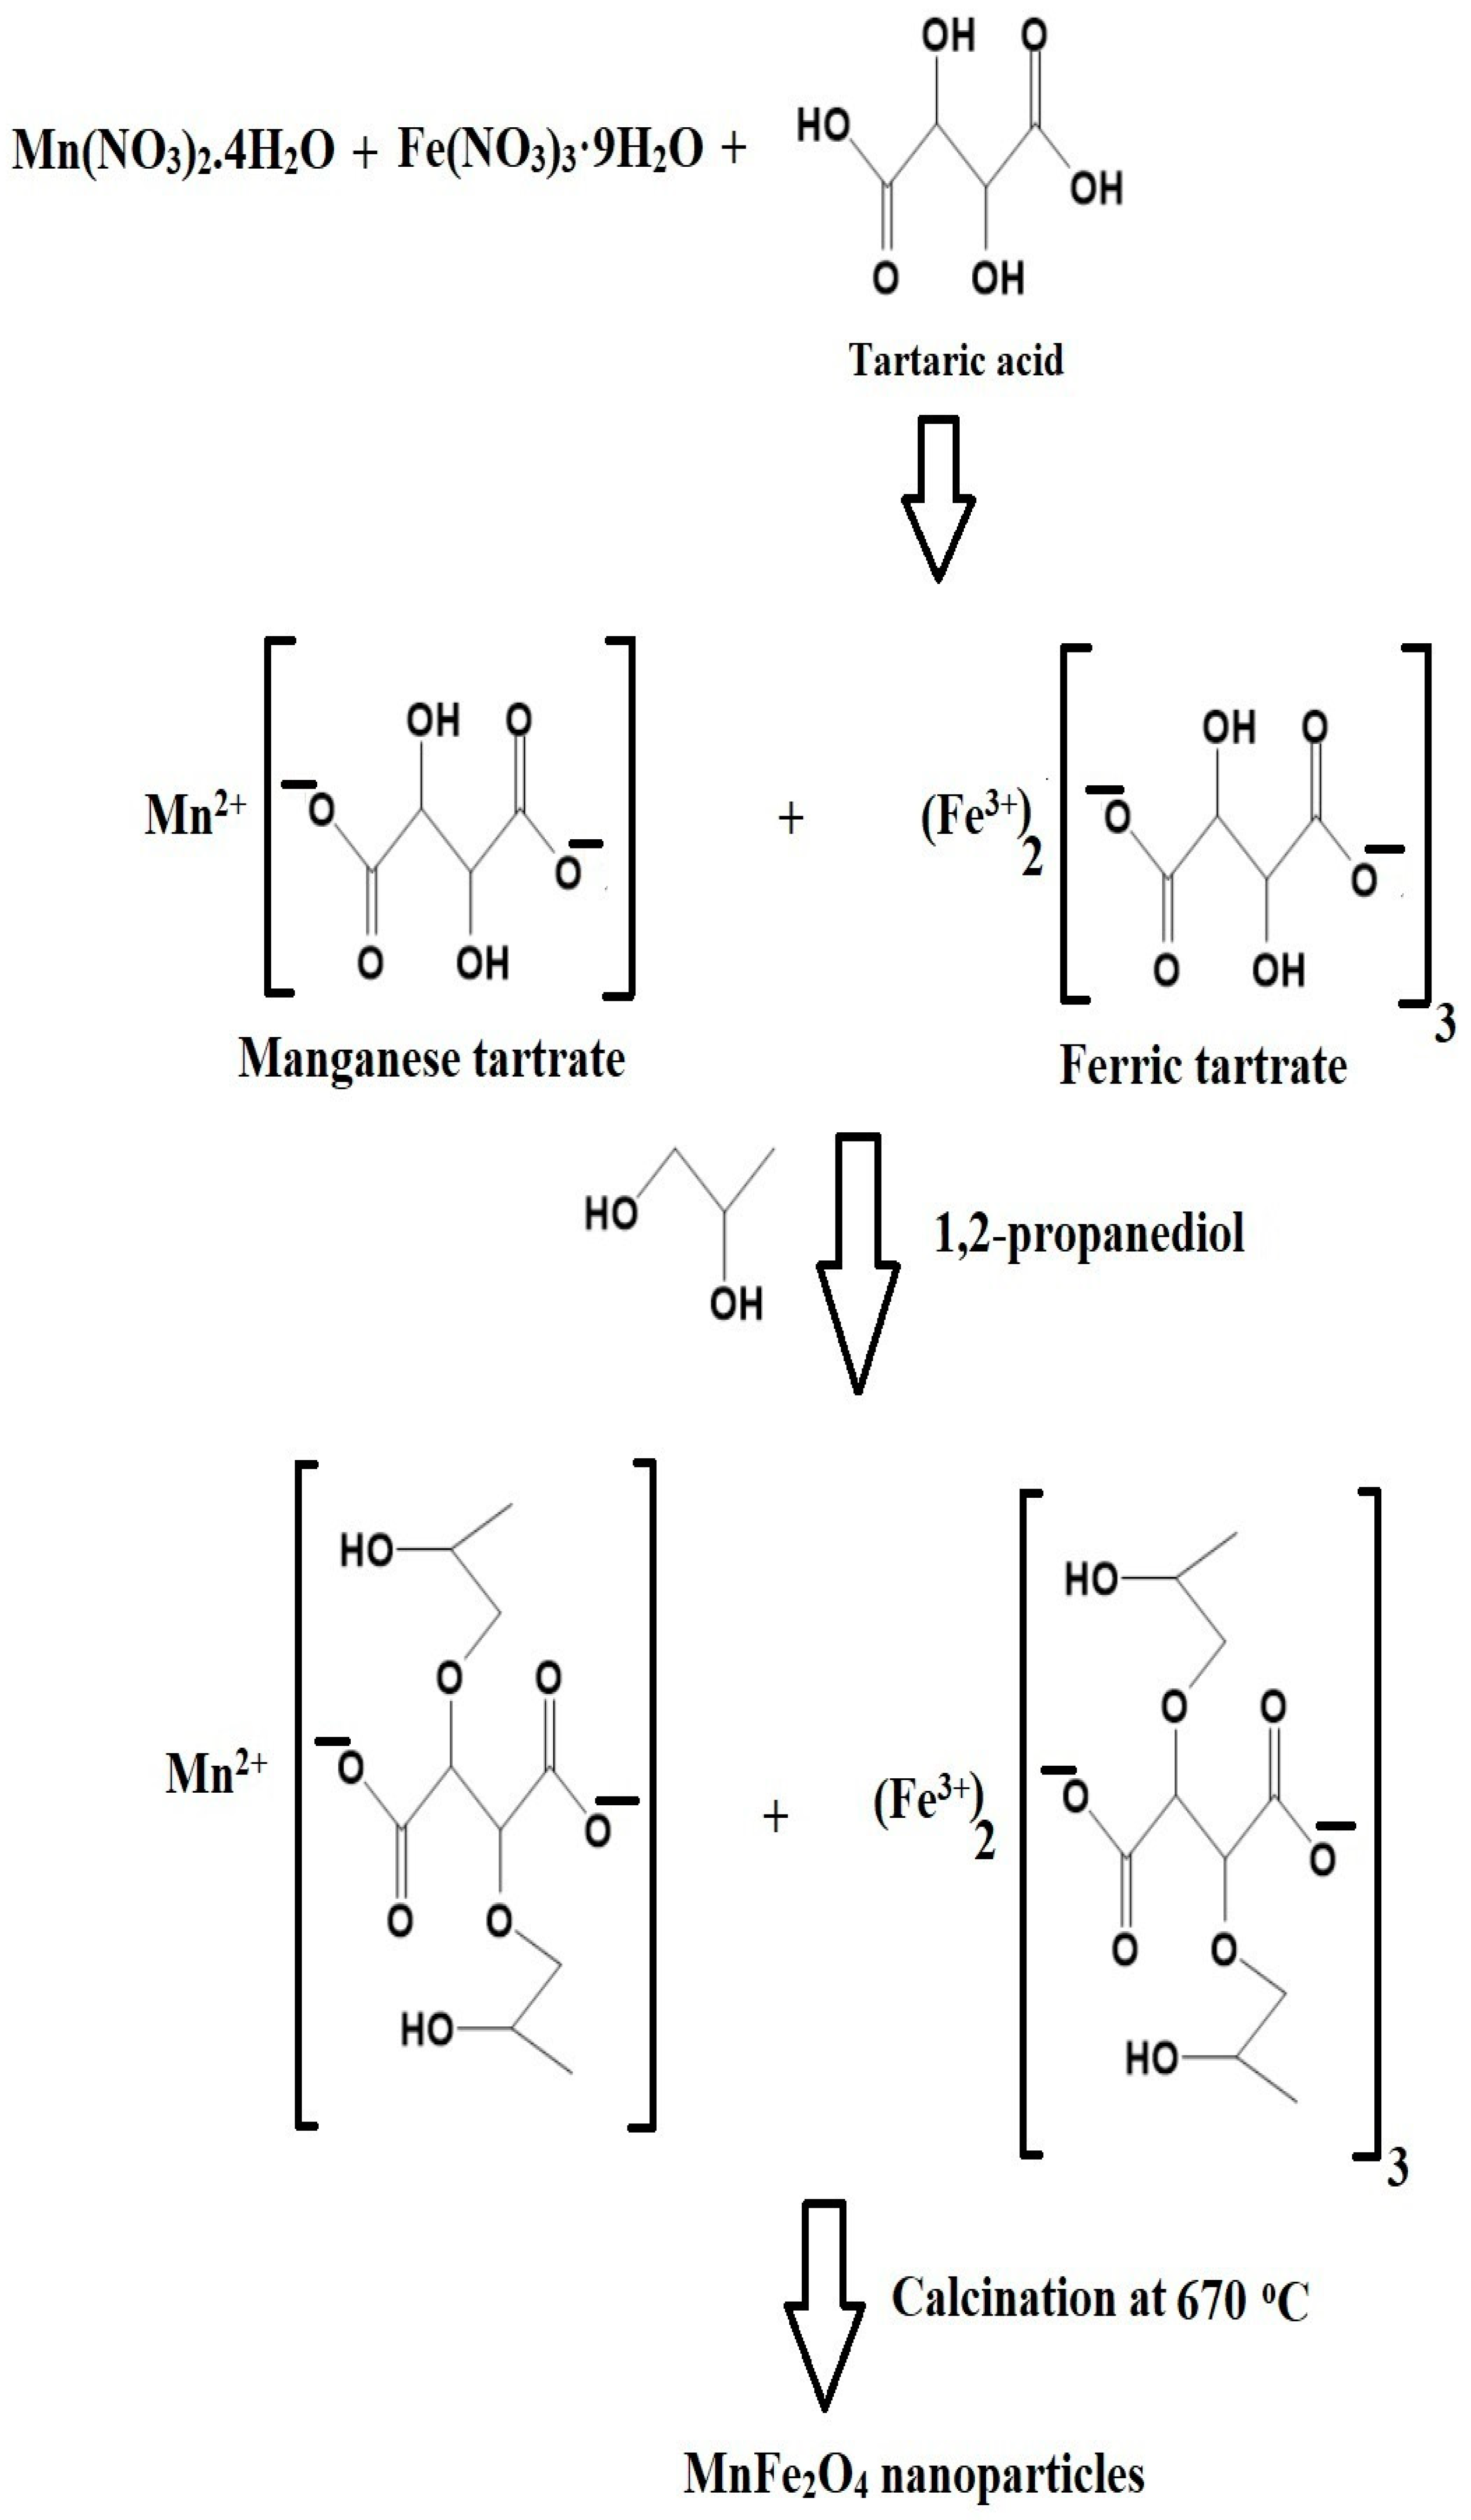
2.2. Synthesis of MnFe2O4 Nanoparticles

The manganese ferrite nanoparticles were synthesized by the pechini sol–gel method as the following; 80 mL of manganese aqueous solution, which contains 3.65 g of Mn(NO3)2·4H2O, was added to 80 mL of iron aqueous solution, which contains 11.75 g of Fe(NO3)3·9H2O. After that, 80 mL of chelating agent aqueous solution, which contains 5.09 g of tartaric acid, was added then the resulting mixture was continuously stirred for 10 min at room temperature. Additionally, 10 mL of 1,2-propanediol crosslinker was added then the resulting mixture was continuously stirred at 140 °C so that complete evaporation occurred. Finally, the remaining powder was calcinated at 670 °C for 3 h to produce manganese ferrite nanoparticles.

2.3. Characterization

The nature of the synthesized manganese ferrite nanoparticles was examined using the D8 advance diffractometer (Billerica, MA, USA) and Cukα radiations with a wavelength (λ) of 1.5402 Å. Utilizing the Shimadzu spectrometer, Fourier transforms infrared spectrophotometer (Kyoto, Japan) was applied to investigate the functional groups of manganese ferrite nanoparticles. The surface morphology and composition of the manganese ferrite nanoparticles were examined using scanning electron microscopy (SEM, FEI Nova Nano SEM450 instrument, Waltham, MA, USA) attached to energy-dispersive X-ray analysis (EDS). The morphology of the manganese ferrite nanoparticles was examined using transmission electron microscopy (TEM, JEOL JEM 2100F instrument, Akishima, Tokyo, Japan). The BET surface area of the manganese ferrite nanoparticles was determined using an N2 gas sorption analyzer (Quantachrome, Model: TouchWin, Graz, Austria).

2.4. Adsorption of Safranine T Dye from Aqueous Solutions

An amount of 50 mg of synthesized nanoadsorbent (manganese ferrite nanoparticles) was added to 100 mL of safranine T dye solution to study several factors such as pH, time, temperature, and concentration, according to the experimental conditions in Table 1. Afterward, the adsorbent was separated with a magnet, and the remaining safranine T dye concentration in the filtrate was measured at 530 nm using a Shimadzu 1800 series UV-Vis spectrophotometer (Kyoto, Japan).
The removal efficiency (% R) and the amount of safranine T dye removed by the manganese ferrite nanoparticles were calculated applying Equations (1) and (2), respectively [23,25].
%   R = C o C e C o × 100
Q = ( C o C e ) × V M
Co corresponds to the initial concentration of safranine T dye (mg/L), whereas Ce corresponds to the equilibrium concentration of safranine T dye (mg/L). M corresponds to the weight of the manganese ferrite nanoparticles (g), whereas V corresponds to the volume of the safranine T dye solution (L).
The point zero charge (pHpzc) of manganese ferrite nanoparticles was estimated through the solid addition procedure by adding 0.50 g of the manganese ferrite nanoparticles in 50 mL of 0.015 M of KCl solutions in several tightly sealed conical flasks. After that, the pH value is altered between 2.5 and 11.5 using 0.1 M HCl or NaOH and kept under stirring for 6 h at room temperature. The final pH (pHf) was determined and plotted against the initial pH (pHi). The pHpzc of manganese ferrite nanoparticles was determined as the pHf value at which a unique level was observed [23,25].

3. Results and Discussion

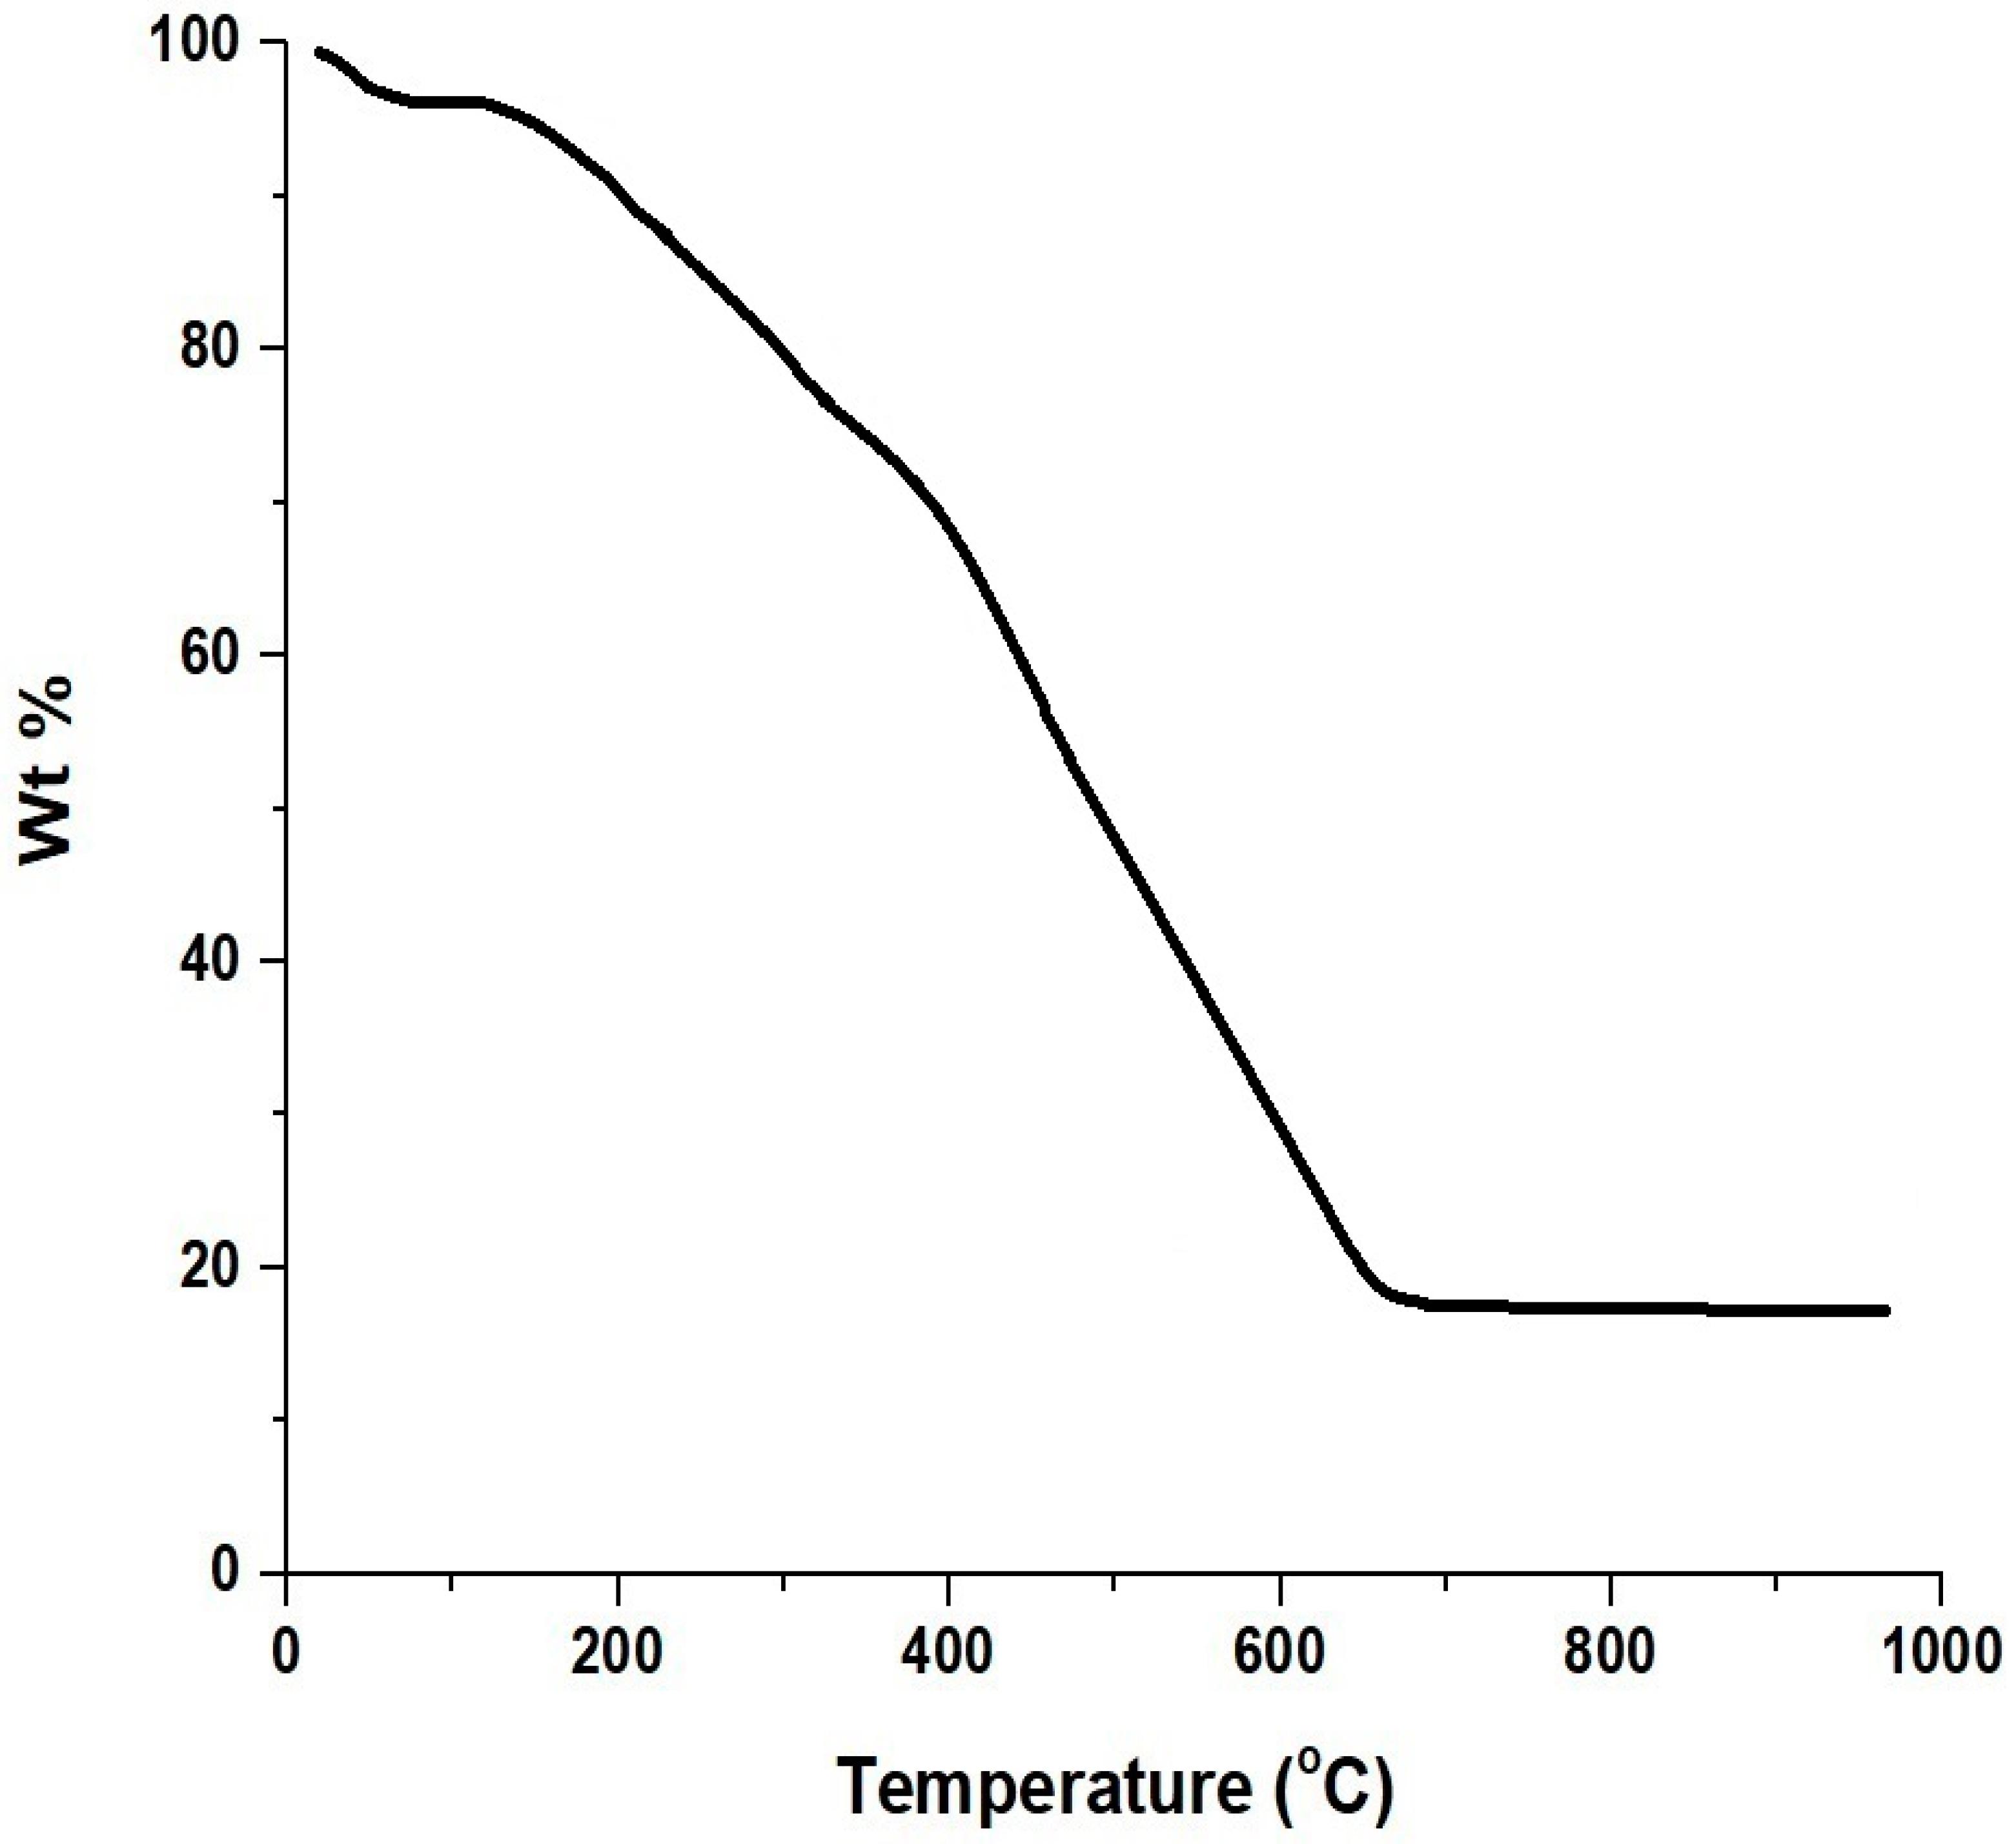
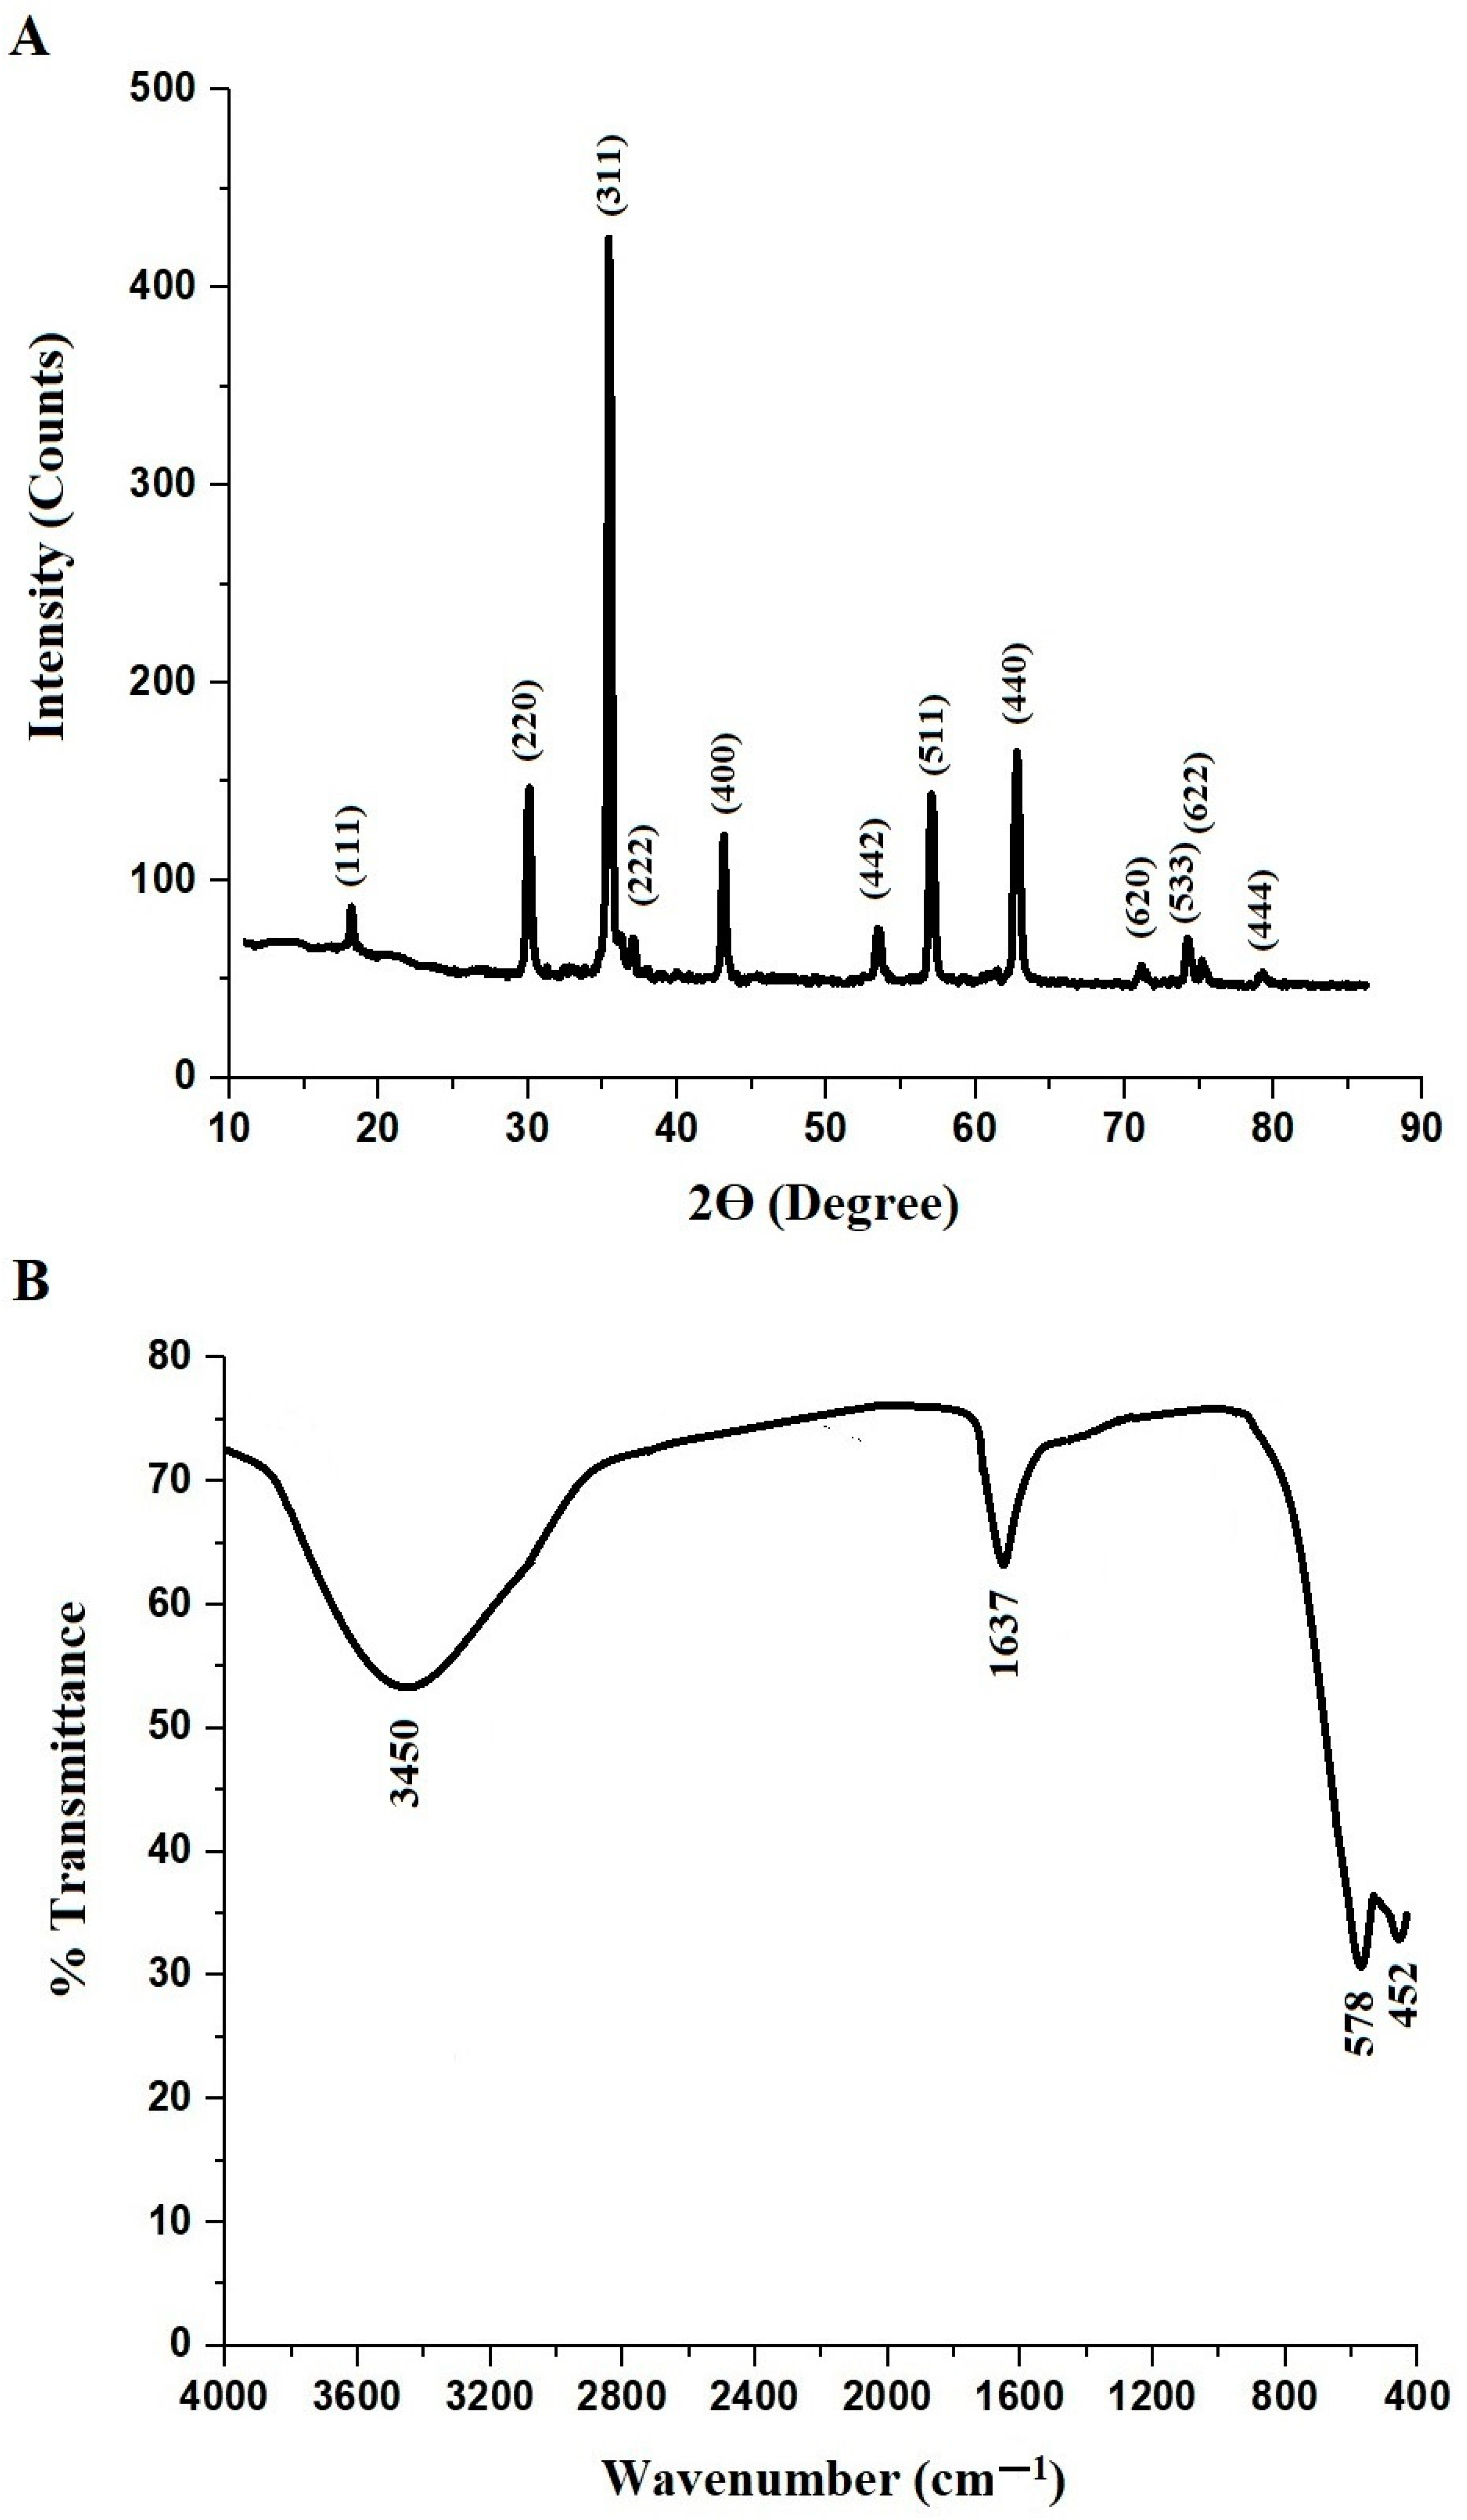
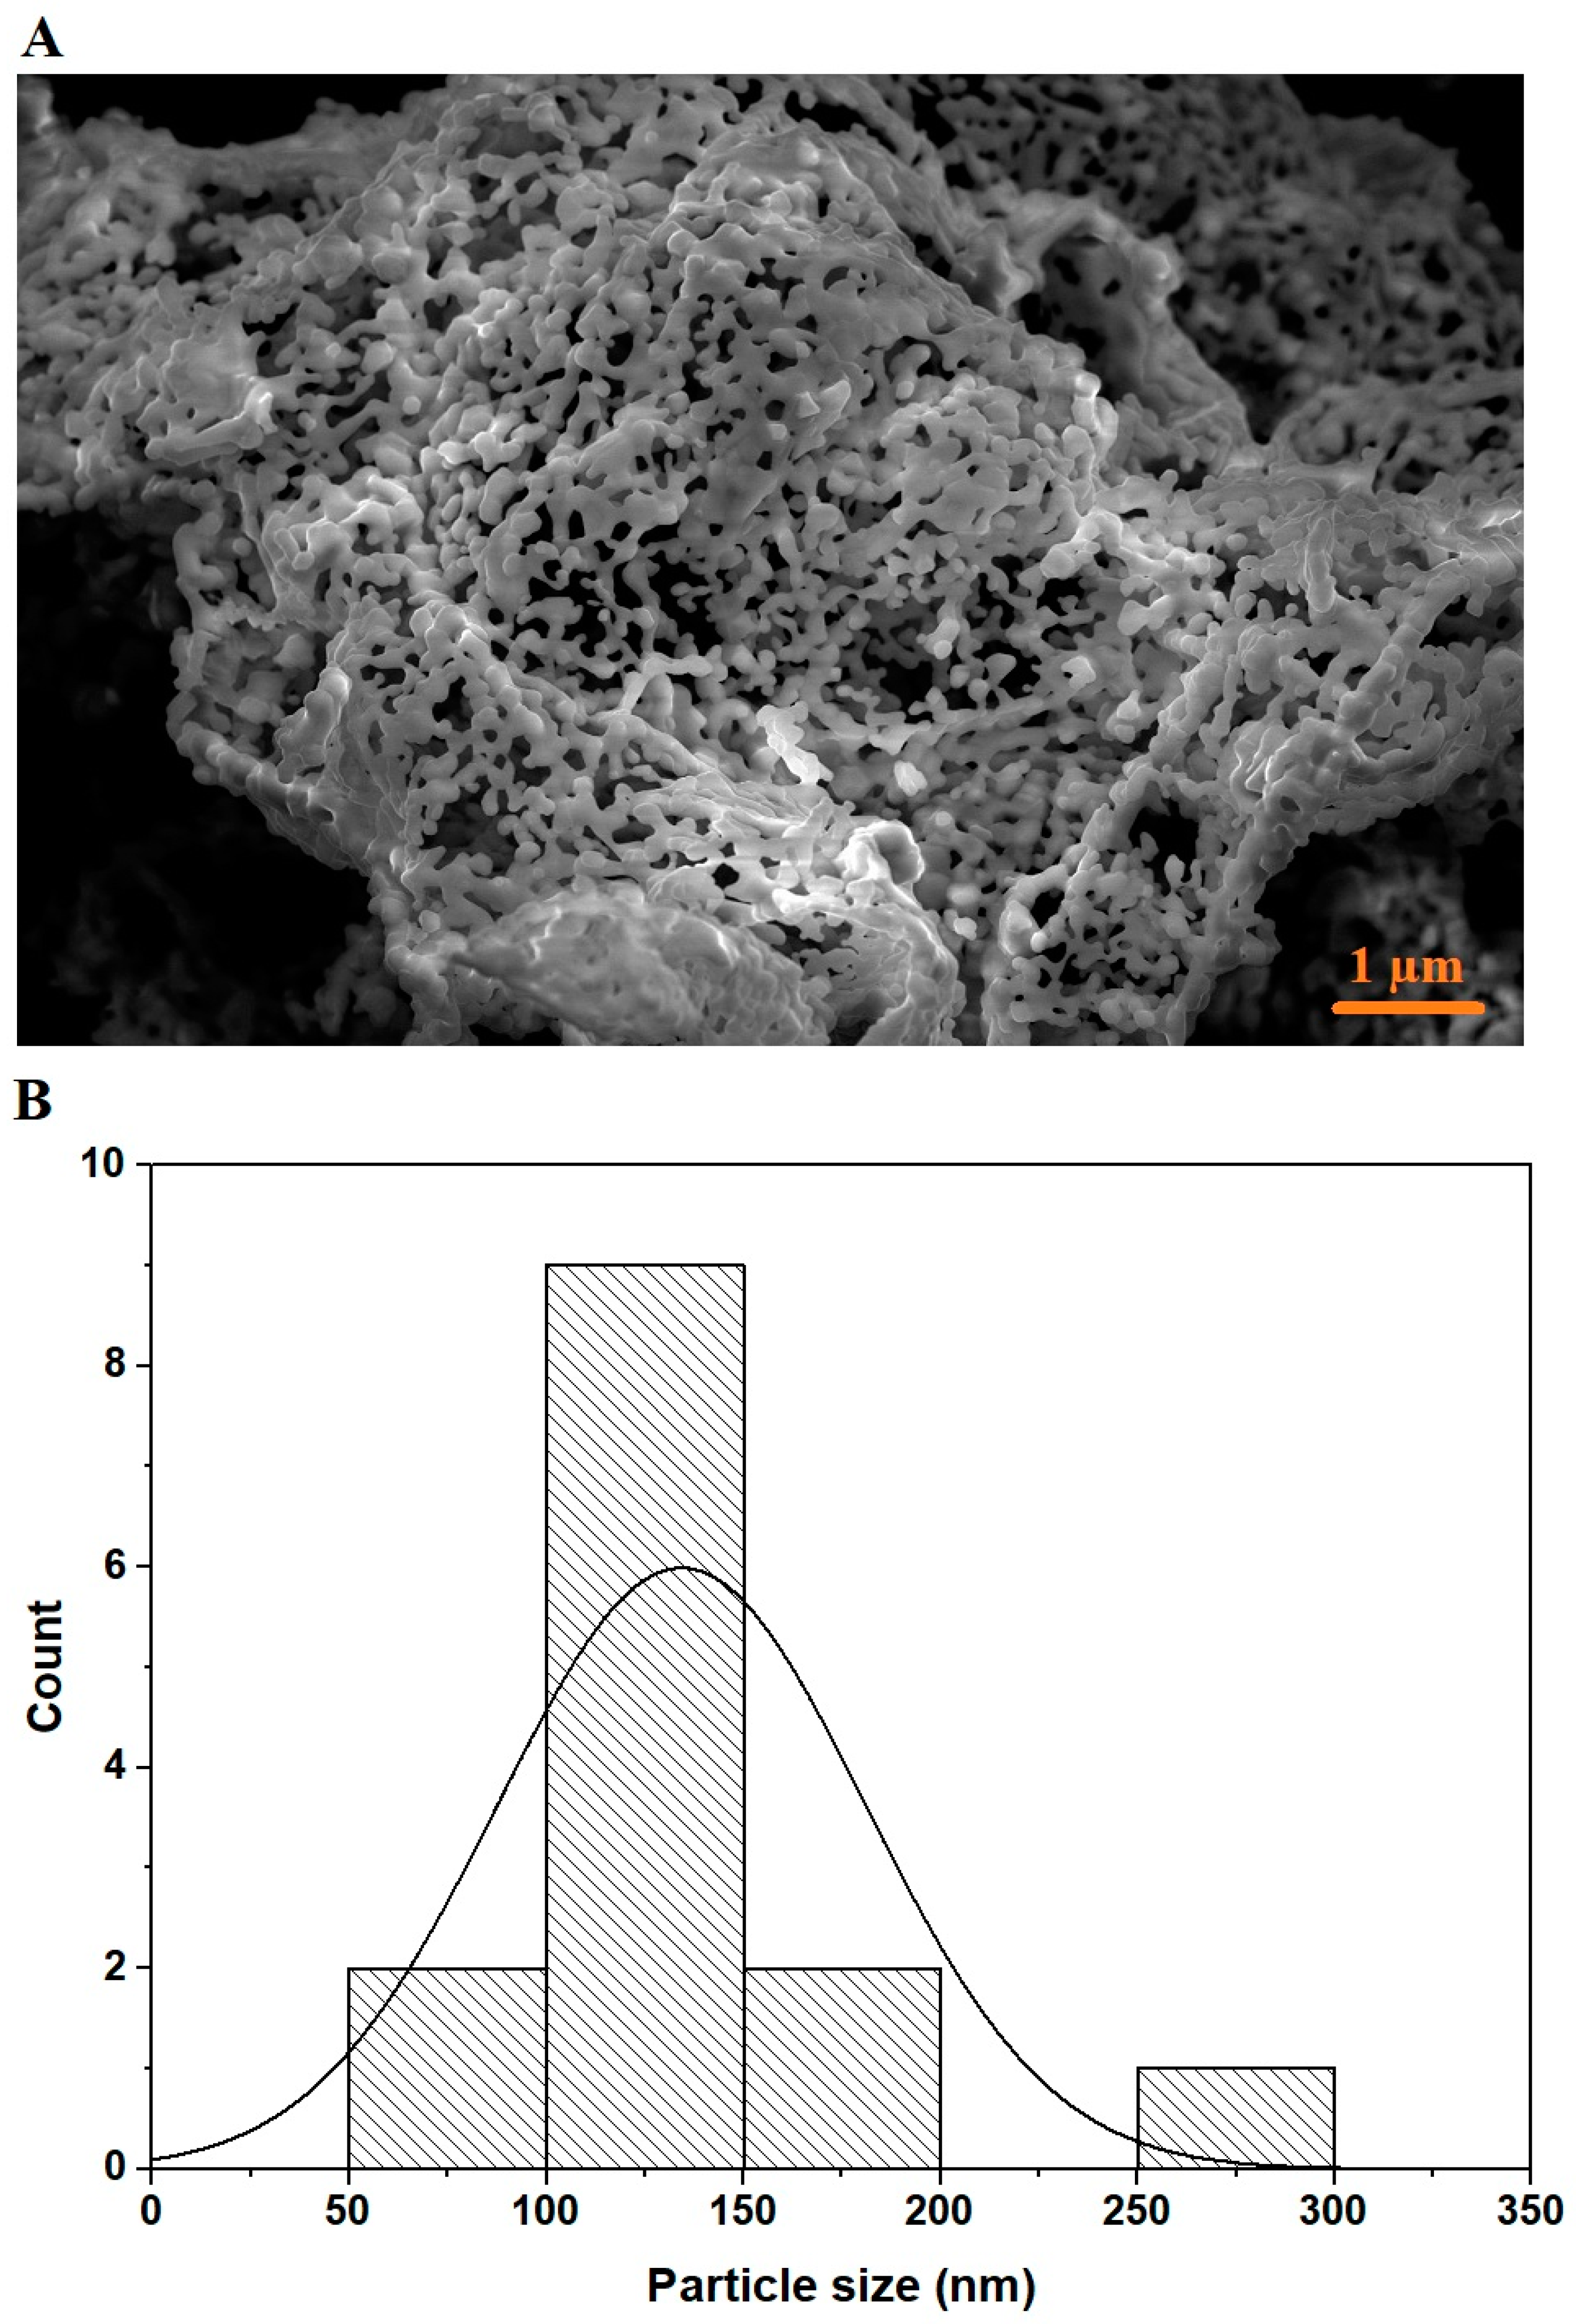
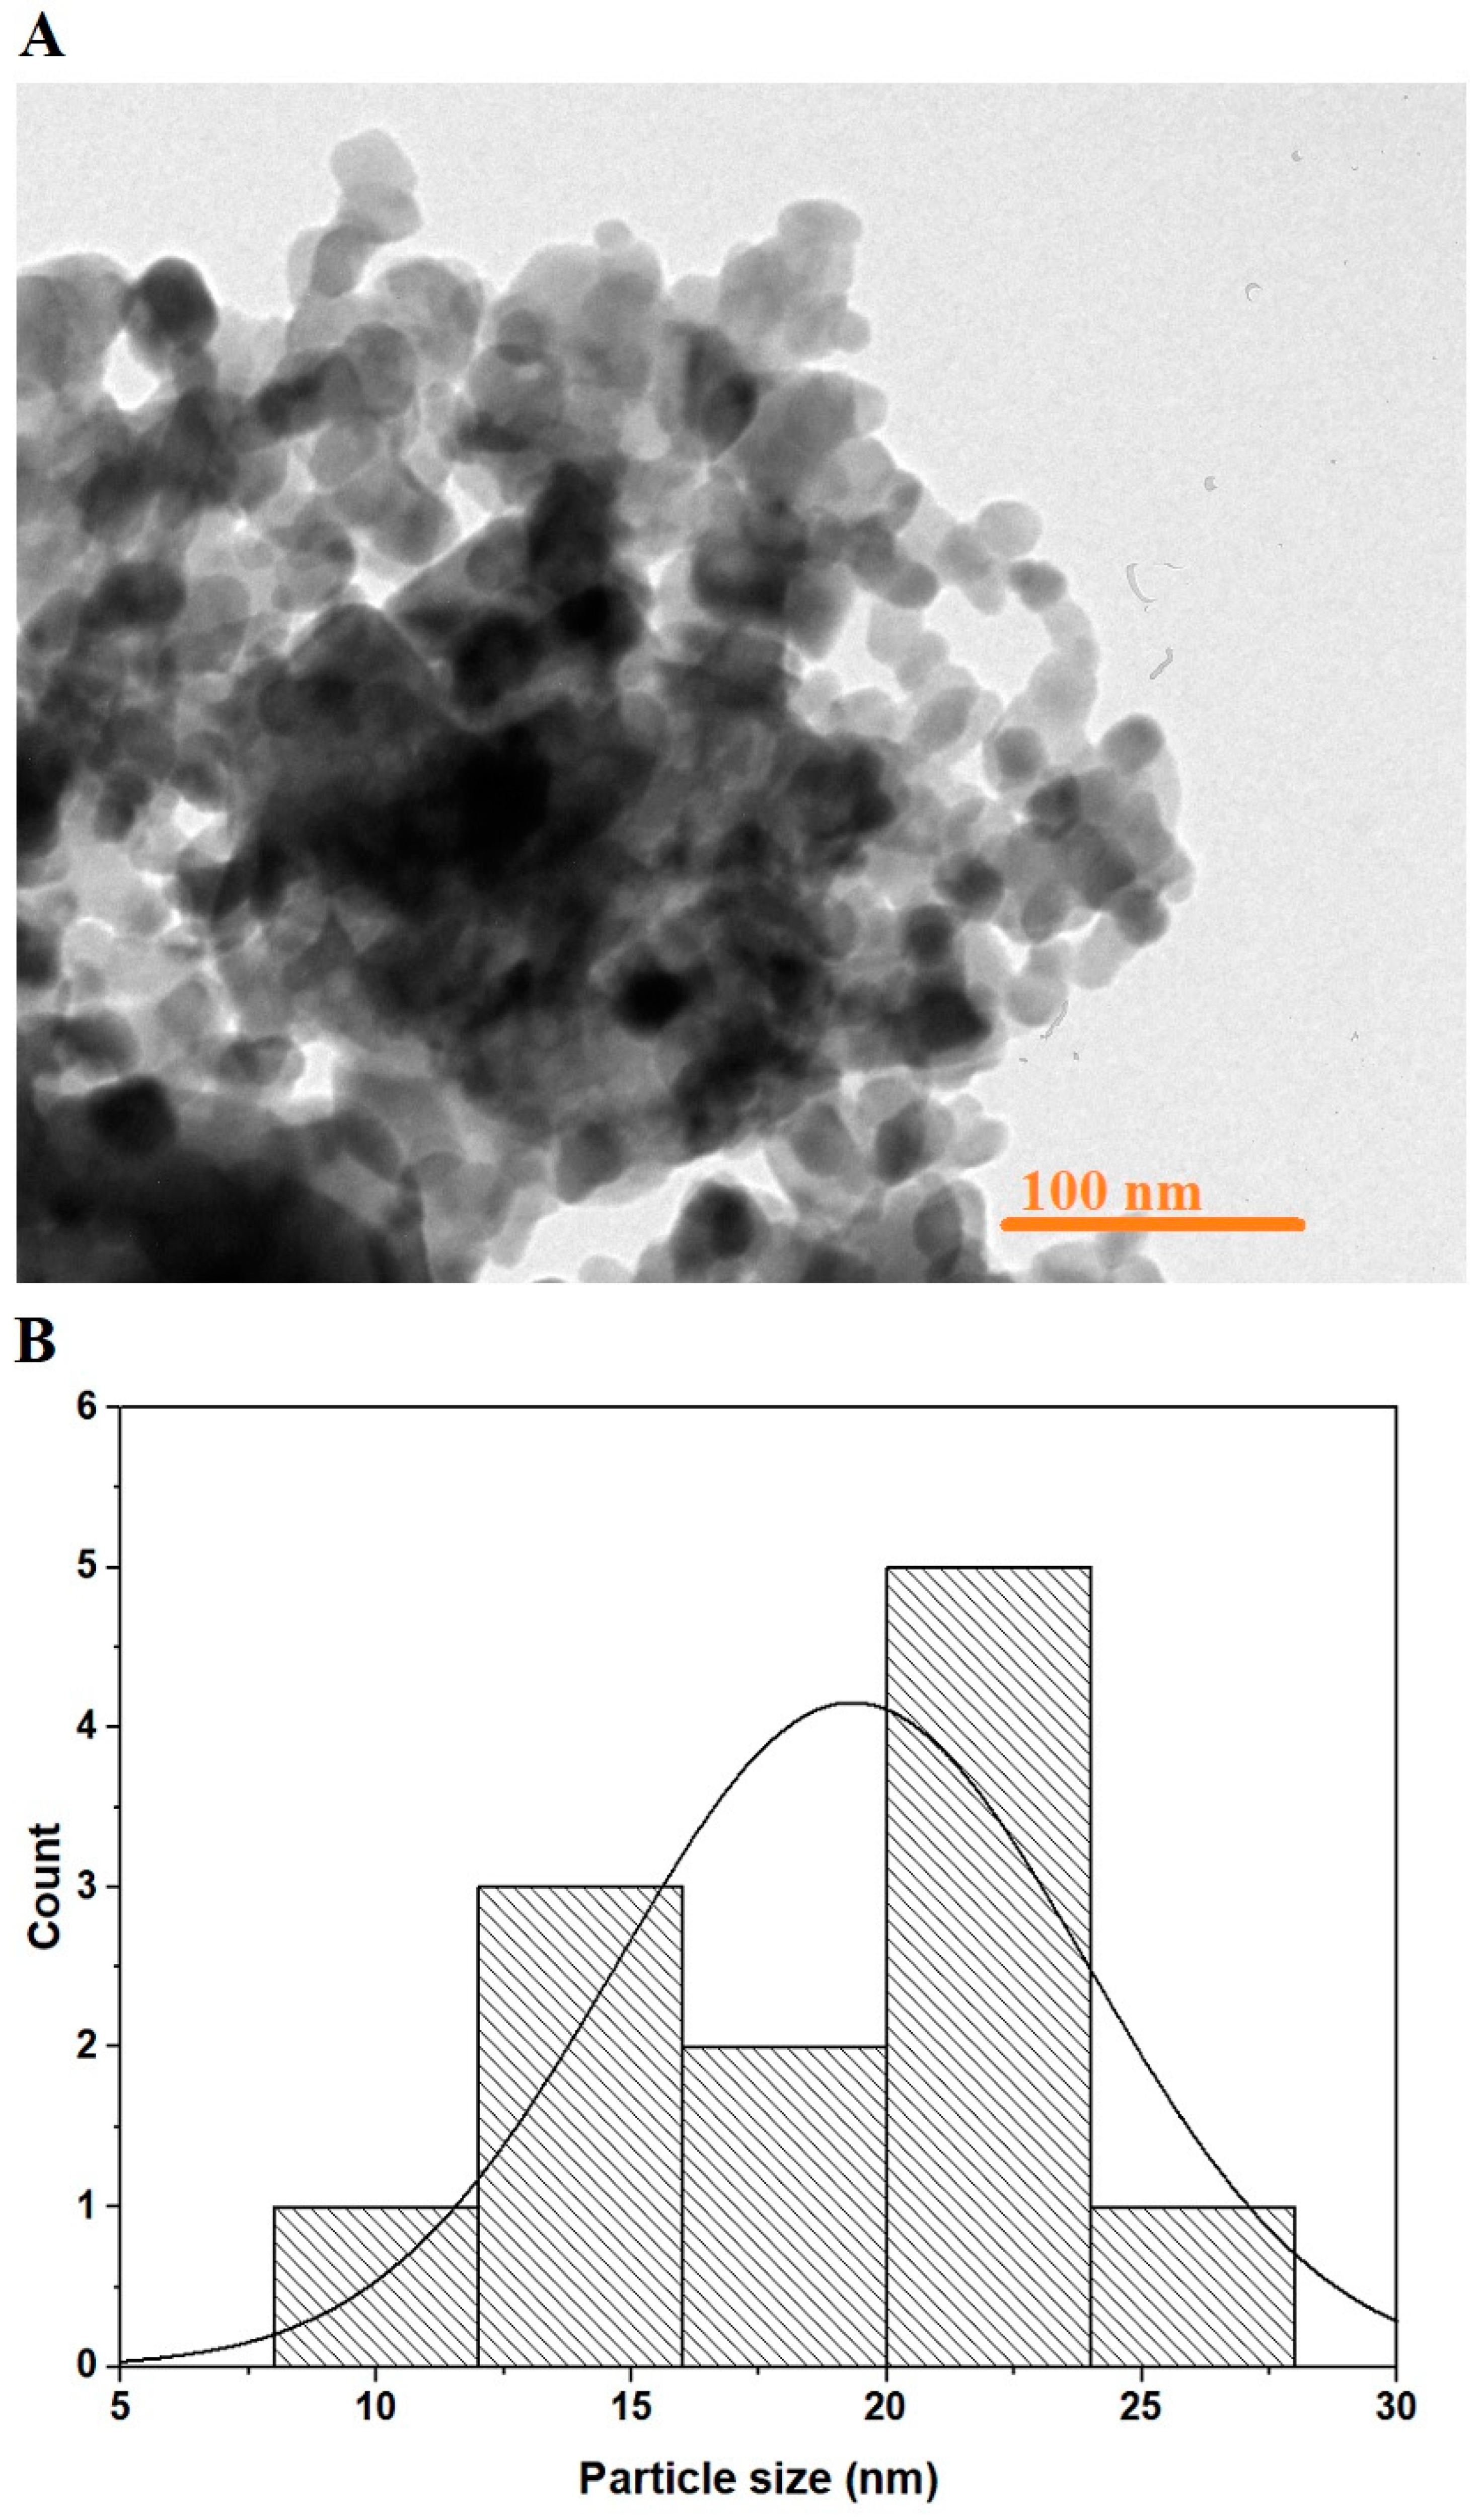
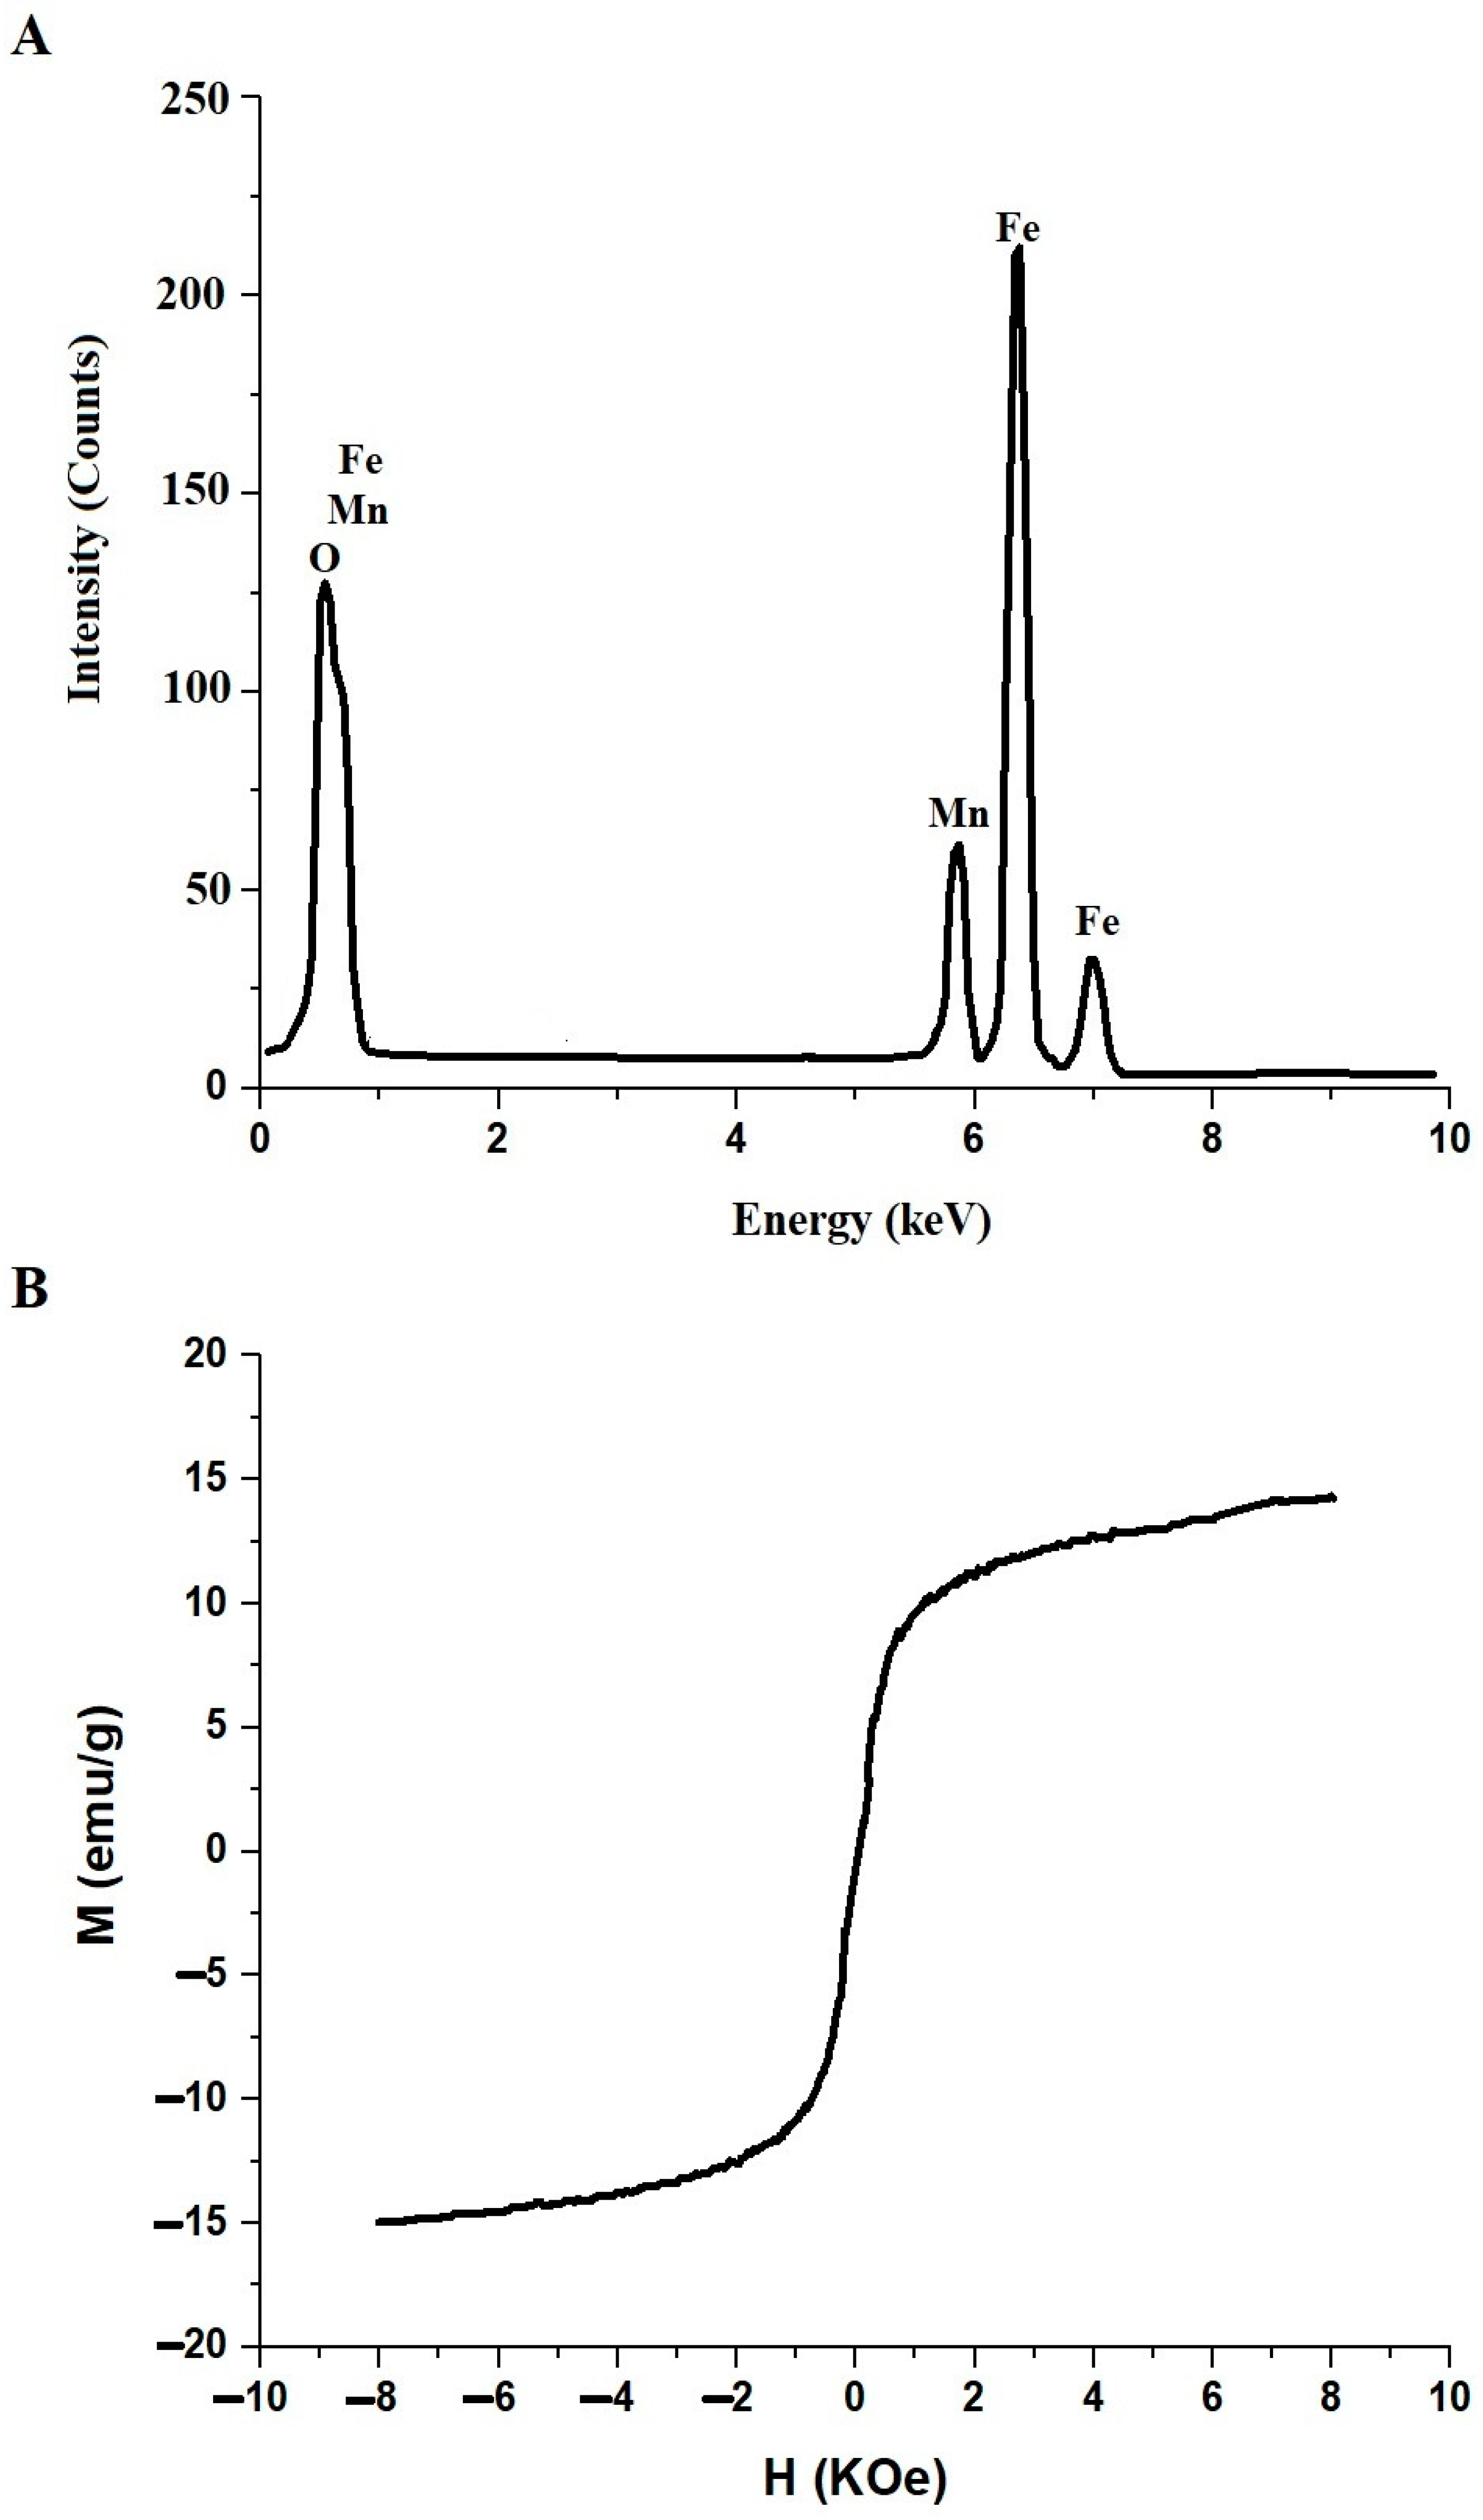
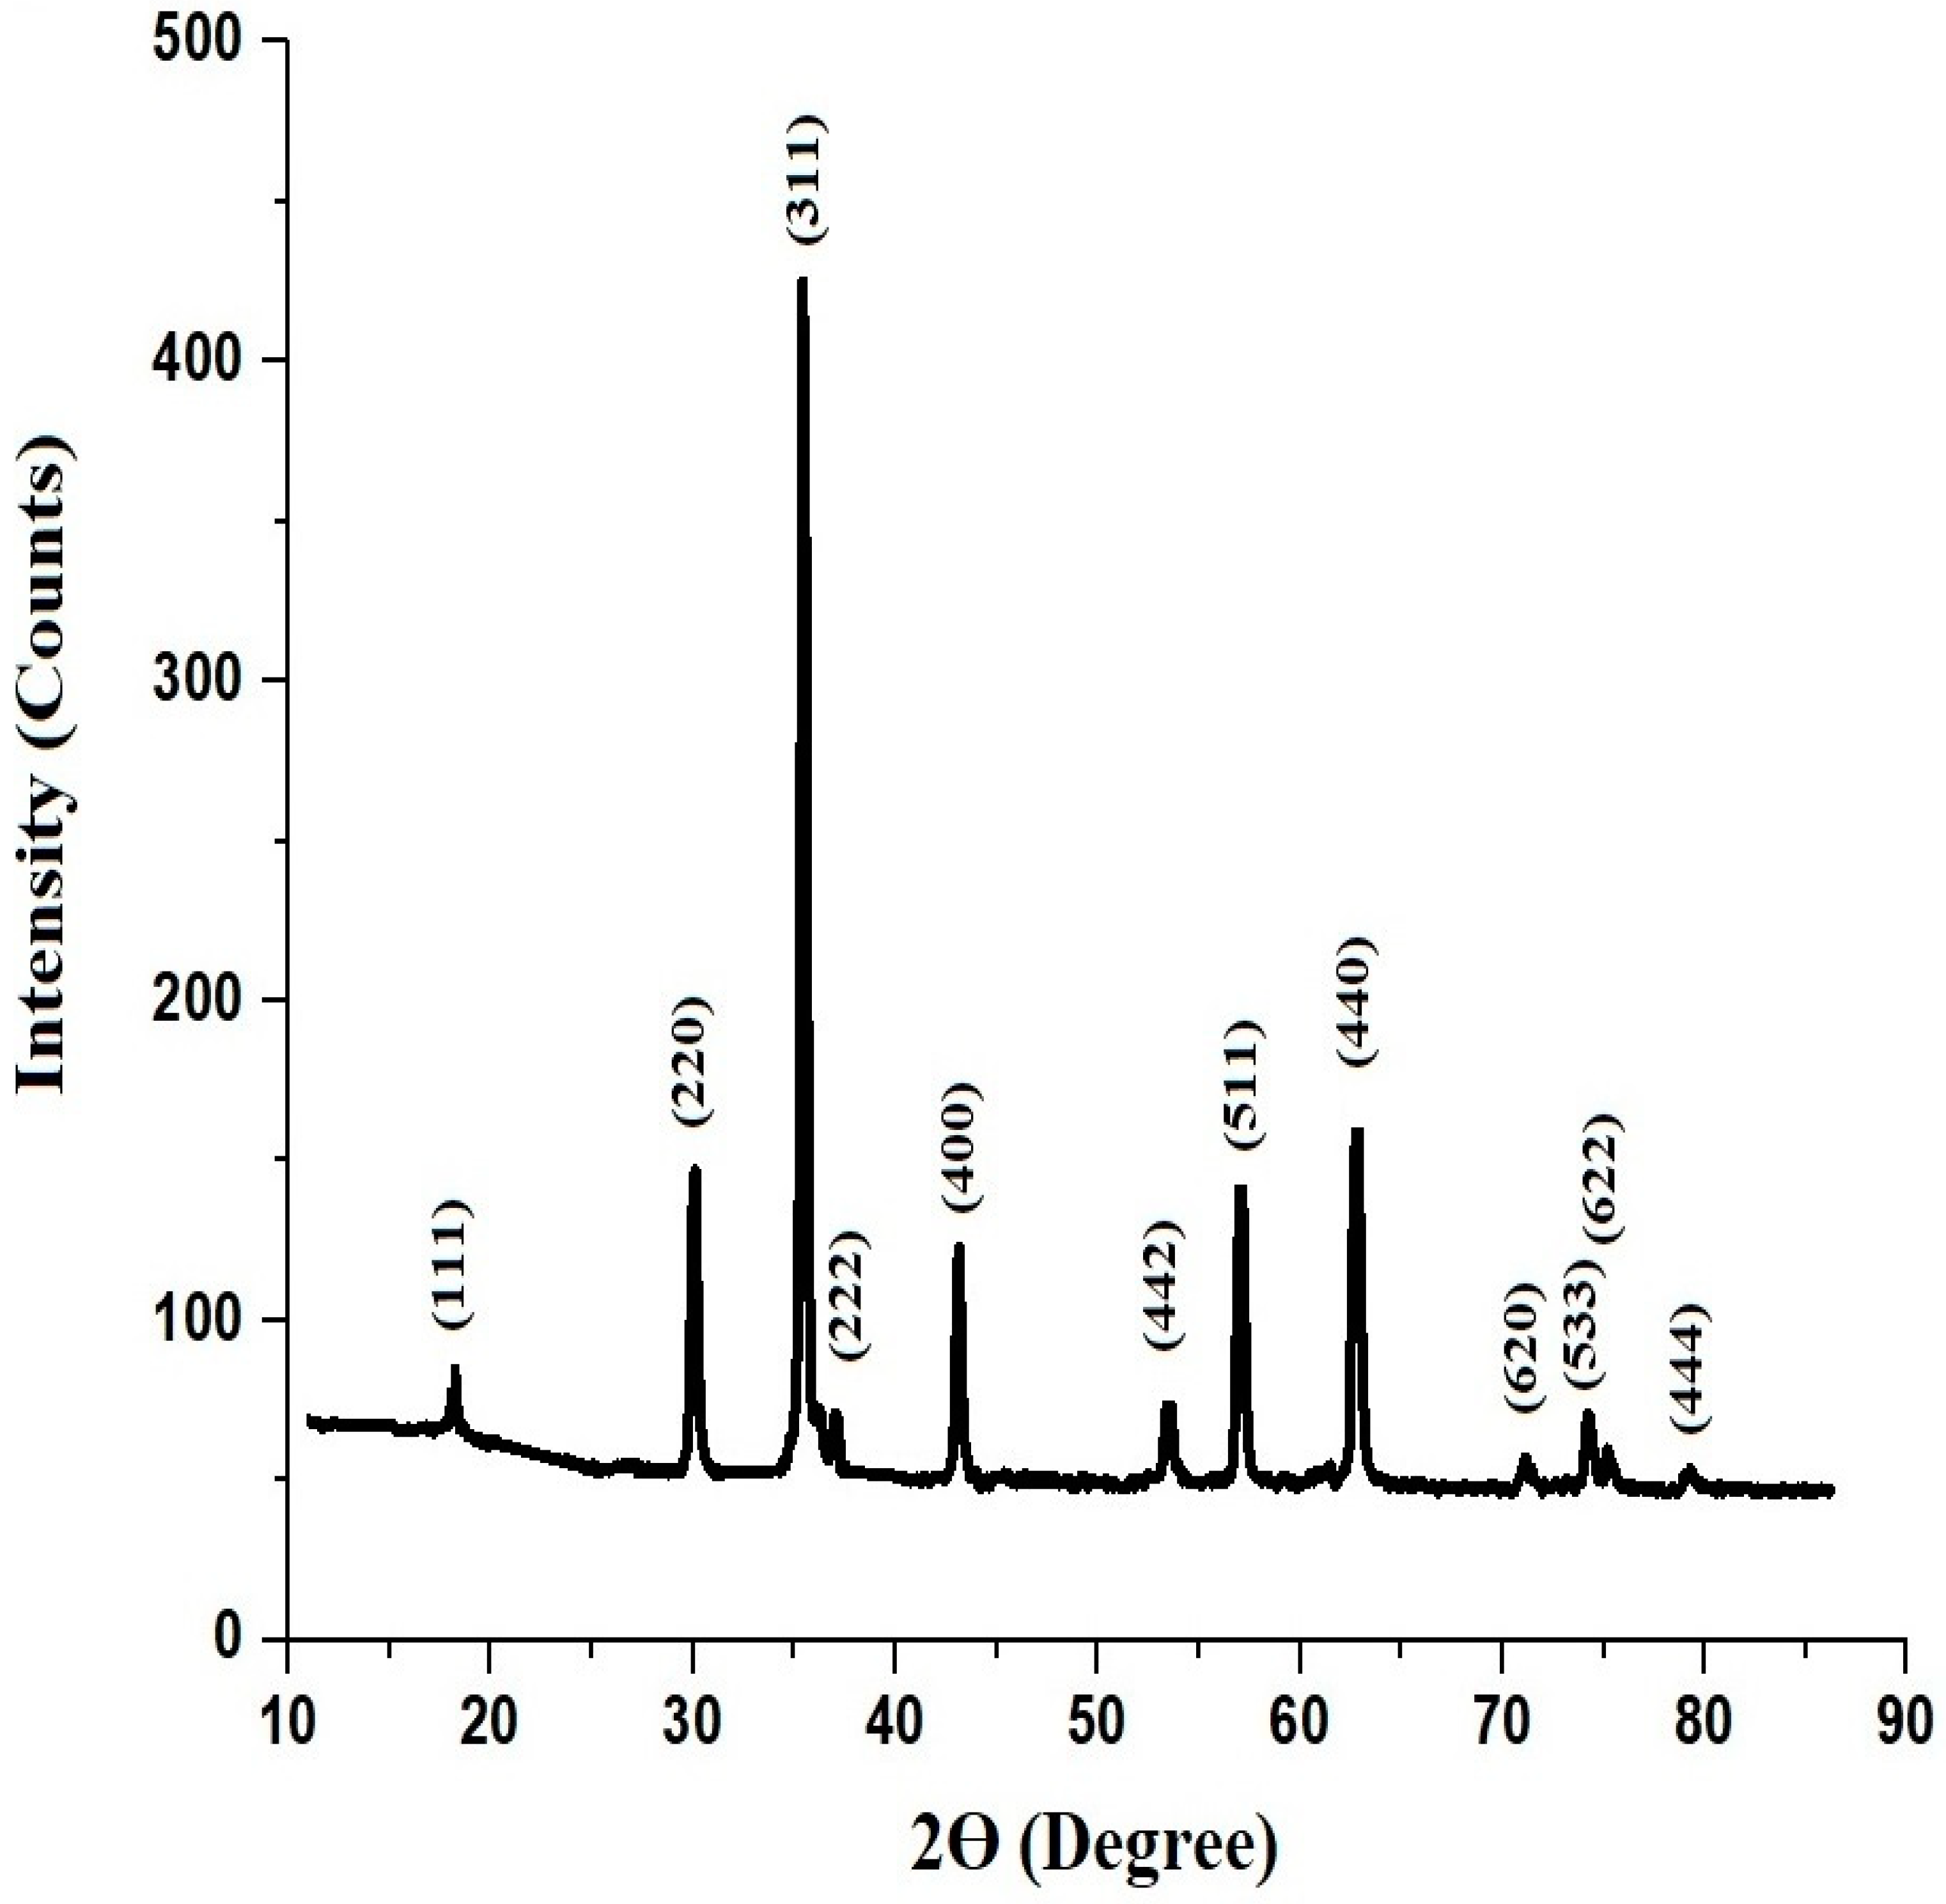
3.1. Synthesis and Characterization of MnFe2O4 Nanoparticles

In the pechini sol–gel method, to obtain pure MnFe2O4 nanoparticles without other phases, Fe(III) and Mn(II) ions (molar ratio of Mn(II)/Fe(III) = 1/2) react with tartaric acid (molar ratio of tartaric acid/Fe(III) = 3/2, whereas the molar ratio of tartaric acid/Mn(II) = 1/1), which acts as a chelating agent, to form ferric tartrate and manganese tartrate chelates, as shown in Scheme 1. Next, the resulting chelates react with 1,2-propanediol, which acts as a crosslinker, to form large networks that burn at 670 to give MnFe2O4 nanoparticles, as shown in Scheme 1. It is worth noting that thermal examination of the formed powder prior to calcination showed that 670 °C is the ideal temperature at which MnFe2O4 nanoparticles with small crystal size are formed, as shown in Figure 1.
Figure 2A illustrates the XRD spectrum of MnFe2O4 nanoparticles, showcasing distinct diffraction peaks located at specific 2Ɵ values of 18.17°, 30.03°, 35.49°, 37.07°, 43.16°, 53.54°, 57.11°, 62.87°, 71.27°, 74.22°, 75.15°, and 79.26°. These peaks match the crystal planes (111), (220), (311), (222), (400), (442), (511), (440), (620), (533), (622), and (444), respectively. The identification aligns with data from JCPDS database No. 38-0430 [34]. Additionally, the Debye-Scherrer formula estimated the average crystal size to be approximately 18.89 nm. The crystal system, lattice constant, and space group of synthesized MnFe2O4 nanoparticles are cubic, 0.844 nm, and Fd3m, respectively.
The FT-IR spectrum of MnFe2O4 nanoparticles is displayed in Figure 2B. The spectrum exhibits two main absorption bands under 1000 cm−1, a common feature of metal ferrites. The absorption peaks at 578 and 452 cm−1 may be attributed to the Mn–O and Fe–O stretching vibrations of MnFe2O4 nanoparticles, respectively. The bands at 3450 and 1637 cm−1 may be ascribed to the stretching and bending vibrations of hydroxyl groups or O–H surface water molecules, respectively [34].
The surface morphology and average grain size of the MnFe2O4 nanoparticles were indicated by the SEM image and its histogram, as shown in Figure 3A,B, respectively. Consequently, semi-spherical particles with a mean grain size of 134.25 nm are clearly observed. Further, the morphology and average particle size of the MnFe2O4 nanoparticles were indicated by the TEM image and its histogram, as shown in Figure 4A,B, respectively. The shape of MnFe2O4 nanoparticles is semi-spherical, with an average particle size of 19.32 nm that coincides well with that measured from the XRD results.
The composition of the MnFe2O4 nanoparticles has been identified using the EDX technique, and the pattern produced is displayed in Figure 5A, which indicates the presence of Fe (49.12%), Mn (17.63%), and O (33.25%) peaks only. The magnetic properties of MnFe2O4 nanoparticles were recorded at room temperature using a vibrating sample magnetometer, and the hysteresis curve of the nanoparticles is shown in Figure 5B. The results showed that the saturation magnetization is 15.35 emu/g.

3.2. Safranine T Dye Removal from Aqueous Solutions

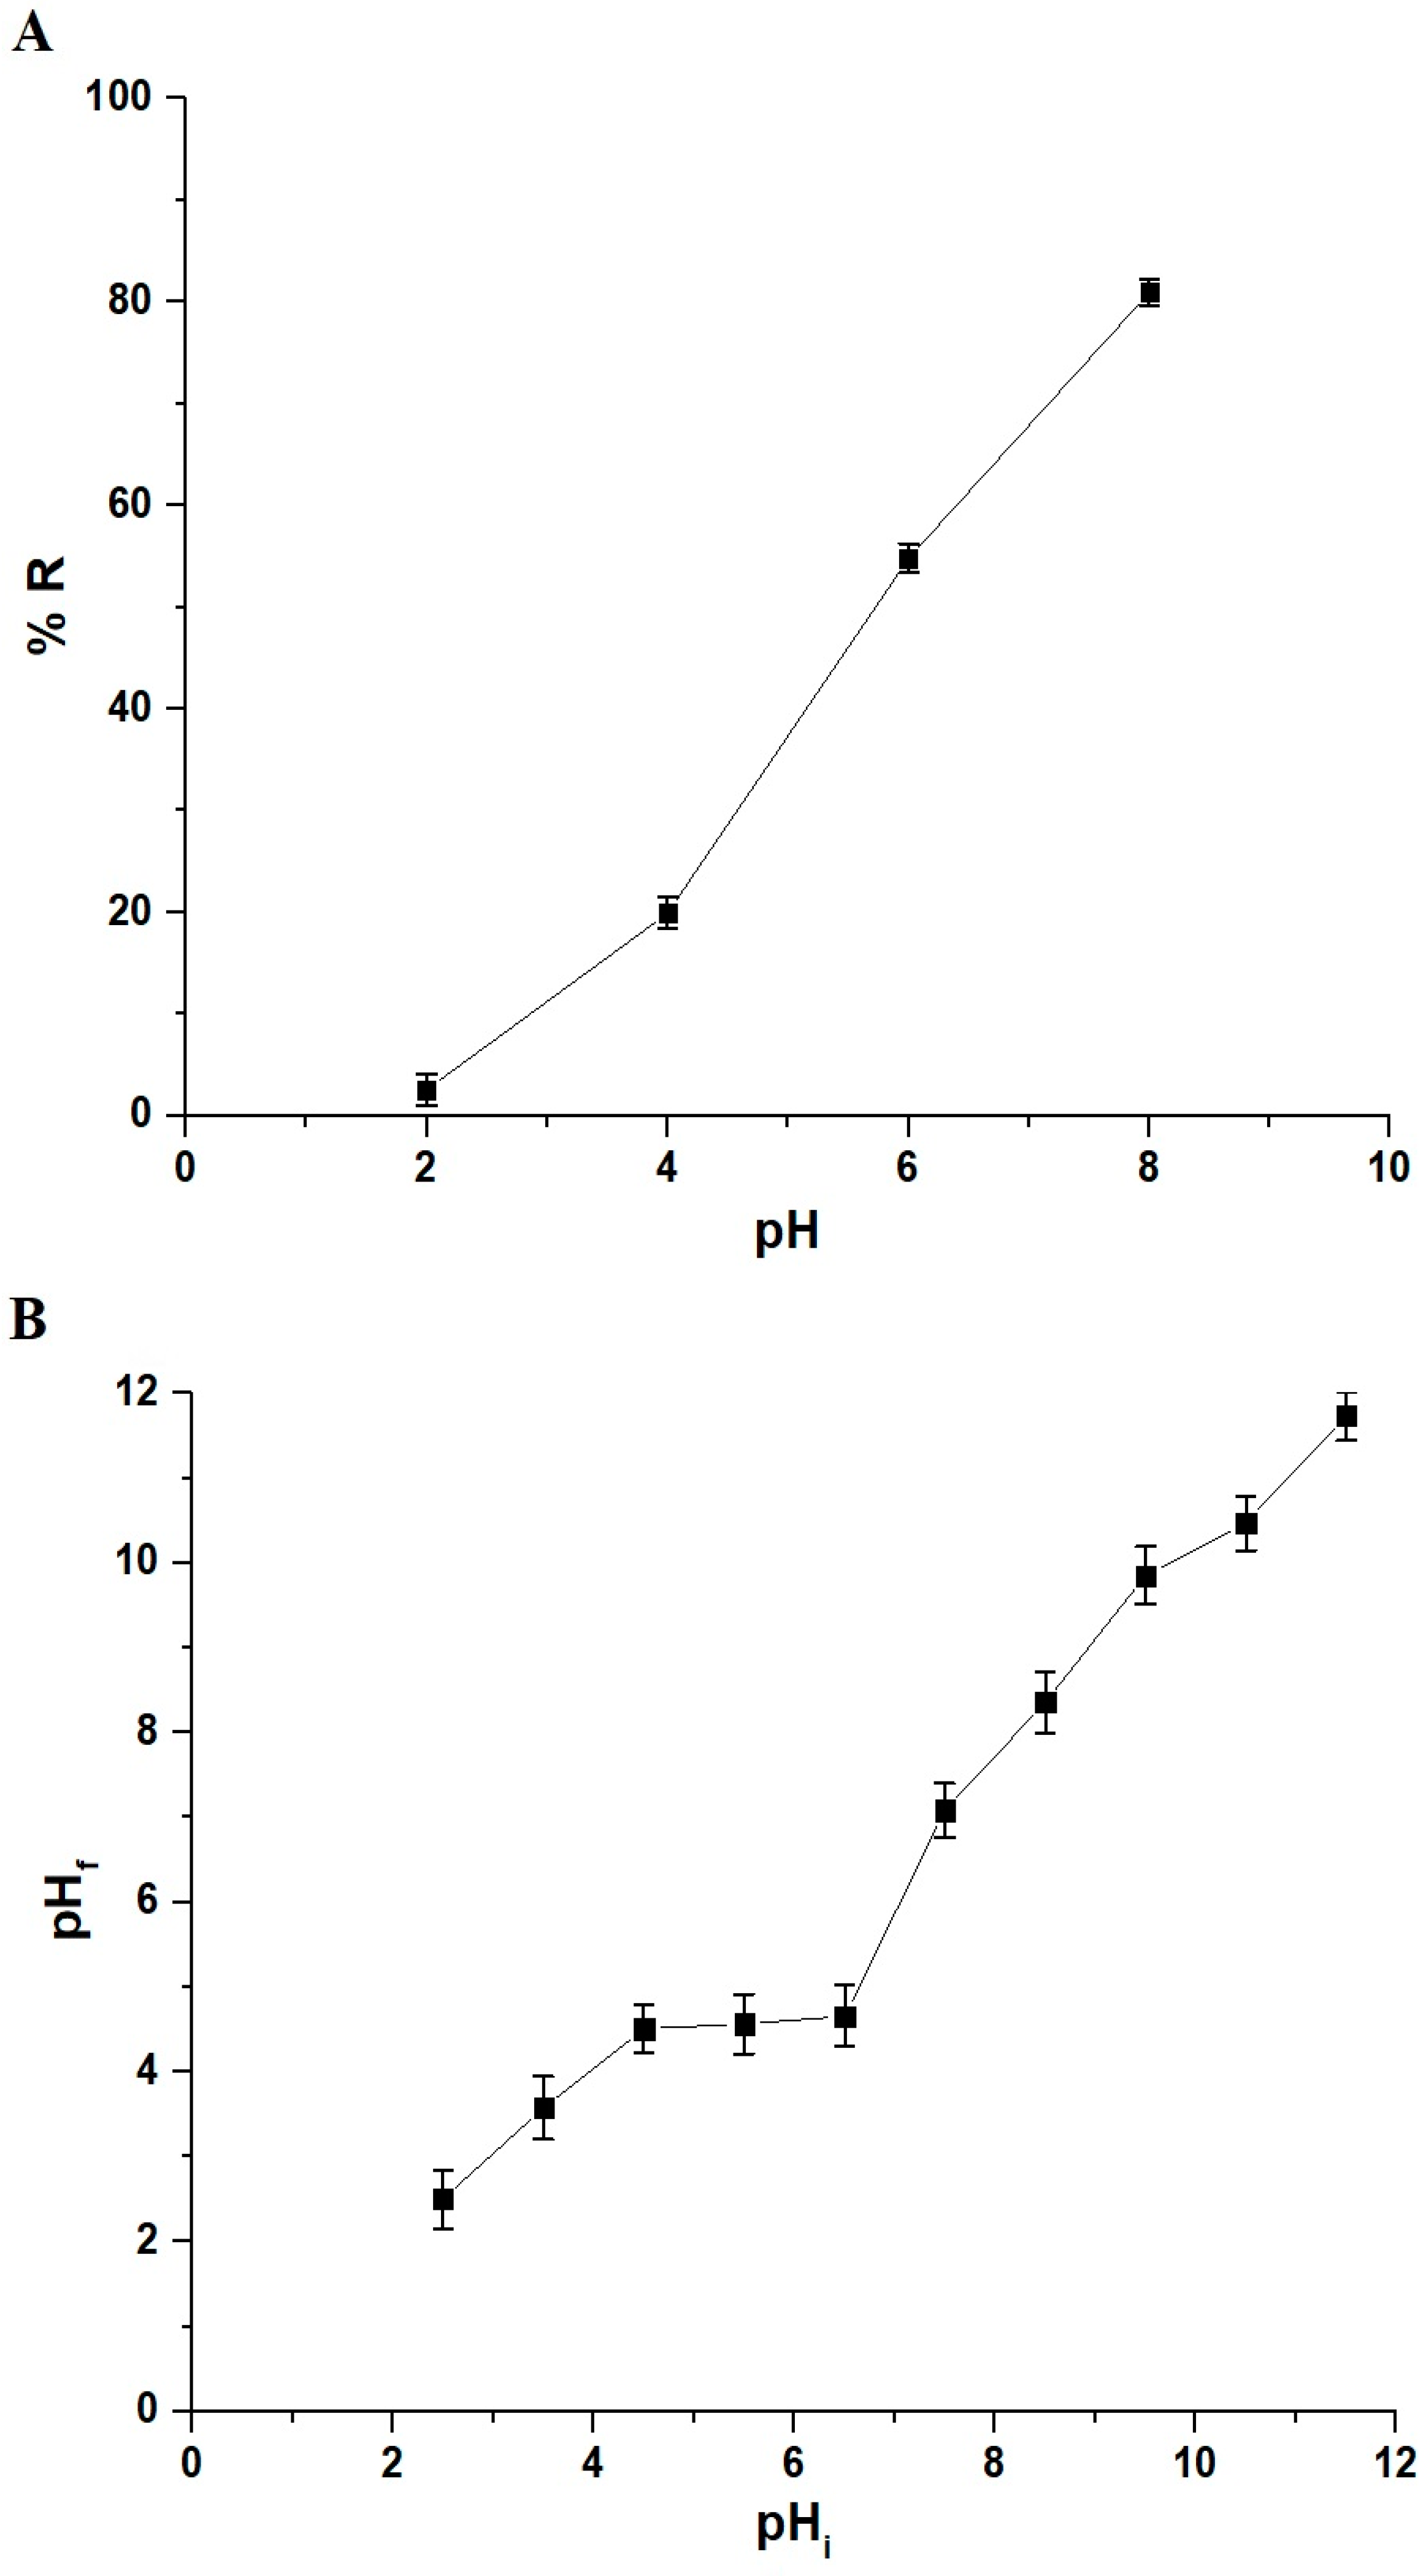
3.2.1. Influence of pH

Figure 6A demonstrates the influence of dye solution pH on the removal percentage (% R) of safranine T dye. The safranine T dye removal percentage experienced an upward trend with the rise in pH within the aqueous solution range from 2 to 8. Specifically, the removal percentage of safranine T dye showed an escalation from 2.58% at pH 2 to 80.94% at pH 8. This shift is attributed to the neutral charge of the manganese ferrite surface (pHpzc), which is determined to be 4.65, as depicted in Figure 6B. If the pH is below the pHpzc, the surface of manganese ferrite nanoparticles carries a positive charge, leading to electrostatic repulsion with the cationic safranine T dye. Conversely, at pH levels exceeding the pHpzc, the surface of manganese ferrite nanoparticles becomes negatively charged, fostering increased adsorption of positively charged safranine T dye species [23,25].
MnFe2O4 nanoparticles with a small crystalline size (18.89 nm) were formed at a calcination temperature of 670 °C, as shown in Figure 1. Raising the calcination temperature to 800 °C led to the formation of MnFe2O4 nanoparticles with a large crystal size (60.65 nm) (XRD figure omitted for brevity). Higher calcination temperatures can accelerate the rate of crystal growth, ensuring the formation of larger crystals. The BET surface areas of the MnFe2O4 nanoparticles, which were synthesized at 670 and 800 °C, are 135.68 and 65.72 m2/g, respectively. The removal percentages of safranine T dye using the MnFe2O4 nanoparticles, which were synthesized at 670 and 800 °C, at pH 8 are 80.94 and 40.26%, respectively. This can be explained based on the inverse relationship between the BET surface area and the removal percentage of safranine T dye. Hence, the sample calcinated at 670 °C was selected for adsorption study because it has a smaller crystalline size and a higher surface area, which makes it more effective in removing safranine T Dye from aqueous media. Small crystalline particles generally have a higher surface area compared to larger ones. Adsorption occurs at the surface of materials, and a larger surface area provides more sites for adsorption to take place. This means that more molecules of the adsorbate can interact with the material, leading to higher adsorption capacity.
Figure 3A displays the semi-spherical shapes of the MnFe2O4 nanoparticles before the adsorption process. After the adsorption of safranine T dye, as depicted in Figure 7A, obvious changes in the surface morphology of the MnFe2O4 nanoparticles were noticed in the SEM image. The adsorbate, referring to the material that endured adsorption, was attached to the surface of the adsorbent, displaying itself as a deposit or coating. To confirm the adsorption of safranine T dye by the produced adsorbent, FT-IR analysis was carried out after the adsorption of safranine T dye, as demonstrated in Figure 7B. The new band at 1591 cm−1 is due to the stretching vibration of C=C aromatic of safranine T dye. In addition, the new bands located at 2901 and 3106 cm−1 are due to the stretching vibrations of the aliphatic and aromatic CH of safranine T dye, respectively. In addition, the presence of multiple new bands in the region 690–850 cm−1 is due to aromatic CH out of plane bending vibration.

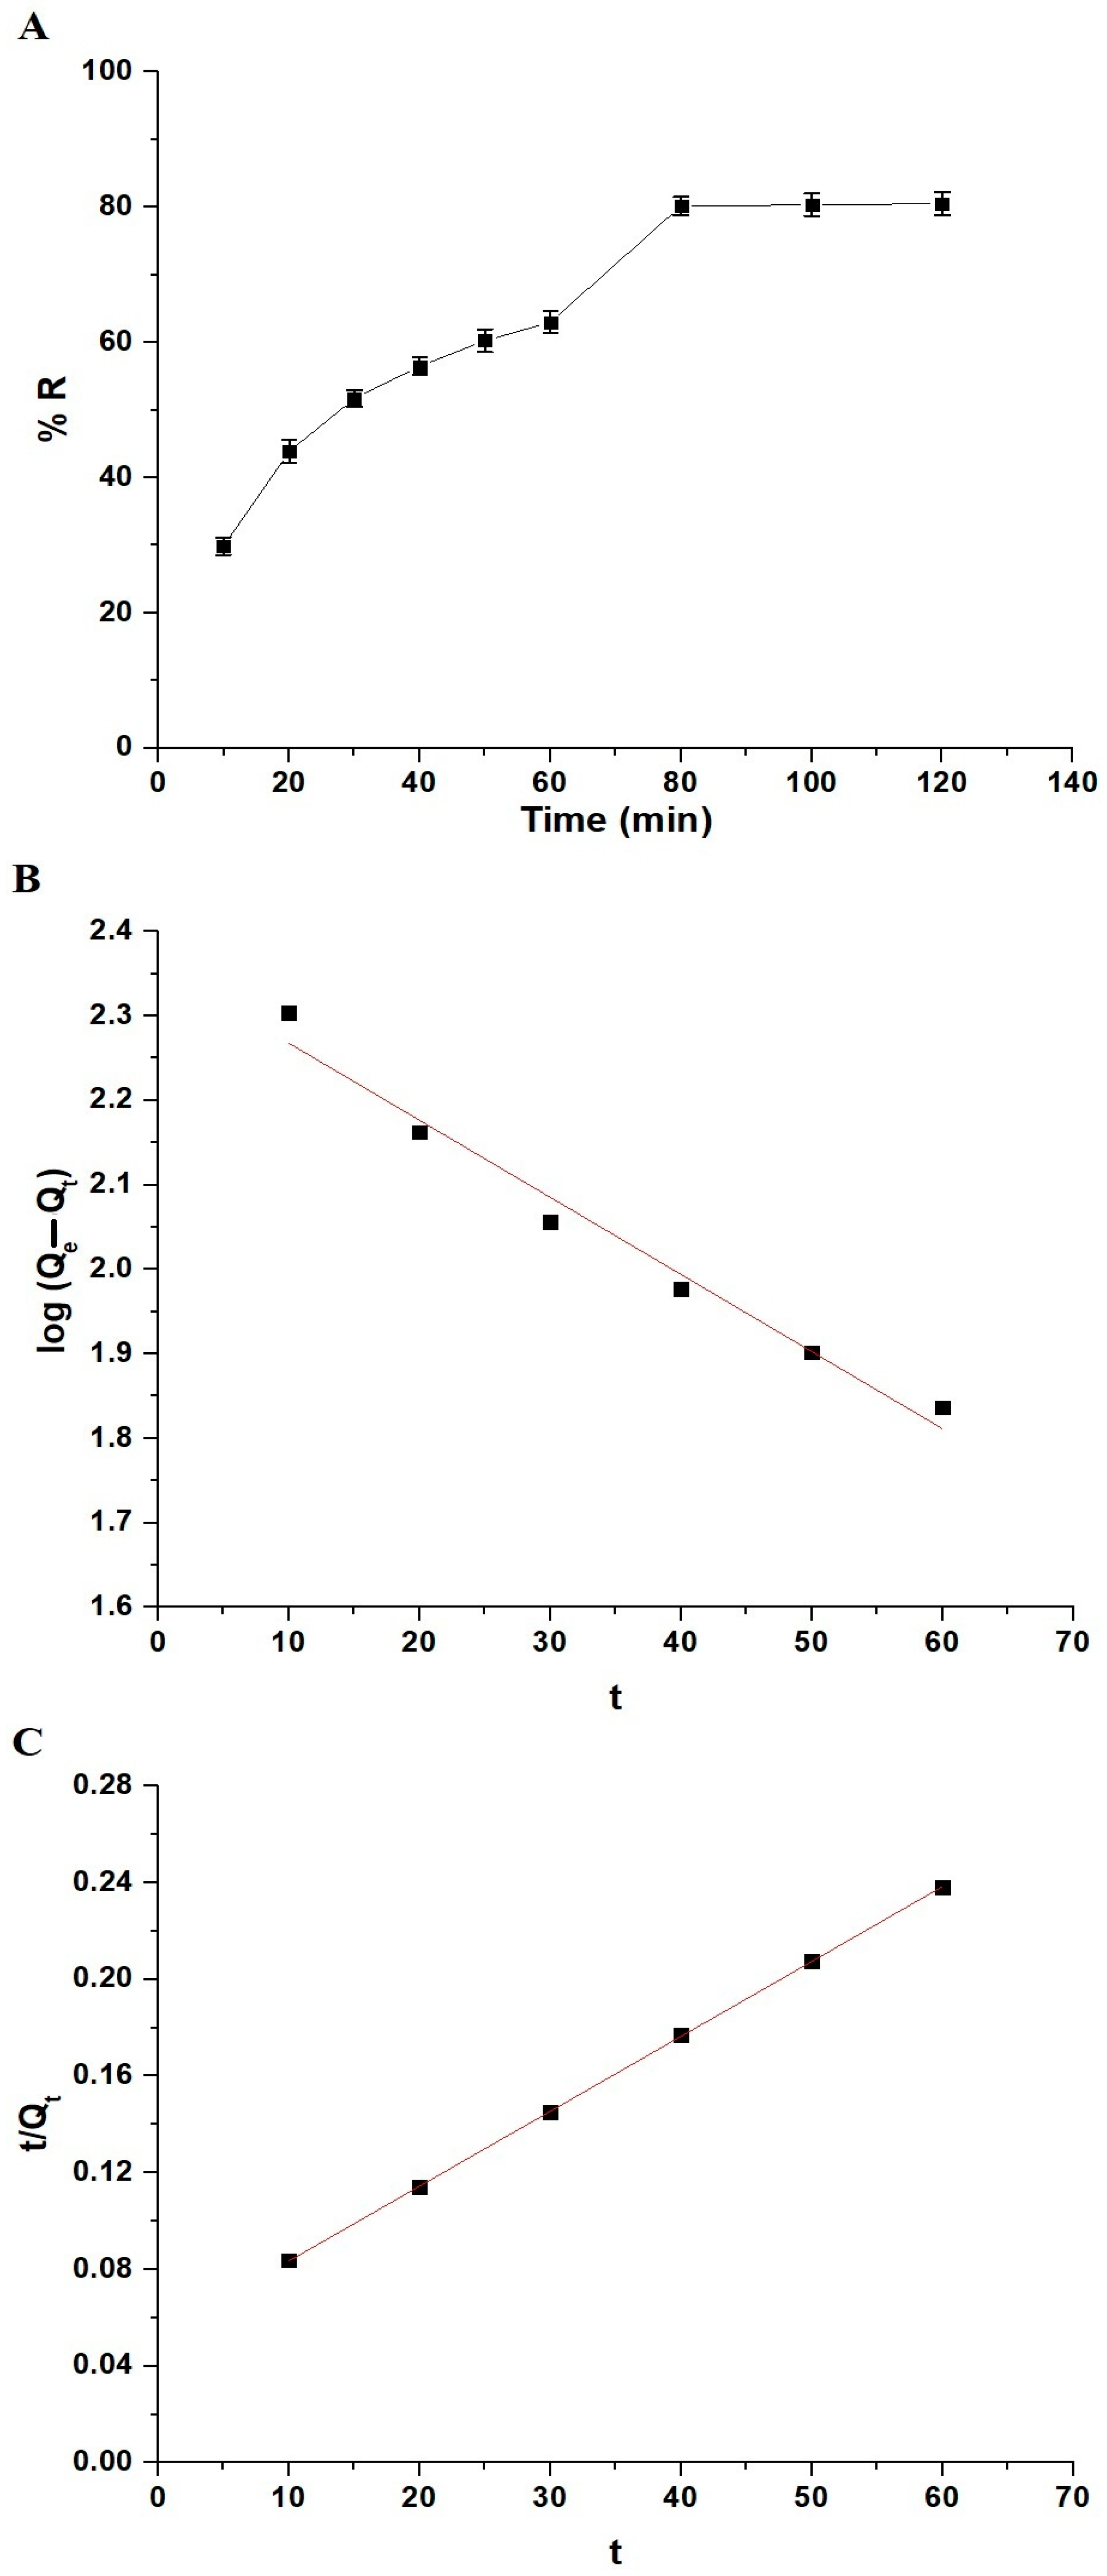
3.2.2. Influence of Adsorption Time and Adsorption Kinetics

Figure 8A illustrates the influence of time on the removal percentage (% R) of safranine T dye. The safranine T dye removal percentage experienced an upward trend with the rise in time within the range from 10 to 80 min. Specifically, the removal percentage of safranine T dye showed an escalation from 29.87% after 10 min to 80.18% after 80 min due to the presence of available active sites. Further, there is an approximate stability in the removal percentage of safranine T dye with increasing time from 80 to 120 min due to the saturation of active sites. The pseudo-first-order (Equation (3)) and pseudo-second-order (Equation (4)) kinetic sorption models were utilized to estimate the experimental results and clarify the adsorption mechanism [23,25].
log Q e Q t = l o g Q e K 1 2.303 t
t Q t = 1 K 2 Q e 2 + 1 Q e t
K1 (1/min) and Qe (mg/g) refers to the pseudo-first-order rate constant and the amount of safranine T dye adsorbed at equilibrium, respectively. K2 (g/mg.min) and Qt (mg/g) refers to the rate constant of pseudo-second-order and the amount of safranine T dye adsorbed at any time, respectively. Moreover, kinetic constants from the linear regression plots are listed in Table 2. Figure 8B,C shows the pseudo-first-order and pseudo-second-order for the sorption of safranine T dye onto the manganese ferrite nanoparticles, respectively. The findings indicate that the adsorption capacity determined through the pseudo-second-order model closely aligns with the experimental adsorption capacity (Qexp). Additionally, the correlation coefficient (R2) obtained from the pseudo-second-order model surpasses that obtained from the pseudo-first-order model. Consequently, the kinetics of safranine T dye on manganese ferrite nanoparticles can be effectively explained through the pseudo-second-order kinetic model.

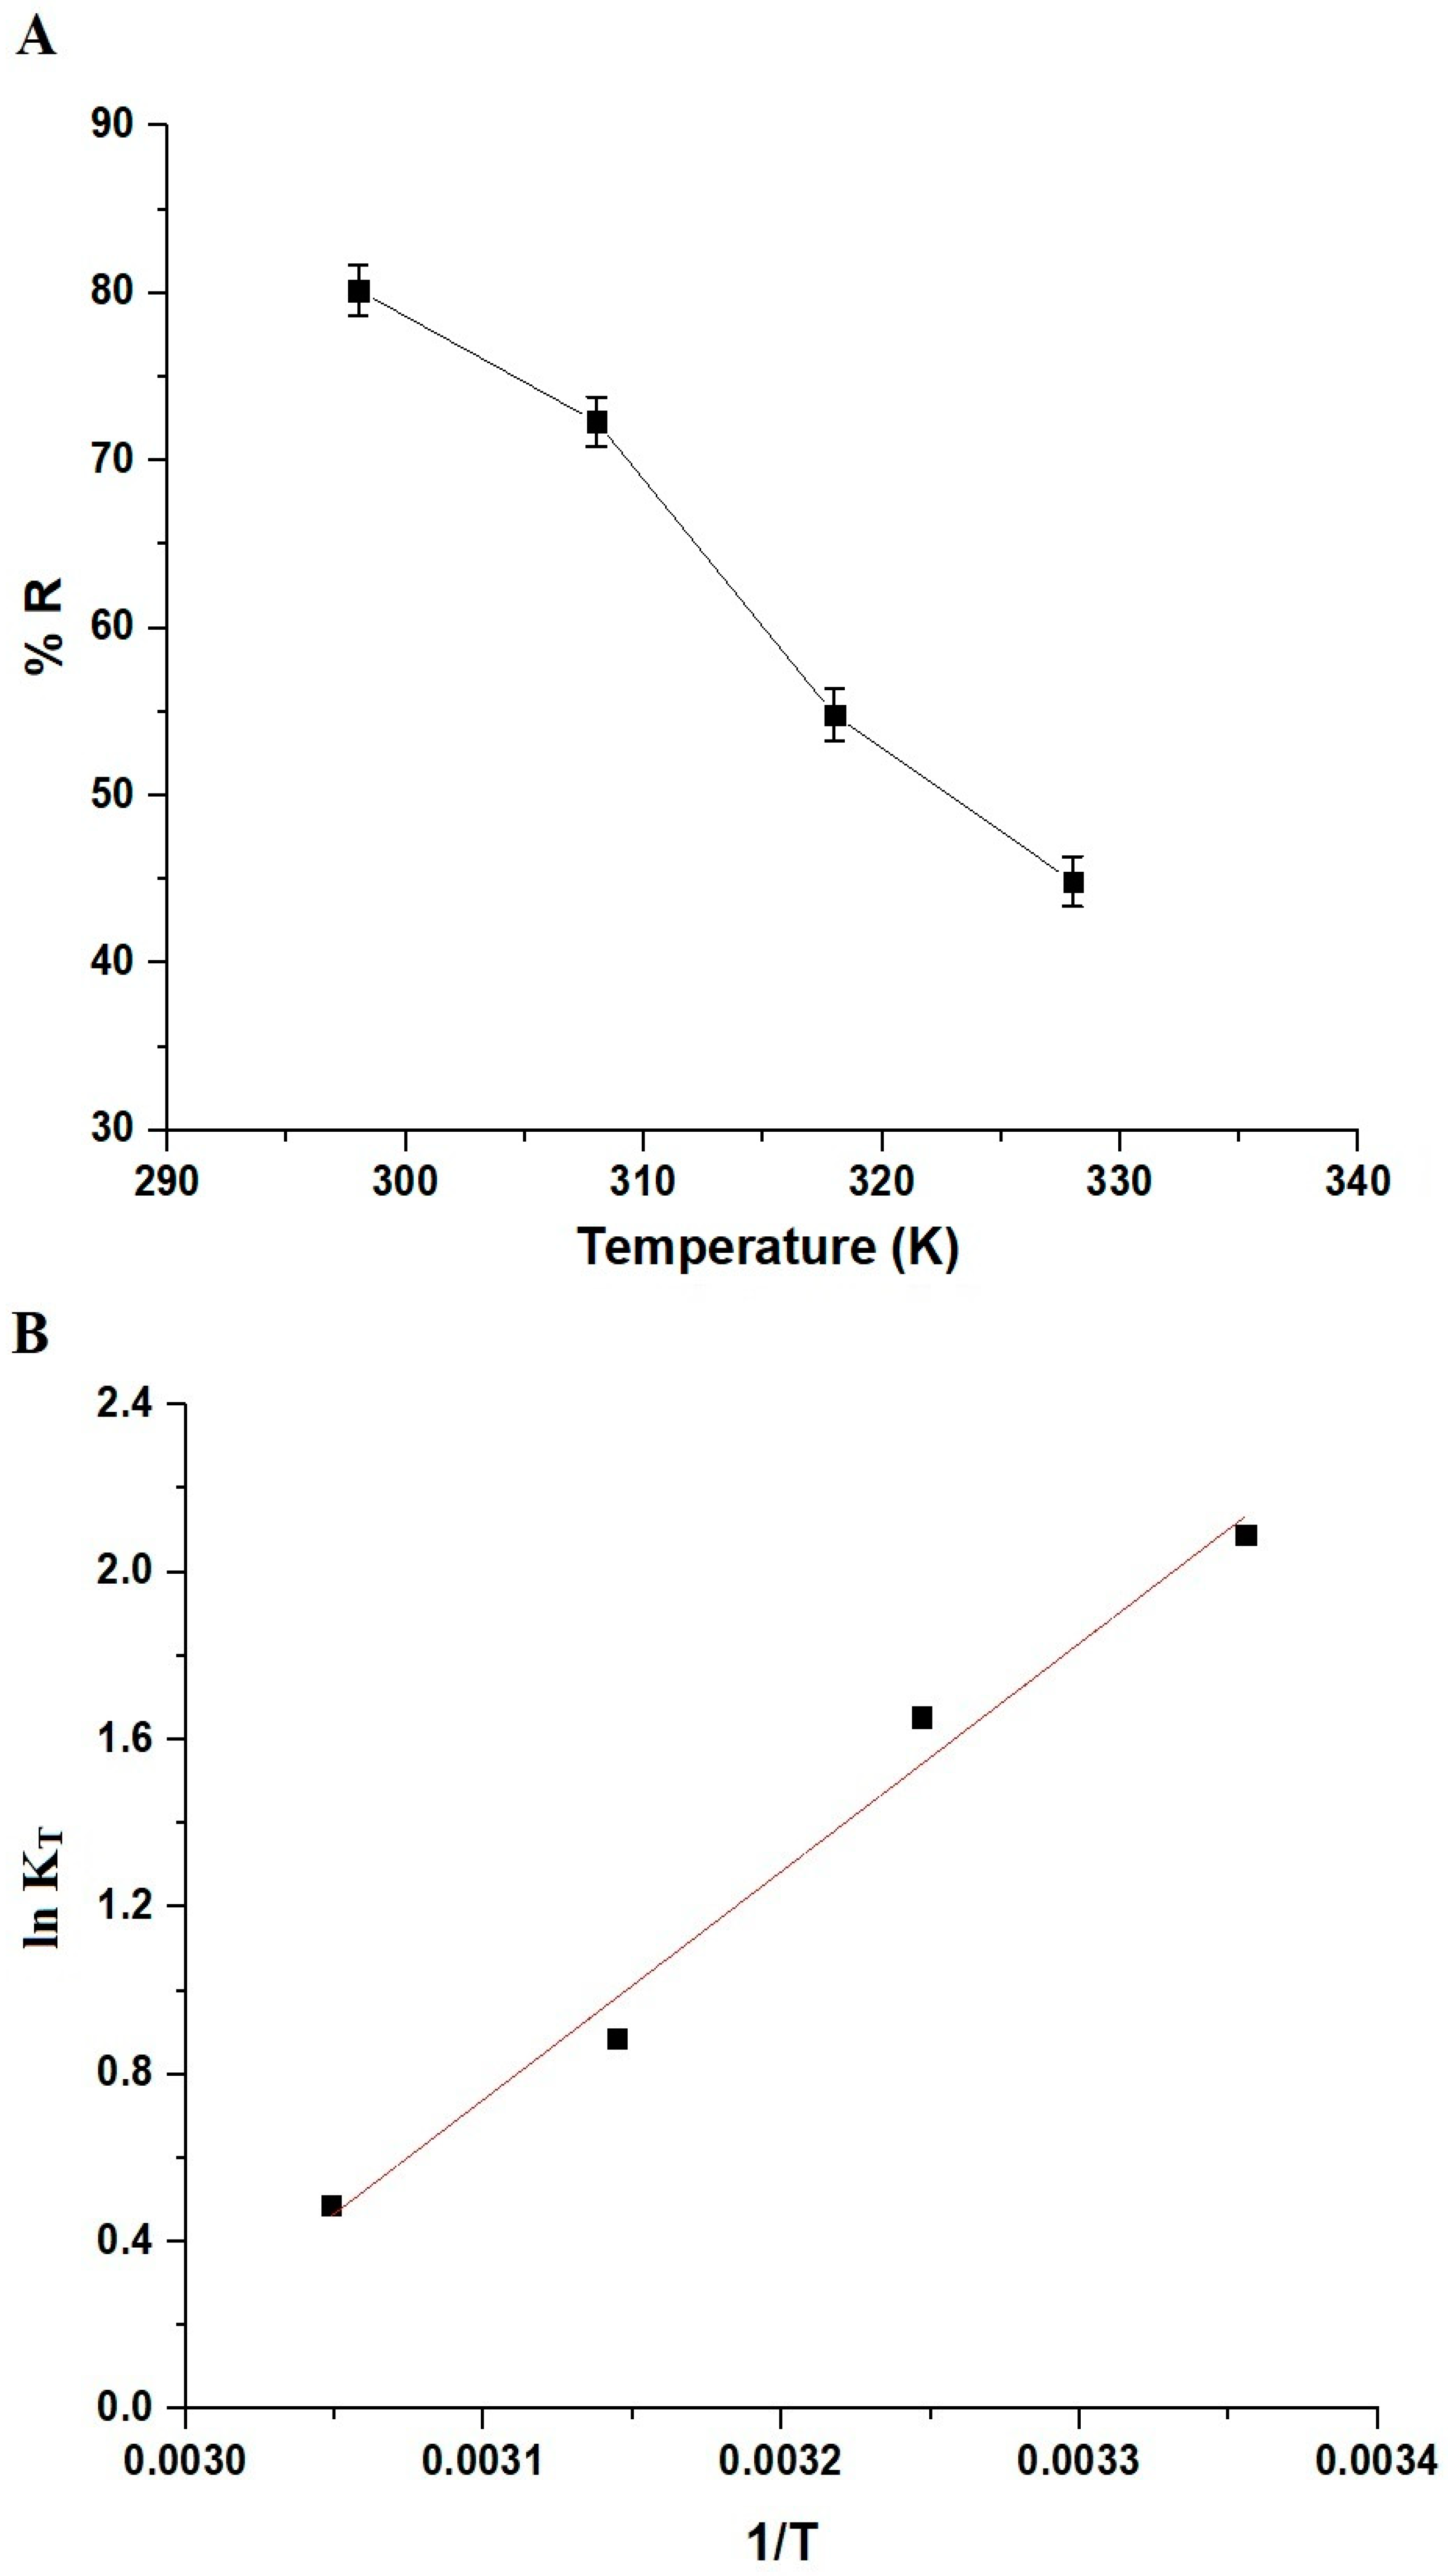
3.2.3. Influence of Solution Temperature and Thermodynamic Constants

Figure 9A illustrates the influence of temperature on the removal percentage (% R) of safranine T dye. The safranine T dye removal percentage experienced a decreasing trend with the rise in temperature within the range from 298 to 328 K. The thermodynamic constants such as entropy change (ΔS°), enthalpy change (ΔH°), and free energy change (ΔG°) were identified using Equations (5)–(7) [23,25].
l n K T = Δ S o R Δ H o R T
Δ G o = Δ H o T Δ S o
K T = Q e C e
KT refers to the distribution coefficient (L/g). T refers to the removal temperature (K), whereas R refers to the ideal gas constant in KJ/molK unit. The values of ΔH° and ΔS° were computed from the slope and intercept of the linear regression of ln KT versus 1/T, as shown in Figure 9B. The values of ΔS°, ΔH°, and ΔG° are revealed in Table 3. The positive value of the entropy change indicates the affinity of the manganese ferrite nanoparticles towards safranine T dye. The negative sign and value of the enthalpy change confirmed that the removal process of safranine T dye onto manganese ferrite nanoparticles is exothermic and chemical. Further, the negative values of free energy change demonstrated that the removal process of safranine T dye onto manganese ferrite nanoparticles is spontaneous.

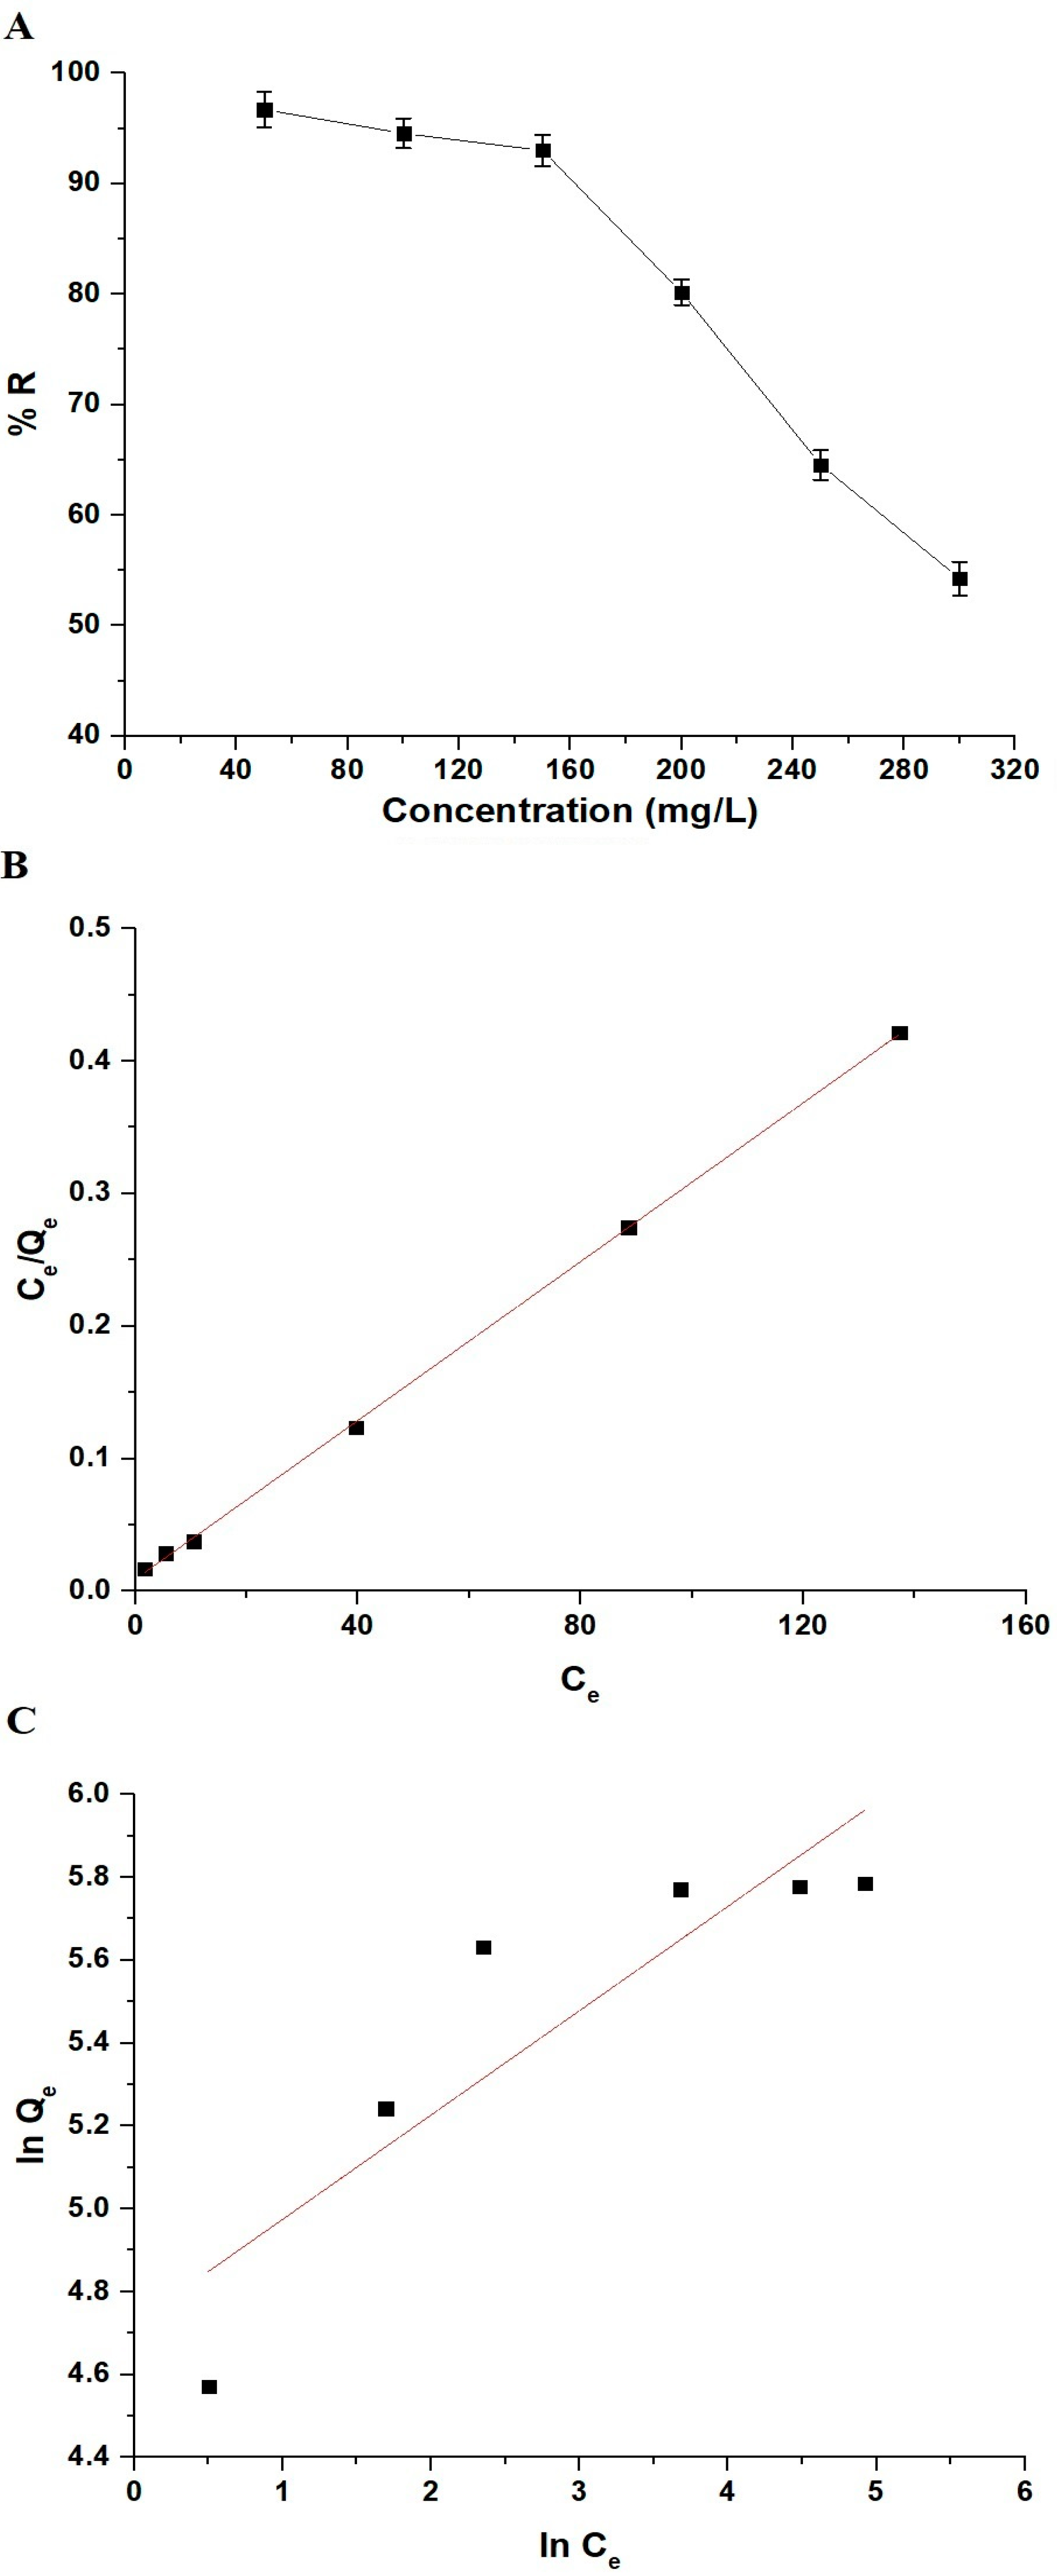
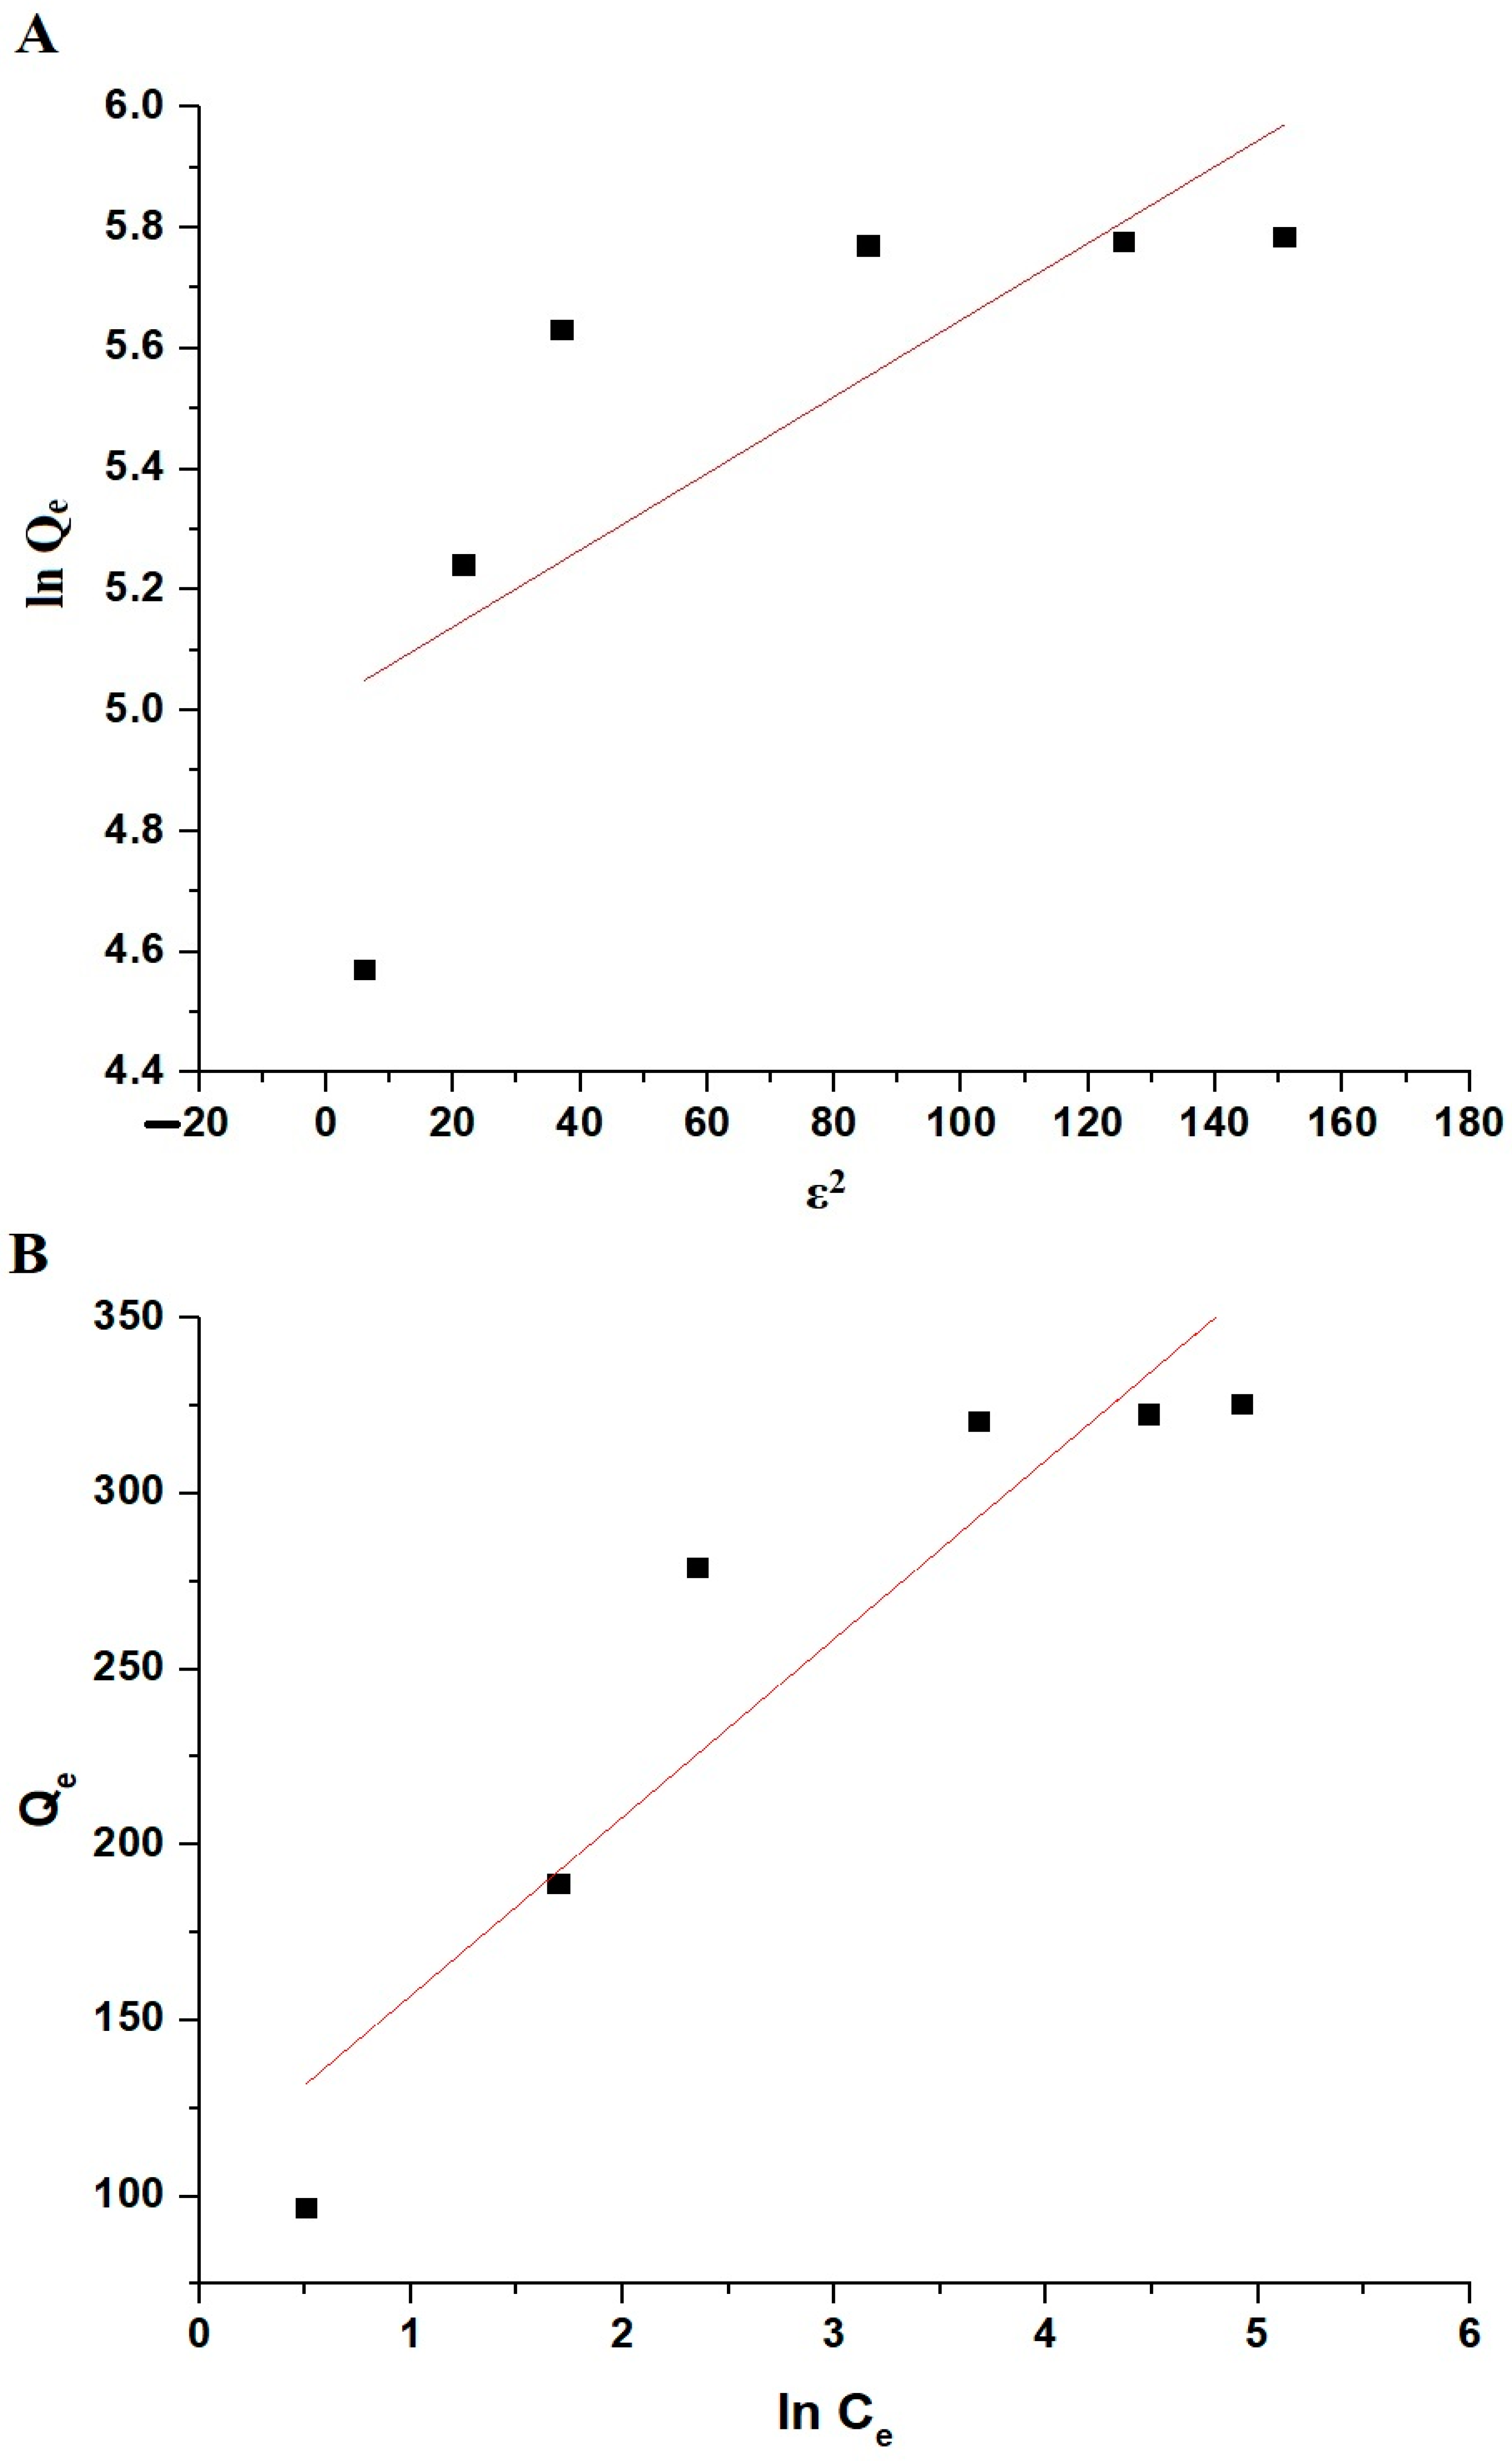
3.2.4. Influence of Initial Safranine T Dye Concentration and Adsorption Equilibrium Isotherms

Figure 10A illustrates the influence of initial dye concentration on the removal percentage (% R) of safranine T dye. The safranine T dye removal percentage experienced a decreasing trend with the rise in concentration within the range from 50 to 300 mg/L.
The Langmuir (Equation (8)) and Freundlich (Equation (9)) equilibrium sorption isotherms were studied to estimate the experimental results and clarify the adsorption mechanism [23,25].
C e Q e = 1 K 3 Q m a x + C e Q m a x
l n Q e = l n K 4 + 1 n l n C e
Qmax refers to the maximum adsorption capacity (mg/g), whereas K3 refers to the Langmuir constant (L/mg). 1/n refers to the degree of heterogeneity, whereas K4 refers to the Freundlich constant (mg/g)(L/mg)1/n. It is important to mention that Qmax can be computed from Freundlich isotherm using Equation (10) [23,25].
Q m a x = K 4 C o 1 / n
Moreover, equilibrium constants from the linear regression plots are listed in Table 4. Figure 10B,C shows the Langmuir and Freundlich isotherms for the sorption of safranine T dye onto the manganese ferrite nanoparticles, respectively.
Also, Dubinin–Radushkevich (Equation (11)) and Temkin (Equation (12)) isotherms were studied, as shown in Figure 11A,B, respectively [35].
l n Q e = ln Q m a x + K 5 ƹ 2
Q e = B l n K 6 + B l n C e
K5 refers to the Dubinin–Radushkevich constant (mol2/KJ2), whereas ƹ refers to the Polanyi potential which is determined using Equation (13).
Ƹ = R T l n 1 1 + C e
K6 refers to the Temkin constant related to equilibrium bonding (L/g), whereas B refers to the Temkin constant related to the heat of adsorption.
Moreover, equilibrium constants from the linear regression plots are listed in Table 5.
It was founded that the correlation coefficient of the Langmuir isotherm is higher than that of the other isotherms such as Dubinin–Radushkevich, Freundlich, and Temkin. Hence, the removal of safranine T dye on the manganese ferrite nanoparticles fitted well with the Langmuir rather than the other applied isotherms.
Table 6 presents a comparative analysis of the adsorption capacity of manganese ferrite nanoparticles in relation to other reported adsorbents such as magnetic graphene oxide-containing chitosan-sodium alginate hydrogel, magnetic mesoporous clay, carboxy methyl cellulose incorporated acrylic hydrogels, clinoptilolite, phillipsite, heulandite, modified bituminous activated carbon with nitric acid, modified bituminous activated carbon with zinc oxide, and porous graphite [6,36,37,38,39]. Upon examination of the table, it becomes evident that the adsorption capacity of manganese ferrite nanoparticles surpasses that of the majority of established adsorbents. Consequently, manganese ferrite nanoparticles exhibit considerable promise as a material for the removal of safranine T dye from contaminated aqueous media. Manganese ferrite nanoparticles have certain advantages that make them attractive for removing safranine T dye. Manganese ferrite nanoparticles are a magnetic material that allows for easy separation from a solution using an external magnetic field. This property simplifies the recovery and reuse of the adsorbent, reducing operational costs and making the process more environmentally friendly. Manganese ferrite nanoparticles typically have a high surface area. A high surface area provides more active sites for adsorption, allowing for the efficient removal of contaminants from a solution. Manganese ferrite nanoparticles are known for their chemical stability, which is an important factor for adsorbents. It can withstand a range of chemical conditions without undergoing significant degradation, ensuring its performance over time. Depending on the synthesis method and availability of raw materials, MnFe2O4 nanoparticles may be a cost-effective adsorbent compared to some alternatives. Economic considerations are crucial when selecting an adsorbent for large-scale applications.

3.2.5. Influence of Renewal and Reusability

For the renewal of MnFe2O4 nanoparticles, the MnFe2O4/safranine T dye blend underwent heating at 600 °C, causing the breakdown and removal of the safranine T dye. Following this, the regenerated MnFe2O4 nanoadsorbent was employed for the sequential adsorption of safranine T dye through five successive cycles and presented in Figure 12, adhering to the identical experimental procedure outlined earlier. The results demonstrated the MnFe2O4 nanoparticles’ ability to consistently eliminate safranine T dye without encountering a substantial decrease in effectiveness.
To confirm the stability of the MnFe2O4 nanoparticles, XRD of the regenerated MnFe2O4 nanoparticles after the fifth cycle was carried out and the results displayed that there were no differences in the positions or intensities of peaks, as shown in Figure 13. Hence, the reuse of adsorbent aligns with sustainability goals by promoting resource efficiency and reducing the need for continuous production and disposal of adsorbent materials. This is particularly important in the context of environmentally conscious practices.

3.2.6. Influence of Selectivity

In order to investigate the influence of several cations and anions on the removal efficiency of safranine T dye by MnFe2O4 nanoparticles, the interfering ion of concern was introduced at various concentrations into a 100 mL solution containing 200 µg/L of the specific safranine T dye solution. The removal process was carried out according to the previously described protocol, and the removal percentage of safranine T dye was determined. The maximum concentration of the interfering ion that caused a 5% error in the removal percentage of safranine T dye was identified as the tolerance limit. Table 7 clearly indicates that most interfering ions exhibit a relatively high tolerance limit, demonstrating the selectivity of MnFe2O4 nanoparticles to remove safranine T dye.

4. Conclusions

An effective removal method for safranine T dye from aqueous media was implemented operating easily produced manganese ferrite (MnFe2O4) nanoparticles. The synthesis of the manganese ferrite nanoparticles was carried out through the pechini sol–gel approach, employing tartaric acid to serve as a chelating agent in addition to 1,2-propanediol to serve as a crosslinker. According to TEM analysis, the MnFe2O4 nanoparticles exhibit semi-spherical particles with a mean size of 19.32 nm, aligning closely with the measurement obtained from XRD (18.89 nm). The maximum adsorption capacity of MnFe2O4 nanoparticles for safranine T dye reached 334.45 mg/g. The removal mechanism of safranine dye by manganese ferrite nanoparticles was found to be chemical, exothermic, and well described by the Langmuir equilibrium sorption isotherm as well as the pseudo-second-order kinetic model. Importantly, the synthesized manganese ferrite nanoparticles exhibited the ability to be reused multiple times without a significant loss of efficiency. The findings of this research suggest that MnFe2O4 nanoparticles could serve as a cost-effective, promising, sustainable, and efficient adsorbent for the removal of safranine T dye from aqueous solutions.

Author Contributions

Z.A., writing—review and editing (equal), conceptualization (equal), and methodology (equal); E.A.A., writing—review and editing (equal), conceptualization (equal), and methodology (equal). All authors have read and agreed to the published version of the manuscript.

Funding

This research received no external funding.

Data Availability Statement

Data are contained within the article.

Acknowledgments

The authors would like to thank the Deanship of Scientific Research at Shaqra University for supporting this work.

Conflicts of Interest

The authors declare no conflict of interest.

References

  1. Kumar, N.; Pandey, A.; Sharma, Y.C. A Review on Sustainable Mesoporous Activated Carbon as Adsorbent for Efficient Removal of Hazardous Dyes from Industrial Wastewater. J. Water Process Eng. 2023, 54, 104054. [Google Scholar] [CrossRef]
  2. Ahmadian, M.; Jaymand, M. Interpenetrating Polymer Network Hydrogels for Removal of Synthetic Dyes: A Comprehensive Review. Coord. Chem. Rev. 2023, 486, 215152. [Google Scholar] [CrossRef]
  3. Kausar, A.; Zohra, S.T.; Ijaz, S.; Iqbal, M.; Iqbal, J.; Bibi, I.; Nouren, S.; El Messaoudi, N.; Nazir, A. Cellulose-Based Materials and Their Adsorptive Removal Efficiency for Dyes: A Review. Int. J. Biol. Macromol. 2023, 224, 1337–1355. [Google Scholar] [CrossRef]
  4. Kaner, D.; Sarac, A. Removal of Dyes from Water Using Crosslinked Aminomethane Sulfonic Acid Based Resin. Environ. Geochem. Health 2010, 32, 321–325. [Google Scholar] [CrossRef]
  5. Bilal, M.; Khan, U.; Ihsanullah, I. MXenes: The Emerging Adsorbents for the Removal of Dyes from Water. J. Mol. Liq. 2023, 385, 122377. [Google Scholar] [CrossRef]
  6. Ma, J.; Zhang, M.; Ji, M.; Zhang, L.; Qin, Z.; Zhang, Y. Magnetic Graphene Oxide-Containing Chitosan-Sodium Alginate Hydrogel Beads for Highly Efficient and Sustainable Removal of Cationic Dyes. Int. J. Biol. Macromol. 2021, 193, 2221–2231. [Google Scholar] [CrossRef]
  7. Ihaddaden, S.; Aberkane, D.; Boukerroui, A.; Robert, D. Removal of Methylene Blue (Basic Dye) by Coagulation-Flocculation with Biomaterials (Bentonite and Opuntia Ficus Indic). J. Water Process Eng. 2022, 49, 102952. [Google Scholar] [CrossRef]
  8. Kono, H.; Kusumoto, R. Journal of Water Process Engineering Removal of Anionic Dyes in Aqueous Solution by Flocculation with Cellulose Ampholytes. J. Water Process Eng. 2015, 7, 83–93. [Google Scholar] [CrossRef]
  9. Liu, Y.; Yan, A.; Ding, L.; Wei, J.; Liu, Y.; Niu, Y. Colloids and Surfaces A: Physicochemical and Engineering Aspects Simultaneous and Ultrafast Removal of Anionic and Cationic Dyes from Aqueous Solution by Zr-Based MOFs Hybridized by Attapulgite and Adsorption Performance Research. Colloids Surf. A Physicochem. Eng. Asp. 2024, 680, 132643. [Google Scholar] [CrossRef]
  10. Semwal, N.; Mahar, D.; Chatti, M.; Dandapat, A.; Chandra, M. Heliyon “Adsorptive Removal of Congo Red Dye from Its Aqueous Solution by Ag-Cu-CeO2 Nanocomposites: Adsorption Kinetics, Isotherms, and Thermodynamics”. Heliyon 2023, 9, e22027. [Google Scholar] [CrossRef]
  11. Mahlangu, O.T.; Mamba, G.; Mamba, B.B. A Facile Synthesis Approach for GO-ZnO/PES Ultrafiltration Mixed Matrix Photocatalytic Membranes for Dye Removal in Water: Leveraging the Synergy between Photocatalysis and Membrane Filtration. J. Environ. Chem. Eng. 2023, 11, 110065. [Google Scholar] [CrossRef]
  12. Subrahmanya, T.M.; Widakdo, J.; Mani, S.; Faye, H.; Hung, W.; Makari, H.K.; Nagar, J.K.; Hu, C.; Lai, J. An Eco-Friendly and Reusable Syringe Filter Membrane for the Efficient Removal of Dyes from Water via Low Pressure Filtration Assisted Self-Assembling of Graphene Oxide and SBA-15/PDA. J. Clean. Prod. 2022, 349, 131425. [Google Scholar] [CrossRef]
  13. Duan, Y.; Zhao, J.; Qiu, X.; Deng, X.; Ren, X.; Ge, W.; Yuan, H. Coagulation Performance and Floc Properties for Synchronous Removal of Reactive Dye and Polyethylene Terephthalate Microplastics. Process Saf. Environ. Prot. 2022, 165, 66–76. [Google Scholar] [CrossRef]
  14. Mcyotto, F.; Wei, Q.; Macharia, D.K.; Huang, M.; Shen, C.; Chow, C.W.K. Effect of dye structure on color removal efficiency by coagulation. Chem. Eng. J. 2021, 405, 126674. [Google Scholar] [CrossRef]
  15. Liu, M.; Yin, W.; Zhao, T.; Yao, Q.; Fu, S.; Zhou, G. High-Efficient Removal of Organic Dyes from Model Wastewater Using Mg(OH)2-MnO2 Nanocomposite: Synergistic Effects of Adsorption, Precipitation, and Photodegradation. Sep. Purif. Technol. 2021, 272, 118901. [Google Scholar] [CrossRef]
  16. Bayat, M.; Javanbakht, V.; Esmaili, J. Synthesis of zeolite/nickel ferrite/sodium alginate bionanocomposite via a co-precipitation technique for efficient removal of water-soluble methylene blue dye. Int. J. Biol. Macromol. 2018, 116, 607–619. [Google Scholar] [CrossRef]
  17. Maria, S.; Guelli, D.A.; De Souza, U.; Angela, K.; Bonilla, S.; Augusto, A.; Souza, U. Removal of COD and Color from Hydrolyzed Textile Azo Dye by Combined Ozonation and Biological Treatment. J. Hazard. Mater. 2010, 179, 35–42. [Google Scholar] [CrossRef]
  18. Wijannarong, S.; Aroonsrimorakot, S.; Thavipoke, P. Removal of Reactive Dyes from Textile Dyeing Industrial Effluent by Ozonation Process. APCBEE Procedia 2013, 5, 279–282. [Google Scholar] [CrossRef]
  19. Yuan, J.; Chen, Z.; Yu, Q.; Zhu, W.; Li, S.; Han, L.; Lu, X.; Li, S.; Wu, Y.; Lv, Z.; et al. Enhanced Electrochemical Removal of Dye Wastewater by PbO2 Anodes Using Halloysite Nanotubes with Different Surface Charge Properties. J. Electroanal. Chem. 2022, 923, 116816. [Google Scholar] [CrossRef]
  20. Leng, Q.; Xu, S.; Wu, X.; Wang, S.; Jin, D.; Wang, P.; Wu, D.; Dong, F. Electrochemical Removal of Synthetic Methyl Orange Dyeing Wastewater by Reverse Electrodialysis Reactor: Experiment and Mineralizing Model. Environ. Res. 2022, 214, 114064. [Google Scholar] [CrossRef]
  21. Khaled, J.M.; Alyahya, S.A.; Govindan, R.; Kanisha, C. Laccase Producing Bacteria Influenced the High Decolorization of Textile Azo Dyes with Advanced Study. Environ. Res. 2022, 207, 112211. [Google Scholar] [CrossRef]
  22. Noman, E.; Talip, B.A.; Al-gheethi, A.; Mohamed, R.; Nagao, H. Materials Today: Proceedings Decolourisation of Dyes in Greywater by Mycoremediation and Mycosorption Process of Fungi from Peatland: Primary Study. Mater. Today Proc. 2020, 31, 23–30. [Google Scholar] [CrossRef]
  23. Al-Wasidi, A.S.; Khairy, M.; Abdulkhair, B.Y.; Abdelrahman, E.A. Efficient Disposal of Basic Fuchsin Dye from Aqueous Media Using ZrO2/MgMn2O4/Mg(Mg0.333Mn1.333)O4 as a Novel and Facilely Synthesized Nanocomposite. Inorganics 2023, 11, 363. [Google Scholar] [CrossRef]
  24. Abdelrahman, E.A.; Algethami, F.K.; Alsalem, H.S.; Binkadem, M.S. Facile Synthesis and Characterization of Novel Nanostructures for the Efficient Disposal of Crystal Violet Dye from Aqueous Media. Inorganics 2023, 11, 339. [Google Scholar] [CrossRef]
  25. Al-wasidi, A.S.; Abdelrahman, E.A. Simple Synthesis and Characterization of Cobalt Ferrite Nanoparticles for the Successful Adsorption of Indigo Carmine Dye from Aqueous Media. Inorganics 2023, 11, 453. [Google Scholar] [CrossRef]
  26. Kirtimala, N.; Wareppam, B.; Herojit, L. Materials Today: Proceedings Effect of Sintering Temperature on the Magnetic Properties of ZnFe2O4 Composite with Cobaltic Oxide Synthesized by Chemical Co Precipitation Method. Mater. Today Proc. 2022, 68, 196–199. [Google Scholar] [CrossRef]
  27. Chang, S.; Mei, S.; Yang, L.; Yang, L.; Lu, Z.; Shuang, W. Effect of Synthesis Conditions on the Structure and Properties of LiFeO2/ZnFe2O4 Nanocomposites Prepared by a Sol-Gel Method. Solid State Commun. 2021, 334–335, 114379. [Google Scholar] [CrossRef]
  28. Tiwari, N.; Kadam, S.; Ingole, R.; Kulkarni, S. Facile Hydrothermal Synthesis of ZnFe2O4 Nanostructures for High-Performance Supercapacitor Application. Ceram. Int. 2022, 48, 29478–29483. [Google Scholar] [CrossRef]
  29. Srihari, S.; Panda, S.; Gandi, S.; Reddy, S.; Panigrahi, T. Facile Hydrothermal Synthesis of Bio-Inspired ZnO/Fe2O3/ZnFe2O4 Heterostructure: Effect of Microwave Absorption Properties. Surf. Interfaces 2023, 42, 103490. [Google Scholar] [CrossRef]
  30. Brandt, T.G.; Tuokkola, A.R.; Yu, M.; Laine, R.M. Liquid-Feed Flame Spray Pyrolysis Enabled Synthesis of Co- and Cr-Free, High-Entropy Spinel Oxides as Li-Ion Anodes. Chem. Eng. J. 2023, 474, 145495. [Google Scholar] [CrossRef]
  31. Iljinas, A.; Brucas, R.; Stankus, V.; Dudonis, J. Synthesis of Fe3O4 Thin Films by Solid State Reactions. Mater. Sci. Eng. C 2005, 25, 590–594. [Google Scholar] [CrossRef]
  32. He, X.; Guo, H.; Zhang, X.; Liao, T.; Zhu, Y.; Tang, H.; Li, T.; Song, J. ScienceDirect Facile Electrochemical Fabrication of Magnetic Fe3O4 for Electrocatalytic Synthesis of Ammonia Used for Hydrogen Storage Application. Int. J. Hydrog. Energy 2021, 46, 24128–24134. [Google Scholar] [CrossRef]
  33. Ali, A.; Wijayantha, K.G.U.; Mazhar, M.; Mckee, V. ZnFe2O4 Thin Fi Lms from a Single Source Precursor by Aerosol Assisted Chemical Vapour Deposition. Thin Solid Films 2010, 518, 3664–3668. [Google Scholar] [CrossRef]
  34. Gao, C.Y.; Baek, E.; You, C.Y.; Choi, H.J. Magnetic-Stimuli Rheological Response of Soft-Magnetic Manganese Ferrite Nanoparticle Suspension. Colloid Polym. Sci. 2021, 4, 865–872. [Google Scholar] [CrossRef]
  35. Abdelrahman, E.A.; Abou El-Reash, Y.G.; Youssef, H.M.; Kotp, Y.H.; Hegazey, R.M. Utilization of Rice Husk and Waste Aluminum Cans for the Synthesis of Some Nanosized Zeolite, Zeolite/Zeolite, and Geopolymer/Zeolite Products for the Efficient Removal of Co(II), Cu(II), and Zn(II) Ions from Aqueous Media. J. Hazard. Mater. 2021, 401, 123813. [Google Scholar] [CrossRef]
  36. Fayazi, M.; Afzali, D.; Taher, M.A.; Mostafavi, A.; Gupta, V.K. Removal of Safranin Dye from Aqueous Solution Using Magnetic Mesoporous Clay: Optimization Study. J. Mol. Liq. 2015, 212, 675–685. [Google Scholar] [CrossRef]
  37. Mandal, B.; Kumar, S. Removal of Safranine T and Brilliant Cresyl Blue Dyes from Water by Carboxy Methyl Cellulose Incorporated Acrylic Hydrogels: Isotherms, Kinetics and Thermodynamic Study. J. Taiwan Inst. Chem. Eng. 2016, 60, 313–327. [Google Scholar] [CrossRef]
  38. Abukhadra, M.R.; Mohamed, A.S. Adsorption Removal of Safranin Dye Contaminants from Water Using Various Types of Natural Zeolite. Silicon 2019, 11, 1635–1647. [Google Scholar] [CrossRef]
  39. Shaban, M.; Abukhadra, M.R.; Shahien, M.G.; Khan, A.A.P. Upgraded Modified Forms of Bituminous Coal for the Removal of Safranin-T Dye from Aqueous Solution. Environ. Sci. Pollut. Res. 2017, 24, 18135–18151. [Google Scholar] [CrossRef]
Scheme 1. Synthesis of MnFe2O4 nanoparticles applying the pechini sol–gel method.
Inorganics 12 00030 sch001
Figure 1. Thermal gravimetric analysis of the formed powder by the pechini sol–gel method before the calcination process.
Inorganics 12 00030 g001
Figure 2. XRD (A) and FTIR (B) analyses of MnFe2O4 nanoparticles.
Inorganics 12 00030 g002
Figure 3. SEM (A) and its histogram (B) of MnFe2O4 nanoparticles.
Inorganics 12 00030 g003
Figure 4. TEM (A) and its histogram (B) of MnFe2O4 nanoparticles.
Inorganics 12 00030 g004
Figure 5. EDS (A) and magnetic (B) analyses of MnFe2O4 nanoparticles.
Inorganics 12 00030 g005
Figure 6. Influence of pH on the sorption of safranine T dye on manganese ferrite nanoparticles (A). Plot for the estimation of pHpzc for the manganese ferrite nanoparticles (B).
Inorganics 12 00030 g006
Figure 7. SEM (A) and FTIR analyses (B) of the MnFe2O4 nanoparticles after the adsorption of safranine T dye.
Inorganics 12 00030 g007
Figure 8. Influence of time on the sorption of safranine T dye on manganese ferrite nanoparticles (A). The pseudo-first-order (B) and pseudo-second-order (C) kinetic sorption models.
Inorganics 12 00030 g008
Figure 9. Impact of dye solution temperature on the sorption of safranine T dye on manganese ferrite nanoparticles (A). The representation of ln KT against 1/T (B).
Inorganics 12 00030 g009
Figure 10. Influence of concentration on the sorption of safranine T dye on manganese ferrite nanoparticles (A). The applied Langmuir (B) and Freundlich (C) sorption equilibrium isotherms.
Inorganics 12 00030 g010
Figure 11. The applied Dubinin–Radushkevich (A) and Temkin (B) sorption equilibrium isotherms.
Inorganics 12 00030 g011
Figure 12. Impact of reusability process of MnFe2O4 nanoparticles for the removal of safranine T dye.
Inorganics 12 00030 g012
Figure 13. XRD of the regenerated MnFe2O4 nanoparticles after the fifth cycle.
Inorganics 12 00030 g013
Table 1. Experimental terms for the adsorption of safranine T dye using manganese ferrite nanoparticles.
EffectConcentration
of Safranine T
Dye (mg/L)
Volume of
Safranine T
Dye (mL)
Amount of
Adsorbent (g)
Temperature
(K)
Time
(min)
pH (2–8)2001000.05298180
Time (10–120 min)2001000.0529810–120
Temperature (298–328 K)2001000.05298–32880
Concentration (50–300 mg/L)50–3001000.0529880
Table 2. Kinetics constants for the adsorption of safranine T dye by the manganese ferrite nanoparticles.
Experimental
Qexp
(mg/g)
Pseudo-First-OrderPseudo-Second-Order
Qe
(mg/g)
K1
(1/min)
R2Qe
(mg/g)
K2
(g/mg.min)
R2
320.7228.570.02100.9724322.580.000180.9993
Table 3. Calculated thermodynamic parameters of safranine T dye sorption onto manganese ferrite nanoparticles.
△H°
(KJ/mol)
△S°
(KJ/molK)
△G°
(KJ/mol)
298308318328
−45.560.1350−85.80−87.15−88.50−89.85
Table 4. Langmuir and Freundlich constants for the removal of safranine T dye by the manganese ferrite nanoparticles.
Langmuir IsothermFreundlich Isotherm
Qmax
(mg/g)
K3
(L/mg)
R2Qmax
(mg/g)
K4
(mg/g)(L/mg)1/n
R2
334.450.32290.9996426.99112.430.7465
Table 5. Dubinin–Radushkevich and Temkin constants for the removal of safranine T dye by the manganese ferrite nanoparticles.
Dubinin–Radushkevich IsothermTemkin Isotherm
Qmax
(mg/g)
K5
(mol2/KJ2)
R2B K6
(L/g)
R2
150.170.006360.500750.808.110.8317
Table 6. Comparison of the sorption capacities of various sorbents towards safranine T dye.
Adsorbents Maximum Sorption
Capacity (mg/g)
Ref.
Magnetic graphene oxide-containing
chitosan-sodium alginate hydrogel
44.313[6]
Magnetic mesoporous clay37.97[36]
Carboxy methyl cellulose incorporated acrylic hydrogels63.25[37]
Clinoptilolite42.90[38]
Phillipsite65.35[38]
Heulandite41.66[38]
Modified bituminous activated carbon with nitric acid27.40[39]
Modified bituminous activated carbon with zinc oxide32.46[39]
Porous graphite33.67[39]
MnFe2O4 nanoparticles334.45This study
Table 7. Removal of safranine T dye from binary mixtures in the presence of some interfering ions.
Interfering IonTolerance Limit (µg/L)
K(I)1000
Na(I)1100
Ca(II)105
Mg(II)110
Cd(II)80
Ni(II)90
SO42−1450
CO32−1450
Disclaimer/Publisher’s Note: The statements, opinions and data contained in all publications are solely those of the individual author(s) and contributor(s) and not of MDPI and/or the editor(s). MDPI and/or the editor(s) disclaim responsibility for any injury to people or property resulting from any ideas, methods, instructions or products referred to in the content.

