
A Core and Valence-Level Spectroscopy Study of the Enhanced Reduction of CeO2 by Iron Substitution—Implications for the Thermal Water-Splitting Reaction


Karlsruhe Institute of Technology (KIT), 76344 Eggenstein-Leopoldshafen, Germany
Inorganics 2024, 12(2), 42; https://doi.org/10.3390/inorganics12020042
Submission received: 19 December 2023
/
Revised: 18 January 2024
/
Accepted: 25 January 2024
/
Published: 27 January 2024
(This article belongs to the Special Issue Nano-Design of Transition Metal Oxides for Energy Storage and Catalytic Application)
Abstract
:The reduction of Ce cations in CeO2 can be enhanced by their partial substitution with Fe cations. The enhanced reduction of Ce cations results in a considerable increase in the reaction rates for the thermal water-splitting reaction when compared to CeO2 alone. This mixed oxide has a smaller crystallite size when compared to CeO2, in addition to a smaller lattice size. In this work, two Fe-substituted Ce oxides are studied (Ce0.95Fe0.05O2-δ and Ce0.75Fe0.25O2-δ; δ < 0.5) by core and valence level spectroscopy in their as-prepared and Ar-ion-sputtered states. Ar ion sputtering substantially increases Ce4f lines at about 1.5 eV below the Fermi level. In addition, it is found that the XPS Ce5p/O2s ratio is sensitive to the degree of reduction, most likely due to a higher charge transfer from the oxygen to Ce ions upon reduction. Quantitatively, it is also found that XPS Ce3d of the fraction of Ce3+ (uo, u′ and vo, v′) formed upon Ar ion sputtering and the ratio of Ce5p/O2s lines are higher for reduced Ce0.95Fe0.05O2-δ than for reduced Ce0.75Fe0.25O2-δ. XPS Fe2p showed, however, no preferential increase for Fe3+ reduction to Fe0 with increasing time for both oxides. Since water splitting was higher on Ce0.95Fe0.05O2-δ when compared to Ce0.75Fe0.25O2-δ, it is inferred that the reaction centers for the thermal water splitting to hydrogen are the reduced Ce cations and not the reduced Fe cations. These reduced Ce cations can be tracked by their XPS Ce5p/O2s ratio in addition to the common XPS Ce3d lines.
1. Introduction
Cerium oxide is one of the most known stable redox oxides. This property makes it the oxide support of choice for automobile catalytic converters (three-way catalyst, TWC), which have been in use for decades [1]. The relative ease with which it goes through reduction and re-oxidation cycles while maintaining its crystallographic structure (fluorite) is the main reason for this [2]. This particular property also makes it among the best-known support oxides for other redox catalytic reactions, such as the water–gas shift reaction (WGSR) [3]. For both reactions (WGSR and TWC), the reduction of CeO2 occurs chemically. In other words, the input of energy is from a hydrocarbon in the case of the TWC and from CO in the case of the WGSR [4]. This allows the redox cycle to occur at relatively low temperatures relevant for catalytic reactions.
CeO2 is also one of the most active and stable known oxides for thermochemical water splitting to H2 and O2 for energy applications [5]. For this reaction, however, the reduction is considered in the absence of a reducing agent and where heat (from the sun) is the sole energy input. Temperatures typically above 1500 °C are needed for an appreciable reduction to take place [6]. This adds a considerable strain to the process, and so far, its possible applications would be very costly and largely unpractical. To this end, much work addressing the reduction of CeO2 in order to understand its steps at the fundamental and applied levels has been pursued.
One of the strategies to enhance the reduction of CeO2 is to mix it with other oxides. This may be grouped into three categories.
- Size substitution (iso-valency): Compensation for lattice expansion. Upon the reduction of Ce4+ cations to Ce3+, the unit cell of CeO2 increases. This is because the eight-coordinated Ce4+ cation size is about 1 Å, while the eight-coordinated Ce3+ cation size is about 1.1 Å. Substituting some of the Ce4+ cations with metal cations with the same formal oxidation state (M4+) but a smaller size compensates partly for the lattice expansion. This is particularly successful when Zr4+ cations are used (size ca. 0.8 Å) [7,8]. While the substitution is valid up to about 50% (maintaining the fluorite structure of CeO2) [9], phase segregation occurs at high temperatures (at 1000 °C or so) [10].
- Charge transfer: substitution with oxidizable higher-valence cations. In this case, a fraction of Ce4+ cations is substituted with metal cations that can donate electrons and themselves be oxidized [11]. The substitution of Ce4+ with U4+ was found to enhance the reduction of CeO2, particularly at low levels [12,13]. Upon the removal of an oxygen atom, three Ce3+ cations are formed (instead of two), and one U4+ cation is oxidized to a U5+ action. In addition, the fact that both oxides, CeO2 and UO2, have a fluorite structure and both cations have the same size makes them miscible for the entire ratio range [14]. The optimal dosing for the reduction of Ce cations is not clear yet, and neither is the temperature at which phase segregation occurs.
- Charge compensation (alio-valencies): lattice distortion. While the substitution of Ce4+ with metal cations of a lower oxidation state will create vacancies, these vacancies are not charged. In other words, there is no increase in electron charge. The effect is, however, clear; for example, the substitution of Ce4+ cations with Fe3+ cations (up to about 20%) results in a considerable reduction of the host oxide [15]. This is thought to be due to the distortion of the lattice structure, making it less stable and therefore enabling further reduction [16]. In recent work, this was found to be the case for high-temperature reduction (with no chemical input). Yet, considerable phase segregation occurred after one TCWS reaction cycle [17].
In the case of alio-valence substitution (the word substitution is sometimes mentioned as doping; strictly speaking, doping is the addition of another element in ppm or ppb amounts to change its electronic properties and is not necessary added as a substitution), a large number of elements were studied, and most showed that Ce4+ reduction to Ce3+ was enhanced. These include Co (4%) co-precipitation for the photoreduction of CO2 to CH4 [18], Co (23%) for COS hydrolysis [19], Co (20%) for Hg removal [20], Pr (10–50%), in which Pr3+ increases the creation of oxygen vacancies and Pr4+ increases the oxygen storage capacity [21] and Mn (12%), enhancing oxygen mobility via vacancy formation [22]. Computationally, a large body of work was also conducted to study the creation of oxygen vacancies upon alio-valent cation substitution. These include the following: Mn (DFT + U and HSE06) [23], Cu (DFT + U) [24], Ni (DFT + U and HSE06) [25] and (DFT + U) [26], and other rare earth elements (Sc, Y, Gd, La) by DFT + U and Monte Carlo simulations [27].
Focusing on Fe substitution, considerable work at the experimental and theoretical levels has been conducted, and a few studies are mentioned here. Fe substitution of less than 30% increased the number of oxygen vacancies [28] and the selective catalytic reduction of NO to NH3. The DFT +U results of Fe-doped CeO2 (111) indicated that the oxygen vacancy formation energy is lower when compared to ceria alone and that Fe tends to be the center of the oxygen vacancy clusters [29]. Improved CO conversion over a CeO2-Fe2O3 mixed oxide was also seen and attributed to the formation of more mobile oxygen atoms in the redox cycle [30]. Fe substitution was previously studied for the thermochemical water-splitting reaction among other cation substitutions (Mn, Ni, and Cu), and the CeO2 substitute was found to be still active after four reaction cycles (O2 and H2 release) [31] at 1273 K (1000 °C). In another work for the same reaction, Fe at 5% was tested at 1550 °C and was found to be more active (a higher production rate per unit weight) and faster (a higher rate of release of hydrogen) than CeO2 alone. However, considerable phase segregation occurred due to the very high thermal reduction, 1550 °C, after one cycle of reaction [17]. This work is an extension of a previous one, focusing on the changes that occurred upon the reduction of Ce cations in the presence of Fe cations. Since during the reduction of Ce4+ cations to Ce3+ cations, Fe3+ cations would also be reduced to Fe2+ and Fe0, monitoring the changes that occur for both elements is needed. Also, as it will be shown, it seems that the ratio of the XPS Ce5p/O2s shallow core level lines is sensitive to the degree of reduction.
2. Results and Discussion
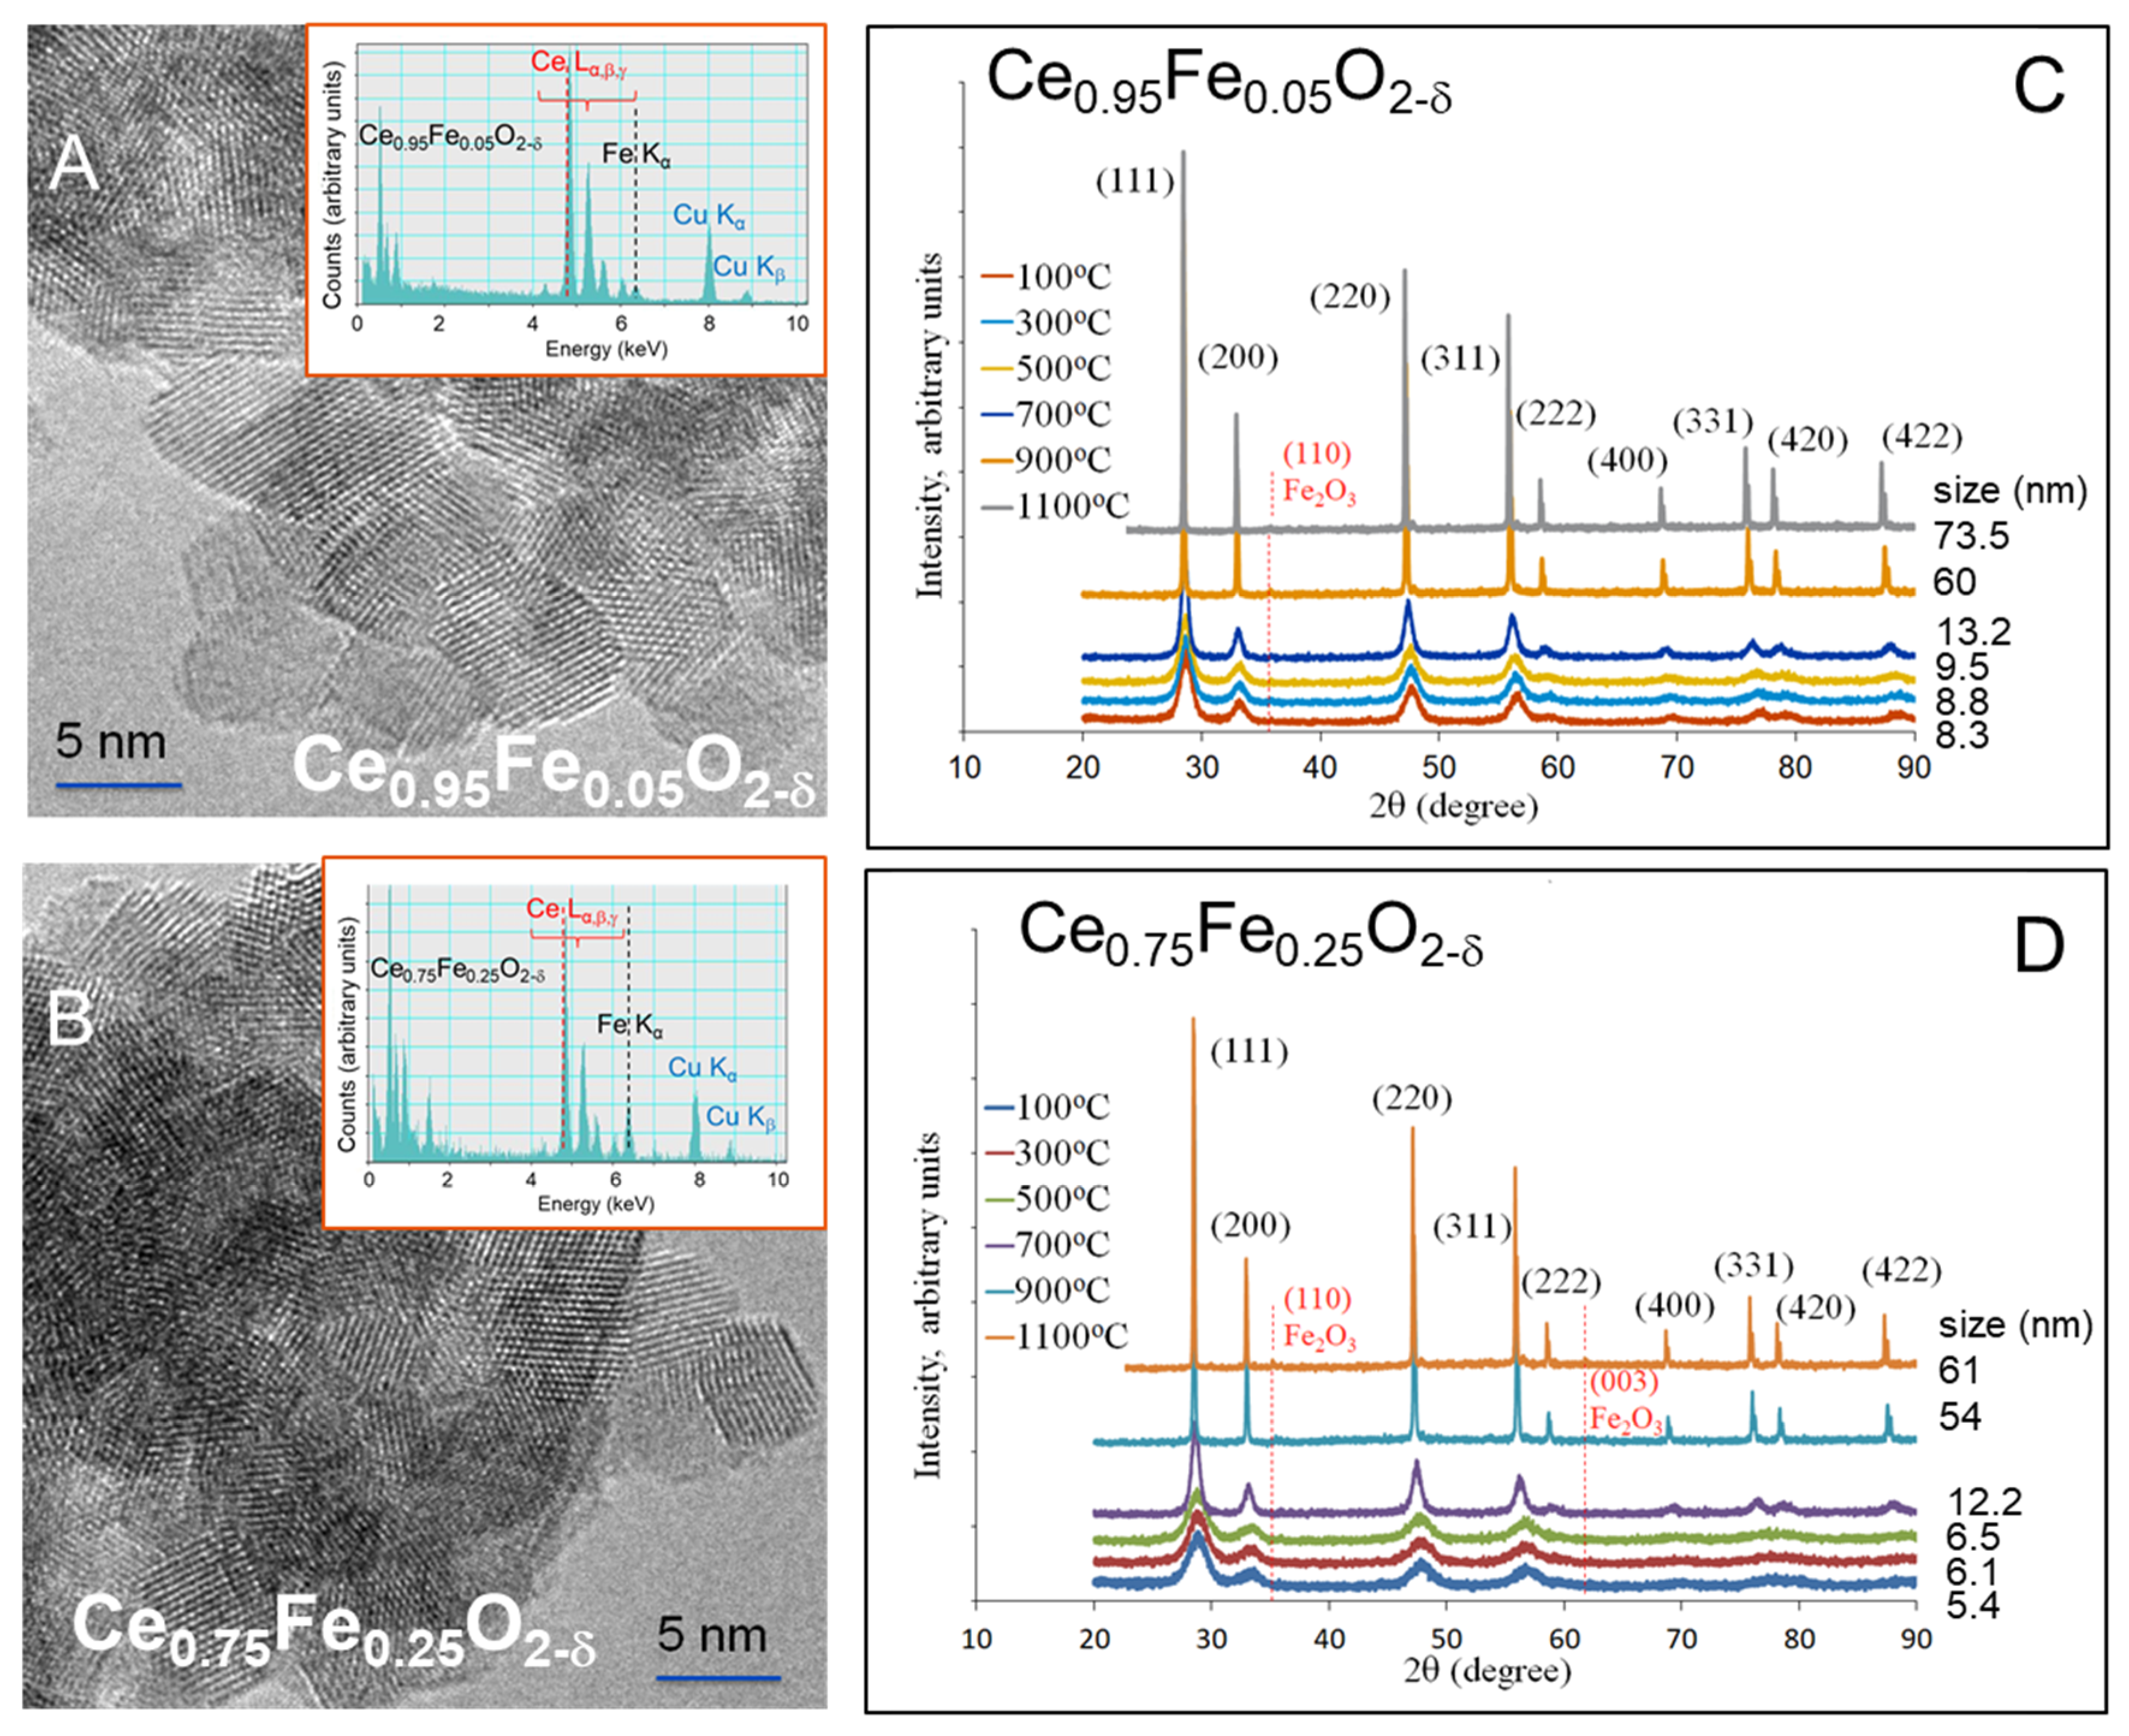
The prepared CeO2 and Fe-substituted CeO2 were studied in some detail previously by TEM, EELS, XRD and TPR, among other methods [17]. Figure 1 gives a brief description of Ce0.95Fe0.05O2-δ and Ce0.75Fe0.25O2-δ. Both oxides are composed of small crystallites upon calcination (500 °C). These were about 8 and 5 nm in size for Ce0.95Fe0.05O2-δ and Ce0.75Fe0.25O2-δ, respectively. The TEM images show that they are dominantly (111) terminated. These crystals are identical to those of CeO2 [17], which is composed of crystallites of about 14 nm in size. The decrease in crystallite sizes upon Fe substitution is also similar to that previously reported by others [32]. This is most likely due to the change in ionicity of the sol–gel medium during the precipitation [33]. Also, as seen, the only observed phase (XRD, TEM) is the fluorite one. The unit cells show a slight decrease due to Fe substitution (0.543, 0.539 and 0.536 nm for CeO2, Ce0.95Fe0.05O2-δ and Ce0.75Fe0.25O2-δ, respectively). As shown in Figure 1C,D, up to 700 °C, there is a gradual, small increase in the lattice and crystallite sizes. An abrupt change occurs at 900 °C, where considerable sintering is seen and is accompanied by the appearance of lines due to Fe oxides, indicating the beginning of the phase segregation process, which was accentuated by 1100 °C.
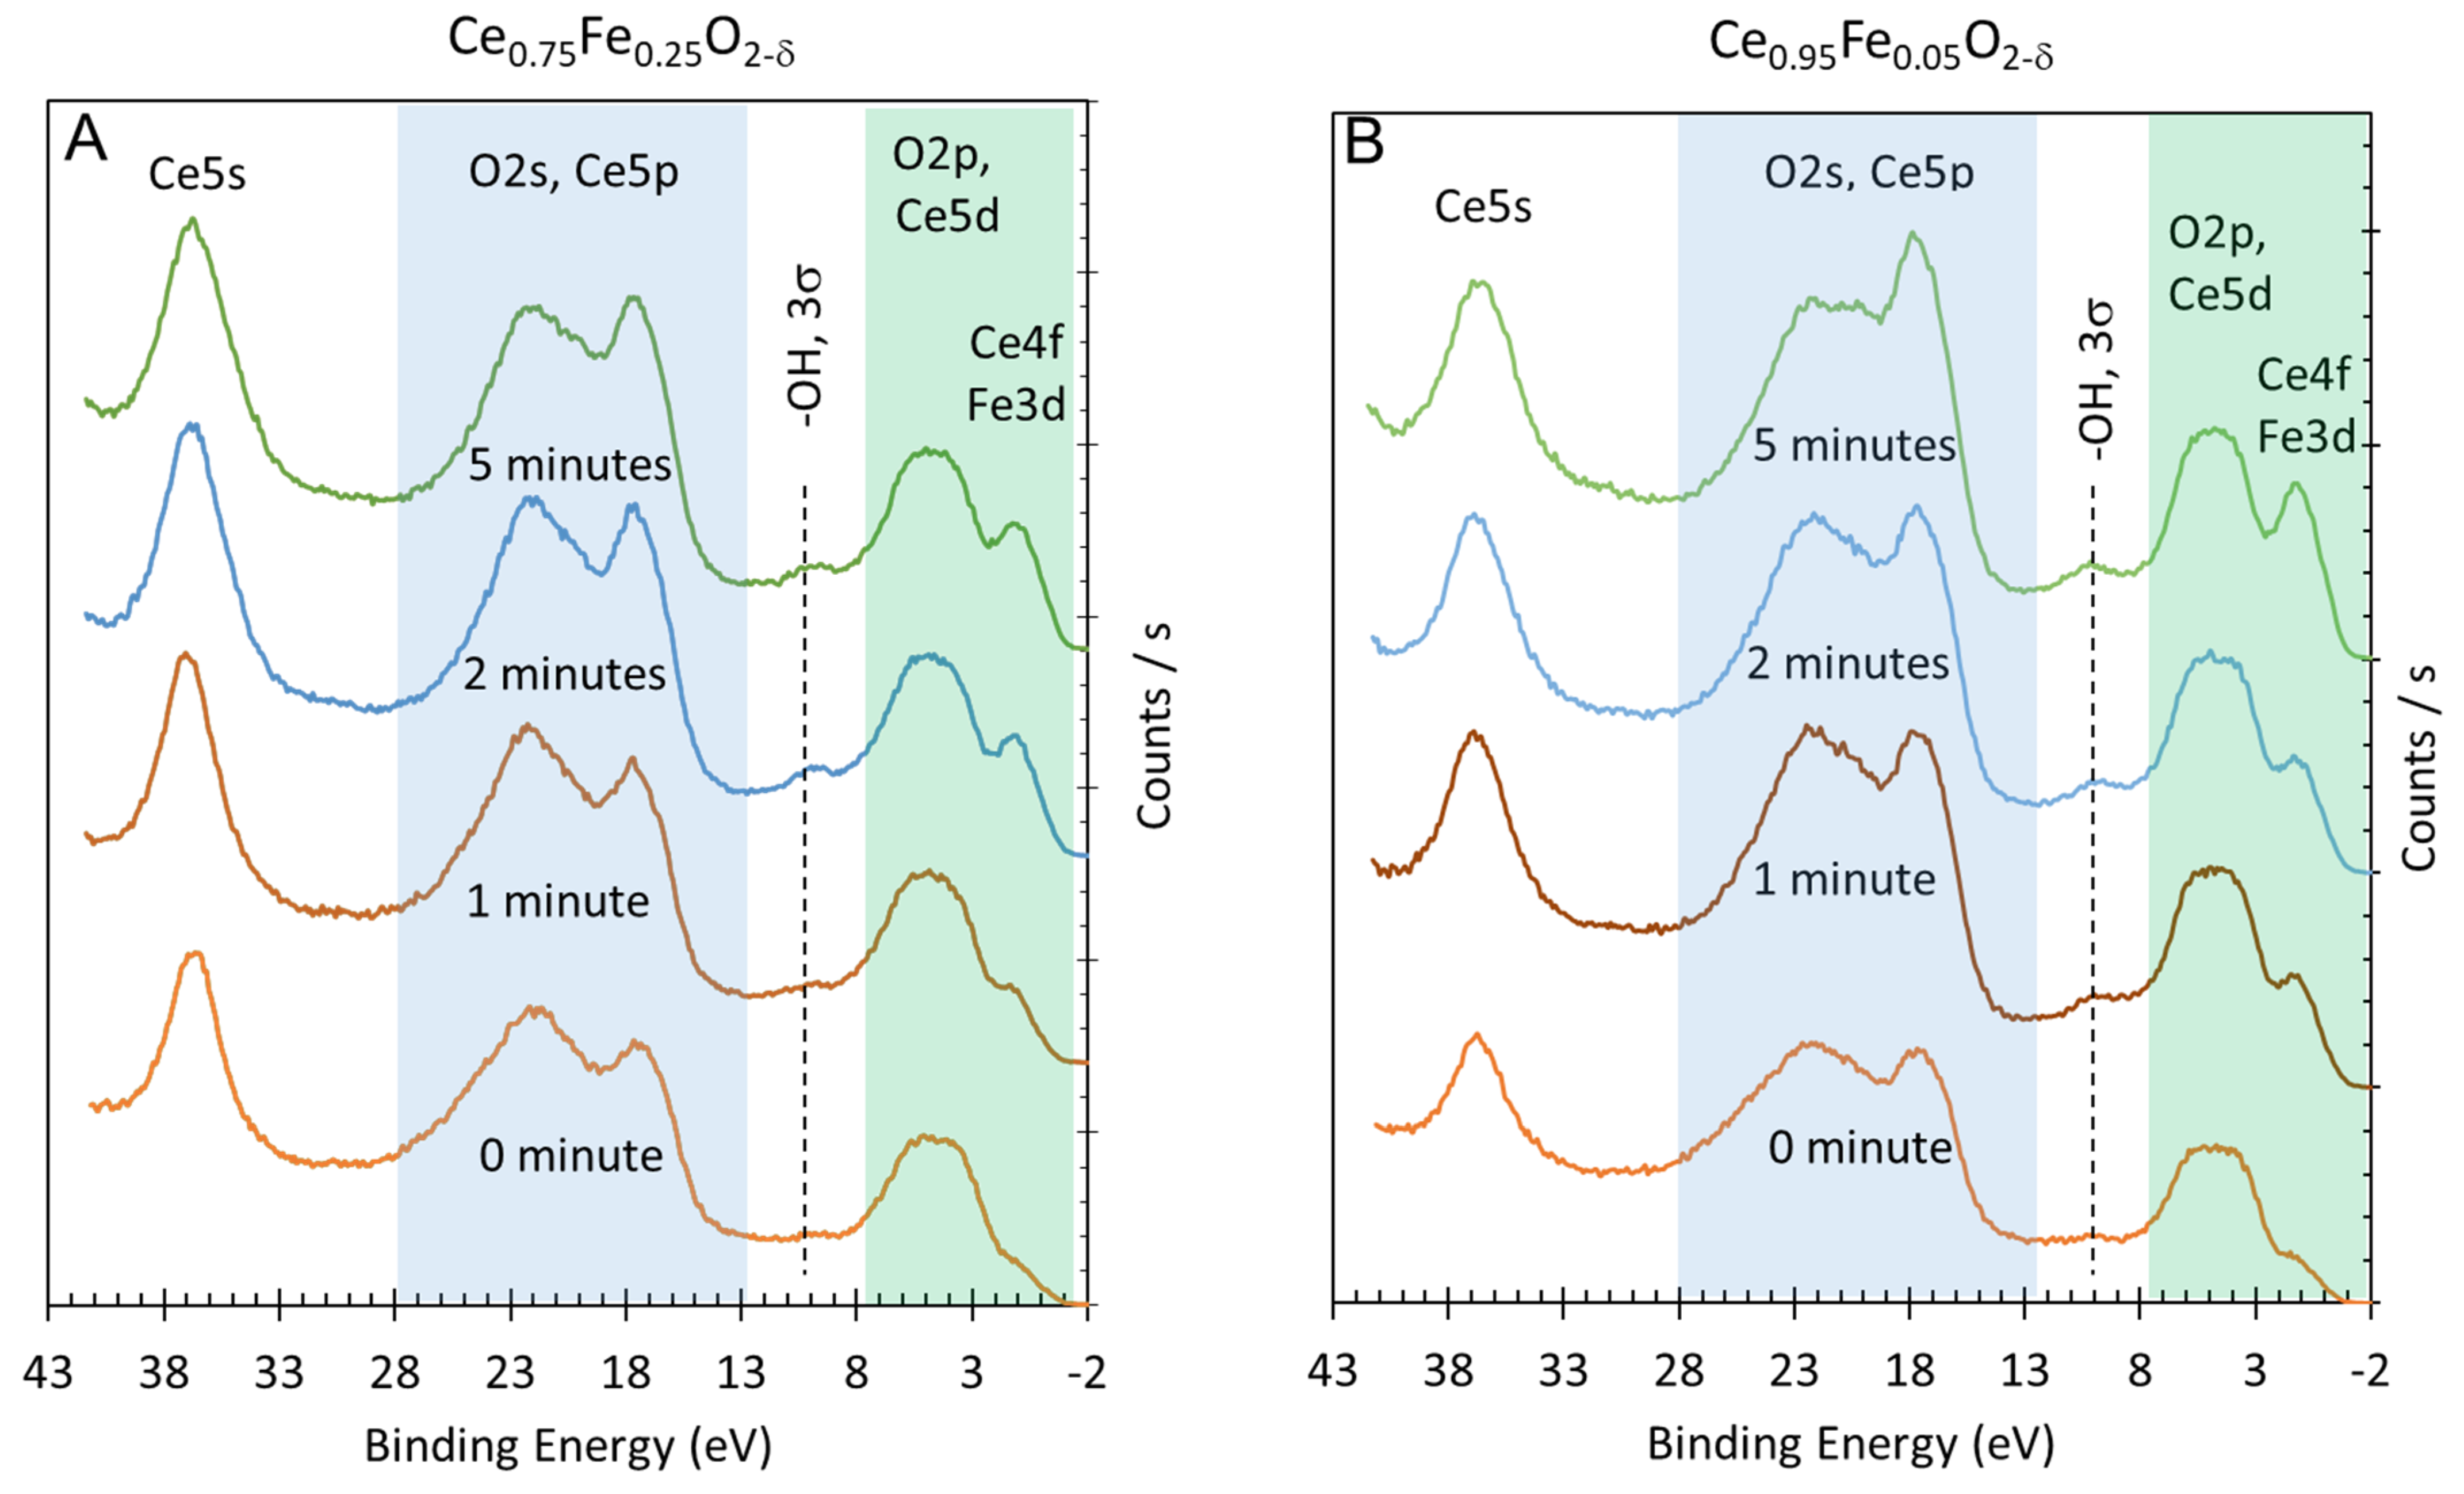
Figure 2A,B present the valence band and shallow core levels (Ce5p, O2s, and Ce5s) of Ce0.75Fe0.25O2-δ and Ce0.95Fe0.05O2-δ before and after 1, 2 and 5 min of argon ion sputtering. The reduction of the oxides was conducted by Ar ion sputtering. This method has advantages and disadvantages when compared to hydrogen reduction or thermal reduction. Thermal reduction of these oxides requires heating to at least 1500 °C. The mixed oxide at this temperature largely segregates, and therefore, the analysis would not be useful. Reduction using molecular hydrogen in UHV is not possible because of its very low sticking coefficient on oxides. It is possible to reduce oxides with atomic hydrogen, but this method was not available. Argon ion sputtering to reduce oxides relies on the mass difference between the metal cation and oxygen anions and the stability of the reduced phase thus created at given experimental conditions. Ce3+, Fe2+, and Fe0 are stable in UHV conditions. In other words, once formed, not much change is seen within the investigation time (a few hours). The drawback of Ar ion sputtering is the loss of surface structure (the formation of an amorphous layer due to the high energy ion bombardment used, in this work, 1 kV).
The initial spectra of the as-prepared oxides (0 min) are dominated by the O2p, O2s, Ce5p and Ce5s lines and are hardly distinguishable for both oxides. There are traces of unavoidable surface hydroxyls (-OH, 3 σ) at a binding energy of ca. 10 eV and some contribution from reduced Ce cations (Ce4f, Ce3+) and reduced Fe cations (Fe3d, oxidation state < +3), both below the O2p band with a binding energy of 0.5–2 eV. Upon argon ion sputtering, three changes are noticeable: (i) An increase in the signal before the O2p reductions (due to increased concentrations of Ce3+ and Fe+x, x < +3). (ii) An increase in surface hydroxyls. (iii) A relative increase in Ce5p signal with respect to the O2s signal. For (i), the increase is expected and is treated in more detail in this work to extract quantitative information. For (ii), the increase has been seen before and is linked to the increase in the sticking coefficient of dissociatively adsorbed water (in the background) over a reduced metal oxide when compared to its stoichiometric form. The ion bombardment causes a reduction due to oxygen removal (as atoms), and the remaining electrons (two for each oxygen atom removed) are transferred to Ce4+ (and Fe3+) to reduce them. The creation of the oxygen vacancy leads to the preferential dissociative adsorption of a water molecule. This results in the formation of two pairs of surface hydroxyls for each oxygen vacancy healed. This is not the purpose of this study and will not be further treated. For (iii), this observation is unexpected and is treated here qualitatively.
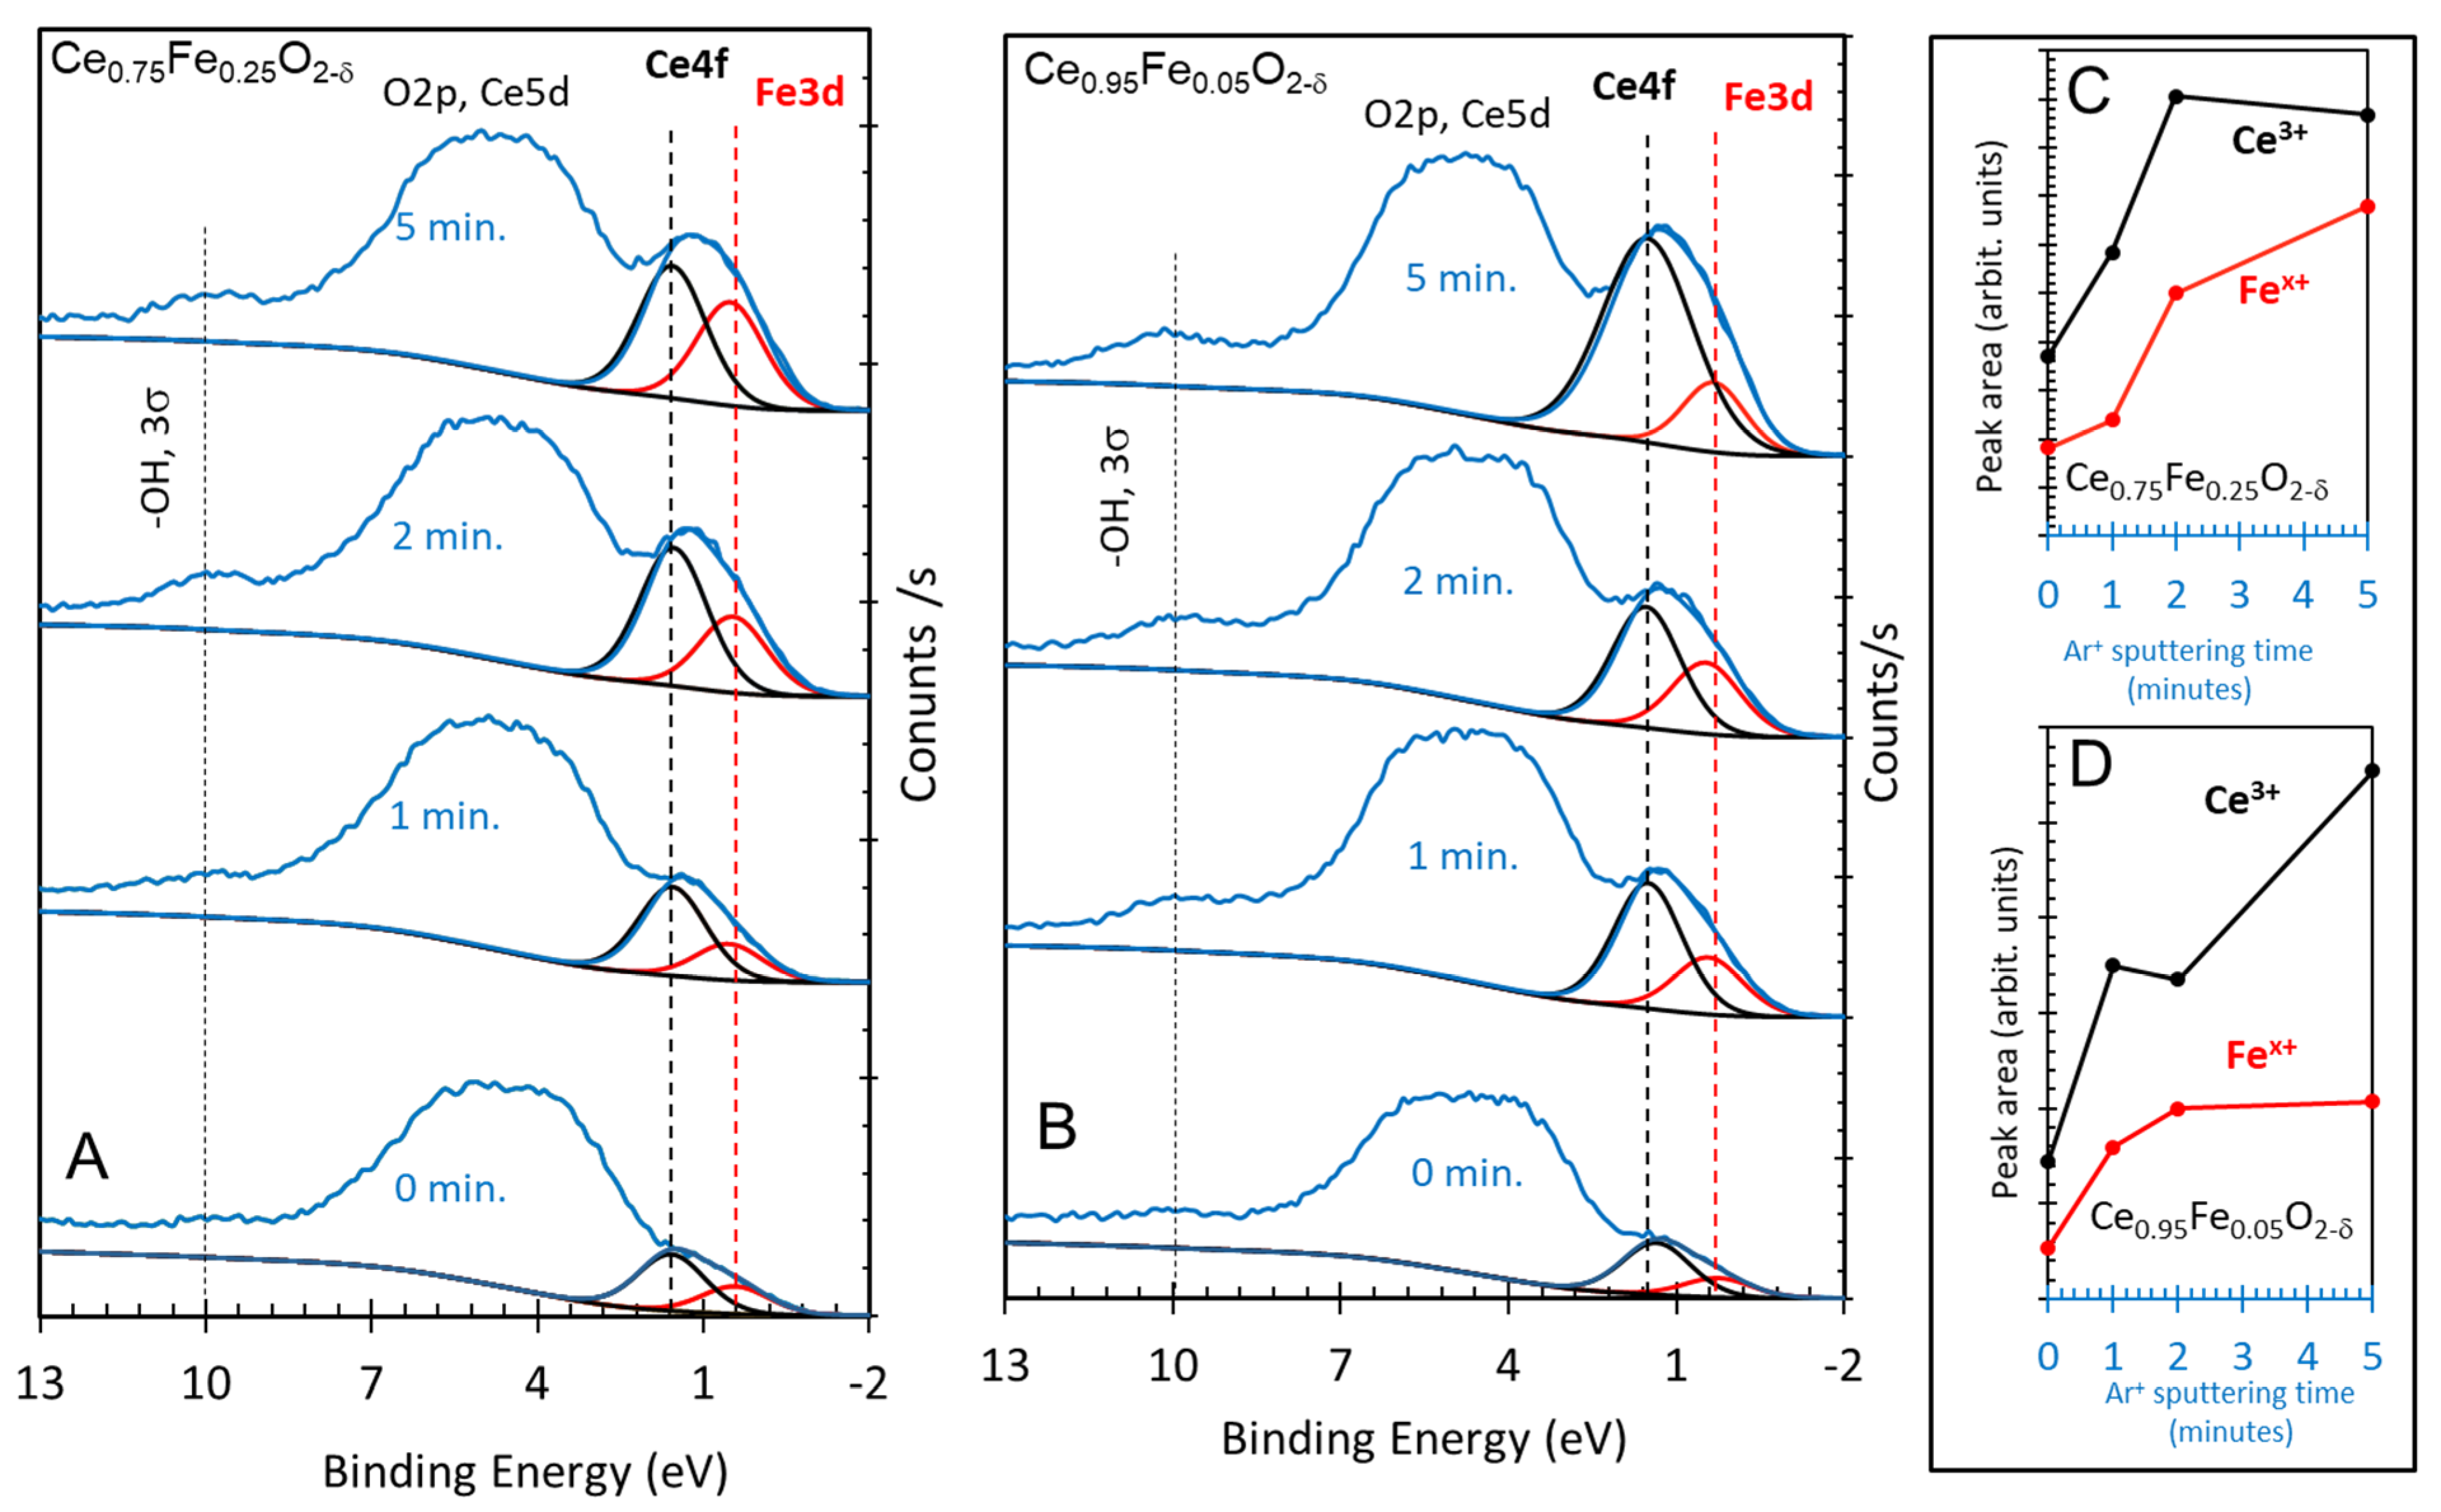
Figure 3A,B present the valence band region, in which the signal below the O2p orbital was fitted by two peaks: the first at about 0.4 eV and the second at ca. 1.5 eV below the Fermi level. There are no noticeable changes in the large O2p lines’ shapes with sputtering time. For both oxides, the signal attributed to the Ce4f orbital is higher than that of the Fe3d orbital. The increase of the XPS Ce4f signal upon reduction is more pronounced in the case of a low Fe concentration when compared to the other oxides. This is consistent with the other core levels (see below) as well as with the TCWS results (also see below). Computing the peak areas of the two peaks seems to indicate that there is no incentive to further reduce Ce cations with a higher % of Fe. At a low Fe %, increasing the reduction time affects mostly the Ce cations, while at a higher Fe %, it favors Fe reduction. This might be simply due to the probability of hitting the atoms during bombardment. At a high Fe %, the probability of oxygen removal adjacent to Fe atoms is high, and therefore more Fe is reduced, while at a low Fe %, the oxide is more homogeneous and the chemical effect on the reduction is higher.
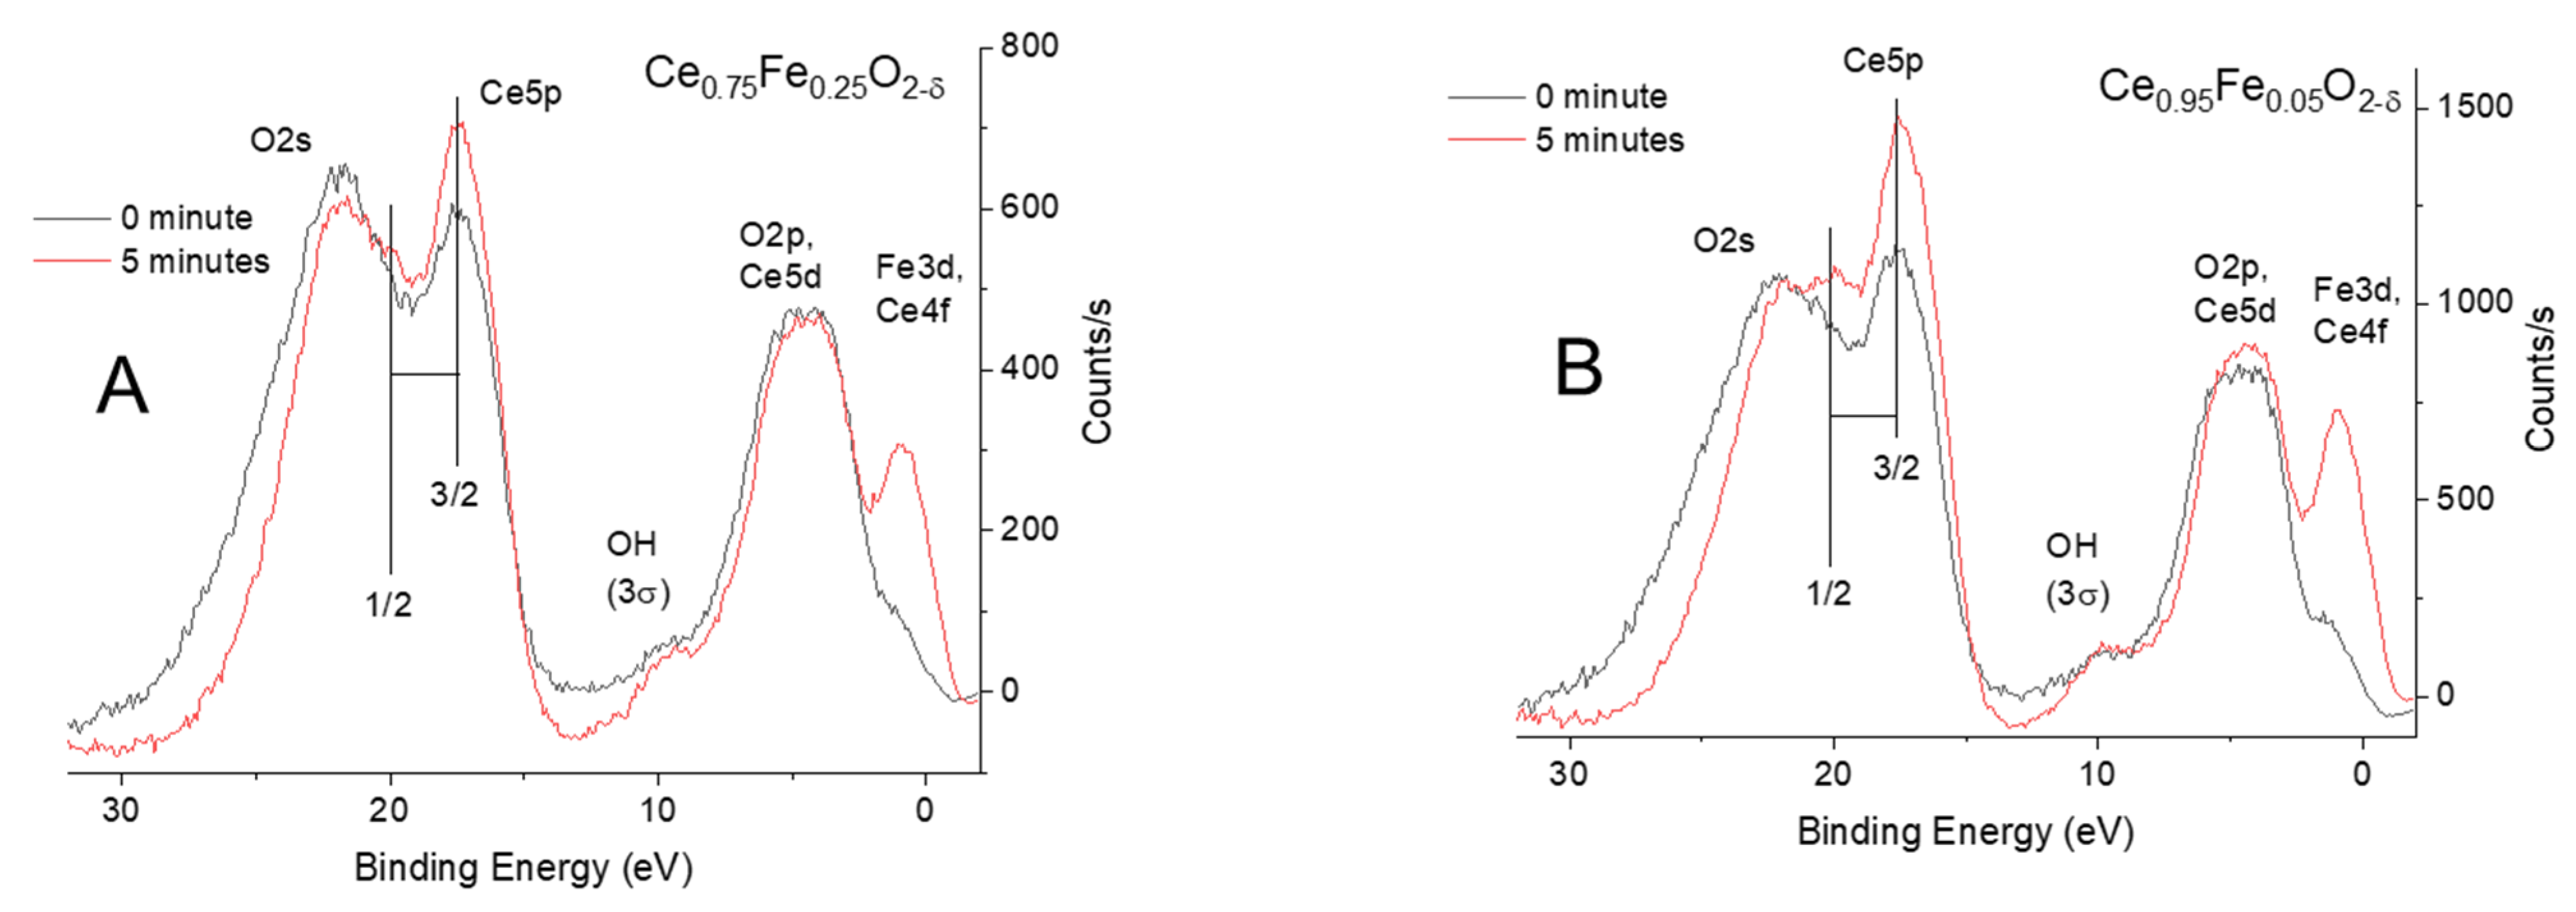
Figure 4A,B present the valence band together with the Ce5p and O2s lines. The spectra are baseline-subtracted and then normalized to highlight the differences. The ion sputtering of both oxides results in a preferential increase in the Ce5p signal when compared to the O2s lines. In addition, the O2s line becomes narrower upon ion sputtering. There is no noticeable shift in the binding energy before or after ion bombardment. Similar experiments were conducted on CeO2, and no change was seen (SI Figure S1). Obtaining quantitative information from polycrystalline oxides is more difficult because of the unavoidable grain boundary effect (channeling) and shadowing, both of which would make ion sputtering less efficient when compared to sputtering thin films or single crystals. Nevertheless, some qualitative information may be drawn from comparisons to previous work conducted by others. One of the most relevant to this present work is a study on the ion bombardment [34] of CeO2, in which it was shown (Figure 3a,b of ref. [34]) that the relative ratio is indeed increased in favor of the Ce5p orbital. The exact position of the O2s orbital with respect to the Ce5p1/2 orbital is not clear. In this work, it is put after the Ce5p1/2 lines in line with other work, although others have put it in between the Ce5p3/2 and Ce5p1/2 energy positions based on the relativistic computation of CeO8 and Ce63O216 clusters [35]. One of the motivations of studies of the O2s and Ce5p lines is charge transfer, where these lines, because of their quasi-degenerate energy positions, are sensitive to the oxidation state of Ce cations. The spectra in Figure 4 are similar to those reported for a thin film of CeO2 grown on Rh(111) [36] excited with photon energy equal to 125 eV (Ce4d-Ce4f resonance). The spectra are also similar to those of irradiated (with Xe ions) CeO2 thin film and bulk [34]. The authors pointed out the final state effect (3d94f1OVMO−1 (outer valence molecular orbital, OVMO) and 3d95p5np1 (inner valence molecular orbital, INVO)). In another work [33], the authors indicated the Ce5p atomic orbitals participate in the formation of both OVMO and IVMO, where a large part of the latter is taken by the filled Ce5p1/2, 5p3/2 and O2s atomic shells.
The spectra in Figure 4 are fitted in Figure S2. Four peaks are considered (Ce5p3/2,1/2 and two for O2s). The two O2s peaks are for the two different (bulk and surface oxygen atoms) environments and are separated by about 2.5 eV (similar to the O1s signal). It is to be noted that similar attribution was given for the O2s signal to clean and glycine-dosed surfaces, where the high-binding O2s line is due to surface hydroxyls and carboxylates [37].
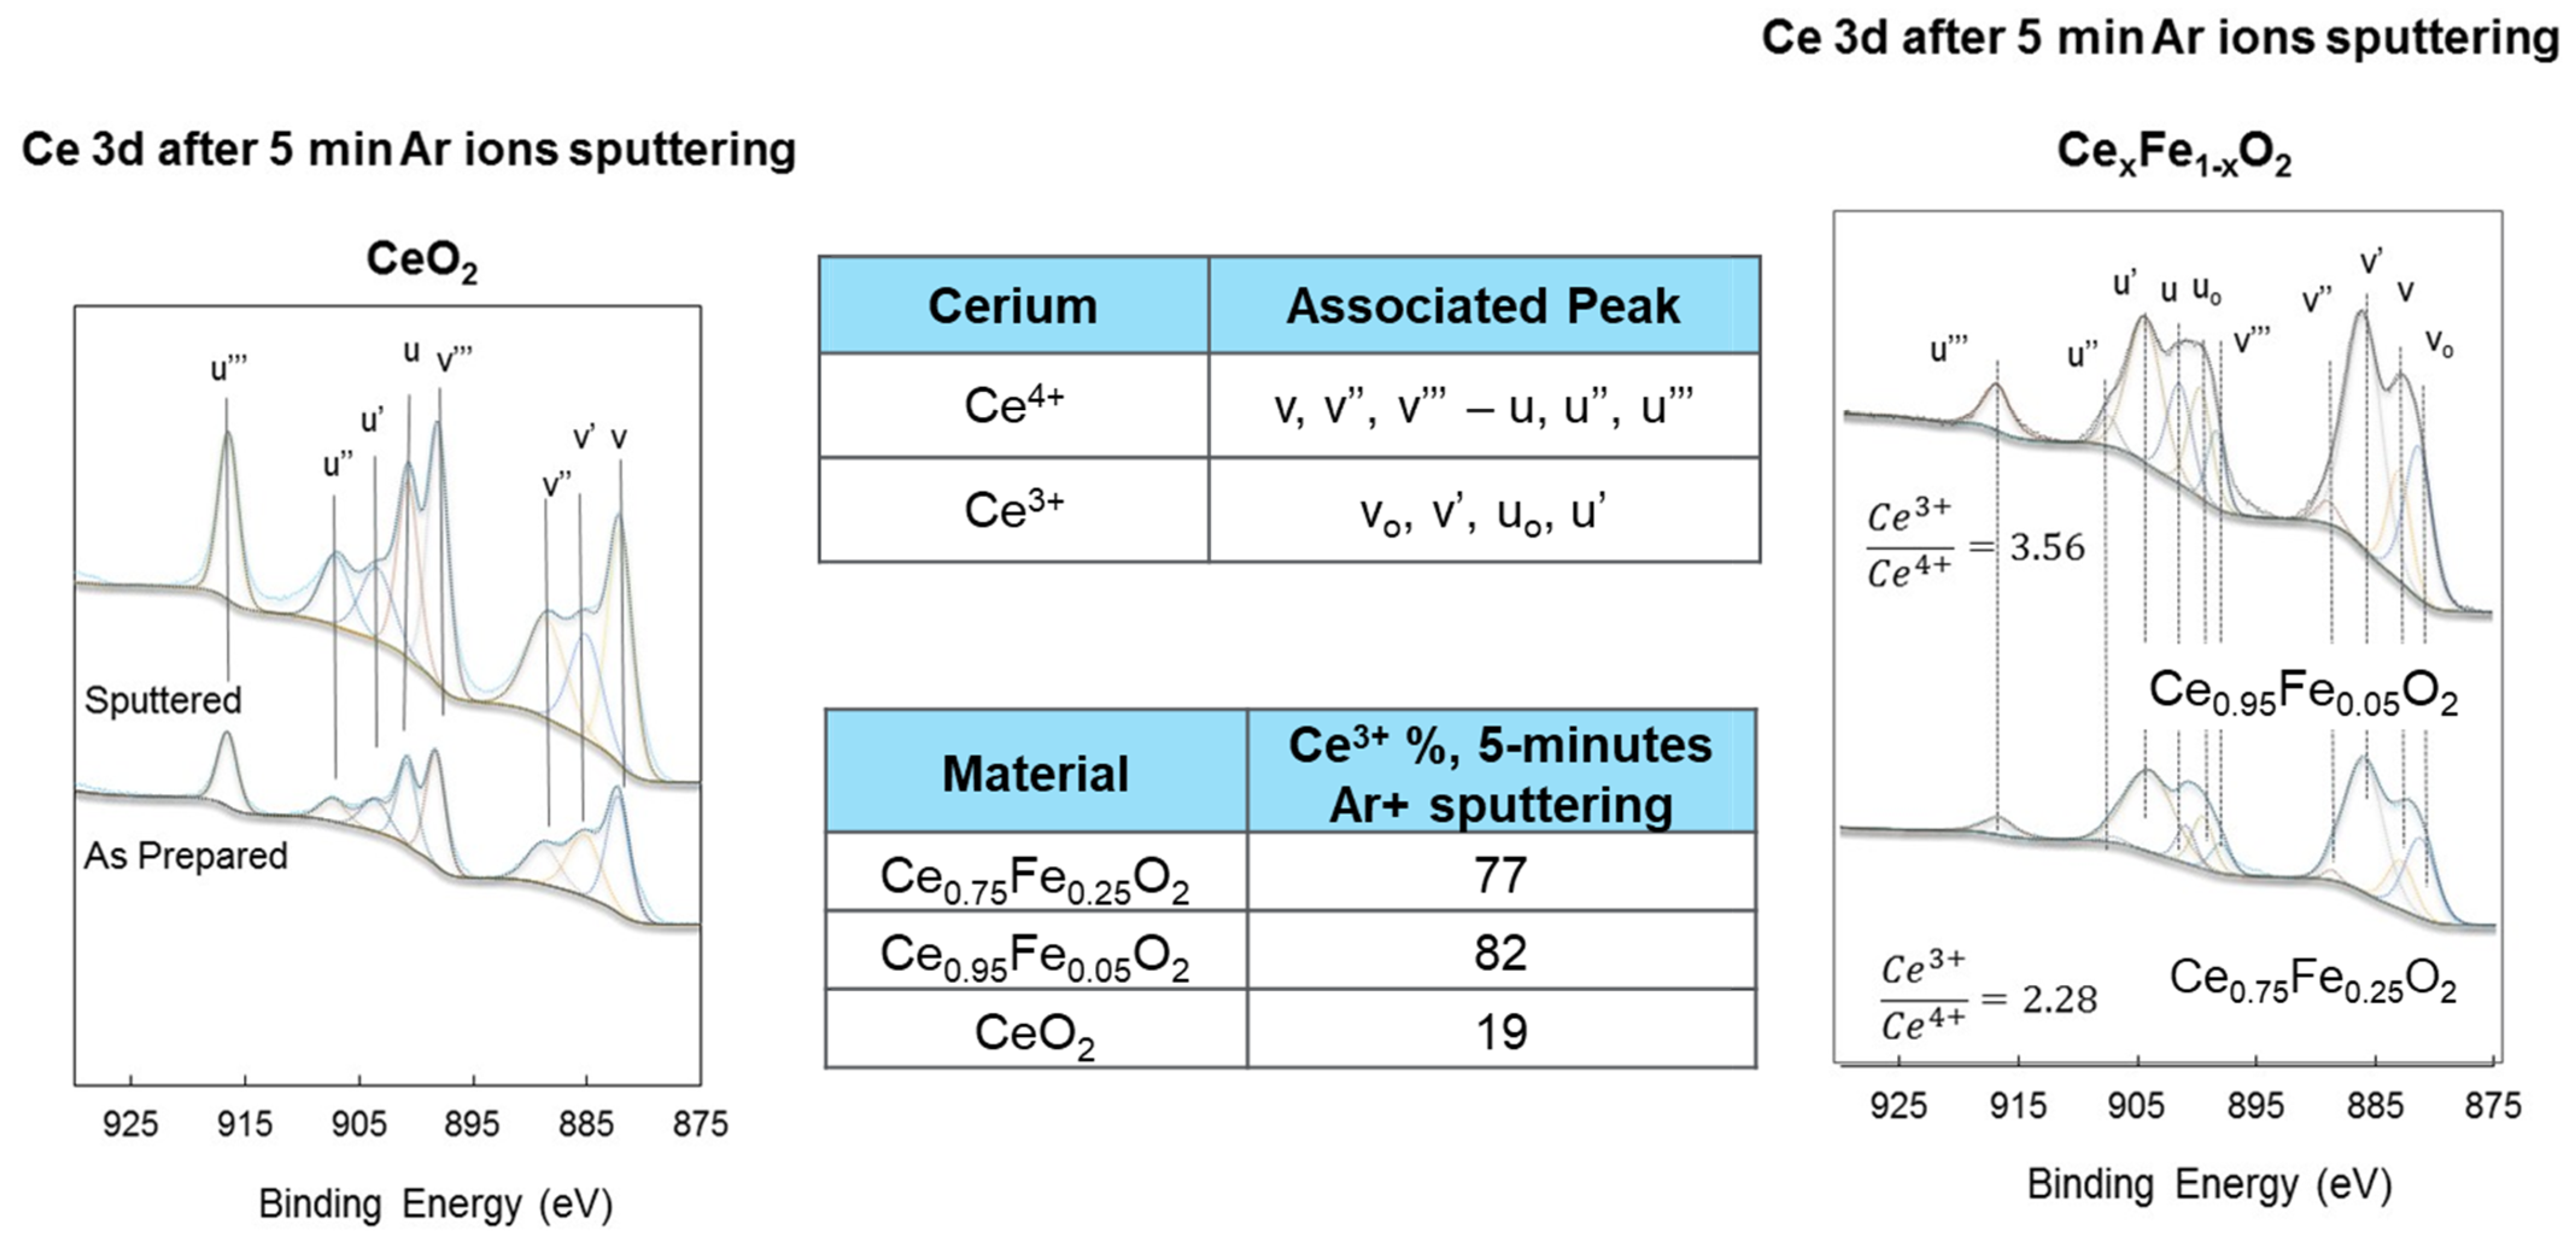
Figure 5 presents the XPS Ce3d spectra of the Ce cations in the fresh and Ar-ion-reduced samples. The presence of both oxidation states of Ce cations is clear even in the freshly prepared oxides. However, in this case, the Ce3+ cation concentration is small, and they most likely reside in deeper layers below the surface. In Figure 5 the lines’ positions and attributions are shown (3d5/2: u, u′′ and u′′′, and 3d3/2: v, v′′ and v′′′ for Ce4+ cations, and 3d5/2: uo and u′ and 3d3/2: vo and v′ for Ce3+ cations). Upon fitting these peaks, information can be obtained. In Figure 5 and the inset table, a comparison between the fresh and the most reduced samples is made. The presence of Fe at a 5% concentration resulted in a more pronounced Ce3+ concentration when compared to the presence of Fe at a 25% concentration. This is in line with the valence band results presented in Figure 2 and Figure 3. CeO2 alone showed a very mild increase upon reduction; this is also in line with the virtually no change in the Ce5p/O2s lines in Figure 1. Ar ion sputtering relies on the momentum transfer of incoming ions (in this case, 1 keV of kinetic energy), which results in breaking the chemical bonds. As such, there should be no difference between CeO2 and Fe-substituted CeO2 since the incoming ions have much more energy than the chemical bond, assuming complete energy transfer. However, this is a cascade reaction where the energy transfer occurs consecutively, and therefore the last steps of an incoming ion (before it leaves the material or is implanted in it irreversibly) would be more efficient for weaker bonding. This is particularly important for polycrystalline nanoparticles, where interparticle pore diffusion dominates.
Based on the Ce4f/O2p, Ce5p/O2s and Ce3d (for Ce4+ and Ce3+) XPS signals, Table 1 is constructed to provide an estimate of the reduction of Ce cations in this work.
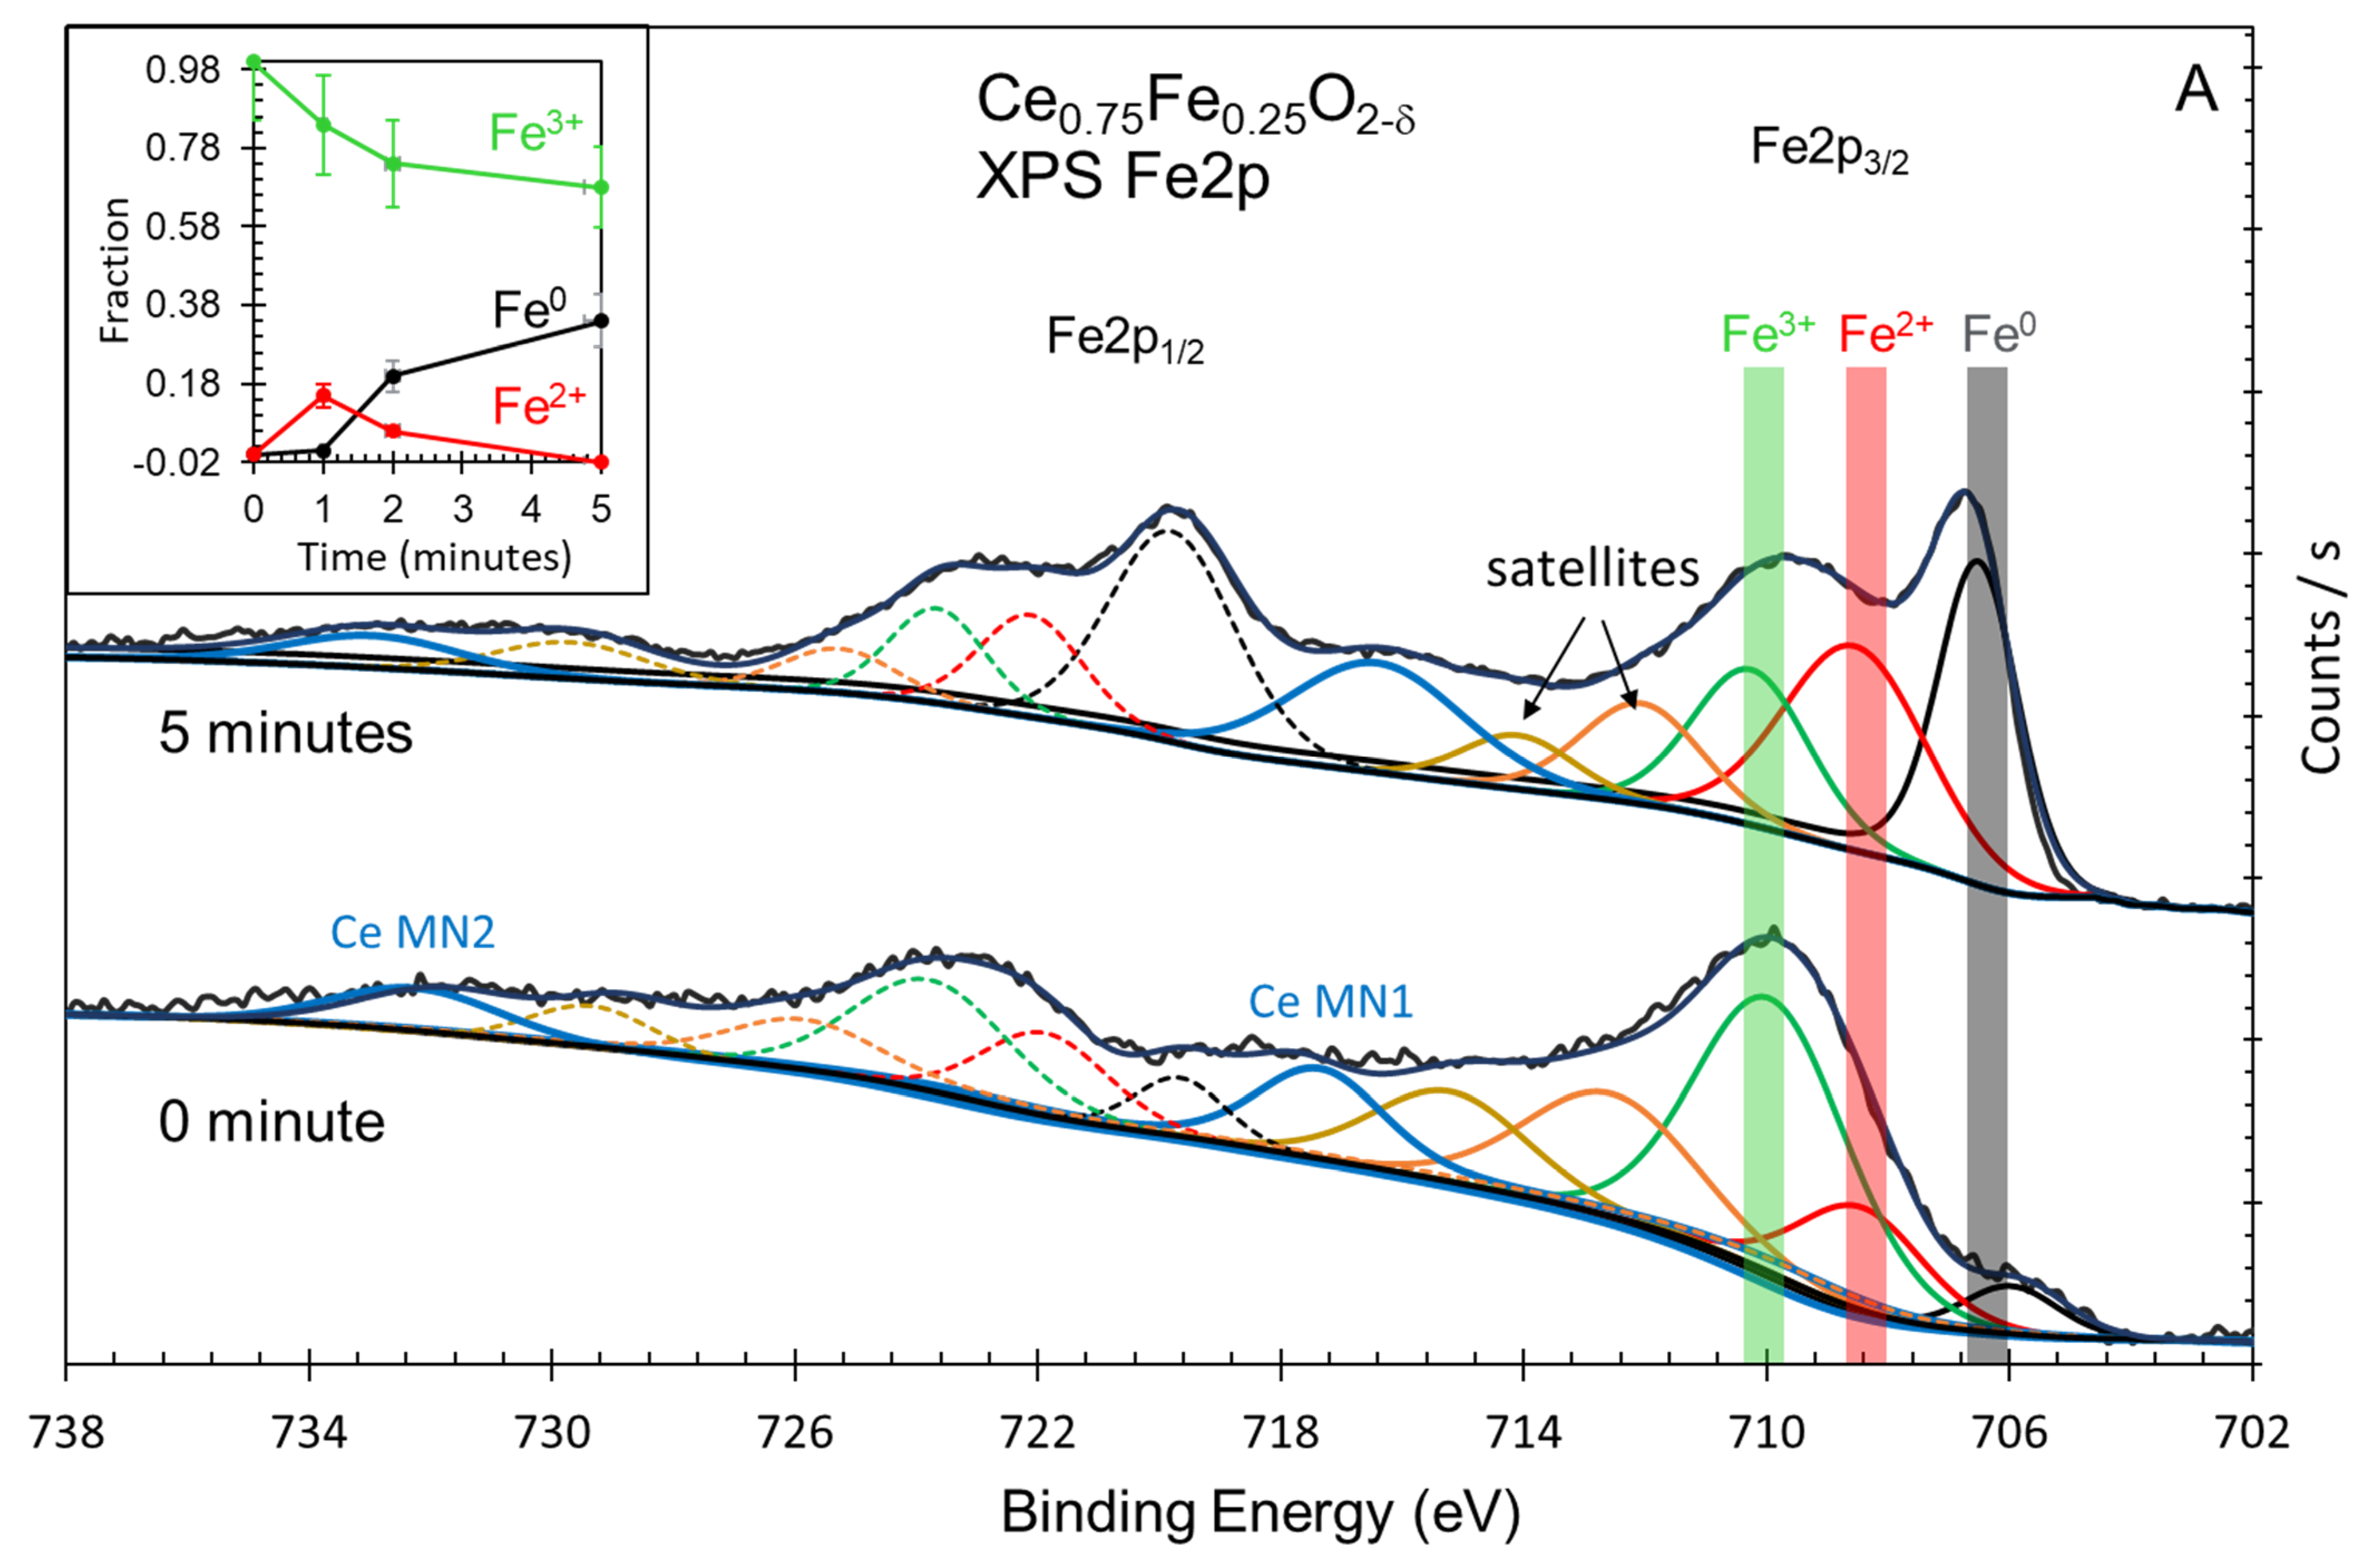
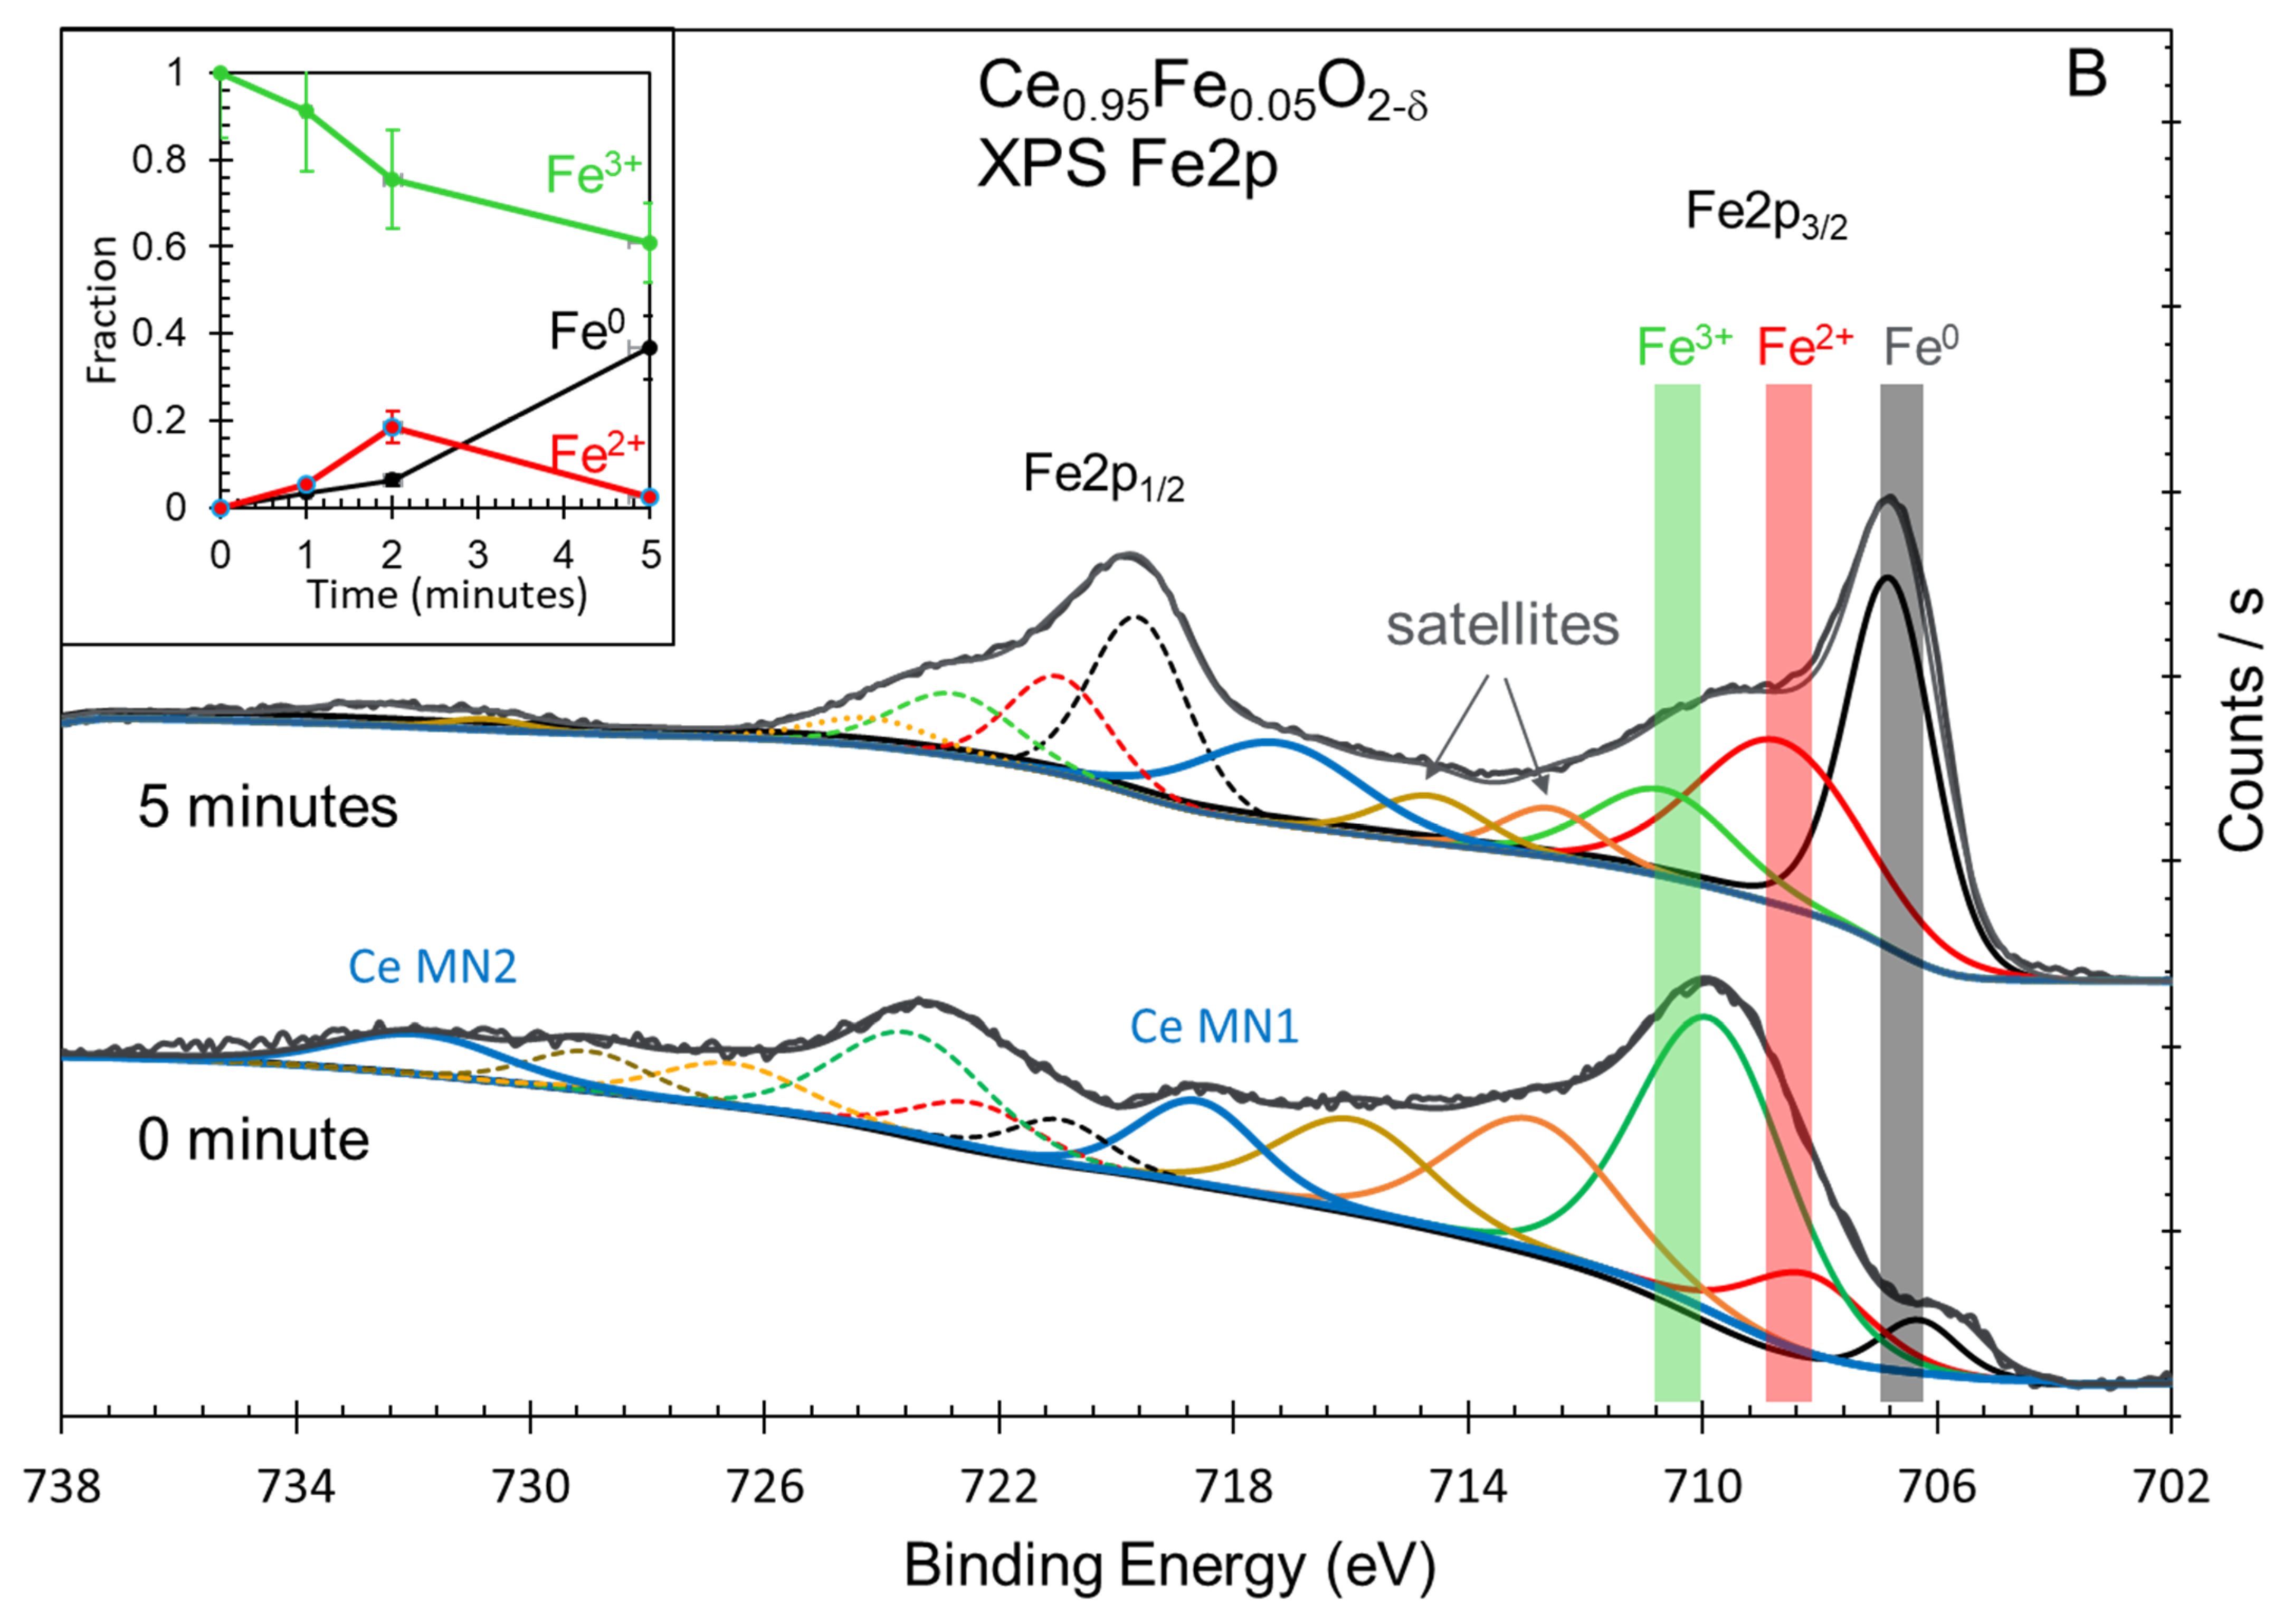
The XPS core levels of iron oxides are among the most studied for oxides [38]. There are three common oxidation states for the oxides: Fe3+, such as in Fe2O3, Fe2+, such as in FeO, and Fe3O4, in addition to metallic Fe. The spectra are complicated by the presence of satellites [39,40,41], iron hydroxide (FeOOH) [42,43] and many multiplets [44]. The binding energy of the XPS Fe2p signal is about 707 eV for metallic iron, 710 eV for Fe2+ and 711 eV for Fe3+ cations. In the present study, a further complication arises from the presence of Ce Auger lines in the Fe2p region. Moreover, although charge neutralization was used, the as-prepared oxide always had wider peaks when compared to that reduced upon ion sputtering. Therefore, peak areas are to be taken with an estimate of 20% errors and binding energies within a 0.5 eV accuracy. Both oxides show very similar spectra and trends upon reduction. While, as expected, the as-prepared oxides contained Fe3+ cations, they, however, also contained Fe2+ and some metallic iron. Some small % of Fe2+ might be formed during the preparation (Figure 6). The presence of metallic iron was not expected and is most likely due to interstitial atoms formed due to strong lattice distortion. The insets in both figures show the trend during the reduction. It was opted chose to subtract the Fe2+ and Fe0 contributions of the as-prepared oxides to see the trend. In both cases, the amount of Fe2+ increases, similar to a previous study [45], then decreases to zero, indicating that within the reduction time studied, all reducible Fe3+ cations were transformed to metallic Fe. In line with the valence band results, it appears that both Ce4+ and Fe3+ cations are more efficiently reduced when in small amounts (Fe0.05), as seen in Figure 6B, although the difference is not dramatic.
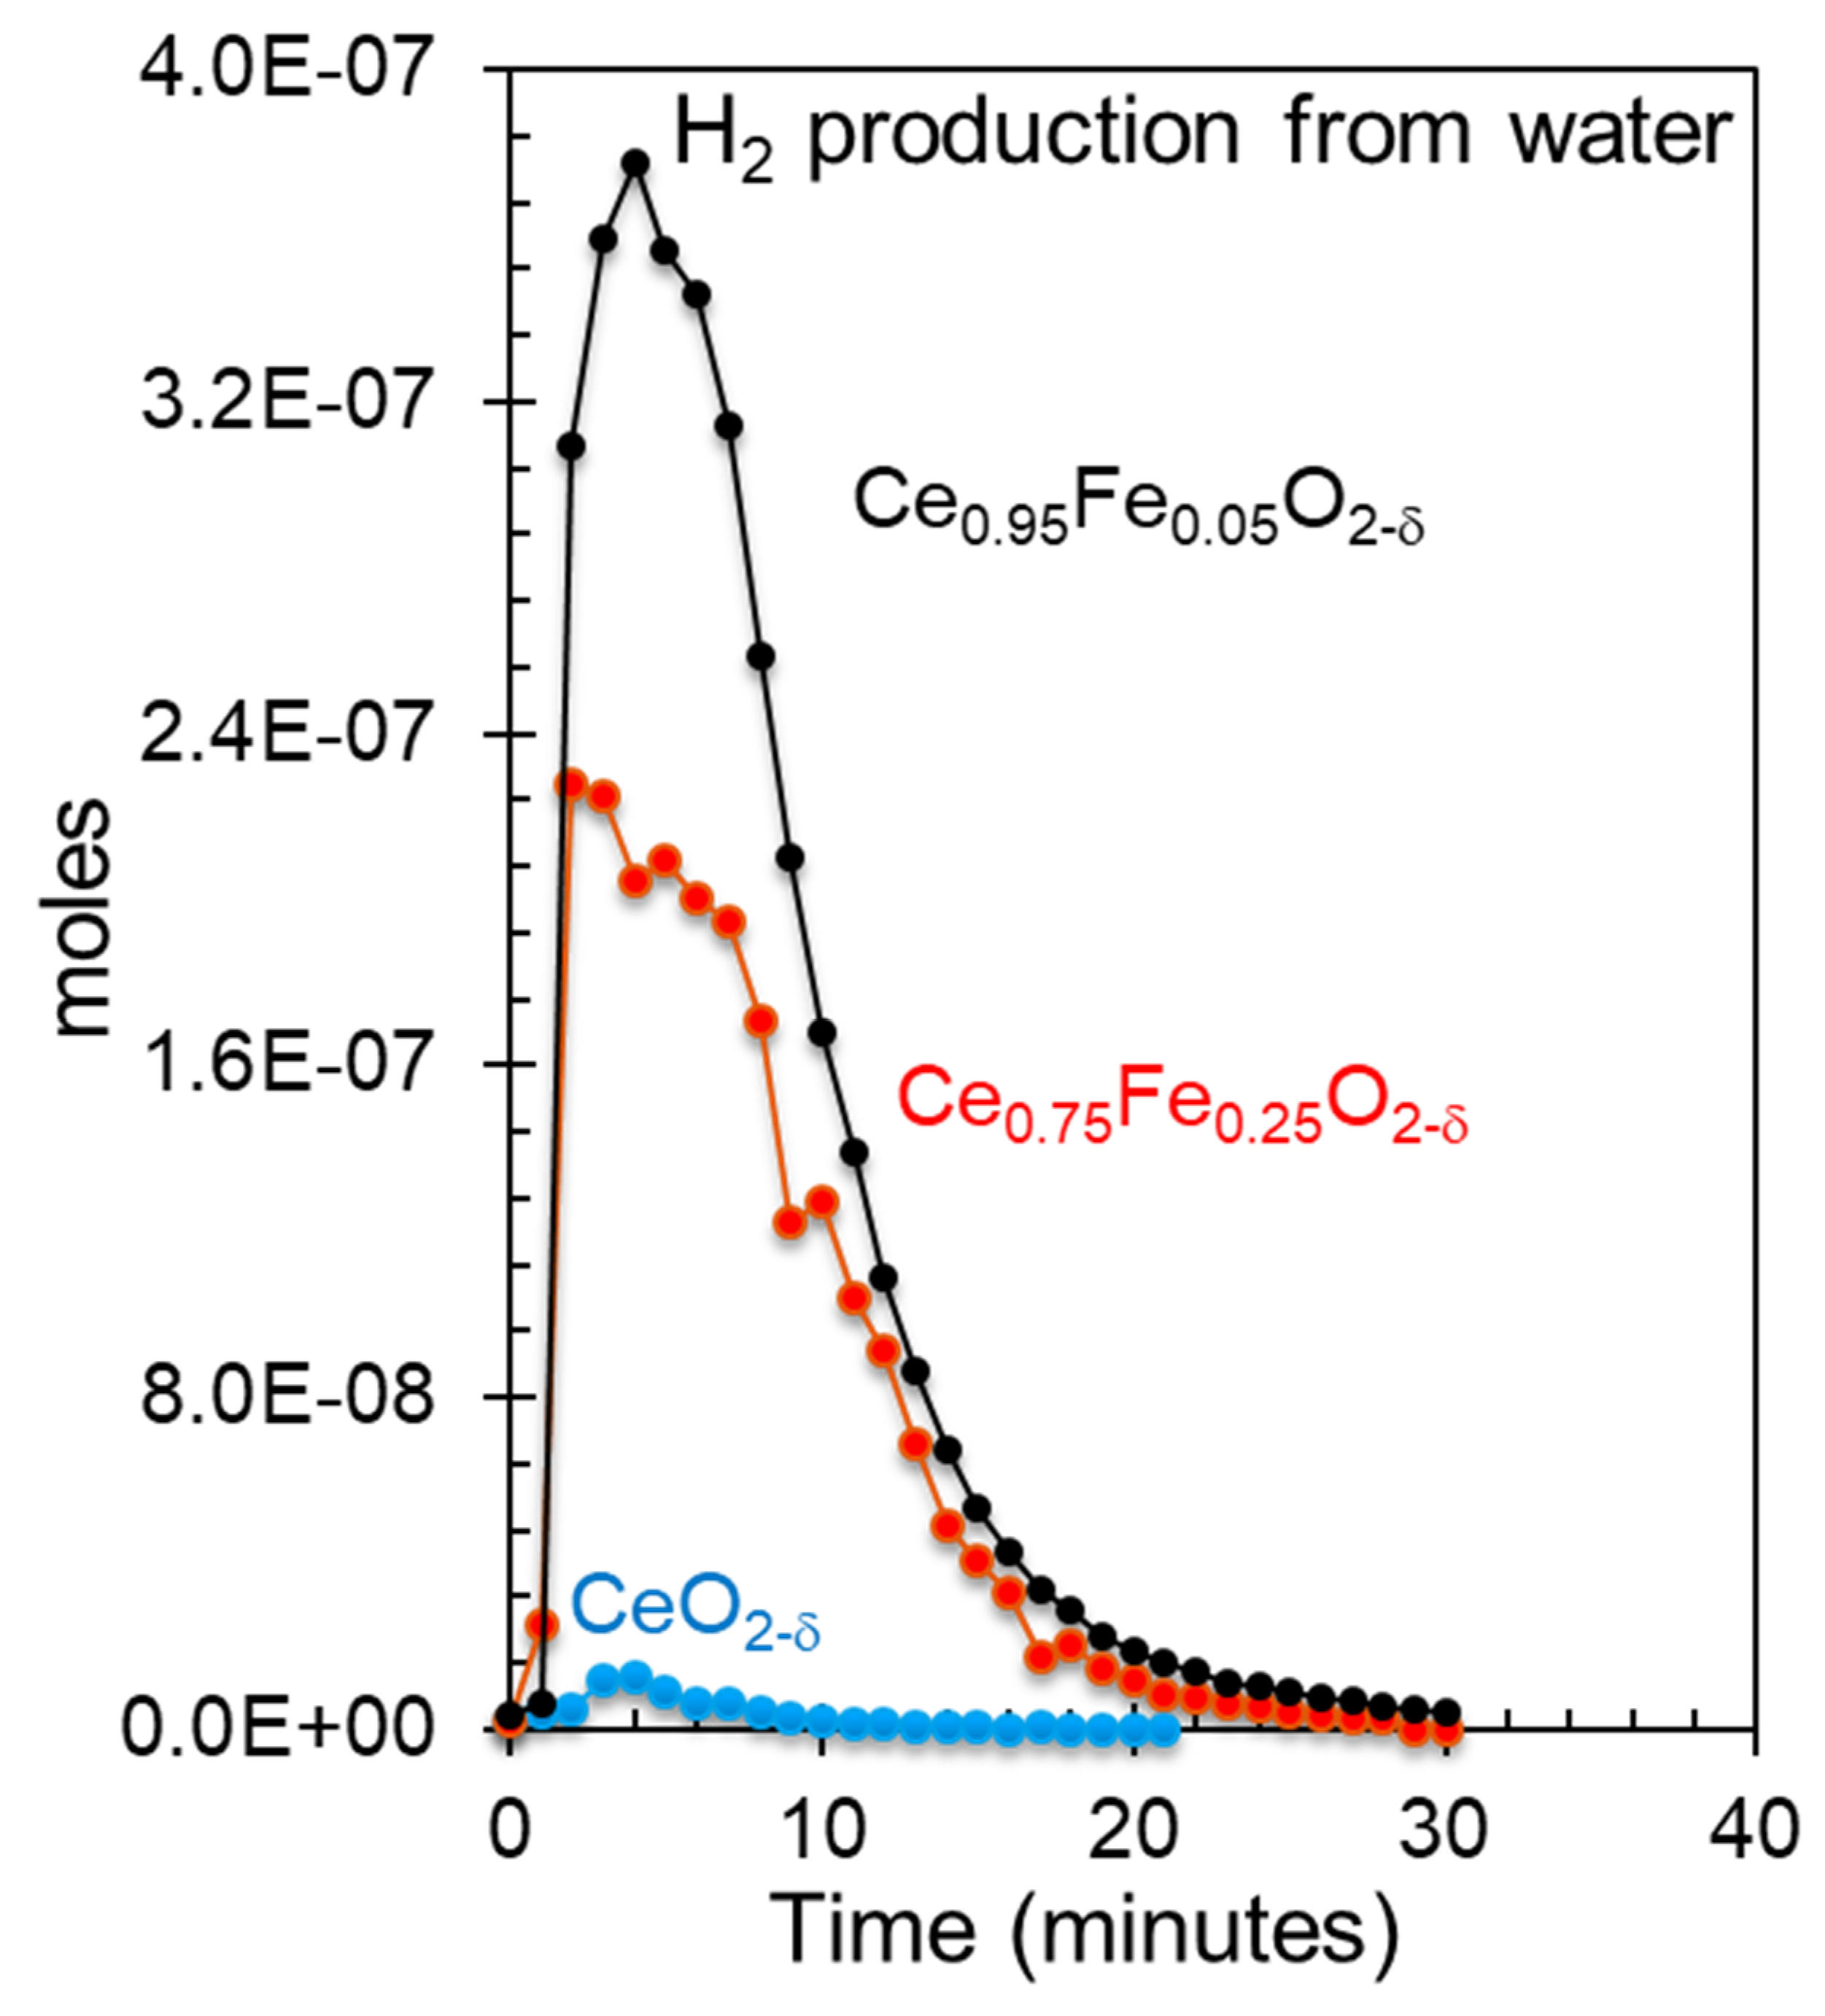
Figure 7 presents the hydrogen production of the three oxides from water at 700 °C. The point of the figure is to relate the production to the observed reduced states of the oxides. Because, as indicated, the two mixed oxides are not segregated when heated to this temperature, a link to the spectroscopic measurements would be relevant even though, as such, it is not practical (since the oxides were previously reduced with molecular hydrogen). CeO2 alone shows negligible activity, while the Fe-substituted cerium oxides are active (the production is given in Table 1). The activity of the Ce0.95Fe0.05O2-δ catalyst is almost twice that of the Ce0.75Fe0.25O2-δ catalyst. This suggests that the activity is more linked to Ce3+ than to Fe0 (based on the XPS Ce3d and XPS Ce5p/O2s spectra). This is because the content of Fe0 in both reduced oxides was similar (XPS Fe2p), while that of Ce3+ was higher for Ce0.95Fe0.05O2-δ than for Ce0.75Fe0.25O2-δ.
3. Experimental Section
The CeO2, Ce0.95Fe0.05O2-δ and Ce0.75Fe0.25O2-δ catalysts were synthesized by the co-precipitation method already presented in other work [17]. In brief, cerium (III) nitrate hexahydrate (from Sigma Aldrich, St. Louis, MO, USA) was dissolved in deionized water alone or together with the needed amount of iron (III) nitrate (from Sigma Aldrich). NH4OH, used as a precipitating agent (70 vol. %), was added to the solution containing the metal cations while stirring until a pH > 9 was reached. After the filtration of the precipitate, it was washed using deionized water until a neutral pH was obtained. The precipitate (in the form of metal hydroxides) was then dried in an oven at 100 °C overnight, then crushed, loaded into a crucible and calcined in air at 500 °C for 12 h with a temperature ramp of 15 °C min−1.
X-ray diffraction (XRD) data were collected using a PANalytical EMPYREAN diffractometer (Malvern, UK) in Bragg–Brentano geometry with Cu Kα excitation at 45 kV and 40 mA and a linear position-sensitive detector. The diffractometer was configured with a 0.25° diverging slit, a 0.5° anti-scattering slit, 2.3° Soller slits, and a Ni filter. Data were acquired in continuous scanning mode over the 2θ range 10–90° at a step interval of 0.01° and 0.5 s per step.
Transmission electron microscopy (TEM) studies were conducted using a Titan ST microscope (FEI company, Hillsboro, OR, USA). It operated at an accelerating voltage of 300 kV and was equipped with a field emission electron gun, a 4k×4k CCD camera, a Gatan imaging filter (GIF), and a Gatan microscopy suite (GMS).
X-ray photoelectron spectroscopy (XPS) was conducted using a Thermo scientific ESCALAB 250 Xi. Spectra (Waltham, MA, USA) were calibrated with respect to the C1s line at 284.7 eV. The Fe2p, O1s, Ce3d, Ce4d, C1s, O2s, Ce5s, Ce5p, and the valence band (O2p, Ce4f and Fe3d) binding energy regions were scanned. The typical acquisition conditions were as follows: pass energy = 20 eV and scan rate = 0.1 eV per 200 ms. Ar+- bombardment was conducted with an EX06 ion gun at a 1 kV beam energy and a 10 mA emission current. The sputtered area of 900 × 900 μm2 was larger than the analyzed area of 600 × 600 μm2. Self-supported oxide disks, approximately 0.5 cm in diameter, were loaded into the chamber. Data acquisition was carried out using the Avantage Data System V5 software. Charge neutralization was used for all the samples (1 eV).
The water-splitting experiments were conducted as follows: 0.25 g of the metal oxide (CeO2, Ce0.95Fe0.05O2-δ or Ce0.75Fe0.25O2-δ) was put in a tubular quartz reactor (1/4″ O.D.), then heated to 700 °C for three hours under a hydrogen flow of 20 mL/min at one atmosphere. Then, at 700 °C, the hydrogen flow was stopped and replaced by N2 at a flow of 30 mL/min. This continued for a period (typically 60 min) until no hydrogen was detected from the line using an online Gas Chromatograph (GC). The GC was equipped with a Thermal Conductivity Detector (TCD) to monitor molecular hydrogen. Hydrogen was analyzed with a Haysep Q packed column (2 m long, 1/8″ O.D.) at 45 °C connected to the TCD by using N2 as a carrier gas. Once the complete reactor system was under pure N2, the reaction was started by adding 3 vol. % of steam into the N2 flow, which was sent in a continuous mode to the reactor. Pulses (of 0.5 mL each) from the reactor outlet were sent to the GC via a six-way valve during the reaction. The reaction continued until no hydrogen (from the water) was detected due to the complete oxidation of the oxide material. The reaction typically took 30 min.
All experimental work was conducted at the SABIC research centers of KAUST and Riyadh.
4. Conclusions
In this work, the extent of reduction by Ar ion sputtering of metal cations in CeO2, Ce0.95Fe0.05O2-δ and Ce0.75Fe0.25O2-δ is studied by core and valence level spectroscopy. This is conducted to further study the reasons for the increased reaction rates of thermal water splitting when a fraction of Ce cations in CeO2 are substituted with Fe cations. Ar ion sputtering resulted in an increase in the intensity of the Ce4f lines at about 1.5 eV below the Fermi level when compared to the O2p lines. Moreover, the XPS Ce5p/O2s ratio was found to be sensitive to the degree of reduction, which is attributed to a higher charge transfer from the oxygen to Ce ions upon reduction. This increase is concomitant with the increase in the XPS Ce3d spectra of the fraction of Ce3+. Both increases are found to be higher for reduced Ce0.95Fe0.05O2-δ when compared to Ce0.75Fe0.25O2-δ. On the other hand, the XPS Fe2p spectra showed no preferential increase between the two mixed oxides. Because water splitting to molecular hydrogen was found to be higher on Ce0.95Fe0.05O2-δ than on Ce0.75Fe0.25O2-δ, it is postulated that the active sites for the reaction are those of Ce3+ cations and not metallic Fe.
Supplementary Materials
The following supporting information can be downloaded at https://www.mdpi.com/article/10.3390/inorganics12020042/s1: Figure S1. Normalized XPS Ce5p and O2s spectra of as-prepared CeO2 after 5 min of argon ion sputtering. Figure S2. Curve fitting of the XPS Ce5p and O2s peaks for the fresh samples A and C and argon-ion-sputtered samples B and D, Ce0.95Fe0.05O2-δ and Ce0.75Fe0.25O2-δ, respectively.
Funding
This research received no external funding.
Data Availability Statement
Data can be requested directly from the author.
Acknowledgments
The author thanks Yahya Al-Salik (SABIC, STC-KAUST) for preparing the mixed oxides and for his technical help throughout the study and Toseef Ahmed (SABIC, STC-Riyadh) for the XPS data acquisition.
Conflicts of Interest
The author declares no conflicts of interest. SABIC was not involved in the study design, analysis, interpretation of data, the writing of this article or the decision to submit it for publication.
References
- Trovarelli, A. Catalytic Properties of Ceria and CeO2-Containing Materials. Catal. Rev. Sci. Eng. 1996, 38, 439–520. [Google Scholar] [CrossRef]
- Yang, C.; Lu, Y.; Zhang, L.; Kong, Z.; Yang, T.; Tao, L.; Zou, Y.; Wang, S. Defect Engineering on CeO2-Based Catalysts for Heterogeneous Catalytic Applications. Small Struct. 2021, 2, 2100058. [Google Scholar] [CrossRef]
- Torrente-Murciano, L.; Garcia-Garcia, R.R. Effect of nanostructured support on the WGSR activity of Pt/CeO2 catalysts. Catal. Commun. 2015, 71, 1–6. [Google Scholar] [CrossRef]
- Idriss, H. Oxygen vacancies role in thermally driven and photon driven catalytic reactions. Chem. Catal. 2022, 2, 1549–1560. [Google Scholar] [CrossRef]
- Onigbajumo, A.; Swarnkar, P.; Will, G.; Sundararajan, T.; Taghipour, A.; Couperthwaite, S.; Steinberg, T.; Rainey, T. Techno-economic evaluation of solar-driven ceria thermochemical water-splitting for hydrogen production in a fluidized bed reactor. J. Clean. Prod. 2022, 371, 133303. [Google Scholar] [CrossRef]
- Chueh, W.C.; Falter, C.; Abbott, M.; Scipio, D.; Furler, P.; Haile, S.M.; Steinfeld, A. High-flux solar-driven thermochemical dissociation of CO2 and H2O using nonstoichiometric ceria. Science 2010, 330, 797–801. [Google Scholar] [CrossRef]
- Alifanti, M.; Baps, B.; Blangenois, N.; Naud, J.; Grange, P.; Delmon, B. Characterization of CeO2-ZrO2 Mixed Oxides. Comparison of the Citrate and Sol-Gel Preparation Methods. Chem. Mater. 2003, 15, 395–403. [Google Scholar] [CrossRef]
- Andersson, D.A.; Simak, S.I.; Skorodumova, N.V.; Abrikosov, I.A.; Johansson, B. Redox properties of CeO2–MO2 (M = Ti, Zr, Hf, or Th) solid solutions from first principles calculations. Appl. Phys. Lett. 2007, 90, 031909. [Google Scholar] [CrossRef]
- Diagne, C.; Idriss, H.; Kiennemann, A. Hydrogen Production by Ethanol Reforming over Rh/CeO2-ZrO2 Catalysts. Catal. Commun. 2002, 3, 565–571. [Google Scholar] [CrossRef]
- Grau-Crespo, R.; de Leeuw, N.H.; Hamad, S.; Waghmare, U.V. Phase separation and surface segregation in ceria–zirconia solid solutions. Proc. R. Soc. A 2011, 467, 1925–1938. [Google Scholar] [CrossRef]
- Hanken, B.E.; Stanek, C.R.; Grønbech-Jensen, N.; Asta, M. Computational study of the energetics of charge and cation mixing in U1−xCexO2. Phys. Rev. B 2011, 84, 085131. [Google Scholar] [CrossRef]
- Scaranto, G.; Idriss, H. The Effect of Uranium Cations on the Redox Properties of CeO2 Within the Context of Hydrogen Production from Water. Top. Catal. 2015, 58, 143–148. [Google Scholar] [CrossRef]
- Al-Shankiti, I.; Al-Otaibi, F.; Al-Salik, Y.; Idriss, H. Solar thermal hydrogen production from water over modified CeO2 materials. Top. Catal. 2013, 56, 1129–1138. [Google Scholar] [CrossRef]
- Prieur, D.; Vigier, J.-F.; Popa, K.; Walter, O.; Dieste, O.; Varga, Z.; Beck, A.; Vitova, T.; Scheinost, A.; Martin, P. Charge distribution in U1−xCexO2+y nanoparticles. Inorg. Chem. 2021, 60, 14550–14556. [Google Scholar] [CrossRef] [PubMed]
- Gupta, A.; Waghmare, U.V.; Hegde, M.S. Correlation of Oxygen Storage Capacity and Structural Distortion in Transition-Metal-, Noble-Metal-, and Rare-Earth-Ion-Substituted CeO2 from First Principles Calculation. Chem. Mater. 2010, 22, 5184–5198. [Google Scholar] [CrossRef]
- Gupta, A.; Kumar, A.; Waghmare, U.V.; Hegde, M.S. Origin of activation of Lattice Oxygen and Synergistic Interaction in Bimetal-Ionic Ce0.89Fe0.1Pd0.01O2-δ Catalyst. Chem. Mater. 2009, 21, 4880–4891. [Google Scholar] [CrossRef]
- Al-Taweel, S.; Nadeem, M.A.; Idriss, H. A study of CexFe1−xO2 as a reducible oxide for the thermal hydrogen production from water. Energy Technol. 2022, 10, 2100491. [Google Scholar] [CrossRef]
- Cheng, L.; Yue, X.; Fan, J.; Xiang, Q. Site-Specific Electron-Driving Observations of CO2-to-CH4 Photoreduction on Co-Doped CeO2/Crystalline Carbon Nitride S-Scheme Heterojunctions. Adv. Mater. 2022, 34, 2200929. [Google Scholar] [CrossRef]
- Zhao, S.; Kang, D.; Liu, Y.; Wen, Y.; Xie, X.; Yi, H.; Tang, X. Spontaneous Formation of Asymmetric Oxygen Vacancies in Transition-Metal-Doped CeO2 Nanorods with Improved Activity for Carbonyl Sulfide Hydrolysis. ACS Catal. 2020, 10, 11739–11750. [Google Scholar] [CrossRef]
- He, W.; Ran, J.; Yang, G.; He, Z.; Huang, X.; Crittenden, J. Promoting effect of Co-doped CeO2 nanorods activity and SO2 resistance for Hg0 removal. Fuel 2022, 317, 123320. [Google Scholar] [CrossRef]
- Ahn, K.; Yoo, D.S.; Prasad, D.H.; Lee, H.-W.; Chung, Y.-C.; Lee, J.-H. Role of Multivalent Pr in the Formation and Migration of Oxygen Vacancy in Pr-Doped Ceria: Experimental and First-Principles Investigations. Chem. Mater. 2012, 24, 4261–4267. [Google Scholar] [CrossRef]
- Zhang, M.; Jiang, D.; Jiang, H. Enhanced oxygen storage capacity of Ce0.88Mn0.12Oy compared to CeO2: An experimental and theoretical investigation. Mater. Res. Bull. 2012, 47, 4006–4012. [Google Scholar] [CrossRef]
- Krcha, M.D.; Janik, M.J. Examination of Oxygen Vacancy Formation in Mn-Doped CeO2 (111) Using DFT+U and the Hybrid Functional HSE06. Langmuir 2013, 29, 10120–10131. [Google Scholar] [CrossRef] [PubMed]
- Righi, G.; Benedetti, S.; Rita Magri, R. Investigation of the structural and electronic differences between silver and copper doped ceria using the density functional theory. J. Phys. Condens. Matter. 2022, 34, 204010. [Google Scholar] [CrossRef] [PubMed]
- Nolan, M. Enhanced oxygen vacancy formation in ceria (111) and (110) surfaces doped with divalent cations. J. Mater. Chem. 2011, 21, 9160–9168. [Google Scholar] [CrossRef]
- Wang, X.; Shen, M.; Wang, J.; Fabris, S. Enhanced Oxygen Buffering by Substitutional and Interstitial Ni Point Defects in Ceria: A First-Principles DFT+U Study. J. Phys. Chem. C 2010, 114, 10221–10228. [Google Scholar] [CrossRef]
- Grieshammer, S.; Grope, B.O.H.; Koettgen, J.; Martin, M. A combined DFT + U and Monte Carlo study on rare earth doped ceria. Phys. Chem. Chem. Phys. 2014, 16, 9974–9986. [Google Scholar] [CrossRef]
- Wang, H.; Qu, Z.; Xie, H.; Maeda, N.; Miao, L.; Wang, Z. Insight into the mesoporous FexCe1-xO2-x catalysts for selective catalytic reduction of NO with NH3: Regulable structure and activity. J. Catal. 2016, 338, 56–67. [Google Scholar] [CrossRef]
- Liu, X.-S.; Wang, X.-D.; Yao, M.; Cui, W.; Yan, H. Effects of Fe doping on oxygen vacancy formation and CO adsorption and oxidation at the ceria(111) surface. Catal. Commun. 2015, 63, 35–40. [Google Scholar] [CrossRef]
- Lykaki, M.; Stefa, S.; Carabineiro, S.A.C.; Pandis, P.K.; Stathopoulos, V.N.; Konsolakis, M. Facet-Dependent Reactivity of Fe2O3/CeO2 Nanocomposites: Effect of Ceria Morphology on CO Oxidation. Catalysts 2019, 9, 371. [Google Scholar] [CrossRef]
- Kaneko, H.; Miura, T.; Ishihara, H.; Taku, S.; Yokoyama, T.; Nakajima, H.; Tamaura, Y. Reactive ceramics of CeO2−xMOx (M = Mn, Fe, Ni, Cu) for H2 generation by two-step water splitting using concentrated solar thermal energy. Energy 2007, 32, 656–663. [Google Scholar] [CrossRef]
- Liang, C.; Ma, Z.; Lin, H.; Ding, L.; Qiu, J.; Frandsen, W.; Su, D. Template preparation of nanoscale CexFe1−xO2 solid solutions and their catalytic properties for ethanol steam reforming. J. Mater. Chem. 2009, 19, 1417–1424. [Google Scholar] [CrossRef]
- Metal Oxide Nanostructures Chemistry: Synthesis from Aqueous Solutions, 2nd ed.; Jolivet, J.-P. (Ed.) Chapter 5, Surface Chemistry and Physicochemistry of Oxides; Oxford University Press (2015) Editions EDP Sciences: Oxford, UK, 2015; pp. 181–226. [Google Scholar] [CrossRef]
- Maslakov, K.I.; Teterin, Y.A.; Popel, A.J.; Teterin, A.Y.; Ivanov, K.E.; Kalmykov, S.N.; Petrov, V.G.; Petrov, P.K.; Farnan, I. XPS study of ion irradiated and unirradiated CeO2 bulk and thin film Samples. Appl. Surf. Sci. 2018, 448, 154–162. [Google Scholar] [CrossRef]
- Maslakov, K.I.; Teterin, Y.A.; Ryzhkov, M.V.; Ivanov, K.E.; Popel, A.J.; Teterin, A.Y.; Kalmykov, S.N.; Petrov, V.G.; Petrov, P.K.; Farnan, I. The electronic structure and the nature of the chemical bond in CeO2. Phys. Chem. Chem. Phys. 2018, 20, 16167–16175. [Google Scholar] [CrossRef]
- Eck, S.; Castellarin-Cudia, C.; Surnev, S.; Ramsey, M.G.; Netzer, F.P. Growth and thermal properties of ultrathin cerium oxide layers on Rh(111). Surf. Sci. 2002, 520, 173–185. [Google Scholar] [CrossRef]
- Soria, E.; Román, E.; Williams, E.M.; de Segovia, J.L. Observations with synchrotron radiation (20–120 eV) of the TiO2(110)–glycine interface. Surf. Sci. 1999, 433–435, 543–548. [Google Scholar] [CrossRef]
- Parkinson, G.S. Iron oxide surfaces. Surf. Sci. Rep. 2016, 71, 272–365. [Google Scholar] [CrossRef]
- Mansour, A.N.; Brizzolara, R.A. Characterization of the Surface of FeO Powder by XPS. Surf. Sci. Spectra 1996, 4, 345–350. [Google Scholar] [CrossRef]
- Preisinger, M.; Krispin, M.; Rudolf, T.; Horn, S.; Strongin, D.R. Electronic structure of nanoscale iron oxide particles measured by scanning tunneling and photoelectron spectroscopies. Phys. Rev. B 2005, 71, 165409. [Google Scholar] [CrossRef]
- Radu, T.; Iacovita, C.; Benea, D.; Turcu, R. X-Ray Photoelectron Spectroscopic Characterization of Iron Oxide Nanoparticles. Appl. Surf. Sci. 2017, 405, 337–343. [Google Scholar] [CrossRef]
- Grosvenor, A.P.; Kobe, B.A.; McIntyre, N.S. Studies of the oxidation of iron by water vapour using X-ray photoelectron spectroscopy and QUASES. Surf. Sci. 2004, 572, 217–227. [Google Scholar] [CrossRef]
- Temesghen, W.; Sherwood, P.M.A. Analytical utility of valence band X-ray photoelectron spectroscopy of iron and its oxides, with spectral interpretation by cluster and band structure calculations. Anal. Bioanal. Chem. 2002, 373, 601–608. [Google Scholar] [CrossRef] [PubMed]
- Bagus, P.S.; Nelin, C.J.; Brundle, C.R.; Vincent Crist, C.B.; Lahiri, N.; Rosso, K.M. Combined multiplet theory and experiment for the Fe 2p and 3p XPS of FeO and Fe2O3. J. Chem. Phys. 2021, 154, 094709. [Google Scholar] [CrossRef] [PubMed]
- Fondell, M.; Gorgoi, M.; Boman, M.; Lindblad, A. Surface modification of iron oxides by ion bombardment—Comparing depth profiling by HAXPES and Ar ion sputtering. J. Electron Spectrosc. Relat. Phenom. 2018, 224, 23–26. [Google Scholar] [CrossRef]
Figure 1.
Transmission electron microscopy (TEM) (A and B), energy-dispersive x-ray (EDX) (insets in (A,B) and x-ray diffraction (XRD) of (C) Ce0.95Fe0.05O2-δ and (D) Ce0.75Fe0.25O2-δ. The figures are adapted with permission from [17].
Figure 1.
Transmission electron microscopy (TEM) (A and B), energy-dispersive x-ray (EDX) (insets in (A,B) and x-ray diffraction (XRD) of (C) Ce0.95Fe0.05O2-δ and (D) Ce0.75Fe0.25O2-δ. The figures are adapted with permission from [17].

Figure 2.
(A) Valence band XPS (green shaded) and Ce5p, O2s (blue-shaded) and Ce5s spectra of Ce0.75Fe0.25O2-δ before (0 min) and after argon ion sputtering (x min). (B) Valence band XPS (green shaded) and Ce5p, O2s (blue-shaded) and Ce5s spectra of Ce0.95Fe0.05O2-δ before (0 min) and after argon ion sputtering (x min).

Figure 3.
(A) Valence band XPS of as-prepared Ce0.75Fe0.25O2-δ after 1, 2 and 5 min of Ar ion sputtering. (B) Valence band XPS of as-prepared Ce0.95Fe0.05O2-δ after 1, 2 and 5 min of Ar ion sputtering. (C,D) Computed peak areas of fitted Ce4f (FWHM = 1.5 eV) and Fe3d (FWHM = 1.5 eV) signals.
Figure 3.
(A) Valence band XPS of as-prepared Ce0.75Fe0.25O2-δ after 1, 2 and 5 min of Ar ion sputtering. (B) Valence band XPS of as-prepared Ce0.95Fe0.05O2-δ after 1, 2 and 5 min of Ar ion sputtering. (C,D) Computed peak areas of fitted Ce4f (FWHM = 1.5 eV) and Fe3d (FWHM = 1.5 eV) signals.

Figure 4.
(A) Normalized valence band XPS and the Ce5p and O2s spectra of Ce0.75Fe0.25O2-δ before (0 min) and after 5 min of argon ion sputtering. (B) Normalized valence band XPS and the Ce5p and O2s spectra of Ce0.95Fe0.05O2-δ before (0 min) and after 5 min of argon ion sputtering. Note the change in intensity of the Ce5p signal when compared to the O2s signal.

Figure 5.
XPS Ce3d spectra of as-prepared CeO2 (left panel), Ce0.75Fe0.25O2-δ and Ce0.95Fe0.05O2-δ (right panel) after 5 min of Ar ion sputtering. Also shown are the computed contributions of the Ce3+ and Ce4+ cations.
Figure 5.
XPS Ce3d spectra of as-prepared CeO2 (left panel), Ce0.75Fe0.25O2-δ and Ce0.95Fe0.05O2-δ (right panel) after 5 min of Ar ion sputtering. Also shown are the computed contributions of the Ce3+ and Ce4+ cations.

Figure 6.
(A) XPS Fe2p spectra of as-prepared Ce0.75Fe0.25O2-δ after 5 min of Ar ion sputtering. (B) XPS Fe2p spectra of as-prepared Ce0.95Fe0.05O2-δ after 5 min of Ar ion sputtering. Insets in (A,B): quantitative analysis of XPS Fe2p spectra of Ce0.75Fe0.25O2-δ and Ce0.95Fe0.05O2-δ before and after sputtering at the indicated time.


Figure 7.
Hydrogen production from water over CeO2, Ce0.75Fe0.25O2-δ and Ce0.95Fe0.05O2-δ, which were previously reduced with hydrogen at 700 °C at one atmosphere.
Figure 7.
Hydrogen production from water over CeO2, Ce0.75Fe0.25O2-δ and Ce0.95Fe0.05O2-δ, which were previously reduced with hydrogen at 700 °C at one atmosphere.


Table 1.
Extracted quantitative values from XPS Ce3d, Ce4f, Ce5p and Fe2p spectra and thermochemical water splitting to hydrogen over reduced oxides. The XPS data are those for reduced oxides after 5 min of argon ion sputtering. The hydrogen production data are at 700 °C under N2 from prior hydrogen-reduced oxides at 700 °C.
| Oxide | Ce3+/Ce4+ (Ce3d) | [Ce4f + Fe3dx]/O2p | Fe0/Fe3+ (Fe2p) | Ce5p/O2s | H2 Production (mol/g) |
|---|---|---|---|---|---|
| CeO2 | 0.2 | - | - | 0 | 0.2 × 10⁻⁶ |
| Ce0.75Fe0.25O2-δ | 2.3 | 0.3 | 0.5 | 1.6 | 7.4 × 10⁻⁶ |
| Ce0.95Fe0.05O2-δ | 3.6 | 0.4 | 0.6 | 1.75 | 11.4 × 10⁻⁶ |
Disclaimer/Publisher’s Note: The statements, opinions and data contained in all publications are solely those of the individual author(s) and contributor(s) and not of MDPI and/or the editor(s). MDPI and/or the editor(s) disclaim responsibility for any injury to people or property resulting from any ideas, methods, instructions or products referred to in the content. |
© 2024 by the author. Licensee MDPI, Basel, Switzerland. This article is an open access article distributed under the terms and conditions of the Creative Commons Attribution (CC BY) license (https://creativecommons.org/licenses/by/4.0/).
Share and Cite
MDPI and ACS Style
Idriss, H. A Core and Valence-Level Spectroscopy Study of the Enhanced Reduction of CeO2 by Iron Substitution—Implications for the Thermal Water-Splitting Reaction. Inorganics 2024, 12, 42. https://doi.org/10.3390/inorganics12020042
AMA Style
Idriss H. A Core and Valence-Level Spectroscopy Study of the Enhanced Reduction of CeO2 by Iron Substitution—Implications for the Thermal Water-Splitting Reaction. Inorganics. 2024; 12(2):42. https://doi.org/10.3390/inorganics12020042
Chicago/Turabian StyleIdriss, Hicham. 2024. "A Core and Valence-Level Spectroscopy Study of the Enhanced Reduction of CeO2 by Iron Substitution—Implications for the Thermal Water-Splitting Reaction" Inorganics 12, no. 2: 42. https://doi.org/10.3390/inorganics12020042
Note that from the first issue of 2016, this journal uses article numbers instead of page numbers. See further details here.