Article

ZnO–Doped CaO Binary Core–Shell Catalysts for Biodiesel Production via Mexican Palm Oil Transesterification

1
Escuela Superior de Ingeniería Química e Industrias Extractivas, Instituto Politécnico Nacional, Col. Zacatenco, Ciudad de México 07738, Mexico
2
TecNM-Tecnológico de Estudios Superiores de Coacalco, 16 de Septiembre 54, Col. Cabecera municipal, Estado de México 55700, Mexico
*
Author to whom correspondence should be addressed.
Inorganics 2024, 12(2), 51; https://doi.org/10.3390/inorganics12020051
Submission received: 26 October 2023 / Revised: 26 December 2023 / Accepted: 8 January 2024 / Published: 3 February 2024
(This article belongs to the Special Issue 10th Anniversary of Inorganics: Inorganic Materials)

Abstract

:
This work investigates biodiesel production via transesterification of Mexican palm oil with methanol catalyzed by binary solid base core–shell catalysts with improved catalytic stability. A series of CaO–ZnO mixed solids were prepared using an inexpensive co–precipitation method by varying ZnO content from 5 to 20 mol%. Several factors, such as surface basicity, ZnO content, phase compositions, and thermal treatment of the catalysts, were all proven to be crucial for the production of biodiesel with good quality. Thermal treatment could effectively remove the surface adsorbed water and impurities and improved the catalytic activity. The addition of ZnO to CaO significantly enhanced the catalysts’ stability; however, it led to lower surface basicity and slightly diminished catalytic activity. ZnO doping inhibited the formation of surface Ca(OH)2 and promoted the formation of Ca–Zn–O or CaZn2(OH)6 phase as the core and a surface CaCO3 shell, which effectively decreased Ca2+ leaching by approximately 74% in methanol and 65% in a methanol–glycerol (4:1) mixture. A combined method of separation and purification for obtaining clean biodiesel with high quality was proposed. The biodiesel obtained under the control conditions exhibited properties which satisfied the corresponding standards well.

Graphical Abstract

1. Introduction

Biodiesels, defined as the monoalkyl esters of fatty acids, can be produced by transesterification of renewable sources such as vegetable oils containing triglycerides of fatty acids via catalysis techniques. Usually, biodiesels are produced using homogeneous base catalysts such as NaOH and KOH. However, purification of the ester phase and removal of the liquid base catalyst from the products are a major problem [1,2]. Utilization of heterogeneous catalysts has attracted great attention for biodiesel production as it could solve most of the drawbacks encountered in the conventional homogeneous process [3,4]. For example, a heterogeneous catalyst can be rapidly separated from the reaction mixture by filtration, easily regenerated, and has a less corrosive character. Therefore, biodiesel production with a heterogeneous catalyst is an economical and environmentally friendly process [5].
In the process of biodiesel production, the purity of feedstocks and an effective catalyst are two key factors for obtaining a high-quality product. Water in the oil feedstocks usually poisons the catalyst [6,7]. Ma et al. claimed that during the transesterification reaction, the presence of water generates an even greater negative effect than free fatty acids [8]. Therefore, the feedstocks should be pretreated to minimize the water amount prior to the transesterification process. Some researchers have focused on the use of earth oxides like CaO [9,10] and SrO [11] as solid base catalysts for biodiesel synthesis. However, it was reported that when CaO was used, catalyst leaching in methanol took place [12].
There are two main methods used for improving the catalytic activity and stability of solid base catalysts. One is to disperse a solid base like CaO on a proper support such as mesoporous solids SBA–15 [13]; another method is to use binary oxides as catalysts by doping the base solid with another metal oxide [14,15,16,17,18,19]. This kind of catalyst has a long life time, suggesting an advantage of heterogeneous catalysts in the form of mixed oxides. Dias et al. claimed that calcium–manganese oxide was active and stable for biofuel production [14]. Dai et al. reported a series of alkali metal–doped M2ZrO2 and MNbO3 (X = Li, Na, K) catalysts for biodiesel production; both the acid and basic sites in the catalysts were proposed to take part in the formation of biodiesel [15,16]. Lithium–doped ZnO catalysts showed a conversion higher than 90% in soybean oil transesterification where the surface basicity of the catalysts significantly influenced the catalytic activity [17]. One successful example of a commercialized process for biodiesel production via vegetable oil transesterification was reported using a spinel oxide of Zn and Al solid catalyst in a two-consecutive-fixed-bed reactor system, where methyl esters reached 94.1% in the first reactor and 98.3% in the second reactor [18]. Rare earth oxide CeO2–doped CaO was also tested for biodiesel production through transesterification of Pistacia chinensis oil and the catalysts could retain acceptable activity after 18 cycles of reaction [19]. Chen and coauthors reported that using CaO–SiO2 catalysts, the reusability of the catalysts was obviously improved in comparison with CaO oxide alone in biodiesel production. The Ca2+ leaching content in the reaction media decreased as the Si content increased in the catalyst (0SiCa > 1SiCa > 2SiCa) [20]. It was reported that well-mixed CaO and MgO particles with a heterojunction structure synthesized via a wet ball milling process were used for biofuel production and the catalytic performance was improved relative to CaO nanoparticles [21]. Calcium–magnesium mixed oxide and dolomite containing CaO and MgO components as catalysts for transesterification of sunflower and soybean oil exhibited good activity and stability [22,23]. Woranuch et al. reported when Al2O3 was used as a binder (CaO:Al2O3 mass ratio 3.5:1), a 93.15% biodiesel yield was obtained, similar to that achieved using a CaO catalyst [24]. In the Ca–Al mixed oxides, Ca2+ leaching chiefly took place in the phase of CaO particles but not the mixed oxide, indicating that Al doping may improve stability [25]. Clearly, the surface basicity and the catalytic stability of CaO could be modified by doping with a second metal oxide, affecting the transesterification performance. The mechanism of the improvement of catalytic stability by doping is still an interesting research topic.
It is noted that a simple and economic technique for preparing catalysts is always at-tractive from the viewpoint of industrial applications. Keeping this in mind, the present work aims at designing heterogeneous base catalysts with low cost and enhanced catalytic stability for biodiesel production via Mexican palm oil transesterification with methanol. For this purpose, a series of ZnO–doped CaO solid catalysts were synthesized by a coprecipitation method due to their availability, low cost, strong basicity, and high catalytic activity. The ZnO content varied from 5 to 10, 15, and 20 mol% in the CaO–ZnO solids. Effects of ZnO content, surface basicity, and thermal treatment on the catalytic behaviors of the catalysts were investigated. For investigating the stability of ZnO–CaO catalysts, Ca2+ leaching in methanol or a methanol and glycerol mixture was measured. A mechanism towards a deep insight into the stability enhancement of ZnO–CaO catalysts was proposed. Some key physicochemical properties of the obtained biodiesels, like molecular weight, refractive index, density, and cetane number, were measured and all of these parameters satisfied the standards established for biodiesel well.

2. Results and Discussion

2.1. Phase Composition and XRD Analysis

XRD patterns of the pure CaO and the ZnO–doped CaO samples are shown in Figure 1. For the pure CaO sample (Figure 1a), the XRD peaks at 2θ approximately 32.2°, 37.3°, and 53.8° were indexed to (111), (200) and (220) planes of cubic CaO phase (JCPDS card file No.04-003-7161). The presence of Ca(OH)2 phase was observed as evidenced by diffraction peaks at 2θ = 18.0°, 28.6°, 34.1°, 47.0°, and 50.8°. In addition, a very small amount of Ca–CO3 was formed in the solid, probably resulting from the reaction of CaO with CO2 in air during sample calcination. It is noted that the dried CaO solid possesses high capacity for adsorbing water, so surface Ca(OH)2 phase was formed by CaO reacting with surface ad-sorbed water [26]. Therefore, in the pure CaO solid, two major phases, CaO and Ca(OH)2, coexisted with a very small amount of surface calcium carbonate.
In the ZnO–doped samples (Figure 1b–e), as the amount of ZnO in CaO–ZnO mixed oxide increased from 5 to 10 mol%, the intensity of the XRD peaks corresponding to ZnO with hexagonal structure (JCPDS card file No. 36-01-070-8072) increased, as evidenced by peaks at 2θ = 36.3°, 56.7°, 62.9°, and 68.0°. In these two samples, ZnO, CaO, and Ca(OH)2, together with a trace amount of CaCO3 and CaZn2(OH)6·2H2O, were formed. When the ZnO content in the mixed sample was further increased to 15 mol% or greater, more CaO was converted into CaCO3 as confirmed by the disappearance of the XRD peaks of CaO and a significant increase in intensity of the peaks related to CaCO3 (Figure 1d,e). Moreover, Ca(OH)2 phase concentration gradually reduced as the ZnO content increased from 5 to 10 wt%, and disappeared in the sample with higher ZnO content. In the meantime, CaZn2(OH)6 appeared in two samples: CaO–ZnO–15% and CaO–ZnO–20% (JCPDS card file No. 04-012-2175) [2,27,28]. Calcination may result in the departure of crystalline water from this phase, leading to the peak position slightly shifting to the low two–theta region. Formation of the phase CaZn2(OH)6 was due to the following reactions (1) and (2) [28]:
Ca2+ + 2Zn2+ + 8H2O → CaZn2(OH)6·2H2O + 6H+
CaZn2(OH)6·2H2O → CaZn2(OH)6 + 2H2O
Therefore, ZnO addition inhibited the formation of Ca(OH)2 but generated ZnO and CaZn2(OH)6 phases. CaZn2(OH)6 may further dehydrate via two neighbored hydroxyls to release water, forming some oxygen defects (VO2−) in the structure. Moreover, a certain amount of CaCO3 was formed due to the reaction between surface CO2 and CaO during the calcination procedure. Therefore, the CaCO3 phase serves as a shell of the catalyst.

2.2. FTIR Spectroscopy Analysis

The surface features of the catalysts were characterized with FTIR spectroscopy (Figure 2). For the pure CaO sample, a sharp IR band at 3625 cm−1 was assigned to stretching vibrations of hydroxyls v(O–H), which is normally ascribed to the O–H bond in Ca(OH)2 [5]. The band at 420 cm−1 corresponded to the vibration of the Ca–O lattice bond. The characteristic bands of carbonate species were observed in the FTIR spectra. Usually, for CO32− species, four vibrational IR vibration modes can be observed with different band shapes and intensity: (i) the symmetric stretching, ν1[CO3], at around 1080–1085 cm−1; (ii) the out–Of–plane bend, ν2[CO3], at around 700–720 cm−1; (iii) the asymmetric stretching, v3[CO3], at around 1420–1580 cm−1; and iv) the split in-plane bending vibrations, v4[CO3], at around 850–880 cm−1 [5,29,30]. The presence of carbonate species in all the samples was confirmed by the broad and strong doublet at 1420 and 1500 cm−1. They should correspond to the asymmetric stretching vibrations of v3[CO3] species. A weak vibration of the v1[CO3] mode was observed at 1086 cm−1, indicating that CaCO3 was formed in the surface of the samples.
In the ZnO–doped samples, the band at 3625 cm−1 was significantly diminished in intensity, indicating that the concentration of the Ca(OH)2 phase was gradually decreased. In the meantime, one small band at 3610 cm−1 appeared, indicating the presence of hydroxyls in the CaZn2(OH)6·2H2O phase. Disappearance of the 3610 cm−1 band at greater ZnO content indicates the removal of molecular water from CaZn2(OH)6·2H2O and inhibition of calcium hydroxide formation.

2.3. Raman Spectroscopy

Micro Raman spectroscopy is generally more sensitive than FTIR in the characterization of surface species in oxides. Raman spectra of CaO and CaO–ZnO samples are shown in Figure 3. For all the catalyst samples, their surfaces contained some hydroxyl species and calcium carbonate phase. Similar to the FTIR characterization, the sharp band at 3622 cm−1 was assigned to stretching vibrations of hydroxyls v(O–H), which is normally ascribed to the O–H bond in Ca(OH)2. Generally, there are three major Raman peaks, namely, at 263 and 1027 cm−1 and 3622 cm−1 for the Ca(OH)2 phase [31]. The CO32− species are very clearly characterized by the major Raman bands at 1448 cm−1 and 1887 cm−1, respectively. There were two major Raman peaks for ZnO at 347 and 1162 cm−1 [32].
The Raman bands for CaO are difficult to characterize, as it is usually present in the surface as the Ca(OH)2 phase and CaCO3 in the samples. Some authors [32,33,34] claim that CaO does not possess any Raman-active modes, except for second-order effects involving the scattering of two phonons giving rise to two overlapping bands at 530 cm−1 and 660 cm−1, as well as a broad signal at about 1000 cm−1 [35]. For our CaO sample, we did not observe Raman bands at the above-mentioned positions with obvious intensity, confirming that CaO indeed does not have a first–Order Raman spectrum. The second-order features of CaO might overlap with the broad band of Ca(OH)2 and they were not able to be observed because they are much weaker than the first–Order Raman modes of calcium hydroxide.
For ZnO–doped samples, some Zn ions collaborated with Ca to form Ca–Zn–O phase in the bulk of the solid, so the Raman band at 3622 cm−1 gradually reduced in intensity in comparison with that shown in the CaO solid. However, amongst the ZnO–doped samples, this band intensity gradually increased on increasing the Zn content in the solid, reflecting the increment of –OH species in the CaZn2(OH)6 phase in the inner layer of the solid until 15mol% ZnO. At greater ZnO content, for example, in the CaO–ZnO–20% sample, more surface carbonate species may partially inhibit the presence of hydroxyls in the sample. In sum, both Raman and FTIR spectra confirmed the coexistence of hydroxyls and carbonate species in the samples, which are in good agreement with the XRD results.

2.4. XPS Analysis

The surface chemical valences and element oxidation states of the samples were characterized by the XPS technique. Figure 4 shows the core levels of Ca 2p, Zn 2p, O1s, and C1s XPS spectra of the different samples. The binding energy (BE) of the Ca 2p (Ca 2p1/2 and Ca 2p3/2) varied between 345.0 and 353.0 eV. These are two unsymmetrical peaks, indicating that Ca ions have different coordinates in different crystalline structures. For the pure CaO sample, its XPS signals can be deconvoluted into two main components corresponding to Ca 2p3/2 and Ca 2p1/2 in CaO and Ca(OH)2 crystals. For the ZnO–doped CaO samples, XPS core levels of Ca 2p can be deconvoluted into four parts, corresponding to Ca 2p3/2 and Ca 2p1/2 in CaO (Ca 2p ½ BE ≈ 346.0 eV and Ca 2p 3/2 BE ≈ 350.2 eV), CaCO3 (Ca 2p ½ BE ≈ 347 eV and Ca 2p 3/2 BE ≈ 351 eV), Ca(OH)2 (Ca 2p ½ BE ≈ 348 eV and Ca 2p 3/2 BE ≈ 352 eV), and CaZn2(OH)6 (Ca 2p ½ BE ≈ 348.7 eV and Ca 2p 3/2 BE ≈ 352.5 eV), respectively [36]. These deconvolutions and assignments are in good agreement with the XRD patterns and FTIR and Raman spectroscopic characterizations [37]. For the samples with greater ZnO content, as ZnO content increased in the mixed oxide, the binding energy of Ca 2p slightly shifted toward the lower-value region due to the formation of a greater amount of the Ca–O–Zn phase.
For the core levels of Zn 2p, there were two peaks with binding energy around 1022.0 eV and 1045.3 eV, corresponding to Zn 2p3/2 and Zn 2p1/2, respectively [38]. The intensity of Zn 2p bands clearly increased as the ZnO content increased in the solids. Each of these two perks can also be deconvoluted into two parts, indicating Zn 2p bands in the ZnO and Ca–O–Zn phases, respectively.
The XPS O1s peak appeared in the BE range between 529 eV and 536 eV. These peaks were more pronounced in the samples containing ZnO. The asymmetrical and broad O1s spectrum peak indicated that more than one type of oxygen species was involved. Most of the oxygen was present in the form of Ca–O in CaO or Zn–O in ZnO crystals, along with oxygen species in carbonates and surface hydroxyls or adsorbed water. Therefore, the O1s peak can be deconvoluted into several peaks: the two at 532.17 eV and 530.2 eV may indicate the lattice O in CaO and ZnO oxides, respectively [38,39,40]. The band at 531.18 eV indicates the O–H bond in the Ca(OH)2 phase [40]. The oxygen in surface CO32− carbonate species is present at 531.76 eV (O=C) and at 533.5 eV (O–C) [38,39,40,41]. The peak at around 535.5 eV corresponds to OH in hydroxyls and water adsorbed in the surface.
Two peaks between 283.0~288.0 eV and 288.0~294.0 eV were well defined, corresponding to the C1s XPS spectra of the CaO–ZnO samples. These two peaks can be further deconvoluted into three components: the one at around 285.3 eV corresponds to a C–O bond; the one at around 286.6 eV corresponds to C=O in CO32− [5], and the one at 290.1 eV is assigned to the vibration of the O–C=O species. These results suggest the formation of surface carbonate species in the samples, in agreement with FTIR characterization.
On the basis of the above analyses of XRD, FTIR, Raman, and XPS techniques, we may conclude that in the pure CaO and CaO–ZnO binary samples, there exist several phases. At least in the surface, hydroxyl species, Ca(OH)2, and carbonate species are formed; further, CaO, CaCO3, and CaZn2(OH)6 coexisted, depending on the phase composition and ZnO content. Without ZnO doping, both CaO and Ca(OH)2 phases existed and surface carbonate species are also formed; when ZnO was added, the CaZn2(OH)6 phase dominated at a compensation of Ca(OH)2 reduction or disappearance. In all the ZnO–doped samples, CaCO3 was formed as a shell. ZnO doping promoted the formation of CaCO3 as evidenced by an increasing amount of CaCO3 in the samples with greater ZnO content.

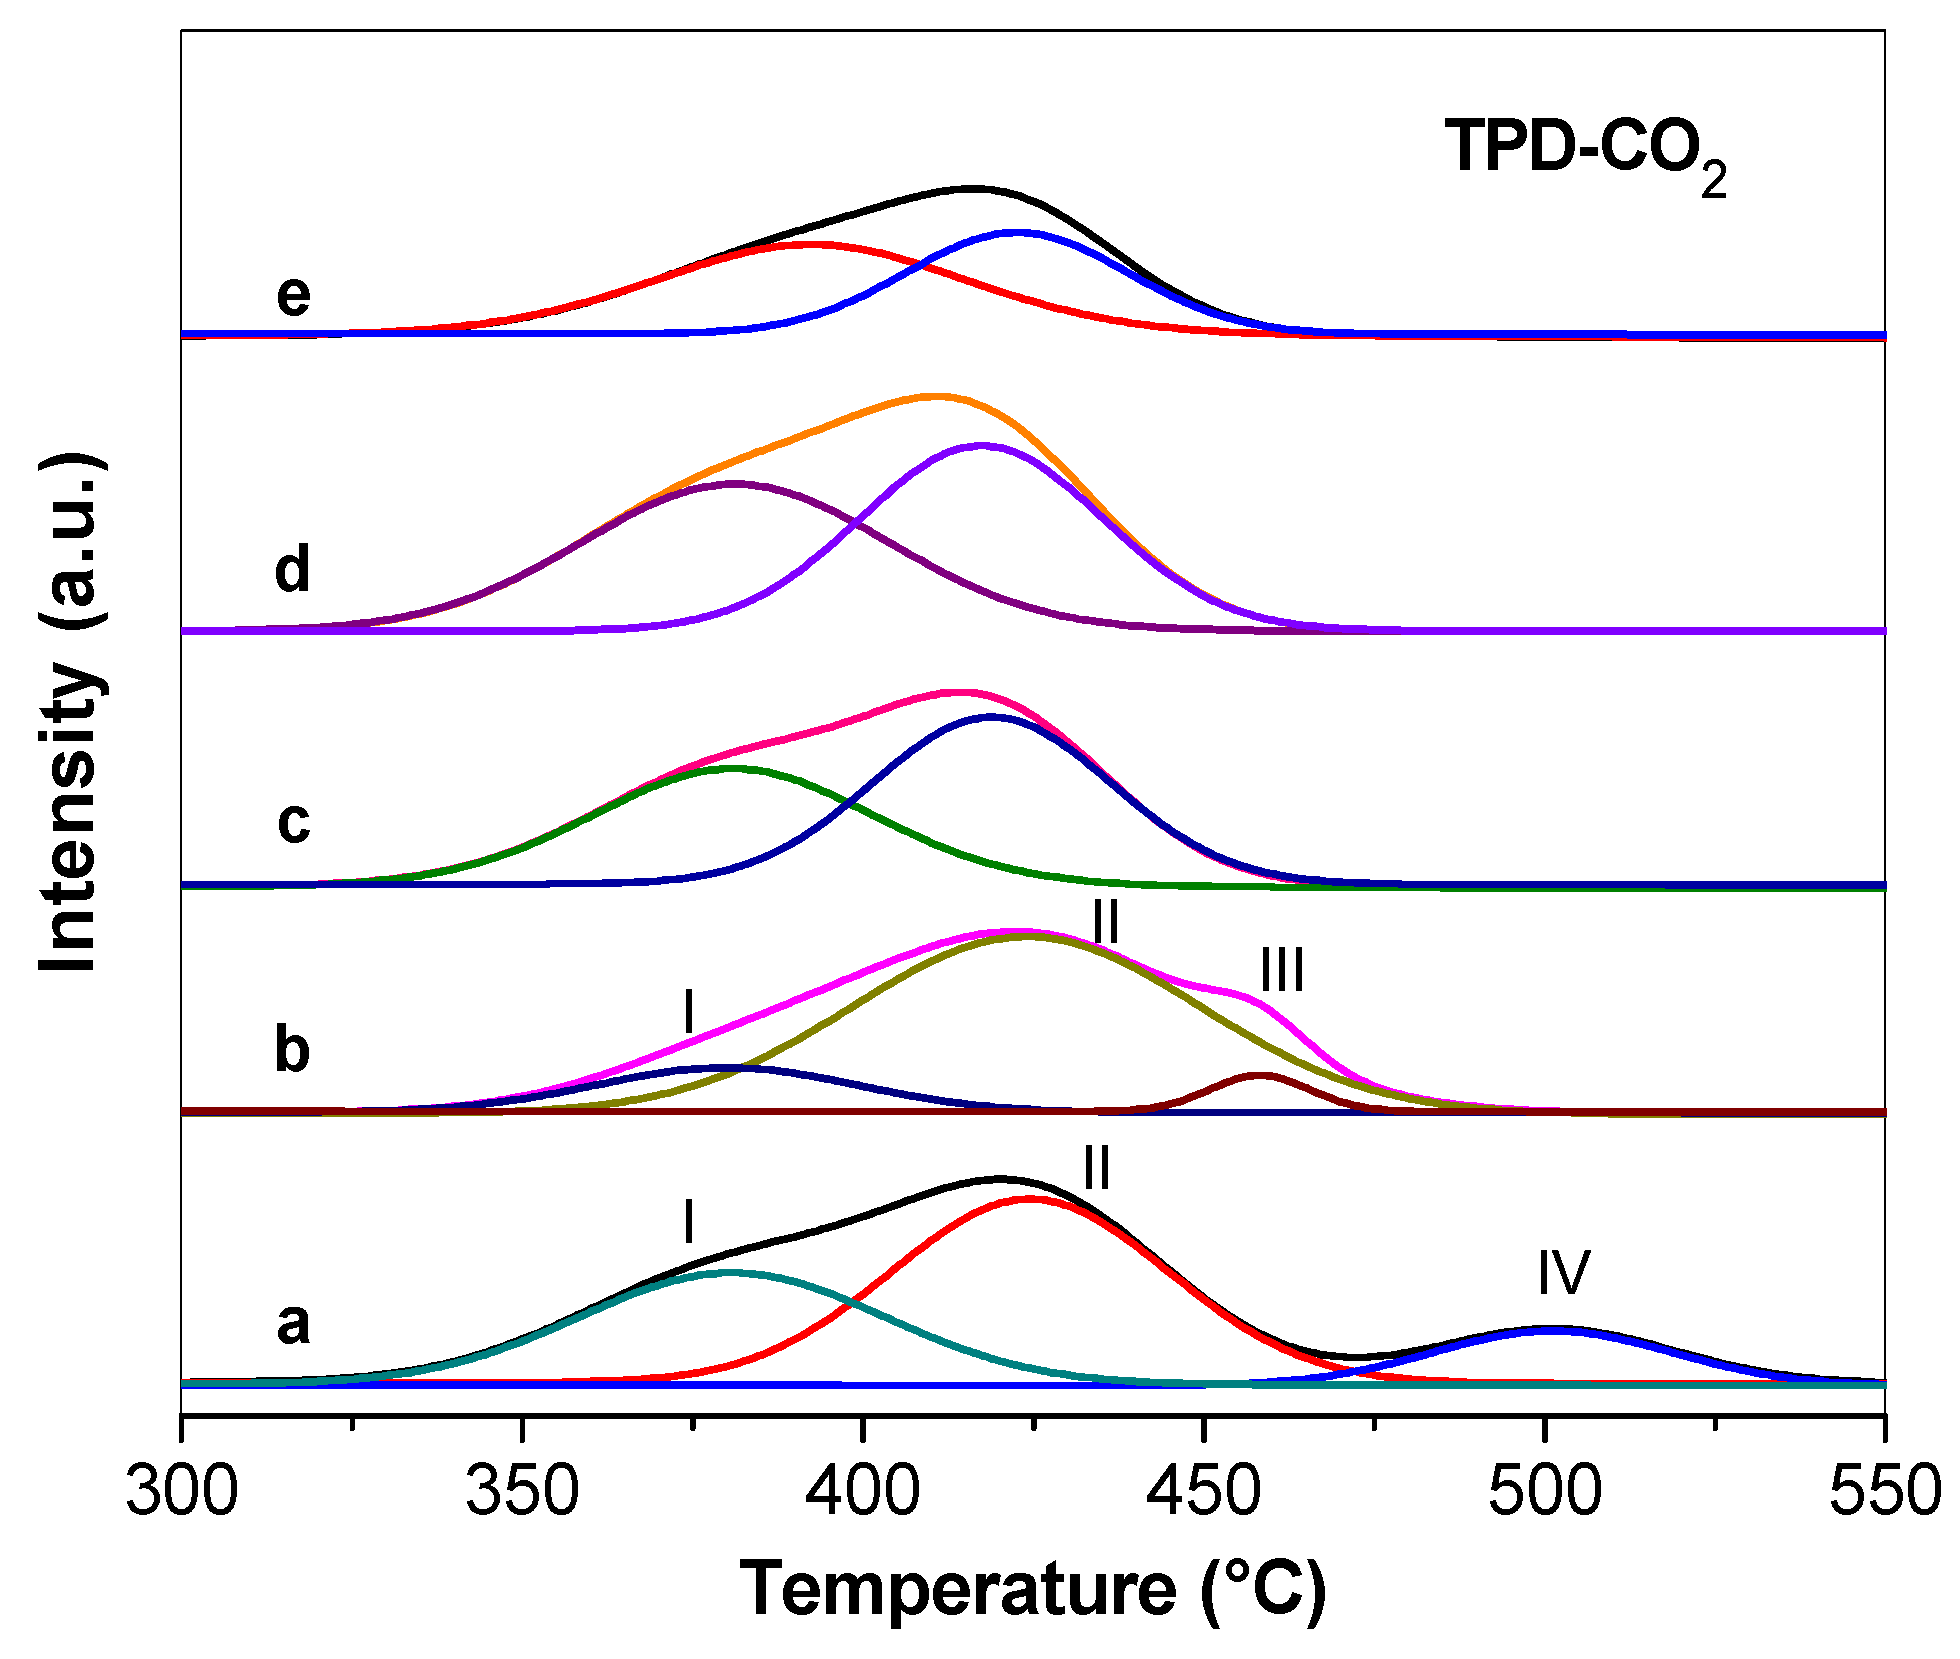
2.5. Surface Basicity

The temperature-programmed desorption of CO2 method was used to determine the surface basicity of the samples. The TPD–CO2 profiles of the different catalysts are shown in Figure 5. Each TPD–CO2 profile consists of two to three components: moderate strong basic sites (peak I, 325–400 °C; peak II, 375–475 °C or peak III, 450–475 °C) and strong basic sites (peak IV, 475–550 °C).
The pure CaO (ZnO–0%) sample showed three peaks with peak maximums at approximately 375°, 425 °C, and 510 °C, corresponding to moderate–strong basic sites [42]. For the ZnO–doped samples, the peak near 510 °C disappeared. The number of total basic sites in each sample is reported in Table 1. The TPD–CO2 data of each catalyst indicate that the basicity and base strength distributions were influenced by the presence of ZnO in the CaO–ZnO mixed oxides. The number of basic sites indicated by the peak area decreased on increasing the ZnO content [43]. For example, the catalyst containing 20% of ZnO showed a number of basic sites approximately 50% of that present in the pure CaO solid. Also, doping with ZnO content greater than 10 mol% eliminated the strong basic sites in the sample. Formation of CaCO3 in the surface may also negatively affect the surface basicity.
The textural properties including the surface area, pore volume, and pore diameters are also measured. As shown in Table 1, a small amount of ZnO doping (5mol %) led to the surface area increasing; however, when ZnO content was greater than 5mol%, the surface area and pore volume decreased and pore diameter increased. These changes are related to the phase composition. Higher content of ZnO resulted in the formation of CaCO3 and CaZn2(OH)6, altering the textural properties as confirmed by the XRD analysis. Therefore, ZnO doping not only modified the textural properties, but the surface basicity also.

2.6. Morphological Features and AFM and TEM Observations

The surface morphologies of the catalysts were studied using the AFM technique. Estimated values were obtained using ImageJ® software version 1.50I. The pure CaO sample had a relatively uniform surface morphology with many voids among particles. It was composed of particles with average size approximately 157 nm, and agglomeration of grains was absent (Figure 6). Topography images of ZnO–doped CaO catalysts (Figure 6b–d) showed the existence of the agglomeration of small particles with a triangular shape. For the sample with 20%ZnO, the large agglomerates with sizes between 350 and 390 nm consisted of many uniform particles with a smaller size.
Figure 7 shows two TEM micrographs of CaO and CaO–ZnO–15 samples. For the pure CaO sample, all the particles are homogeneously distributed with an average size of approximately 30–40 nm. For the CaO–ZnO–15 sample, a close observation found many large aggregates consisting of small particles, forming core–shell structures with a shell thickness around 26 nm. ZnO doping led to the formation of bigger aggregates with respect to pure CaO, decreasing the surface area and surface basicity as confirmed by the N2 physical adsorption and the TPD–CO2 measurement (Table 1).

2.7. Palm Oil Transesterification Reactions

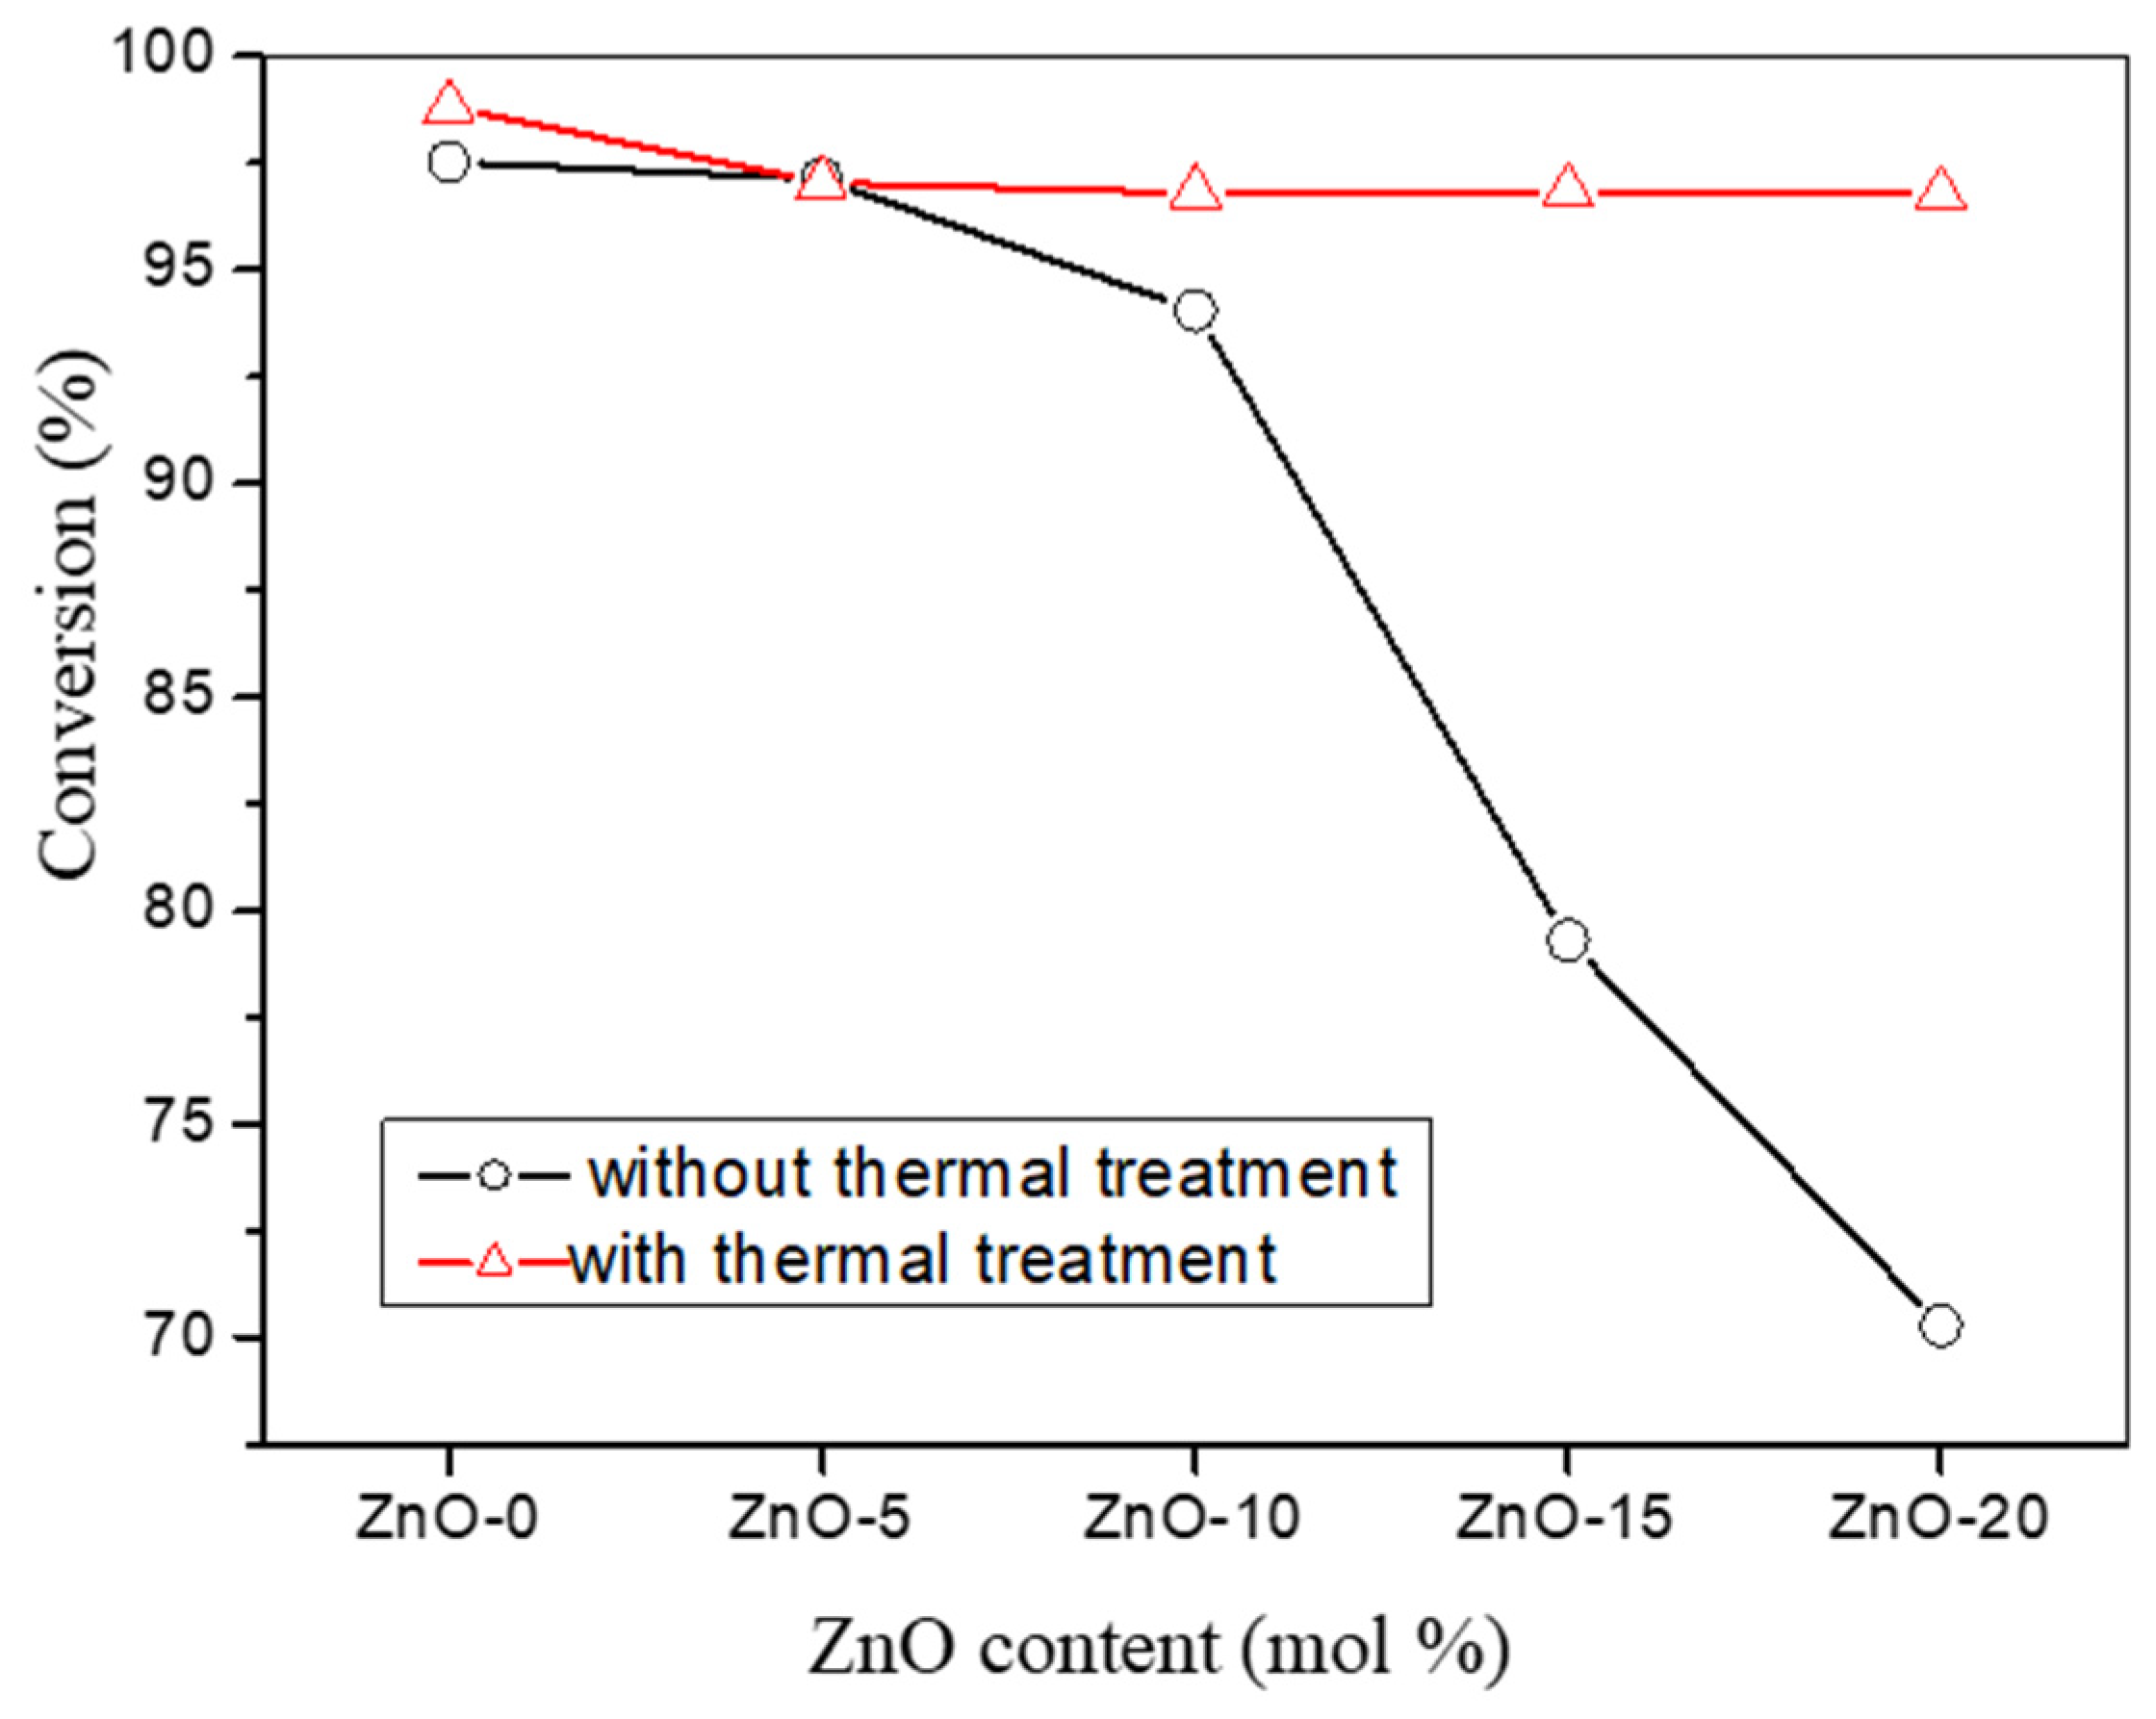
2.7.1. Thermal Treatment Effect

In order to investigate the influence of thermal treatment of catalysts on biodiesel production, before the catalytic test, all the catalysts were thermally treated at 400 °C for 4 h to remove species adsorbed in the surface like adsorbed water. The catalytic activity of the catalysts with thermal treatment and without thermal treatment was comparatively evaluated. The results for biodiesels formation were reported in Table 2. The value of conversion of triacylglycerol obtained on different catalysts under conditions with thermal treatment or without thermal treatment are plotted in Figure 8. Using untreated catalysts, the maximum conversion achieved with the catalyst CaO catalyst was 97.5% and it decreased to around 70.3% when the ZnO content was 20%, showing palm oil conversion decreasing with the addition of ZnO. However, after the catalysts were thermally treated, palm oil conversion was rather stable, varying between 98.8% and 96.8%, which was higher than that obtained using the corresponding untreated catalysts. For example, the conversion achieved on the thermal-treated catalyst CaO–ZnO–20% was 96.8%, which is much greater than the data obtained from the same catalyst without thermal treatment, 70.3%.
Thermally treated catalysts contained more basic centers compared with the catalysts without thermal treatment because the thermal treatment effectively removed the surface adsorbed water, which may poison the surface basic sites. Also, surface dehydration after thermal treatment promoted the generation of oxygen vacancies (Ov) that may serve as adsorption and surface reaction centers. These are responsible for the increase in the palm oil conversion via transesterification with methanol. However, the ZnO–doped catalysts exhibited lower activity in comparison with pure CaO, probably resulting from their lower surface basicity and smaller surface area.

2.7.2. Catalyst Stability

The pure CaO catalyst showed the highest initial catalytic activity (initial palm oil conversion was 98.8%); however, it decreased to around 78.0% after four runs of the reaction, which was lower than the conversion achieved with any one of the ZnO–doped catalysts under the same reaction conditions. The activity decrease in pure CaO probably resulted from its solubility in alcohol (herein, methanol or a mixture of methanol and glycerol). Ca2+ ions released from CaO into alcohols via the following reactions (3)~(9) [12]:
CaO ↔ Ca2+ + O2−
Ca(OH)2 ↔ Ca2+ + 2OH
CaO + 2CH3OH ↔ Ca(OCH3)2 + H2O
Ca(OH)2 + 2CH3 OH ↔ Ca(OCH3)2 + 2H2O
CaO + 2C3H8O3 ↔ Ca(C3H7O3)2 + H2O
Ca(OCH3)2 ↔ Ca2+ + 2OCH3
Ca(C3H7O3)2 ↔ Ca2+ + 2C3H7O3
Ca2+ concentrations in alcohols are reported in Table 3. For pure CaO, the Ca2+ concentration was 121 mg/L after 3h immersion in methanol at 60 °C. As CaO was combined with 5, 10, 15, and 20 mol% ZnO, Ca2+ concentration in methanol was 47.2, 34.6, 31.0, and 31.7 mg/L, respectively, after 3 h of catalyst immersion. Clearly, the Ca2+ solubility of ZnO–doped catalysts in alcohol was much lower than that of pure CaO. Similarly, in the mixture of methanol and glycerol, Ca2+ concentrations varied between 32 and 50 mg/L for the CaO–ZnO catalysts, lower than that for the value 101.9 mg/L obtained for the pure CaO sample.
Three factors may be responsible for the improvement of the CaO–ZnO stability: (i) elimination of Ca(OH)2 on the catalyst surface; (ii) formation of CaZn2(OH)6 phase; and (iii) formation of surface CaCO3 shell, as it is well known that calcium hydroxide is easily dissolved into water and alcohols. In the ZnO–doped CaO solids, surface calcium hydroxide formation was greatly inhibited, which contributes to the reduction in Ca2+ leaching. Because CaCO3 was formed by CaO reacting with surface CO2 or CO2 in air, it mostly coated the particles as a shell of the catalyst. The formation of a CaCO3 shell in the ZnO–doped CaO catalysts partially inhibits Ca2+ leaching in methanol or glycerol. This is similar to the results observed by Chen et al., who observed the inhibition of Ca2+ leaching from CaO–SiO2 binary catalysts where a Si-related material shell on the CaO surface was formed [17]. On the other hand, as confirmed by the above characterization, Zn doping promotes the formation of CaZn2(OH)6. The crystalline structure of CaZn2(OH)6 consists of repeated [CaO6] octahedra and [ZrO4] tetrahedra. In one unit lattice cell, Ca atoms bonded to six oxygen atoms, forming [CaO6] clusters with octahedral coordination and Zn atoms are coordinated to four oxygen atoms in a tetrahedral [ZrO4] clusters. For charge balance, H atoms from H2O molecules are bonded via hydrogen bridges to the hydroxyl groups [OH] [28]. In this crystalline structure, the Ca2+ bounded with Zn2+ via Ca–O–Zn bonds to from calcium zincate, which is more stable in alcohols in comparison with pure CaO. Formation of Ca–Zn–O@CaCO3 core–shell nanoparticles with heterogeneous structure significantly inhibited Ca2+ leaching in the reaction mixture, which is demonstrated in Figure 9. It is noteworthy that CaCO3 formation decreased the surface basicity of ZnO–CaO catalysts, and thus inhibited the catalytic activity to a certain degree. However, as CaCO3 formation significantly enhanced the catalyst stability, from a practical viewpoint, the Ca–Zn–O@CaCO3 binary base is an interesting and promising catalyst for biodiesel production.

2.7.3. FTIR Characterization of Biodiesel

FTIR spectroscopic technique was used to characterize the nature of the obtained biodiesel. A set of FTIR spectra of different biodiesel obtained with different catalysts is presented in Figure S1 in the Supplementary Materials. IR bands in three regions (1000~1250 cm−1, 1700~1760 cm−1, and 2900~3050 cm−1) were related to the characteristics of biodiesel: strong bands at 1740 cm−1 and 1244 cm−1 were assigned to the vibrations of the methoxy group (–O–CH3) and C=O in ester, respectively [44,45,46,47,48]. The IR bands of biodiesel in the region between 2950 cm−1 and 3050 cm−1 corresponded to the stretching vibration modes of the C–H bond in –CH2 and –CH3, respectively. The IR bands between 1170 cm−1 and 1183 cm−1 were assigned to the asymmetric vibration band C–O corresponding to the ester bonds [48]. There were doublet signals with moderate intensity at approximately 1485 cm−1, which were attributed to the extension vibration of the –CH3 group. FTIR characterization confirmed the presence of the typical bonds of methyl esters and evidenced the formation of biodiesel. It was noted that the IR spectra of all the biodiesel samples were quite similar because of the highly chemical similarities of methyl esters in the products.
For comparison purposes, the result of the present work using the best catalyst CaO–ZnO–10% was compared with that reported in the literature. As shown in Table 4, under a soft reaction condition (less catalyst mass, lower methanol to oil ratio, shorter reaction time, and lower reaction temperature), our CaO–ZnO–10% core–shell catalyst shows a greater catalytic activity in comparison with the catalysts of CaO doped or modified with CeO2 [19], SiO2 [20], Al2O3 [24], MgO [49], and Fe3O4 [50].

2.8. Measurement of Biodiesel Indexes

The physicochemical parameters or indexes of the biodiesel products obtained by the present work such as molecular weight, density, cetane number, and refractive index were measured. Taking both the catalytic activity and stability into account, the two samples with 10 and 15 mol% ZnO samples are the best catalysts. All the parameters of biodiesel fuel obtained from the catalysts CaO–ZnO–10% and CaO–ZnO–15% are reported in Table 5. For comparison purposes, the parameters of the diesel obtained using CaO are also included in Table 5. Average molecular weight is dependent on the concentration of each compound in the feedstock (palm oil). As shown in Table 6, the components and molecular weight of palm oil principally contains around 45 mol% tripalmitin (molecular weight 807.5 g/mol) and 33 mol% triolein (molecular weight 885.6 g/mol). The palm oil feedstock has an average molecular weight of 774.4 g/mol. After the transesterification reaction, the average value of molecular weight of biodiesel is between 269.6 and 271.2 g/mol, which is reduced by approximately three times in comparison with that of the main component tripalmitin, indicating that the conversion of the triglycerides to the corresponding ester is rather complete [51,52,53].
The value of the refractive index decreased as the temperature increased and varied in a narrow range between 1.452 and 1.463 in the temperature range between 20 and 70 °C (not all shown). The data in Table 5 were obtained at 20 °C. This parameter is acceptable as it meets the established norm for biodiesel well. The influence of ZnO content in the catalysts on the distribution of refractive index values is insignificant.
Another parameter related to the quality of biodiesel is fuel density, because it helps to directly define the mass of fuel injected into the combustion chamber. As expected, density value gradually decreases at higher temperatures; therefore, it is inversely proportional to the temperature. The obtained biodiesel had different densities, depending on the transesterification conversion of palm oil. A lower transesterification conversion of palm oil was achieved using the catalysts containing higher content of ZnO, and the obtained biodiesel showed an increased density. In our experiments, the fuel density remained within the standard region, indicating the good quality of the obtained fuel [54,55,56].
The cetane number in fuel represents the relative time delay between the injection and the autO–ignition. A high cetane number ensures the correct operation of the fuel during cold start and mild engine work. In contrast, fuels with a low cetane number tend to increase gas and particulate emissions due to incomplete combustion. The biodiesel obtained with the CaO–ZnO–10% catalyst shows a cetane number of 67.43, which is slightly smaller than the 71.38 value of the fuel produced with pure CaO. When the ZnO content in the CaO–ZnO binary catalysts was greater than 15 mol%, the cetane number of the biodiesel gradually decreased to 62.16. The values of the cetane number varied between 62 and 72. According to the standards of ASTM/EN ISO 5165, the minimum allowable value of the cetane number for Mexico is 51. Therefore, the quality of all biodiesels obtained with different catalysts was in accordance with the established standard, similar to the results reported by other authors [57].

3. Experimental Section

3.1. Reagents

Ca(NO3)2·4H2O (>99.0%) and Zn(NO3)2·6H2O (>98.0%) were of analytical grade and were obtained from Sigma-Aldrich. Double-distilled water produced in our own laboratory was used for catalyst preparation. NaOH was ACS-grade and was obtained from J.T. Baker. Methanol (99.9%) was purchased from Aldrich. Palm oil was obtained from the company Drotosa. The components of palm oil are reported in Table 5.

3.2. Catalyst Preparation

CaO–ZnO mixed oxides were prepared by the co–precipitation method using aqueous solutions of Ca(NO3)2·4H2O and Zn(NO3)2·6H2O as Ca and Zn precursors and 1M NaOH as the precipitation agent. The cO–precipitation was performed at pH around 10. Nominal ZnO content in the mixed oxides varied from 5 mol% to 10, 15, and 20 mol%. The precipitating solids were filtered and washed with deionized water, and then dried at 80 °C in air for 12 h. The dried samples were calcined at 600 °C for 4 h in air. For comparison purposes, pure CaO solid was also prepared by a similar method using Ca(NO3)2·4H2O as the precursor. These samples were identified as CaO–ZnO–0% (pure CaO), CaO–ZnO–5%, CaO–ZnO–10%, CaO–ZnO–15%, and CaO–ZnO–20%, respectively.

3.3. Catalyst Characterization Techniques

X-ray diffraction (XRD) patterns of the catalysts were obtained in a two-theta region between 10 and 110° with Cu radiation (λ = 0.15418 nm) on an Empyrean Multi-Purpose Research X-ray Diffractometer.
Raman spectra of the catalysts were obtained with a micro Raman spectrophotometer (Confocal-Labram model HR800) at ambient temperature in wavenumbers ranging from 200 to 3800 cm−1.
FTIR spectra were recorded at an ambient temperature in the wavenumber region between 400 and 4000 cm−1 on a 170-SX FTIR spectrometer.
Morphologies of catalysts were investigated using a NanoScope IV Atomic Force Microscope (Veeco Instruments Inc., Edina, MN, USA). Different n–doped silicon cantilevers (NanosensorsTM) with resonance frequencies f0 = 190 kHz and 330 kHz, and the spring constants k = 48 N/m and 42 N/m, were applied. Morphology was also observed by transmission electron microscopy (JEOL 2100F) using a field emitter and 200 kV accelerator as illumination source.
X-ray photoelectronic spectroscopy (XPS) analyses were performed in a K-Alpha spectrophotometer (Thermo Scientific) equipped with a monochrome Al Kα (1478 eV) anode as the power supply of the X-ray. Analysis area was 400 μm2 and a charge compensator was used. Mounting of the sample was performed as follows: the powder was set on the film and then was fixed in the sample holder with a double-face Cu tape.
The basicity of the samples was determined by means of temperature-programmed desorption of CO2 (TPD–CO2) employing a Micromeritics 2900 analyzer. A CO2–Ar mixture (Praxair Inc., Norcross, GA 30093, USA) was used for the TPD–CO2 experiments. First, 1 g catalyst was pretreated under argon gas flow (30 mL/min) at 300 °C for 2 h, and subsequently, it was cooled down to room temperature. Then, the sample was saturated under the CO2–Ar mixture. After flushing the system with the carrier gas (N2), desorption of carbon dioxide from the sample was performed from 200 to 600 °C at a temperature-increasing rate of 10 °C/min. The TPD signals were recorded by an on-line thermal conductivity detector (TCD).

3.4. Biodiesel Production, Purification, and Characterization

The transesterification reactions of palm oil with methanol were carried out in a 1000 mL stainless steel batch reactor under atmospheric pressure. Before the reaction, oil feedstock was passed through a column containing activated carbon to remove impurities and then passed through a column of calcium carbonate to remove the moisture. Reaction temperature was set at 60 °C, with a molar ratio of methanol to palm oil of 4. First, 1 g catalyst was dispersed in 200 mL methanol and stirred for 10 min at room temperature using a magnetic bar. Then, 50 mL palm oil was added into the reactor while stirring at 60 °C. The catalyst-to oil mass ratio was around 2.2 wt%. After 3h of reaction, the products were separated and purified for further analysis and characterization. In order to evaluate the reusability of the catalysts, after the first test run was finished, the CaO–ZnO catalysts were separated and tested again under the same experimental condition.
For product biodiesel purification, the liquid phase and solid catalyst were separated by centrifugation, and then biodiesel (upper layer) and glycerol (lower layer) were separated by a separation funnel; afterwards, excess methanol was evaporated at 60 °C under ambient pressure (in Mexico City, the ambient pressure is approximately 0.88 atm). Once alcohol was evaporated, biodiesel was passed through an activated carbon column to remove impurities and then passed through a column of calcium carbonate to remove the moisture.
The clean biodiesel was further characterized by both FTIR spectroscopy and 1H-nuclear magnetic resonance (1H-NMR) spectroscopy on a Varian Oxford 300MH3 apparatus. Usually, it is not necessary to quantify individual compounds in biodiesel oil but instead determine components by groups. For example, in the determination of total glycerol, it does not matter from which type of acylglycerol (mono-, di-, or tri-) the glycerol stems. In the present work, the conversion of palm oil was calculated by the 1H NMR spectra according to the method developed by Gelbard and coworkers [58]. In this method, the protons of the methylene group adjacent to the ester moiety in triglycerols and the protons in the alcohol moiety of the methyl esters product were used to monitor the biodiesel production. The following Equation (10) was used to calculate the palm oil conversion:
C = 100   ( 2 A M E 3 A α - C H 2 )
where C was the conversion of feedstock to the corresponding methyl ester (noted as ME); AME was defined as the integration value of the peak area of the protons of the methyl esters (the strong singlet peak); and Aα-CH2 was the integration value of the peak area of the methylene protons (noted as α-CH2). The factors 2 and 3 used in the above equation were due to the fact that the methylene carbon has two protons and the methanol-derived carbon links three protons. In the 1H NMR spectra, the strong singlet at around 3.6 ppm indicated methyl ester (–(C=O)–O–CH3) formation. These signals were used for the conversion calculation.

3.5. Ca2+ Solubility Measurement

To evaluate the stability of ZnO– doped CaO catalysts, Ca2+ solubility in the reaction mixture was measured. Because CaO dissolution in biodiesel is negligible, in the present experiments, Ca2+ leaching was measured only in the methanol and methanol–glycerol phases. The catalyst samples were immersed in methanol to test Ca2+ leaching in methanol. As an example, 100 mg CaO was added into 50 mL of methanol and stirred at 300 rpm for 3 h at 60 °C. After the experiment was finished, it was filtered and cooled, and then the equivalent volume of 0.1 M HCl was added to the methanol containing Ca2+ solution to keep calcium in a cationic state. It is noteworthy that methanol was consumed during the transesterification reaction, and another alcohol (glycerol) was produced in situ with increasing concentration at a compensation of methanol when the reaction proceeded continuously. Therefore, Ca2+ concentration was also measured in the mixture of glycerol–methanol. CaO was also added to a mixture of methanol and glycerol at a volumetric ratio = 4:1 and submerged for 3 h at 60 °C under stirring. Ca2+ concentration in methanol or the methanol–glycerol mixture was analyzed by inductively coupled plasma-mass spectrometry (ICP-MS, PerkinElmer/Sciex ELAN Dynamic Reaction Cell (DRCPlus)) coupled with a PerkinElmer AS-93 plus Autosampler with Elan v. 3.3 software for data collection.

3.6. Analyses of Biodiesel Properties

Biodiesel molecular weight was determined using MALDI ionization equipment (desorption/ionization by matrix-assisted laser) coupled to a TOF (time-of-flight) analyzer. Biodiesel density was measured using a densimeter (Anton Paar DMA 4500). This system allows fast density measurements with an accuracy of ±5 × 10⁻⁶ g/cm3 in a wide temperature range (uncertainty of ±0.03 °C and repeatability ±0.01 °C).
The cetane number of biodiesel fuel was obtained from Equation (11) [59,60]:
ϕ I = 7.8 + 0.302 × M i 20 × N
where ϕ I is the cetane number of the ith methyl ester,   M i represents the molecular mass of the ith methyl ester, and N is the number of double bonds.
The refractometer (Mode AR2008) was used for refractive index measurement. The refractive index of a substance or a transparent medium was defined as the ratio of the speed of light in vacuum to the speed of light in the substance or the transparent medium.

4. Conclusions

In the transesterification reaction of Mexican palm oil with methanol using CaO–ZnO base binary catalysts, factors such as thermal treatment, surface basicity, phase components, and ZnO content in the CaO–ZnO catalysts were all crucial for biodiesel production. Thermal treatment could remove the surface adsorbed water and impurities from catalysts and effectively enhanced the catalytic activity. Increasing the amount of ZnO in catalysts decreased the catalyst basicity to a certain extent, and slightly inhibited the catalytic activity; however, ZnO addition significantly improved the stability of the catalyst by inhibiting Ca2+ solving in alcohol or reaction mixture. The best catalytic activity was achieved on the catalysts containing 10 and 15 mol% ZnO in which a heterostructure consisting of Ca–Zn–O and ZnO as the core and CaCO3 phase as the shell was formed, being responsible for the higher stability of the catalyst. The physicochemical parameters of the obtained clean biodiesel such as average molecular weight, density, refractive index, and cetane number of the biodiesel all satisfied the standards established for biodiesel well.

Supplementary Materials

The following supporting information can be downloaded at: https://www.mdpi.com/article/10.3390/inorganics12020051/s1, Figure S1: FTIR spectra for palm oil-base biodiesel obtained with thermal treated catalysts and after purification. (a): CaO; (b) CaO–ZnO–5%; (c) CaO–ZnO–10%; (d) CaO–ZnO–15%; (e) CaO–ZnO–20%.

Author Contributions

Conceptualization, M.E.M. and O.E.-S.; Methodology, M.G.A.-Q., M.E.M., O.E.-S. and J.A.W.; Data Curation, L.F.C., J.G.-G. and A.Z.-M.; Writing, M.G.A.-Q. and J.A.W.; Writing—Review and Editing, L.F.C.; Supervision, M.E.M. and O.E.-S. All authors have read and agreed to the published version of the manuscript.

Funding

The APC was funded by the Secretaría de Investigación y Posgrado del Instituto Politécnico Nacional.

Data Availability Statement

The data used to support the findings of this work are available from the corresponding author upon request.

Acknowledgments

M.G. Arenas-Quevedo thanks the scholarship from the CONHACyT-Mexico for supporting the investigation of his Master’s thesis. The authors would like to acknowledge El Centro de Nanociencias y Micro y Nanotecnologías del Instituto Politécnico Nacional and the International Joint Research Center of Green Chemical Engineering at the East China University of Sciences and Technology for technical support.

Conflicts of Interest

The authors claim that there are no conflicts of interest.

References

  1. Glîsić, S.; Lukic, I.; Skala, D. Biodiesel synthesis at high pressure and temperature: Analysis of energy consumption on industrial scale. Bioresour. Technol. 2009, 100, 6347–6354. [Google Scholar] [CrossRef]
  2. Ngamcharussrivichai, C.; Totarat, P.; Bunyakiat, K. Ca and Zn mixed oxide as a heterogeneous base catalyst for transesterification of palm kernel oil. Appl. Catal. A Gen. 2008, 341, 77–85. [Google Scholar] [CrossRef]
  3. Yan, S.; Di Maggio, C.; Mohan, S.; Kim, M.; Salley, S.O.; Ng, K.S. Advancements in Heterogeneous Catalysis for Biodiesel Synthesis. Top. Catal. 2010, 53, 721–736. [Google Scholar] [CrossRef]
  4. Xie, W.; Yang, X.; Fan, M. Biodiesel production by transesterification using tetraalkylammonium hydroxides immobilized onto SBA–15 as a solid catalyst. Renew. Energy 2015, 80, 230–237. [Google Scholar] [CrossRef]
  5. López–Granados, M.; Zafra–Poves, M.D.; Martín–Alonso, D.; Mariscal, R.; Cabello–Galisteo, F.; Moreno–Tost, R.; Santamaria, J.; Fierro, J.L.G. Biodiesel from sunflower oil by using activated calcium oxide. Appl. Catal. B 2007, 73, 317–326. [Google Scholar] [CrossRef]
  6. Atadashi, I.M.; Aroua, M.K.; Abdul Aziz, A.R.; Sulaiman, N.M.N. The effects of water on biodiesel production and refining technologies: A review. Renew. Sustain. Energy Rev. 2012, 16, 3456–3470. [Google Scholar] [CrossRef]
  7. Demirbas, A. Biodiesel production via non-catalytic SCF method and biodiesel fuel characteristics. Energy Convers. Manag. 2006, 47, 2271–2282. [Google Scholar] [CrossRef]
  8. Ma, F.; Clements, I.D.; Hanna, M.A. The effects of catalyst, free fatty acids, and water on transesterification of beef tallow. Trans. ASAE 1998, 41, 1261–1264. [Google Scholar] [CrossRef]
  9. Leung, D.Y.C.; Wu, X.; Leung, M.K.H. A review on biodiesel production using catalyzed transesterification. Appl. Energy 2010, 87, 1083–1095. [Google Scholar] [CrossRef]
  10. Banković Ilić, B.; Miladinović, M.R.; Stamenković, O.S.; Veljković, V.B. Application of nano CaO–based catalysts in biodiesel synthesis. Renew. Sustain. Energy Rev. 2017, 72, 746–760. [Google Scholar] [CrossRef]
  11. Liu, X.; He, H.; Wang, Y.; Zhu, S. Transesterification of soybean oil to biodiesel using SrO as a solid base catalyst. Catal. Commun. 2007, 8, 1107–1111. [Google Scholar] [CrossRef]
  12. López Granados, M.; Martín Alonso, D.; Sadaba, I.; Mariscal, R.; Ocon, P. Leaching and homogeneous contribution in liquid phase reaction catalyzed by solids: The case of triglycerides methanolysis using CaO. Appl. Catal. B 2009, 89, 265–272. [Google Scholar] [CrossRef]
  13. Albuquerque, M.C.G.; Jiménez Urbistondo, J.; Santamaría González, J.; Mérida Robles, J.M.; Monreno Tost, R.; Rodrígue Castellón, E. CaO supported on mesoporous silica SBA–15 as basic catalysts for transesterification reactions. Appl. Catal. A 2008, 334, 35–43. [Google Scholar] [CrossRef]
  14. Dias, J.M.; Alvim Ferraz, M.C.M.; Almeida, M.F.; Díaz, J.D.M.; Pola, M.S.; Utrilla, J.R. Biodiesel production using calcium manganese oxide as catalyst and different raw materials. Energy Convers. Manag. 2013, 65, 647–653. [Google Scholar] [CrossRef]
  15. Dai, Y.-M.; Li, Y.-Y.; Lin, J.-H.; Kao, I.-H.; Lin, Y.-J.; Chen, C.-C. Applications of M2ZrO2 (M = Li, Na, K) composite as a catalyst for biodiesel production. Fuel 2021, 286, 119392. [Google Scholar] [CrossRef]
  16. Dai, Y.-M.; Li, Y.-Y.; Lin, J.-H.; Chen, B.Y.; Chen, C.-C. One-pot synthesis of acid-base bifunctional catalysts for biodiesel production. J. Environ. Manag. 2021, 299, 113592. [Google Scholar] [CrossRef] [PubMed]
  17. Xie, W.; Yang, Z.; Chun, H. Catalysis properties of lithium–doped ZnO catalyst used for biofuel productions. Ind. Eng. Chem. Res. 2007, 46, 7942–7949. [Google Scholar] [CrossRef]
  18. Bournay, L.; Casanave, D.; Delfort, B.; Hillion, G.; Chodorge, J.A. New heterogeneous process for biodiesel production: A way to improve the quality and the value of the crude glycerin produced by biodiesel plants. Catal. Today 2005, 106, 190–192. [Google Scholar] [CrossRef]
  19. Thitsartarn, W.; Kawi, S. An active and stable CaO–CeO2 catalyst for Transesterification of oil to biodiesel. Green Chem. 2011, 13, 3423–3430. [Google Scholar] [CrossRef]
  20. Chen, G.; Shan, R.; Li, S.; Shi, J. A biomimetic silicification approach to synthesize CaO–SiO2 catalyst for the transesterification of palm oil into biodiesel. Fuel 2015, 153, 48–55. [Google Scholar] [CrossRef]
  21. Chansiriwat, W.; Wantala, K.; Khunphonoi, R.; Khemthong, P.; Suwannaruang, T.; Rood, S.C. Enhancing the catalytic performance of calcium-based catalyst derived from gypsum waste for renewable light fuel production through a pyrolysis process: A study on the effect of magnesium content. Chemosphere 2022, 292, 133516. [Google Scholar] [CrossRef]
  22. Chansiriwat, W.; Chotwatcharanurak, L.; Khumta, W.; Suwannaruang, T.; Shahmoradi, B.; Kumsaen, T.; Wantala, K. Biofuel production from waste cooking oil by catalytic reaction over Thai dolomite under atmospheric pressure: Effect of calcination temperatures. Eng. Appl. Sci. Res. 2021, 48, 102–111. [Google Scholar] [CrossRef]
  23. Albuquerque, M.C.G.; Azevedo, D.S.C.; Cavalgante, C.L.; Santamaría González, J.; Mérida Robles, J.M.; Moreno Tost, R.; Rodríguez Castellón, E.; Jiménez López, A.; Maireles Torres, P. Transesterification of ethyl butyrate with methanol using MgO/CaO catalysts. J. Mol. Catal. A 2009, 300, 19–24. [Google Scholar] [CrossRef]
  24. Woranuch, W.; Ngaosuwan, K.; Kiatkittipong, W.; Wongsawaeng, D.; Appamana, W.; Powell, J.; Rokhum, S.L.; Assabumrungrat, S. Fine-tuned fabrication parameters of CaO catalyst pellets for transesterification of palm oil to biodiesel. Fuel 2022, 323, 124356. [Google Scholar] [CrossRef]
  25. Kocík, J.; Hájek, M.; Troppová, I. The factors influencing stability of Ca–Al mixed oxides as a possible catalyst for biodiesel production. Fuel Process. Technol. 2015, 134, 297–302. [Google Scholar] [CrossRef]
  26. Wu, X.; Kang, M.; Zhao, N.; Wei, W.; Sun, Y. Dimethyl carbonate synthesis over ZnO–CaO bi-functional catalysts. Catal. Commun. 2014, 46, 46–50. [Google Scholar] [CrossRef]
  27. Margaretha, Y.Y.; Prastyo, S.H.; Ayucitra, A.; Ismadji, S. Calcium oxide from Pomacea sp. shell as a catalyst for biodiesel production. J. Energy Environ. Eng. 2012, 3, 33. [Google Scholar] [CrossRef]
  28. Xavier, C.S.; Sczancoski, J.C.; Cavalcante, L.S.; Paiva Santos, C.O.; Li, M.S. A new processing method of CaZn2(OH)6·2H2O powders: Photoluminescence and growth mechanism. Solid State Sci. 2009, 11, 2173–2179. [Google Scholar] [CrossRef]
  29. Lavalley, J.C. Infrared spectrometric studies of the surface basicity of metal oxides and zeolites using adsorbed probe molecules. Catal. Today 1996, 27, 377–401. [Google Scholar] [CrossRef]
  30. Fernández Carrasco, L.; Torrens Martín, D.; Morales, L.M.; Martínez Ramírez, S. Infrared Spectroscopy in the Analysis of Building and Construction Materials; Tech Open Publisher: London, UK, 2012. [Google Scholar] [CrossRef]
  31. Genge, M.J.; Jones, A.P.; David Price, G. An Infrared and Raman study of carbonate glasses: Implications for the structure of carbonatite magmas. Geochim. Cosmochim. Acta 1995, 59, 927–937. [Google Scholar] [CrossRef]
  32. Yang, C.C.; Chen, W.C.; Wang, C.L.; Wu, C.Y. Study the effect of conductive fillers on a secondary Zn electrode based on ball-milled ZnO and Ca(OH)2 mixture powders. J. Power Sources 2007, 172, 435–445. [Google Scholar] [CrossRef]
  33. Rieder, K.; Weinstein, B.; Cardona, M. Measurement and Comparative Analysis of the Second–Order Raman Spectra of the Alkaline-Earth Oxides with a NaCl Structure. Phys. Rev. B 1972, 8, 4780–4786. [Google Scholar] [CrossRef]
  34. Schmida, T.; Dariz, P. Shedding light onto the spectra of lime: Raman and luminescence bands of CaO, Ca(OH)2 and CaCO3. J. Raman Spectrosc. 2015, 46, 141–146. [Google Scholar] [CrossRef]
  35. Seehra, M. Comment on the Raman study of the thermal transformation of calcium hydroxide. J. Solid State Chem. 1986, 63, 344–345. [Google Scholar] [CrossRef]
  36. Ni, M.; Ratner, B.D. Differentiation of Calcium Carbonate Polymorphs by Surface Analysis Techniques—An XPS and TOF-SIMS study. Surf. Interface Anal. 2008, 40, 1356–1361. [Google Scholar] [CrossRef]
  37. Al-Gaashani, R.; Radiman, S.; Daud, A.R.; Tabet, N.; Al-Douri, Y. XPS and optical studies of different morphologies of ZnO nanostructures prepared by microwave methods. Ceram. Int. 2013, 39, 2283–2292. [Google Scholar] [CrossRef]
  38. Alba Rubio, A.C.; Santamaría González, J.; Mérida Robles, J.M.; Moreno Tost, R.; Martıín Alonso, D.; Jiménez López, A.; Maireles Torres, P. Heterogeneous transesterification processes by using CaO supported on zinc oxide as basic catalysts. Catal. Today 2010, 149, 281–287. [Google Scholar] [CrossRef]
  39. Lee, J.; Chung, J.; Lim, S. Improvement of optical properties of postannealed ZnO nanorods. Phys. E 2010, 42, 2143–2146. [Google Scholar] [CrossRef]
  40. Das, J.; Pradhan, S.K.; Sahu, S.R.; Mishra, D.K.; Sarangi, S.N.; Nayak, B.B.; Verma, S.; Roul, B.K. MicrO–Raman and XPS studies of pure ZnO ceramics. Phys. B 2010, 405, 2492–2497. [Google Scholar] [CrossRef]
  41. Doyle, C.S.; Kendelewicz, T.; Carrier, X.; Brown, G.E. The interaction of carbon dioxide with single crystal CaO (100) surfaces. Surf. Rev. Lett. 1999, 6, 1247–1254. [Google Scholar] [CrossRef]
  42. Weng, X.; Cui, Y.; Shaikhutdinov, S.; Freund, H.J. CO2 Adsorption on CaO(001): Temperature-Programmed Desorption and Infrared Study. J. Phys. Chem. C 2019, 123, 1880–1887. [Google Scholar] [CrossRef]
  43. Raouf, F.; Taghizadeh, M.; Yousef, M. Influence of CaO–ZnO supplementation as a secondary catalytic bed on the oxidative coupling of methane. React. Kinet. Mech. Catal. 2014, 112, 227–240. [Google Scholar] [CrossRef]
  44. Xu, L.; Zhu, X.; Chen, X.; Sun, D.; Yu, X. Direct FTIR analysis of free fatty acids in edible oils using disposable polyethylene film. Food Anal. Methods 2015, 8, 857–863. [Google Scholar] [CrossRef]
  45. Rabelo, S.N.; Ferraz, V.P.; Oliveira, L.S.; Franca, A.S. FTIR Analysis for quantification of fatty acid methyl esters in biodiesel produced by microwave-assisted transesterification. Int. J. Environ. Sci. Dev. 2015, 6, 964–969. [Google Scholar] [CrossRef]
  46. Muik, B.; Lendl, B.; Molina, A.; Pérez, L.; Ayora, M.J. Determination of oil and water content in olive pomace using near infrared and Raman spectrometry. A comparative study. Anal. Bioanal. Chem. 2004, 379, 35–41. [Google Scholar] [CrossRef]
  47. Shapaval, V.; Brandenburg, J.; Blomqvist, J.; Tafintseva, V.; Passoth, V.; Sandgren, M.; Kohler, A. Biochemical profiling, prediction of total lipid content and fatty acid profile in oleaginous yeasts by FTIR spectroscopy. Biotechnol. Biofuels 2019, 12, 140. [Google Scholar] [CrossRef]
  48. Núñez, F.; Chen, L.; Wang, J.A.; Flores, S.O.; Salmones, J.; Arellano, U.; Noreña, L.E.; Tzompantzi, F. Bifunctional Co3O4/ZSM-5 Mesoporous Catalysts for Biodiesel Production via Esterification of Unsaturated Omega-9 Oleic Acid. Catalysts 2022, 12, 900. [Google Scholar] [CrossRef]
  49. Murguía–Ortiz, D.; Cordova, I.; Manriquez, M.E.; Ortiz-Islas, E.; Cabrera-Sierra, R.; Contreras, J.L.; Alcántar-Vázquez, B.; TrejO–Rubio, M. Vázquez-Rodríguez, J.T.; Castro, L.V. Na-CaO/MgO dolomites used as heterogeneous catalysts in canola oil transesterification for biodiesel production. Mater. Lett. 2021, 291, 129587. [Google Scholar] [CrossRef]
  50. Hu, S.; Guan, Y.; Wang, Y.; Han, H. NanO–magnetic catalyst KF/CaO–Fe3O4 for biodiesel production. Appl. Energy 2011, 88, 2685–2690. [Google Scholar] [CrossRef]
  51. Knothe, G. Dependence of biodiesel fuel properties on the structure of fatty acid alkyl esters. Fuel Process. Technol. 2004, 86, 1059–1070. [Google Scholar] [CrossRef]
  52. Knothe, G. “Designer” biodiesel: Optimizing fatty ester composition to improve fuel properties. Energy Fuel 2008, 22, 1358–1364. [Google Scholar] [CrossRef]
  53. Hammond, E.G.; Lundberg, W.O. Molar refraction, molar volume and refractive index of fatty acid esters and related compounds in the liquid state. J. Am. Oil Chem. Soc. 1954, 31, 427–432. [Google Scholar] [CrossRef]
  54. Tat, M.E.; Van Gerpen, J.H. The specific gravity of biodiesel and its blends with diesel fuel. J. Am. Oil Chem. Soc. 2000, 77, 115–119. [Google Scholar] [CrossRef]
  55. Tekac, V.; Cibulka, I.; Holub, R. PVT properties of liquids and liquid mixtures: A review of the experimental methods and the literature data. Fluid Phase Equilib. 1985, 19, 133–149. [Google Scholar] [CrossRef]
  56. Pratas, M.J.; Freitas, S.; Oliveira, M.B.; Monteiro, S.C.; Lima, A.S.; Coutinho, J.A.P. Densities and viscosities of fatty acid methyl and ethyl esters. J. Chem. Eng. Data 2010, 55, 3983–3990. [Google Scholar] [CrossRef]
  57. Knothe, G.; Matheaus, A.C.; Ryan, T.W. Cetane numbers of branched and straight chain fatty esters determined in an ignition quality tester. Fuel 2003, 82, 971–975. [Google Scholar] [CrossRef]
  58. Gelbard, G.; Brès, O.; Vargas, R.M.; Vielfaure, F.; Schuchardt, U.F. 1H nuclear magnetic resonance determination of the yield of the transesterification of rapeseed oil with methanol. J. Am. Oil Chem. Soc. 1995, 72, 1239–1241. [Google Scholar] [CrossRef]
  59. Ramírez Verduzco, L.F.; Rodríguez Rodríguez, J.E.; Jaramillo Jacob, A.R. Predicting cetane number, kinematic viscosity, density and higher heating value of biodiesel from its fatty acid methyl ester composition. Fuel 2012, 91, 102–111. [Google Scholar] [CrossRef]
  60. Bamgboyel, A.I.; Hansen, A.C. Prediction of cetane number of biodiesel fuel from the fatty acid methyl ester (FAME) composition. Int. Agrophysics 2008, 22, 21–29. [Google Scholar]
Figure 1. XRD patterns of CaO and CaO–ZnO samples with different ZnO content levels. (a): CaO; (b) CaO–ZnO–5%; (c) CaO–ZnO–10%; (d) CaO–ZnO–15%; (e) CaO–ZnO–20%.
Inorganics 12 00051 g001
Figure 2. FTIR spectra of CaO and CaO–ZnO samples at different levels of ZnO content. (a) CaO–ZnO–0%; (b) CaO–ZnO–5%; (c) CaO–ZnO–10%; (d) CaO–ZnO–15%; (e) CaO–ZnO–20%.
Inorganics 12 00051 g002
Figure 3. Raman spectra of CaO and CaO–ZnO samples at different levels of ZnO content. (a): CaO; (b) CaO–ZnO–5%; (c) CaO–ZnO–10%; (d) CaO–ZnO–15%; (e) CaO–ZnO–20%.
Inorganics 12 00051 g003
Figure 4. XPS spectra of the CaO and CaO–ZnO samples. (A): Ca 2p; (B): Zn 2p; (C): O 1s; (D): C 1s. (a): CaO; (b) CaO–ZnO–5%; (c) CaO–ZnO–10%; (d) CaO–ZnO–15%; (e) CaO–ZnO–20%. * The O–H species belong to CaZn2(OH)6 phase. * The O–H species belong to CaZn2(OH)6 phase.
Inorganics 12 00051 g004
Figure 5. TPD–CO2 profiles of CaO and CaO–ZnO samples. (a): CaO; (b) CaO–ZnO–5%; (c) CaO–ZnO–10%; (d) CaO–ZnO–15%; (e) CaO–ZnO–20%. Peak I (325–400 °C), peak II (375–475 °C) and peak III (450–475 °C): moderate strong basic sites; Peak IV (475–550 °C): strong basic sites.
Inorganics 12 00051 g005
Figure 6. AFM micrographs of the CaO and CaO–ZnO samples. (a): CaO; (b) CaO–ZnO–5%; (c) CaO–ZnO–10%; (d) CaO–ZnO–15%; (e) CaO–ZnO–20%.
Inorganics 12 00051 g006
Figure 7. TEM micrographs of pure CaO (A) and CaO–ZnO–15 (B) samples.
Inorganics 12 00051 g007
Figure 8. Effect of the thermal treatment of catalysts on palm oil conversion.
Inorganics 12 00051 g008
Figure 9. Ca–Zn–O@CaCO3 core–shell heterostructures and Ca2+ solubility in methanol.
Inorganics 12 00051 g009
Table 1. Textural data and basicity of the catalysts.
CatalystsZnO Concentration
(mol%)
Surface Area (m2/g)Pore Volume (cm3/g)Pore Diameter
(nm)
Surface Basicity (µmol/g)
CaO085.50.37817.710.8
CaO–ZnO–5%5108.00.46517.210.4
CaO–ZnO–10%1044.80.36614.58.6
CaO–ZnO–15%1513.50.06820.17.4
CaO–ZnO–20%2012.60.05621.35.4
Table 2. Comparison of Mexican palm oil conversions using the catalysts without and with thermal treatment.
CatalystConversion (%)
(without Thermal Treatment)
Conversion (%)
(with Thermal Treatment)
CaO–ZnO–0%97.598.8
CaO–ZnO–5%97.197.0
CaO–ZnO–10%94.196.8
CaO–ZnO–15%79.396.9
CaO–ZnO–20%70.296.8
Table 3. Ca2+ concentration in methanol or in mixture of methanol/glycerol (4:1) and palm oil after 3 h immersion.
CatalystMethanol
Ca2+ (mg/L)
Methanol/Glycerol Mixture (4:1) Ca2+ (mg/L)Palm Oil
Ca2+ (mg/L)
CaO121.7101.97.2
CaO–ZnO–5%47.249.65.5
CaO–ZnO–10%34.632.60
CaO–ZnO–15%31.034.00
CaO–ZnO–20%31.735.30
Table 4. Comparison of catalytic activities obtained with different CaO–related catalysts under various experimental conditions.
CatalystsFeedstocksAlcohol/Oil RatioCatalyst/Oil
(wt%)
Reaction Temperature (°C)Reaction Time (h)Yield or
Conversion (%)
Refs.
CaO–ZnO (10mol% ZnO)Palm oil
+ methanol
4:12.260396.8This work
CaO/γ-Al2O3Palm oil
+ methanol
12:11065693.0[24]
CaO–SiO2 (2Si5Ca)Palm oil
+ methanol
15:1965880.1[20]
Na-CaO/MgO Canola oil + methanol12:1565695.4[49]
CaO–CeO2
(1Ca1Ce-650)
palm oil
+ methanol
20:158510>90[19]
KF/CaO/Fe3O4
(Calcination at 600 °C)
Stillingia oil + methanol12:1465395[50]
Table 5. Data of density, cetane number, average molecular weight, and refractive index of the biodiesels obtained with different thermal-treated catalysts *.
CatalystsDensity
(g/cm3)
Cetane NumberAverage Molecular Weight (g/mol)Refractive Index.
CaO0.868071.38271.21.456
CaO–ZnO–10%0.875367.43269.61.442
CaO–ZnO–15%0.878962.16270.31.458
* All the data were obtained at 20 °C.
Table 6. Components of Mexican palm oil.
ComponentMass Fraction (%)Molar Fraction (%)Molecular Mass (g/mol)
Tripalmitin47.145.0807.5
Triolein37.633.2885.6
Trilinolein11.510.1879.6
Palmitic acid3.812.7256.5
Disclaimer/Publisher’s Note: The statements, opinions and data contained in all publications are solely those of the individual author(s) and contributor(s) and not of MDPI and/or the editor(s). MDPI and/or the editor(s) disclaim responsibility for any injury to people or property resulting from any ideas, methods, instructions or products referred to in the content.

