
Biosynthesis and Characterization of Zinc Oxide Nanoparticles (ZnO-NPs) Utilizing Banana Peel Extract


1
Discipline of Pharmaceutical Technology, School of Pharmaceutical Sciences, Universiti Sains Malaysia (USM), Gelugor 11800, Penang, Malaysia
2
Department of Pharmacy, Al Maarif University College, Ramadi 31001, Iraq
3
Hamdi Mango Center for Scientific Research, The University of Jordan, Amman 11942, Jordan
4
The Nanotechnology Center, The University of Jordan, Amman 11942, Jordan
*
Authors to whom correspondence should be addressed.
Inorganics 2024, 12(4), 121; https://doi.org/10.3390/inorganics12040121
Submission received: 15 March 2024
/
Revised: 12 April 2024
/
Accepted: 12 April 2024
/
Published: 18 April 2024
Abstract
:In recent years, there has been a significant focus on the green synthetization of metal oxide nanoparticles due to their environmentally friendly features and cost-effectiveness. The aim of this study is to biosynthesize zinc oxide nanoparticles (ZnO NPs) through a green method, utilizing crude banana peel extract as reducing and capping agents, to characterize the synthesized ZnO NPs and test their antibacterial activity. ZnO NPs were biosynthesized using the peel extract of banana with various concentrations of zinc acetate dihydrate salt, followed by annealing at 400 °C for 2 h. The synthesized ZnO NPs were characterized using UV–visible spectroscopy (UV-Vis), scanning electron microscopy (SEM), dynamic light scattering (DLS), attenuated total reflectance–Fourier-transform infrared (ATR-FTIR), and X-ray diffraction (XRD). Also, its antibacterial efficiency against different bacterial strains was tested. ZnO NPs were biosynthesized successfully using the extract of Musa Acumniata (cavendish) fruit peel with a UV-Vis wavelength range of 344 to 369 nm and an electrical band gap ranging from 3.36 to 3.61 eV. The size varied from 27 ± 4 nm to 89 ± 22, and the negative zeta potential (ζ) ranged from −14.72 ± 0.77 to −7.43 ± 0.35 mV. ATR-FTIR analysis showed that the extract phytochemical functional groups were present on ZnO NPs. XRD results confirm the formation of a highly pure wurtzite hexagonal structure of ZnO NPs. Moreover, the best obtained size of ZnO NPs was selected for the antibacterial tests, giving the highest inhibition growth rate against Staphylococcus epidermidis (98.6 ± 0.9%), while the lowest rate was against Pseudomonas aeruginosa (88.4 ± 4.4%). The minimum inhibitory concentration (MIC) and minimum bactericidal concentration (MBC) were reported and compared to previous studies. The unique properties of greenly synthesized ZnO NPs and their antibacterial activity have potential for reducing environmental pollution and the use of antibiotics, which may contribute to solving the problem of bacterial resistance. Therefore, studies that aim to design an applicable dosage form loaded with biosynthesized ZnO NPs might be conducted in the future.
1. Introduction
Different types of nanoparticles (NPs) exhibit unique properties in comparison to bulk particles, such as their high surface area and small size, ranging from 1 to 100 nm [1]. NPs’ interesting features make them the most common elements in the fields of nanotechnology and nanoscience, leading to the use of NPs in various medical and pharmaceutical applications [2]. It is important to study and develop new methods of NP production without the harmful side effects and environmental pollution that may be caused by utilizing chemical and physical methods for the synthesis of NPs. The shift towards eco-friendly, green, and biologically safe methods has been expanded recently by many researchers due to the necessity of producing NPs without damaging the natural world. Therefore, biologically green methods are applied to NP production processes using bacteria and plant extracts [3].
Zinc oxide nanoparticles (ZnO NPs) are one of the most interesting metal oxide NPs in the field of nanoscience because of their different properties, effects, and applications in biomedical fields, such as bioimaging [4], drug delivery [5], antimicrobial, and anticancer [6], in addition to their photocatalytic action [7] and wastewater remediation [8].
The ZnO NP is a semiconductor with a wide band gap of 3.37 eV and 60 mV excitation energy at ambient temperature [9]. It has a hexagonal wurtzite crystal structure and is present in solid form as a white powder [10]. ZnO NPs can be synthesized by physical and chemical methods; however, these routes possess many disadvantages, such as the use of costly equipment and materials, increased waste generation, large energy consumption, and environmental and biological issues by using toxic and hazardous chemical compounds during synthetization [11]. These drawbacks lead to the emergence of green methods to avoid the mentioned problems by using different plant extracts to synthesize ZnO NPs, such as an extract of the leaves of Mangifera Indica and Annona Muricata [12], an extract from the flower of Nyctanthes arbortristis [13], an extract of the leaves of Phoenix dactylifera [14], and an aqueous extract of the leaves of Laurus nobilis [15]. These extracts contain different phytochemicals (phenol, alkaloids, tannins, flavonoids, terpenes, saponins, and proteins) that can act as reducing, capping, and stabilizing agents to aid in the stabilization of nanoparticle formation as well as controlling crystal growth during synthetization [16,17]. The use of a plant extract is the most preferable method over other eco-friendly methods in the biosynthesis of metallic NPs due to the availability and affordability of plant sources, as well as its simplicity and reduced time consumption [18]. ZnO NPs have a promising antibacterial effect on various bacterial species by using different mechanisms of action against both Gram-negative and -positive bacteria. ZnO NPs have been reported to be non-toxic to human cells [19], necessitating their use as antibacterial agents, noxious to microorganisms, and having good biocompatibility with human cells [20].
In this work, bananas were chosen as the plant source for the biosynthesis process of ZnO NPs due to being an edible plant source, low cost, and having a phytochemically rich peel that plays a crucial role in the NP biosynthesis process [21]. Bananas belong to the Musaceae family, which includes several hybrids in the genus Musa [22]. Banana peel extract (BPE) contains many components, including flavonoids, tannins, phlobatannins, alkaloids, glycosides, pectin, and terpenoids, as well as enzymes such as polyphenol oxidase. These compounds are supposed to reduce, cap, and stabilize biosynthesized NPs [23]. According to the literature, there are few reported works on the synthesis of ZnO NPs using BPE [24,25,26]. However, the obtained NPs differ in their production methods. This highlights the gap in looking for an optimum synthesis methodology in view of producing ZnO NPs with exceptional performance. We analyzed the production methods used in various studies that involve the use of green sources for biosynthesis. It was found that most studies follow either the precipitation or sol–gel method. However, the difference lies in the annealing process and precursor concentration. Our study involves conducting an annealing process on the final produced NP powder, in contrast to studies that synthesize ZnO NPs and nanosheets without the annealing process. This could lead to improved purity and uniformity of the biosynthesized ZnO NPs, thereby enhancing their antibacterial action against different bacterial strains and providing better results.
In this study, we work on the green synthesis, characterization, and antibacterial effect of the biosynthesized ZnO NPs using BPE. Zinc acetate was used as a zinc precursor at different concentrations with fixed amounts of BPE. The effect of zinc acetate concentration on particle size and charge was reported using scanning electron microscopy (SEM) and dynamic light scattering (DLS). Other ZnO NP characterizations were studied utilizing ultraviolet–visible spectroscopy (UV–Vis), attenuated total reflectance–Fourier transform infrared (ATR-FTIR), and X-ray powder diffraction (XRD). The antibacterial activity of ZnO NPs is studied against four different bacterial strains, including Escherichia coli (E. coli), Pseudomonas aeruginosa (P. aeruginosa), Staphylococcus aureus (S. aureus), and Staphylococcus epidermidis (S. epidermidis).
2. Results and Discussion
2.1. Banana Species Identification
2.2. Characterization and Analysis Technique for Banana Peel Extract
2.2.1. Manual Screening Tests
2.2.2. Liquid Chromatography/Mass Spectroscopy (LC/MS) Analysis
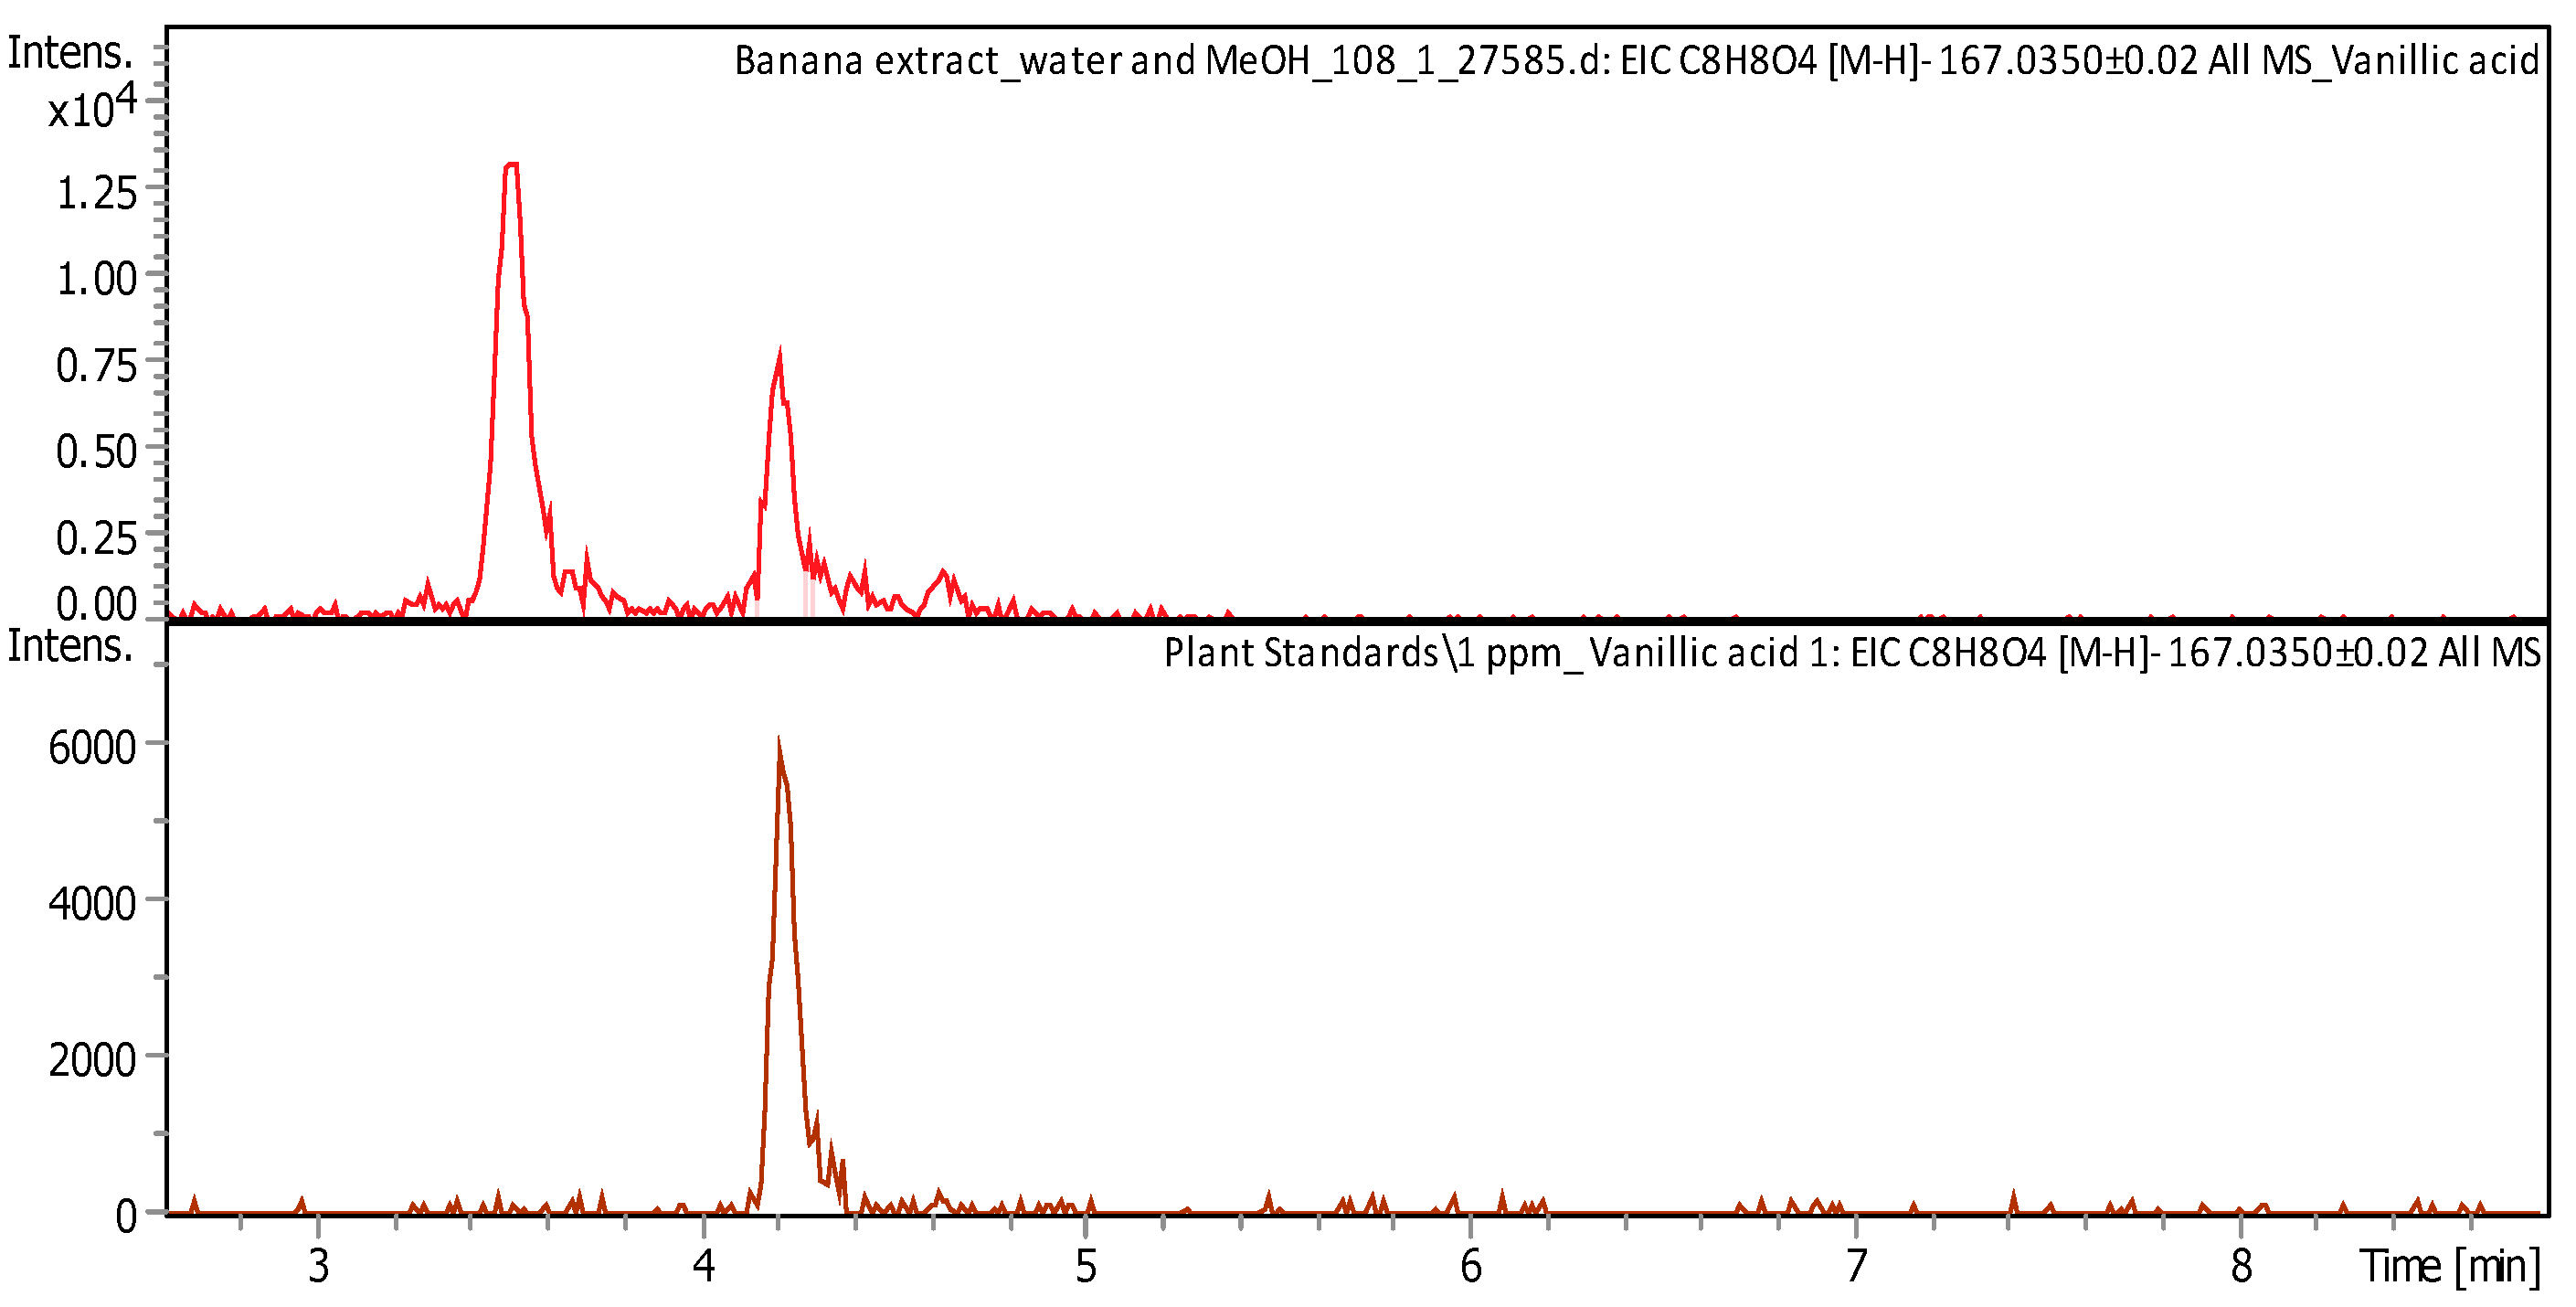
The extract phytochemical classes within the extract were flavonoids and phenolic compounds, which have an important role in ZnO synthesis stages [29]. In this study, we screened and measured the main compounds belonging to the mentioned classes, such as Quercetin, Rutin, Catechin, Ferulic Acid, Caffeic acid and Vanillic acid.
An LC-MS chromatogram is presented in Appendix A (Figure A1, Figure A2, Figure A3, Figure A4, Figure A5 and Figure A6), indicating the separated compounds from aqueous BPE and compared with the standard for each compound.
The compounds identified and their concentrations in the extract were calculated according to the utilized standards, as detailed below in Table 2.
2.3. Synthesis of ZnO NPs and Yield
The biosynthesized ZnO NPs were collected after the annealing process as white powder and weighed to measure the yield percentage of each sample according to the previously mentioned Equation (1). Figure 4 shows the percentage of ZnO NPs.
2.4. Characterization of ZnO NPs
2.4.1. UV–Visible Spectroscopy
In terms of the UV–visible absorption spectrum of biosynthesized ZnO nanoparticles using BPE with Zn precursor concentrations ranging from 0.01 M to 0.1 M, as shown in Figure 5A, a strong absorption band between 300 and 550 nm is known to be presented by ZnO NPs [31]. Due to the ZnO nanoparticles’ surface plasmon resonance (SPR) property, they exhibit a characteristic peak in the range of 300 to 370 nm, indicating nanoparticle electron vibration with the light wave [31]. The position of ZnO nanoparticles’ SPR is influenced by both their shape and size. In particular, the size of the synthesized nanoparticles is directly proportional to the absorbed wavelength by ZnO nanoparticles. Larger nanoparticles exhibit a high absorption wavelength, while smaller nanoparticles exhibit a lower wavelength [32]. The spectra reveal that the absorbance wavelength decreases with decreased Zn precursor concentration at a fixed quantity of BPE, as observed for the peak of the lowest Zn precursor concentration (0.01 M). There are distinct peaks around 370–340 nm for ZnO NP samples. The peak at 344 nm shows a blue shift in the 0.01 M sample in Figure 5D compared to other samples (0.1 M, 0.07 M, and 0.04 M), which have peaks at 369, 364, and 361 nm, respectively, in Figure 5A–C. The peak of the 0.01 M sample becomes narrower and sharper than others, suggesting more particle production and the promotion of the formation of smaller nanoparticles. As illustrated, the SPR band ranging around 340–370 nm confirms ZnO nanoparticle formation, in agreement with previously reported results [33,34]. The ZnO NP band gaps are calculated from the wavelength of the maximum peak absorbance according to Equation (2), as illustrated in Table 3.
2.4.2. Scanning Electron Microscopy (SEM)
The influence of different concentrations of Zn acetate solution (0.01 M, 0.04 M, 0.07 M, and 0.1 M) and BPE on the shape and size of ZnO NPs during the biosynthesis process is studied. The results indicate that when the Zn acetate concentration increased from 0.01 M to 0.1 M, the particle size decreased from 89 ± 22 nm to 27 ± 4 nm, as tabulated in Table 3. SEM images in Figure 6 show that the largest nanoparticles are formed with the highest concentration of Zn acetate. The biosynthesized ZnO NPs have a rod-like structure, as seen in Figure 6A, and a hexagonal structure, as seen in Figure 6B–D. NP size frequency percentages for each sample were counted by using image J software 1.53t. from SEM images, as shown in Figure 7. In the presence of fixed amounts of BPE, the size increased as the Zn acetate concentration increased due to the competition between Zn ions and functional groups of BPE phytochemicals. Higher percussor concentrations form large anisotropic particles, and these findings agree with the findings of Mohammadi and Ghasemi in 2018 [31]. Large particle sizes are produced upon increasing the Zn acetate concentration because of metal ion availability, resulting in the aggregation and agglomeration of NPs with higher precursor concentrations [35]. Thus, 0.01 M of Zn acetate is the optimum concentration for the green synthesis of ZnO nanoparticles using BPE.
2.4.3. Dynamic Light Scattering (DLS) Analysis
The size and charge of biosynthesized ZnO nanoparticle samples (0.1 M, 0.07 M, 0.04 M, and 0.01 M) were compared to report the effect of changing zinc acetate precursor concentrations at fixed BPE amounts. It was found that there is a significant difference in both size and charge between each sample, as presented in Table 4.
According to the findings, there is an inverse relationship between size and precursor concentrations in the presence of fixed BPE quantities due to the extract effect acting as a reducing, stabilizing, and capping agent during the biosynthesis process [36]. Concerning nanoparticle charge, it was found that size and charge are inversely proportional. This is because a decrease in particle repulsion force causes nanoparticles to aggregate into larger particles [37]. At higher charge and low PDI, as seen with samples (c) 0.04 M and (d) 0.01 M, the zeta potential was −14.72 ± 0.77 mV and −13.18 ± 1.15 mV and PDI 0.253 ± 0.09 and 0.28 ± 0.036, respectively, improving the stability of NPs and hindering their agglomeration due to good particle size distributions. High negative charge refers to a significant amount of negative charge present on the particle’s surface, resulting in strong repulsion between particles and greater stability of the colloidal suspension [38]. Furthermore, the negative zeta potential value can be attributed to the presence of negatively charged capping agents that are bound to the surface of the nanoparticles. In this study, the stability of the synthesized ZnO NP colloidal suspension is confirmed by the zeta potential values being within a range of +25 to −25 mV, which is considered stable [39].
The large difference between SEM and DLS measurements for the same synthesized nanoparticle sample is due to the presence of a solvent layer adhering to the particle surface as it moves under the influence of Brownian motion and, thus, its measured hydrodynamic radius. It is anticipated that the diameter of actual nanoparticles will be smaller than the value obtained by DLS [40,41,42]. The shape of NPs can influence how light scatters off the particles. Spherical nanoparticles typically produce simpler scattering patterns compared to non-spherical or irregularly shaped particles. The shape of the synthesized NPs was hexagonal, not spherical, which introduced complexities in the interpretation of DLS data. In such cases, complementary techniques like electron microscopy are used to confirm the shape and provide additional insights into the particle morphology [43,44]. The size and charge distribution are illustrated in Figure 8 and Figure 9.
2.4.4. Attenuated Total Reflectance–Fourier-Transform Infrared (ATR-FTIR)
In addition to carbohydrates, many phytochemicals, like alkaloids, flavonoids, glycosides, phenols, and tannins, are present within banana peels [42]. In this study, only the substances that are water-soluble are expected to be present (Figure 10A) due to the use of water as a solvent for extraction. A broad and intense peak at 3310 cm−1 represents (O-H) hydroxyl groups for phenolic compounds, alkaloids, and water [45]. This peak also belongs to the (N-H) bond [46]. The vibration of methyl bonds (C-H) in aliphatic hydrocarbons presented at 2939 cm−1 was similarly observed by Rojas Flores and co-workers in 2022 [47]. The sharp peak at 1635 cm−1 belongs to the vibration of (C=C) bonds in aromatic rings, as previously reported by Sangeetha and co-workers in 2012 [48]. This band is also attributed to (C=O) of amides, the N-H of amines, and carboxylic groups, which are related to amino acids and flavonoids based on previous plant extract studies by Oliveira and co-workers in 2016 [46]. The peak at 1396 cm−1 arises from (C-O-C) stretching modes of vibration and (C-H) bending [49]. Furthermore, the peak for vibrations of (C-O) bonds was presented at 1257 cm−1 (lignin band) and may be attributed to ester and amide [49], while the peak at 1061 cm−1 relates to the stretching of (C-OR) bonds, which are related to phenolic compounds [50]. The band at 630 cm−1 is attributed to the bond vibration of the (C-H) group in carbohydrates [51]. These results confirm the presence of necessary phytochemical compounds and functional groups that could be responsible for the process of reduction and stabilization of ZnO NPs, as explained in the results of ATR-FTIR for the prepared ZnO NPs.
After the annealing process, the prepared powder of ZnO NPs was analyzed using ATR-FTIR. Figure 10A,B display the spectra of ZnO NPs, BPE, and Zn acetate. The synthesized ZnO NP functional group bands are located at 3671, 2980, 2901, 1396, 1241, 1061, 882, and 410 cm−1, as shown in Figure 10A, in comparison with the BPE spectrum. The peak at 3671 cm−1 could be related to (O-H) and its stretching vibration, which indicates the involvement of hydroxyl groups from the polyphenolic compounds of BPE, in addition to the peaks at 2980 and 2901 cm−1, which are probably assigned to (C-H) stretching and responsible for capping of ZnO NPs. These results correlate with the results of the green synthesis of ZnO NPs by Acalypha indica leaf extract [52]. The peaks at 1396 and 1061 cm−1, which are present in BPE and ZnO NP spectra, indicate (C-O-C) stretching modes of vibration and (C-H) bending, which are related to phenolic compounds in BPE, suggesting the capping effect of BPE biochemicals on ZnO NPs. Furthermore, the shift from 1257 to 1241 cm−1 also highlighted the presence of an amide bond from BPE proteins on ZnO NPs [53].
In comparison with the Zn acetate spectra in Figure 10B, the formation of new peaks at 1396, 1061, and 1241 cm−1 in the ZnO NPs spectrum confirms a capping effect of phytochemicals from BPE on the synthesized ZnO NPs. In addition to the sharp characteristic and intense peak that can be seen at 410 cm−1 for the bond vibration of (Zn-O), this confirms the formation of ZnO NPs using BPE [53,54]. Synthesized ZnO NPs show the same peaks at 1061 cm−1 and 1396 cm−1 in addition to shifted peaks from 1257 cm−1 to 1241 cm−1 and 1939 cm−1 to 2091 cm−1, which are related to the BPE. This suggests occurrences of capping and bounding on the ZnO NP surface as BPE gives electrons for the reduction process of Zn ions to ZnO NPs with stabilizing effects. These findings agree with a previously conducted study of ZnO-NP synthesis using the leaf extract of Sambucus ebulus [45].
2.4.5. X-ray Powder Diffraction (XRD)
Biosynthesized nanoparticle powder was characterized by XRD to confirm the formation of ZnO nanoparticles using banana peel extract. Based on the JCPDS card number 00036-1451 (ZnO wurtzite) of the standard ZnO nanoparticle diffractogram (JCPDS, 1977), ZnO nanoparticles were synthesized successfully by BPE, which obtained values of 2θ angles at (100) 31.78°, (002) 34.42°, (101) 36.25°, (102) 47.53°, (110) 56.57°, (103) 62.87°, (200) 66.42°, (112) 67.93°, (201) 69.09°, (004) 72.5°, and (202) 76.9°. These peaks, which are presented in Figure 11, indicate the presence of a hexagonal wurtzite crystalline structure, corresponding to JCPDS No. 36-1451. No peaks corresponding to impurities were noted. These results agree with a previous study by Ghamsari and co-workers in 2019 [55].
2.5. Antibacterial Activity of ZnO NPs
Based on the optimized characteristics of ZnO nanoparticles, sample (D) (0.01 M ZnO NPs) was selected to test the rate of growth inhibition against E. coli ATCC no. 25922, P. aeruginosa ATCC no. 27853, S. aureus ATCC no. 25913, and S. epidermidis ATCC no. 12228. MIC and MBC were determined. Figure 12 shows the growth inhibition rate of bacterial growth in the presence of ZnO NPs compared with the growth rate in the absence of ZnO NPs. According to Equation (3), the results of growth inhibition show that the highest antibacterial effect of ZnO-NPs was against S. epidermidis (98.6 ± 0.9%), while the lowest effect was against P. aeruginosa 88.4 ± 4.4%. The MIC of ZnO NPs was at 500 µg.mL−1, with a growth inhibition of 90.5 ± 1.4% and 89.5 ± 1.32% against S. aureus and S. epidermidis, respectively. Furthermore, the MIC was at 500 µg.mL−1 with 79.11 ± 1.69% growth inhibition against E. coli and 600 µg.mL−1 against P. aeruginosa with a growth inhibition of 88.4 ± 4.4%. The synthesized ZnO NPs were effective against all tested bacterial strains with different MIC levels, depending on the type of bacteria. Table 5 presents the MIC and MBC of ZnO NPs against tested bacterial strains, indicating that the bactericidal action of ZnO NPs against S. aureus and S. epidermidis was at 500 µg.mL−1. There is no bactericidal action of ZnO NPs against both E. coli and P. aeruginosa.
Based on the results presented in Table 5, it can be concluded that ZnO NPs inhibit the growth of both G-positive and G-negative bacteria strains, while no anti-bacterial effect is observed against bacteria strains using BPE. The susceptibility of bacteria to ZnO NPs might vary based on several parameters, such as the bacterial species, the characteristics of the nanoparticles, and experimental environments. This is in agreement with previous results by Ibrahem and co-workers in an investigation of the antibacterial activity of ZnO NPs against S. aureus and P. aeruginosa [56].
The action of ZnO NPs was previously cited to be against bacteria cells via surface proteins, subsequently penetrating the cell [57]. This interaction alters the cell’s metabolism, ultimately resulting in bacterial cell destruction, loss of cell integrity, and death [57]. The liberation of hydrogen peroxide and reactive oxygen species (ROS) by ZnO NPs on bacterial cells, in addition to the reactions with DNA, lipids, and proteins, were ZnO mechanisms for damaging bacterial cells, leading to cell death [58].
An overview of the current results is presented alongside studies reported in the literature in Table 6. In particular, the synthesis method, particle size, and the effect of ZnO NPs on different bacteria strains are considered. According to Table 6, synthesized ZnO NPs using chemical methods exhibit antibacterial effects against different bacterial strains, with MICs ranging from 3100 to 800 µg.mL−1 and MBCs ranging from 16,000 to 800 µg.mL−1. Green synthesis using BPE was conducted in a few studies without applying the annealing process [24,25,26]. Other studies synthesizing ZnO NPs using green methods gave lower MICs by testing ZnO NPs against lower bacterial concentrations than our study. In comparison with the above-mentioned studies, the biosynthesized ZnO NPs in our study exhibit better antibacterial activity against both Gram-positive and Gram-negative bacterial strains when compared to ZnO NPs made using other methods. This improvement in antibacterial activity may be due to the high purity of greenly synthesized ZnO NPs using bioactive phytocompounds, which include flavonoids and polyphenols from BPE [59], followed by an annealing process to improve crystallinity and enhance the removal of impurities and defects to ensure the highest purity and effect [60,61].
Several methods can be used to synthesize nanoparticles. Green synthesis offers a simpler and more affordable synthesis procedure than chemical or physical methods, which are expensive and produce dangerous by-products. It reduces the amount of chemicals released into the environment and eliminates needless processing stages [72]. A concise overview is provided in Table 7, comparing between traditional methods and green synthesis in NP production, highlighting key aspects, such as environmental impact, energy consumption, cost-effectiveness, product quality, and regulatory compliance.
In brief, green synthesis provides a more environmentally friendly, energy-efficient, cost-effective, and compliant alternative to conventional techniques of synthesizing nanoparticles. This makes it a potential approach for sustainable applications in nanotechnology.
3. Materials and Methods
3.1. Materials and Reagents
The banana fruit was taken from a local plant at the University of Since Malaysia (USM), Penang, Malaysia (5.356318° N, 100.297760° E). Zinc acetate dihydrate (Zn (CH3COO)2·2H2O) was chosen as the precursor, while absolute ethanol 99.8% v/v and sodium hydroxide, ammonia solution 32% w/v, hydrochloric acid solution 37% w/v, glacial acetic acid 99.5% v/v, sulfuric acid 95.0–98.0% w/w, ferric chloride solution 45% w/v, olive oil, quercetin, rutin, catechin, ferulic acid, caffeic acid, and vanillic acid were purchased from Sigma Aldrich®, Inc., St. Louis, MO, USA. All the obtained materials and chemicals were of analytical grade. Acetonitrile, methanol, and formic acid were LC/MS grade from Sigma Aldrich®, Inc., St. Louis, MO, USA.
3.2. Banana Species Identification and Banana Peel Extract Preparation
Banana fruit, leaf, and flower were collected and washed for microscopic identification after the air-drying process at Herbarium center, USM, Penang, Malaysia, to identify and report their species and herbarium number. The banana fruits were washed multiple times with distilled water (D.W.) to eliminate any dust particles and contaminants that may have been present on their peels. The peels were air-dried, cut into smaller pieces, and then extracted using the method of decoction with D.W. For the extraction process, 10 g of banana peel was used in 100 mL of D.W. at 80 °C for 1 h with continuous stirring. The extracted solution was filtered first using muslin cloth, followed by filtration using Whatman No. 1 filter paper thrice. The final BPE solution was stored at 4 °C for further analysis and use.
3.3. Characterization and Analysis Technique for Banana Peel Extract
3.3.1. Manual Screening Tests
A qualitative analysis of BPE within the same concentration as the extract concentration that will be used in the synthesis process (10 g/100 mL) was conducted to detect phytochemicals responsible for ZnO nanoparticle production, such as flavonoids, tannins, saponins, and glycosides.
Ammonia solution (3 drops) was added to 5 mL of the aqueous BPE, followed by 0.5 mL of concentrated HCL, and the resulting color was recorded to detect the presence of flavonoids.
Acetic acid was added (2 mL) to 5 mL of the aqueous BPE, then cooled at 4 °C in an ice bath to add 1 mL of concentrated H2SO4 dropwise until an oily layer formed, indicating the presence of glycosides.
Emulsion tests were used to detect the presence of saponins by mixing 5 mL of the aqueous BPE with D.W. and shaking vigorously until froth formed. Then, 3–5 drops of olive oil were added to the froth and shaken vigorously until a stable emulsion formed. Saponin presence was confirmed by conducting a shaking test as well. The formation of stable froth at the top of the extract confirms the presence of saponins.
The presence of tannins was tested by adding 2–3 drops of 5% FeCl3 to 5 mL of the aqueous BPE and observing the precipitate formation, and a change in color indicated tannin in the aqueous BPE.
The presence of phlobatannins was tested by boiling 3 mL of the aqueous BPE with 2 mL of 1% HCL. The presence of red color at the bottom of the test tube and the deposition of red precipitate confirms the presence of phlobatannins.
A lead acetate test was used for phenolic compound detection with the addition of a 10% lead acetate solution to 5 mL of the aqueous BPE. The formation of bulky white precipitates confirms the presence of phenolic compounds.
3.3.2. Liquid Chromatography/Mass Spectroscopy (LC/MS) Analysis
Sample preparation: The aqueous BPE solvent was evaporated using a rotary evaporator to obtain the extract in solvent-free form. The dried extract (64.4 mg) was dissolved in 10 mL D.W. and 40 mL methanol, then centrifuged at 4000 rpm for 2 min, and 1 mL was transferred to an auto sampler to inject 3 μL.
Instrumentation and LC/MS parameters: In-house method was used for the BPE sample analysis using Bruker Daltonik (Bremen, Germany) Impact II ESI-Q-TOF System equipped with Bruker Dalotonik Elute UPLC system (Bremen, Germany) for screening compounds of interest. This instrument was operated using the Ion Source Apollo II ion Funnel electrospray source. The capillary voltage was 2500 V, the nebulizer gas was 2.0 bar, the dry gas (nitrogen) flow was 8 L/min, and the dry temperature was 200 °C. The mass accuracy was ˂1 ppm; the mass resolution was 50,000 FSR (Full Sensitivity Resolution); and the TOF repetition rate was up to 20 kHz.
Chromatographic separation was performed using a Bruker Solo 2.0_C-18 UHPLC column (100 mm × 2.1 mm × 2.0 μm) at a flow rate of 0.51 mL/min and a column temperature of 40 °C. The solvents were (A) D.W. with 0.1% methanol and (B) methanol.
Phytochemical Standards (Quercetin, Rutin, Catechin, Ferulic Acid, Caffeic acid and Vanillic acid) stock solutions were prepared in different concentrations, ranging from 10 to 0.5 ppm, dissolved in dimethyl sulfoxide-DMSO (analytical grade), then diluted with acetonitrile and used for identification of the exact MS and retention time.
3.4. Synthesis of ZnO Nanoparticles
ZnO nanoparticles were synthesized using a green (eco-friendly) route by the precipitation method [52]. BPE was used as a reducing, caping, and stabilizing agent to produce nanoparticles without the use of harmful substances to the environment. Four different concentrations of Zn acetate solution (0.1 M, 0.07 M, 0.04 M, and 0.01 M) were prepared, followed by the dropwise addition of BPE (10 mL for each 100 mL of Zn acetate solution). The reaction mixture was stirred at 600 rpm and 70 °C for 2 h. The pH of the reaction was controlled by gradually adding 2 M NaOH at a constant rate until the pH reached 12. The solution changed, and then a white precipitate formed. After the reaction was completed, the mixture was centrifuged for 20 min at 5000 rpm, and the supernatant was removed, while the precipitate was collected, dried, and annealed in a furnace oven at 400 °C for 2 h. The calculation of the yield of ZnO NPs was according to Equation (1) [30] as follows:
3.5. Characterization of Zinc Oxide NPs
3.5.1. UV–Visible Spectroscopy
The biosynthesized ZnO NP powder was dispersed in deionized water with a concentration of 0.1 wt.% to be used for UV–visible spectroscopy measurements. The band gap equation used for ZnO NP band gap estimation is obtained by applying Equation (2) [80]. The absorption spectra were measured using a UV–Vis spectrophotometer (UV-1601, Shimadzu, Kyoto, Japan) within a wavelength range of 200–800 nm.
where band gap is represented by E and the wavelength is represented by λ at the sharp peak.
3.5.2. Scanning Electron Microscopy (SEM)
The size and surface morphology of the green synthesized ZnO nanoparticle samples (0.1 M, 0.07 M, 0.04 M, and 0.01 M) were studied using FEI Quanta FEG 450 instruments (FEI, Eindhoven, The Netherlands). The tested samples were prepared by mounting the powder of ZnO NPs on aluminum stubs, followed by a coating using gold films (5 nm thickness). The estimation of ZnO NPs’ sample size was reported utilizing the Image J program [81].
3.5.3. Dynamic Light Scattering (DLS) Analysis
DLS was used to determine the size, size distribution diagram, the charge, and charge distribution diagram of biosynthesized ZnO nanoparticles. The test was conducted using DLS (Malvern, Zetasizer Ver. 7.11). The estimation of DLS primarily relies on the phenomenon of Rayleigh scattering, exhibited by the suspended nanoparticles present in the solution [82].
3.5.4. Attenuated Total Reflectance–Fourier-Transform Infrared (ATR-FTIR)
The ATR-FTIR spectra for the powder of biosynthesized ZnO NPs and Zn acetate were recorded to confirm the formation of ZnO NPs and compare it with Zn acetate precursor. The spectra were analyzed under atmospheric pressure at room temperature using ATR-FTIR PerkinElmer at a resolution of 4 cm−1 from 400 to 4000 cm−1 with a scan average of 32 scans in ATR mode.
3.5.5. X-ray Powder Diffraction (XRD)
XRD was used to study the crystalline nature of biosynthesized ZnO nanoparticles. XRD analysis was conducted in a scan range of 0–80° of Bragg angle using (Cu Kα) wavelength radiation λ = 0.1541 Å by a 7000 Shimadzu 2 kW model X-ray spectrophotometer instrument (Shimadzu, Kyoto, Japan) at a 40 kV operating voltage and current of 40 mA.
3.6. Antibacterial Activity of ZnO NPs
Strains of bacteria (E. coli ATCC no. 25922, P. aeruginosa ATCC no. 27853, S. aureus ATCC no. 25913, and S. epidermidis ATCC no. 12228) were cultured and incubated to be used in this study. The liquid medium method was conducted to study the antimicrobial activity of the biosynthesized ZnO NPs using optical density measurements for growth inhibition rate and to determine the minimum inhibitory concentration (MIC) and minimum bactericidal concentration (MBC) against the mentioned bacterial strains [83].
The suspension of each bacterial strain was prepared with 2 McFarland turbidity standard 6.0 × 10⁸ colony-forming units per milliliter (CFU/mL) and diluted by the broth medium to 6.0 × 10⁷ (CFU/mL). ZnO NPs were suspended in broth medium and stirred until a uniform colloidal suspension formed using different concentrations of ZnO NPs ranging between 400, 450, 500, 550, and 600 μg.mL−1. These concentrations were prepared by weighing (4.0, 4.5, 5.0, 5.5 and 6.0 mg) and suspended in 9 mL of broth medium, followed by adding 1 mL of previously prepared bacterial suspension to each sample, which should result in a final concentration of 6.0 × 10⁶ (CFU/mL) of tested bacteria. NP-free medium was used as a positive control, while bacteria-free medium was used as a negative control. In addition, broth tubes served as a check for media sterility. The tested samples were incubated with shaking for 24 h at 37 °C. Bacterial growth was estimated and compared using optical density measurements of the culture at 600 nm by a UV-Vis microplate reader. The readings were compared with negative and positive controls according to Equation (3) [84,85] to estimate the bacterial growth inhibition rate.
The aqueous BPE activity was tested by using 100 μL of plant extract and serially diluted by 1:1 to ten dilutions in a 96-well plate. Then, 100 μL of previously prepared bacterial suspension was added to the samples. Then, the plates were incubated in plate shaker for incubation at 37.0 °C for 24.0 h.
MIC was reported by visually observing tube turbidity after and before incubation and by calculating bacterial growth rate, since 80% growth reduction or more would indicate MIC in comparison with the control samples. For MBC determination, 50 μL was taken from each tube of MIC test solution that showed no growth or turbidity and spread over Miller–Hinton agar, then incubated at 37 °C for 24 h [83,86,87]. All measurements were taken in triplicate.
3.7. Statical Data Analysis
The experiments were conducted in triplicate, and the results were reported as the mean value with the standard deviation. A one-way analysis of variance (ANOVA) was used for data testing (p < 0.05) to assess significant differences between samples. IBM SPSS Statistics 17.0 (SPSS Inc., South Wacker Dr, Chicago, IL, USA) was utilized for the statistical analysis.
4. Conclusions
The shift toward using NPs as antibacterial agents instead of conventional antibiotics might be the best solution for limiting the use of antibiotics and preventing bacterial resistance against most antibiotics, in addition to reducing the side effects and contraindications of antibiotics. The current study showed ZnO NPs were successfully biosynthesized using an aqueous BPE of Musa Acumniata CV. by a green method, resulting in highly pure and effective NPs. Phytochemical compounds in the extract acted as reducing and stabilizing agents, like flavonoids, polyphenols, glycosides, and saponins. The effect of different precursor concentrations on bandgap, size, charge, and PDI of the synthesized NPs in the presence of fixed extract amounts of BPE was studied, and the best concentration was chosen for further characterization and testing the antibacterial activity. The selected sample was D (0.01 M) ZnO-NPs with a diameter of less than 30 nm, which was characterized and tested against bacteria. ATR-FTIR analysis of the selected sample confirmed the presence of extract biochemicals on the synthesized NPs. Also, XRD results indicate the production of pure NPs with a wurtzite hexagonal structure. Moreover, the biosynthesized NPs demonstrate strong antibacterial effects against G-positive bacteria (S. aureus and S. epidermidis), as well as G-negative bacteria (E. coli and P. aeruginosa). The MIC and MBC were determined, and we found that ZnO-NPs had a bacteriostatic effect on all tested strains while having a bactericidal effect against S. aureus and S. epidermidis.
The green synthesis of NPs using environmentally friendly materials creates the potential for reducing environmental pollution, especially when conducting the method for large-scale production with an emphasis on annealing. The novel properties of green NPs and their antimicrobial activity can reduce the use of antibiotics and may contribute to solving the problem of bacterial resistance. Extensive research should be conducted to study the effect of biosynthesized ZnO NPs in vivo and their cytotoxicity on human cells.
Author Contributions
Conceptualization, M.Q.A.-K., S.Y.C. and R.A.A.-Z.; data curation, M.Q.A.-K.; formal analysis, N.A.; investigation, M.Q.A.-K., S.Y.C., R.A.A.-Z. and N.A.; methodology, M.Q.A.-K.; resources, N.A.; software, M.Q.A.-K. and N.A.; supervision, S.Y.C. and R.A.A.-Z.; writing—original draft, M.Q.A.-K.; writing—review and editing, S.Y.C. and R.A.A.-Z. All authors have read and agreed to the published version of the manuscript.
Funding
This work was supported by The University of Jordan, Amman and industrial partner Avantsar Sdn Bhd with funding number of #2023/0183/AO278.
Institutional Review Board Statement
Not applicable.
Informed Consent Statement
Not applicable.
Data Availability Statement
The original contributions presented in the study are included in the article; further inquiries can be directed to the corresponding author.
Acknowledgments
The authors would like to thank Universiti Sains Malaysia (USM), Hamdi Mango Centre for Scientific Research at the University of Jordan, and the Nanotechnology Centre at the University of Jordan for supporting and providing facilities to conduct the work.
Conflicts of Interest
The authors declare no conflicts of interest.
Appendix A
The LC-MS chromatogram for the separated compounds from aqueous BPE compared with standards for each compound presented in Figure A1, Figure A2, Figure A3, Figure A4, Figure A5 and Figure A6 below.
Figure A1.
Quercetin standard and separated quercetin from BPE sample.
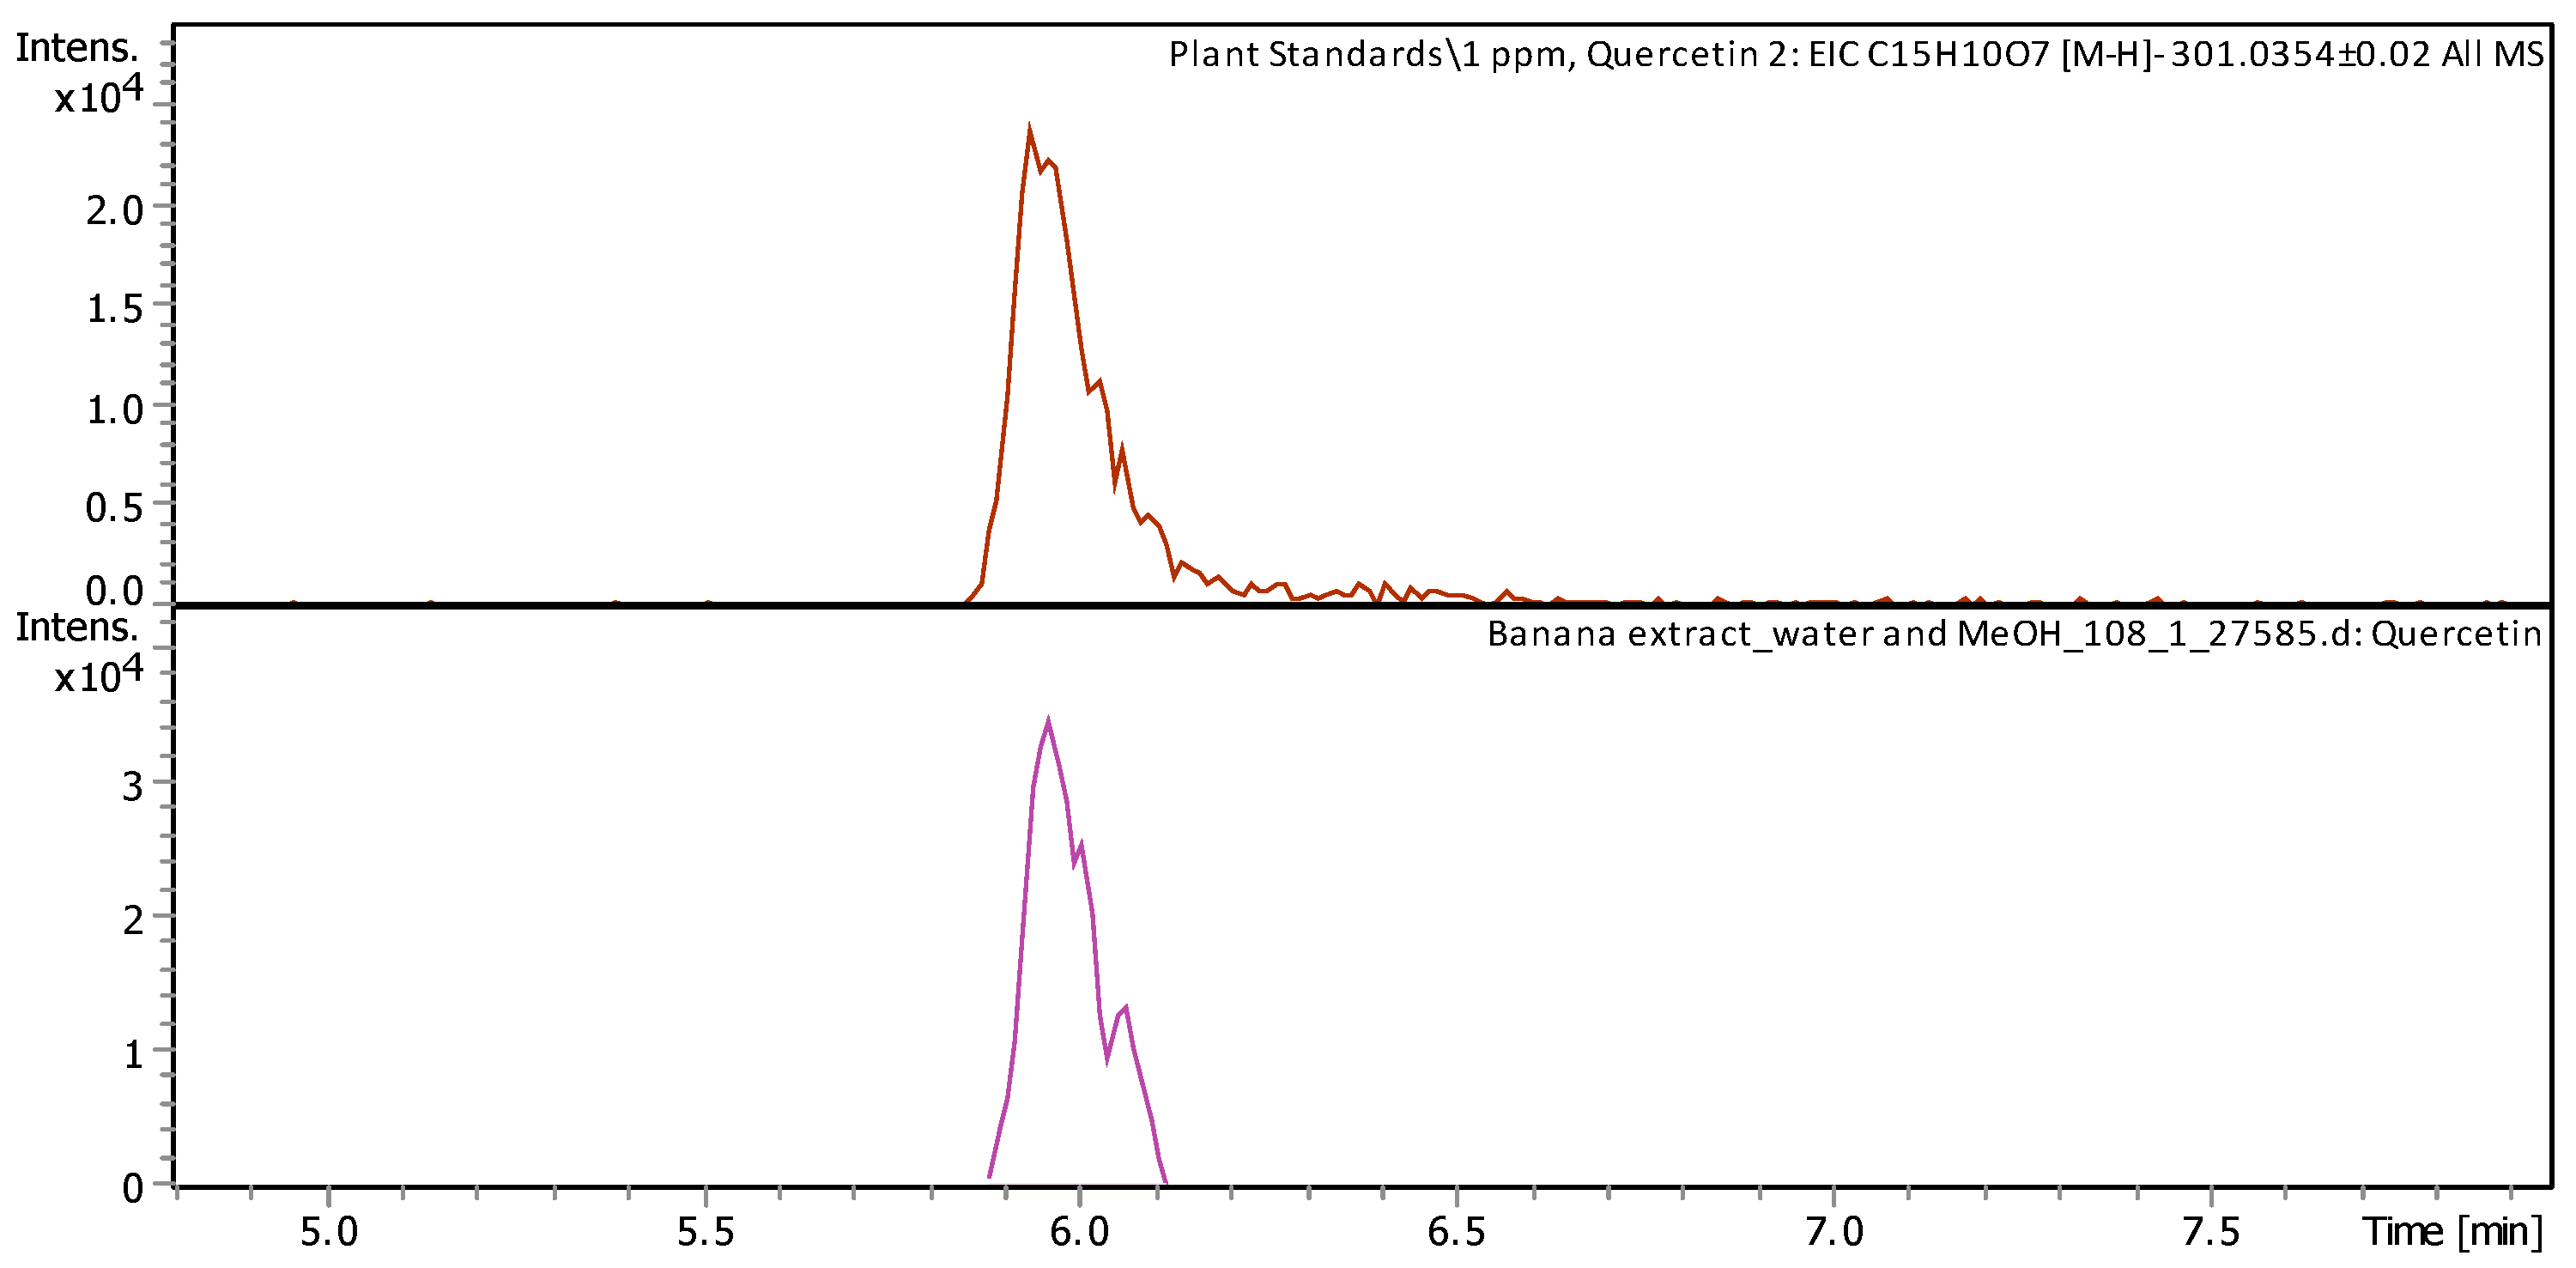
Figure A2.
Rutin standard and separated rutin from BPE sample.
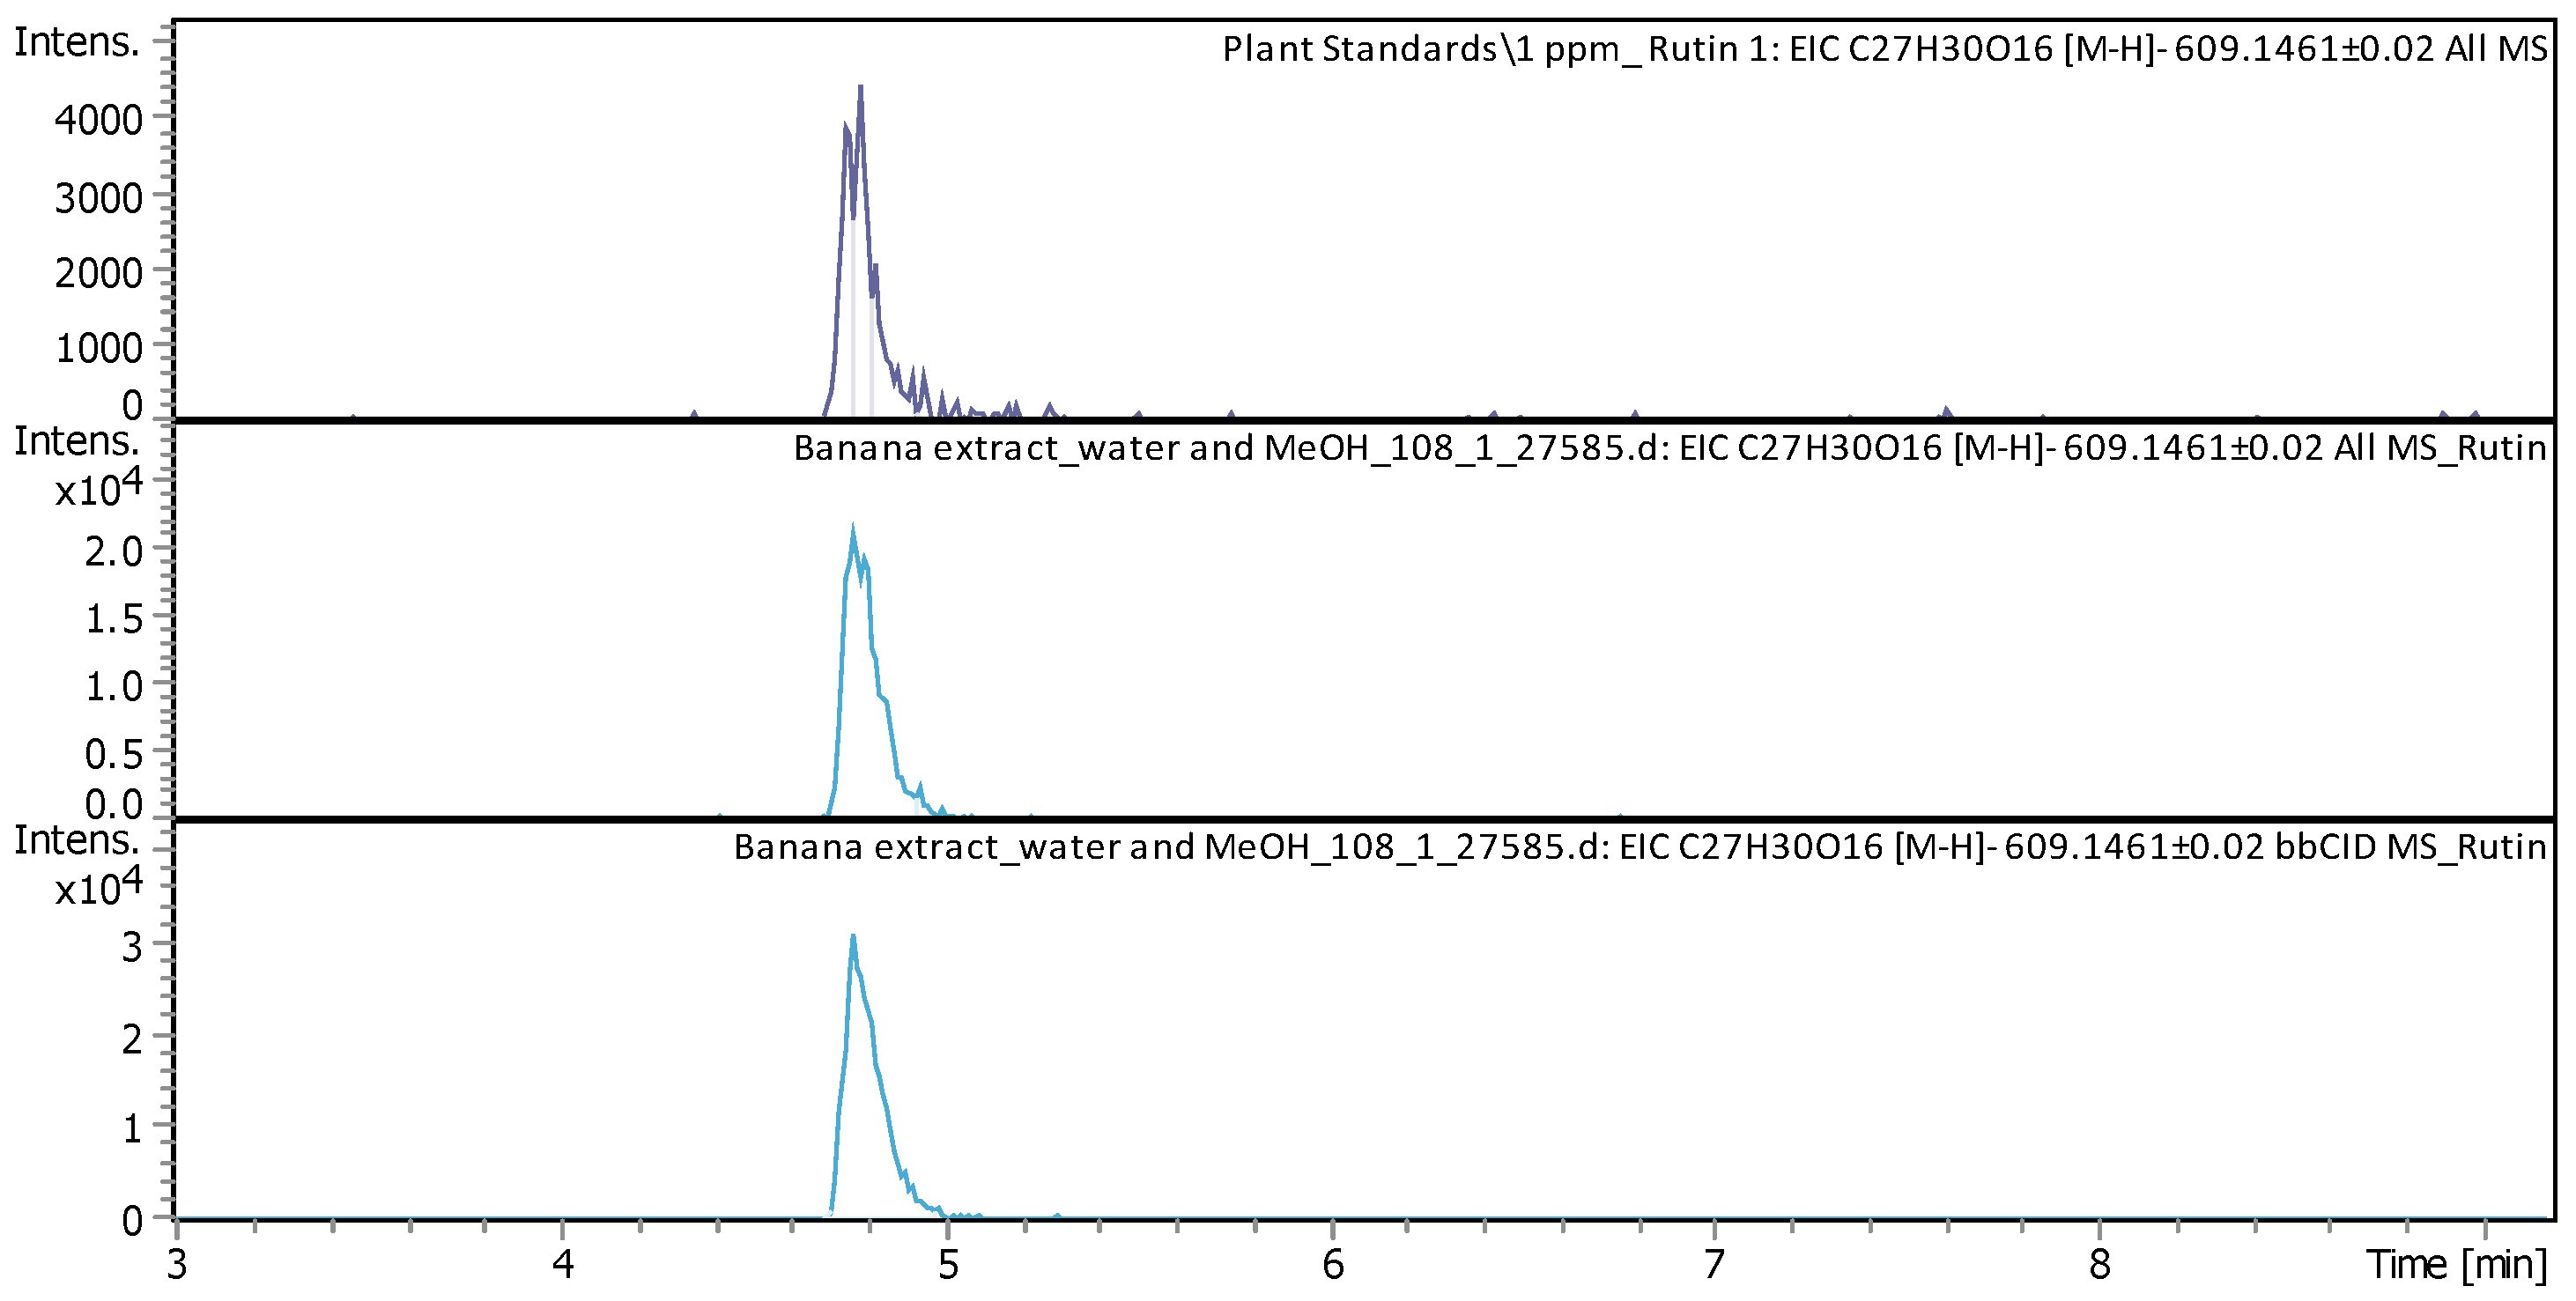
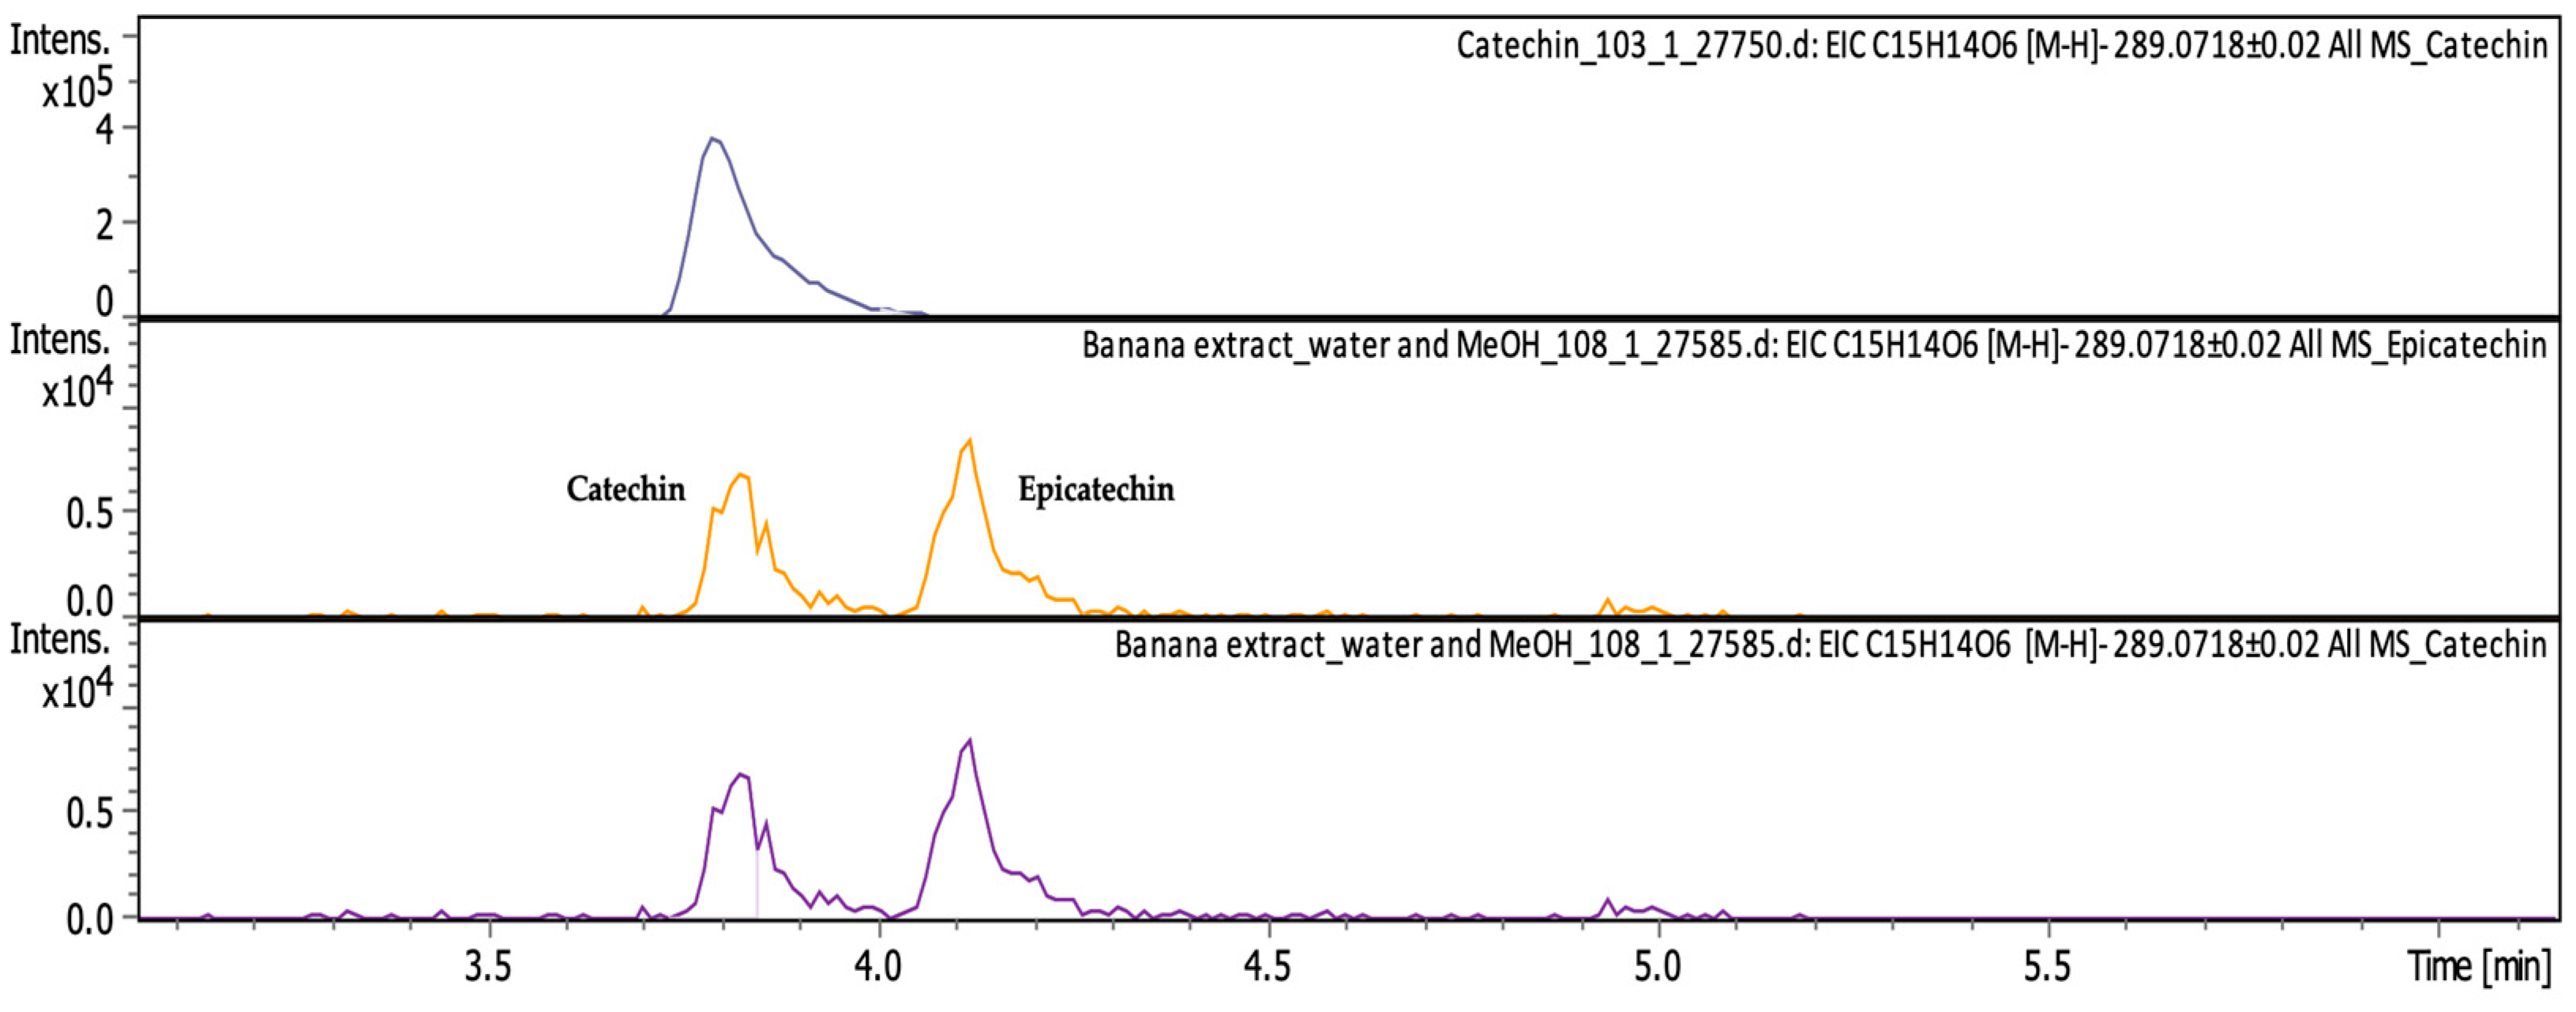
Figure A3.
Catechin standard and separated catchin from BPE sample.

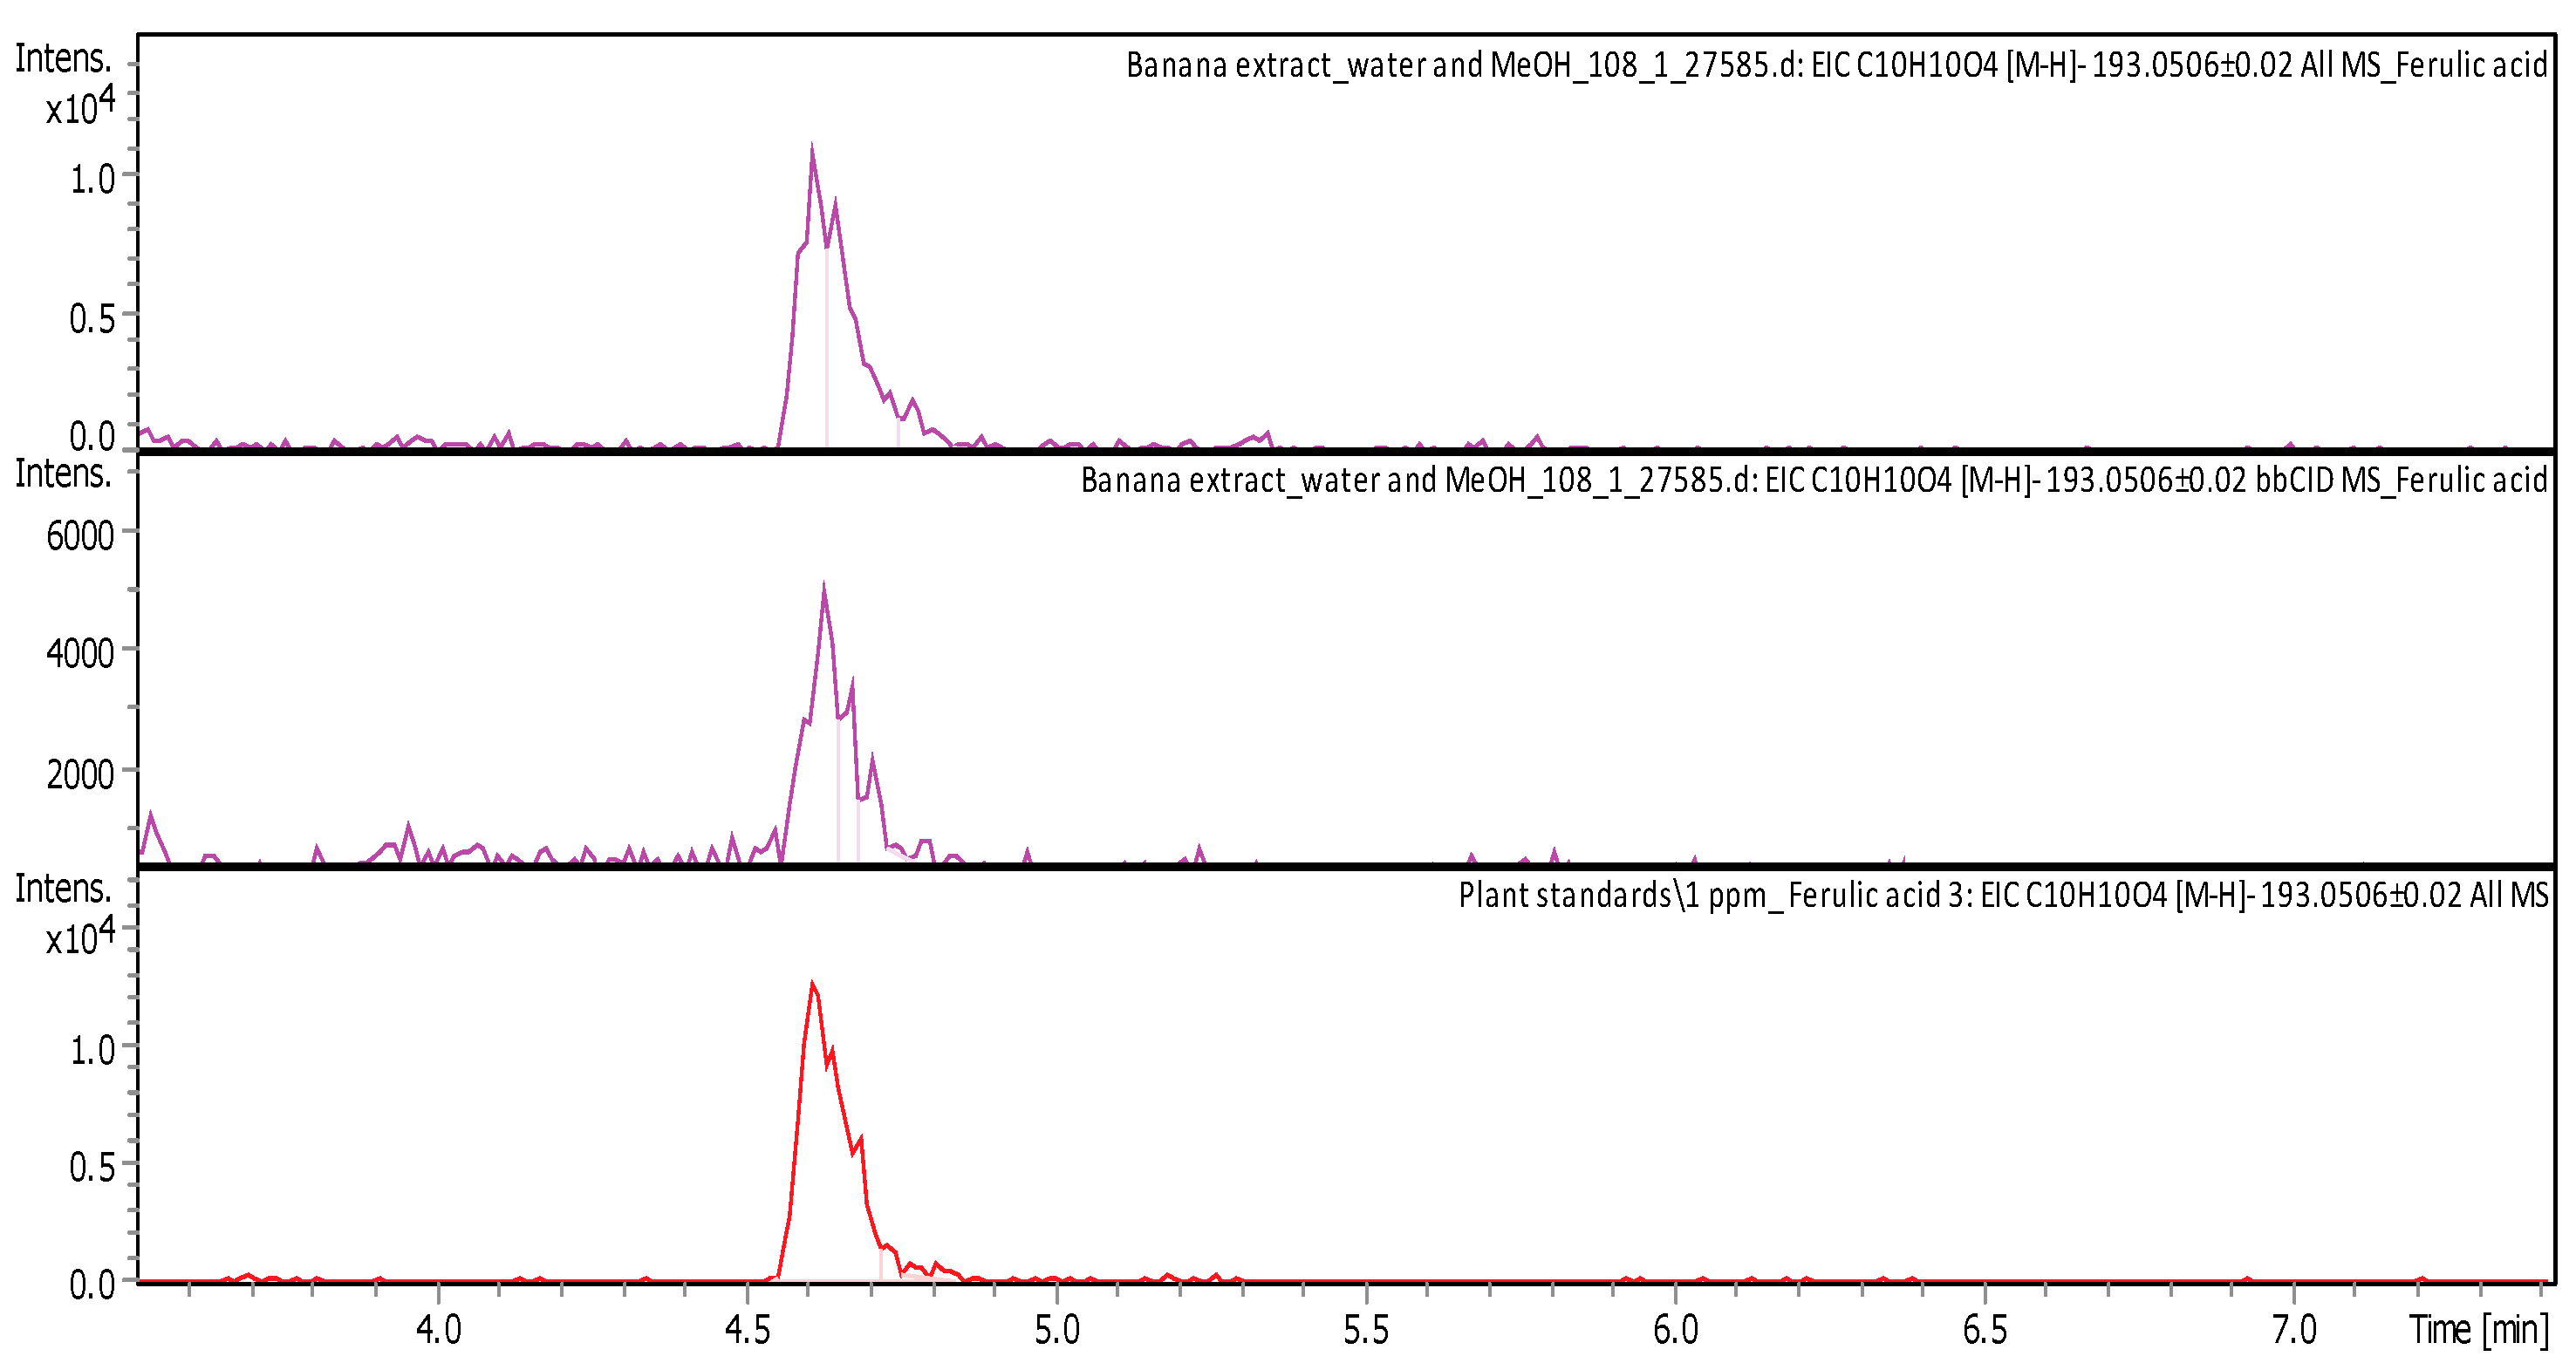
Figure A4.
Ferulic acid standard and separated ferulic acid from BPE sample.

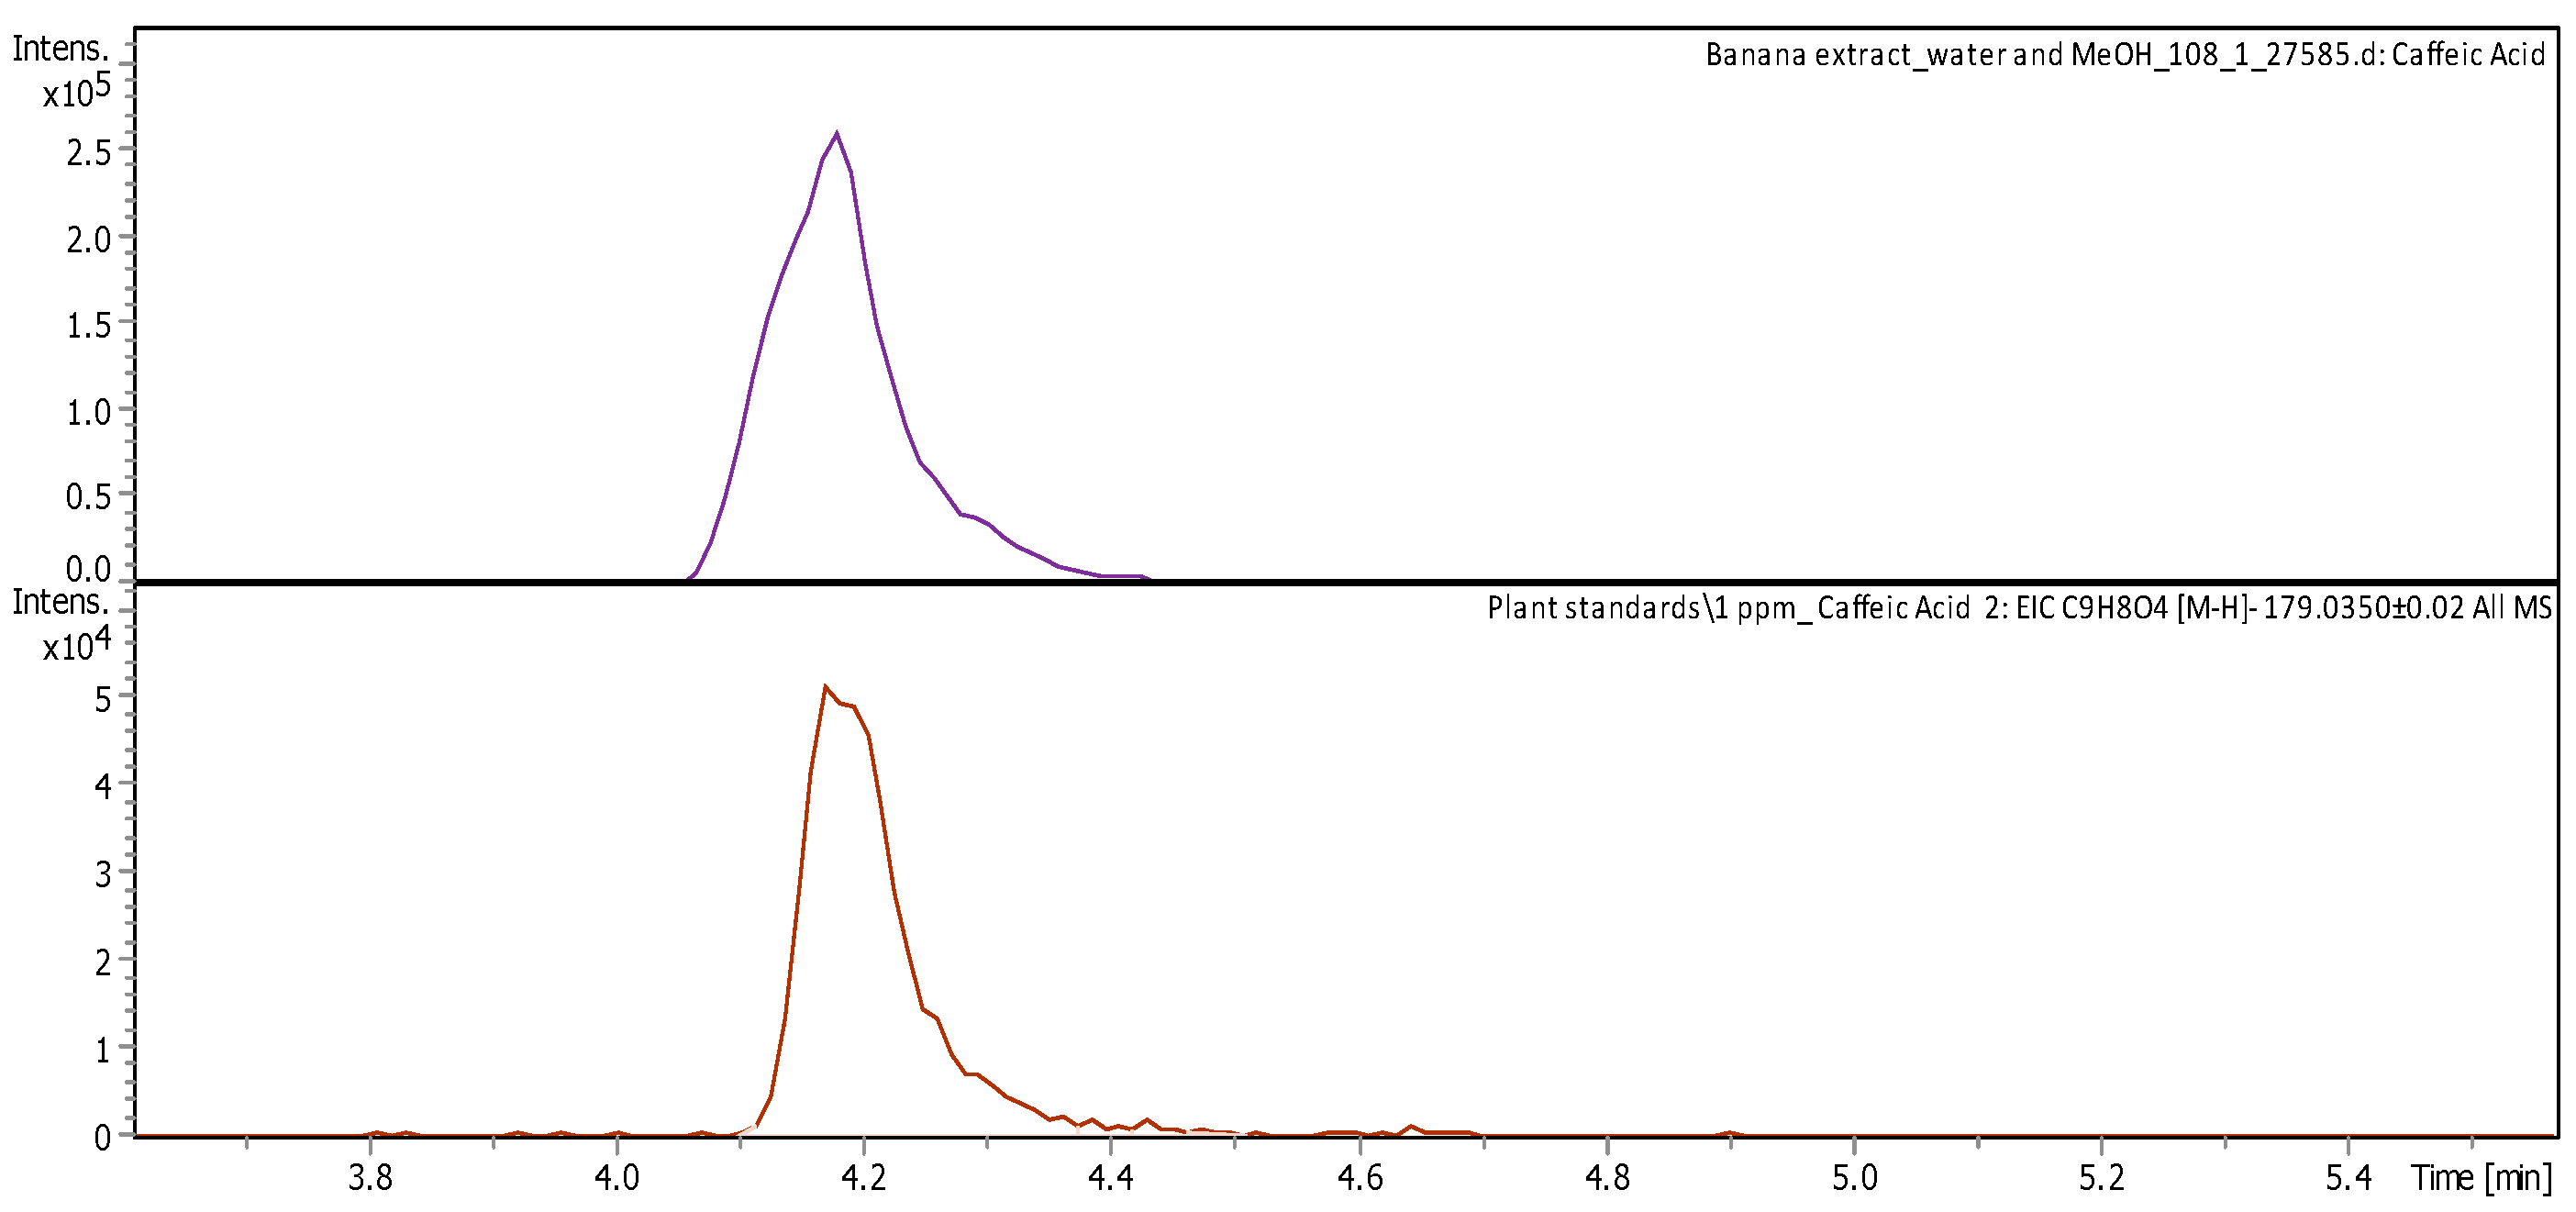
Figure A5.
Caffeic acid standard and separated Caffeic acid from BPE sample.

Figure A6.
Vanillic acid standard and separated Vanillic acid from BPE sample.
References
- Mohd Yusof, H.; Mohamad, R.; Zaidan, U.H.; Abdul Rahman, N.A. Microbial Synthesis of Zinc Oxide Nanoparticles and Their Potential Application as an Antimicrobial Agent and a Feed Supplement in Animal Industry: A Review. J. Anim. Sci. Biotechnol. 2019, 10, 57. [Google Scholar] [CrossRef]
- Khan, S.; Mansoor, S.; Rafi, Z.; Kumari, B.; Shoaib, A.; Saeed, M.; Alshehri, S.; Ghoneim, M.M.; Rahamathulla, M.; Hani, U.; et al. A Review on Nanotechnology: Properties, Applications, and Mechanistic Insights of Cellular Uptake Mechanisms. J. Mol. Liq. 2022, 348, 118008. [Google Scholar] [CrossRef]
- Ahmed, S.; Annu; Chaudhry, S.A.; Ikram, S. A Review on Biogenic Synthesis of ZnO Nanoparticles Using Plant Extracts and Microbes: A Prospect towards Green Chemistry. J. Photochem. Photobiol. B Biol. 2017, 166, 272–284. [Google Scholar] [CrossRef] [PubMed]
- Carofiglio, M.; Barui, S.; Cauda, V.; Laurenti, M. Doped Zinc Oxide Nanoparticles: Synthesis, Characterization and Potential Use in Nanomedicine. Appl. Sci. 2020, 10, 5194. [Google Scholar] [CrossRef]
- Anjum, S.; Hashim, M.; Malik, S.A.; Khan, M.; Lorenzo, J.M.; Abbasi, B.H.; Hano, C. Recent Advances in Zinc Oxide Nanoparticles (ZnO NPs) for Cancer Diagnosis, Target Drug Delivery, and Treatment. Cancers 2021, 13, 4570. [Google Scholar] [CrossRef]
- Saravanan, K.; Natarajan, B.; Nallamuthu, N.; Sadiq, M.; Ramanujam, G.M. Evaluation of Nanomedicine Applications of Silver and Zinc Oxide Nanoparticles Using Water Extract of Fresh Turmeric. ECS J. Solid State Sci. Technol. 2023, 12, 021003. [Google Scholar] [CrossRef]
- Sivakumar, P.; Lee, M.; Kim, Y.-S.; Shim, M.S. Photo-Triggered Antibacterial and Anticancer Activities of Zinc Oxide Nanoparticles. J. Mater. Chem. B 2018, 6, 4852–4871. [Google Scholar] [CrossRef]
- Bedi, P.; Kaur, A. An Overview on Uses of Zinc Oxide Nanoparticles. World J. Pharm. Pharm. Sci. 2015, 4, 1177–1196. [Google Scholar]
- Kulkarni, S.S.; Shirsat, M.D. Optical and Structural Properties of Zinc Oxide Nanoparticles. Int. J. Adv. Res. Phys. Sci. 2015, 2, 14–18. [Google Scholar]
- Manjunatha, R.L.; Usharani, K.V.; Naik, D. Synthesis and Characterization of ZnO Nanoparticles: A Review. J. Pharmacogn. Phytochem. 2019, 8, 1095–1101. [Google Scholar]
- Islam, F.; Shohag, S.; Uddin, M.J.; Islam, M.R.; Nafady, M.H.; Akter, A.; Mitra, S.; Roy, A.; Emran, T.B.; Cavalu, S. Exploring the Journey of Zinc Oxide Nanoparticles (ZnO-NPs) toward Biomedical Applications. Materials 2022, 15, 2160. [Google Scholar] [CrossRef] [PubMed]
- Sierra, M.J.; Herrera, A.P.; Ojeda, K.A. Synthesis of Zinc Oxide Nanoparticles from Mango and Soursop Leaf Extracts. Contemp. Eng. Sci. 2018, 11, 395–403. [Google Scholar] [CrossRef]
- Jamdagni, P.; Khatri, P.; Rana, J.-S. Green Synthesis of Zinc Oxide Nanoparticles Using Flower Extract of Nyctanthes Arbor-Tristis and Their Antifungal Activity. J. King Saud Univ. -Sci. 2018, 30, 168–175. [Google Scholar] [CrossRef]
- Barani, D.; Benhaoua, B.; Laouini, S.E.; Bentemam, H.; Allag, N.; Berra, D.; Guerram, A. Green Synthesis of Zno Nanoparticles Using Phoenix Dactylifera. L Leaf Extract: Effect of Zinc Acetate Concentration on the Type of Product. Dig. J. Nanomater. Biostructures (DJNB) 2019, 14, 581–591. Available online: https://www.chalcogen.ro/581_BaraniD.pdf (accessed on 14 October 2021).
- Fakhari, S.; Jamzad, M.; Kabiri Fard, H. Green Synthesis of Zinc Oxide Nanoparticles: A Comparison. Green Chem. Lett. Rev. 2019, 12, 19–24. [Google Scholar] [CrossRef]
- Król, A.; Railean-Plugaru, V.; Pomastowski, P.; Buszewski, B. Phytochemical Investigation of Medicago sativa L. Extract and Its Potential as a Safe Source for the Synthesis of ZnO Nanoparticles: The Proposed Mechanism of Formation and Antimicrobial Activity. Phytochem. Lett. 2019, 31, 170–180. [Google Scholar] [CrossRef]
- Prasad, A.R.; Williams, L.; Garvasis, J.; Shamsheera, K.O.; Basheer, S.M.; Kuruvilla, M.; Joseph, A. Applications of Phytogenic ZnO Nanoparticles: A Review on Recent Advancements. J. Mol. Liq. 2021, 331, 115805. [Google Scholar] [CrossRef]
- Devi, D.; Julkapli, N.M.; Sagadevan, S.; Johan, M.R. Eco-Friendly Green Synthesis Approach and Evaluation of Environmental and Biological Applications of Iron Oxide Nanoparticles. Inorg. Chem. Commun. 2023, 152, 110700. [Google Scholar]
- Colon, G.; Ward, B.C.; Webster, T.J. Increased Osteoblast and Decreased Staphylococcus epidermidis Functions on Nanophase ZnO and TiO2. J. Biomed. Mater. Res. 2006, 78A, 595–604. [Google Scholar] [CrossRef]
- Padmavathy, N.; Vijayaraghavan, R. Enhanced Bioactivity of ZnO Nanoparticles—An Antimicrobial Study. Sci. Technol. Adv. Mater. 2008, 9, 035004. [Google Scholar] [CrossRef]
- Aswathi, V.P.; Meera, S.; Maria, C.G.A.; Nidhin, M. Green Synthesis of Nanoparticles from Biodegradable Waste Extracts and Their Applications: A Critical Review. Nanotechnol. Environ. Eng. 2023, 8, 377–397. [Google Scholar] [CrossRef]
- Šimoníková, D.; Čížková, J.; Zoulová, V.; Christelová, P.; Hřibová, E. Advances in the Molecular Cytogenetics of Bananas, Family Musaceae. Plants 2022, 11, 482. [Google Scholar] [CrossRef] [PubMed]
- Chugh, R.; Kaur, G. A Mini Review on Green Synthesis of Nanoparticles by Utilization of Musa- Balbisiana Waste Peel Extract. Mater. Today Proc. 2022; in press. [Google Scholar] [CrossRef]
- Dmochowska, A.; Czajkowska, J.; Jędrzejewski, R.; Stawiński, W.; Migdał, P.; Fiedot-Toboła, M. Pectin Based Banana Peel Extract as a Stabilizing Agent in Zinc Oxide Nanoparticles Synthesis. Int. J. Biol. Macromol. 2020, 165, 1581–1592. [Google Scholar] [CrossRef]
- Hussien, N.A.; Al Malki, J.S.; Al Harthy, F.A.; Mazi, A.W.; Al Shadadi, J.A. Sustainable Eco-Friendly Synthesis of Zinc Oxide Nanoparticles Using Banana Peel and Date Seed Extracts, Characterization, and Cytotoxicity Evaluation. Sustainability 2023, 15, 9864. [Google Scholar] [CrossRef]
- Ruangtong, J.; T-Thienprasert, J.; T-Thienprasert, N.P. Green Synthesized ZnO Nanosheets from Banana Peel Extract Possess Anti-Bacterial Activity and Anti-Cancer Activity. Mater. Today Commun. 2020, 24, 101224. [Google Scholar] [CrossRef]
- Bag, S.S.; Bora, A.; Golder, A.K. Biomimetic Synthesis of Silver Nanoparticles Using Bhimkol (Musa Balbisiana) Peel Extract as Biological Waste: Its Antibacterial Activity and Role of Ripen Stage of the Peel. Curr. Nanomater. 2020, 5, 47–65. [Google Scholar] [CrossRef]
- Abdol Aziz, R.A.; Abd Karim, S.F.; Ibrahim, U.K.; Sanuddin, N. Precursor Concentration Effect on Physicochemical Properties of Zinc Oxide Nanoparticle Synthesized with Banana Peel Extract. Key Eng. Mater. 2019, 797, 262–270. [Google Scholar] [CrossRef]
- Vishnukumar, P.; Vivekanandhan, S.; Misra, M.; Mohanty, A.K. Recent Advances and Emerging Opportunities in Phytochemical Synthesis of ZnO Nanostructures. Mater. Sci. Semicond. Process. 2018, 80, 143–161. [Google Scholar] [CrossRef]
- Wang, Q.; Mei, S.; Manivel, P.; Ma, H.; Chen, X. Zinc Oxide Nanoparticles Synthesized Using Coffee Leaf Extract Assisted with Ultrasound as Nanocarriers for Mangiferin. Curr. Res. Food Sci. 2022, 5, 868–877. [Google Scholar] [CrossRef]
- Mohammadi, F.M.; Ghasemi, N. Influence of Temperature and Concentration on Biosynthesis and Characterization of Zinc Oxide Nanoparticles Using Cherry Extract. J. Nanostructure Chem. 2018, 8, 93–102. [Google Scholar] [CrossRef]
- Hooshmand, S.; Mohammadian, M.; Es’haghi, Z. Green and Chemical Synthesis of Zinc Oxide Nanoparticles and Size Evaluation by UV–Vis Spectroscopy. J. Nanomed. Res. 2018, 7, 00175. [Google Scholar] [CrossRef]
- Chaudhuri, S.K.; Malodia, L. Biosynthesis of Zinc Oxide Nanoparticles Using Leaf Extract of Calotropis Gigantea: Characterization and Its Evaluation on Tree Seedling Growth in Nursery Stage. Appl. Nanosci. 2017, 7, 501–512. [Google Scholar] [CrossRef]
- Rajan, A.; Cherian, E.; Gurunathan, D.B. Biosynthesis of Zinc Oxide Nanoparticles Using Aspergillus Fumigatus JCF and Its Antibacterial Activity. Int. J. Mod. Sci. Technol. 2016, 1, 52–57. [Google Scholar]
- Ahmad, N.; Ang, B.C.; Amalina, M.A.; Bong, C.W. Influence of Precursor Concentration and Temperature on the Formation of Nanosilver in Chemical Reduction Method. Sains Malays. 2018, 47, 157–168. [Google Scholar]
- Sidhu, A.K.; Verma, N.; Kaushal, P. Role of Biogenic Capping Agents in the Synthesis of Metallic Nanoparticles and Evaluation of Their Therapeutic Potential. Front. Nanotechnol. 2022, 3, 801620. [Google Scholar] [CrossRef]
- Shrestha, S.; Wang, B.; Dutta, P. Nanoparticle Processing: Understanding and Controlling Aggregation. Adv. Colloid Interface Sci. 2020, 279, 102162. [Google Scholar] [CrossRef] [PubMed]
- Vimala, K.; Sundarraj, S.; Paulpandi, M.; Vengatesan, S.; Kannan, S. Green Synthesized Doxorubicin Loaded Zinc Oxide Nanoparticles Regulates the Bax and Bcl-2 Expression in Breast and Colon Carcinoma. Process Biochem. 2014, 49, 160–172. [Google Scholar] [CrossRef]
- Geremew, A.; Carson, L.; Woldesenbet, S.; Wang, H.; Reeves, S.; Brooks, N.; Saganti, P.; Weerasooriya, A.; Peace, E. Effect of Zinc Oxide Nanoparticles Synthesized from Carya Illinoinensis Leaf Extract on Growth and Antioxidant Properties of Mustard (Brassica Juncea). Front. Plant Sci. 2023, 14, 1108186. [Google Scholar] [CrossRef]
- Figueiredo, M. Sizing Nanoparticles in Liquids: An Overview of Methods. In Drug Delivery Systems: Advanced Technologies Potentially Applicable in Personalised Treatment; Coelho, J., Ed.; Advances in Predictive, Preventive and Personalised Medicine; Springer: Dordrecht, The Netherlands, 2013; Volume 4, pp. 87–107. [Google Scholar] [CrossRef]
- Reddy, N.K.; Pérez-Juste, J.; Pastoriza-Santos, I.; Lang, P.R.; Dhont, J.K.G.; Liz-Marzán, L.M.; Vermant, J. Flow Dichroism as a Reliable Method to Measure the Hydrodynamic Aspect Ratio of Gold Nanoparticles. ACS Nano 2011, 5, 4935–4944. [Google Scholar] [CrossRef]
- Kibria, A.A.; Kamrunnessa; Rahman, M.M.; Kar, A. Extraction and Evaluation of Phytochemicals from Banana Peels (Musa sapientum) and Banana Plants (Musa paradisiaca). Malays. J. Halal Res. 2019, 2, 22–26. [Google Scholar] [CrossRef]
- Hess, W.; Frisch, H.L.; Klein, R. On the Hydrodynamic Behavior of Colloidal Aggregates. Z. Für Phys. B Condens. Matter 1986, 64, 65–67. [Google Scholar] [CrossRef]
- Maguire, C.M.; Rösslein, M.; Wick, P.; Prina-Mello, A. Characterisation of Particles in Solution—A Perspective on Light Scattering and Comparative Technologies. Sci. Technol. Adv. Mater. 2018, 19, 732–745. [Google Scholar] [CrossRef]
- Alamdari, S.; Sasani Ghamsari, M.; Lee, C.; Han, W.; Park, H.-H.; Tafreshi, M.J.; Afarideh, H.; Ara, M.H.M. Preparation and Characterization of Zinc Oxide Nanoparticles Using Leaf Extract of Sambucus Ebulus. Appl. Sci. 2020, 10, 3620. [Google Scholar] [CrossRef]
- Oliveira, R.N.; Mancini, M.C.; de Oliveira, F.C.S.; Passos, T.M.; Quilty, B.; Thiré, R.M.d.S.M.; McGuinness, G.B. FTIR Analysis and Quantification of Phenols and Flavonoids of Five Commercially Available Plants Extracts Used in Wound Healing. Matéria 2016, 21, 767–779. [Google Scholar]
- Rojas Flores, S.; Cruz-Noriega, M.; Nazario-Naveda, R.; Benites, S.; Delfin Narciso, D.; Angelats-Silva, L.; Murga-Torres, E. Use of Banana Waste as a Source for Bioelectricity Generation. Processes 2022, 10, 942. [Google Scholar] [CrossRef]
- Sangeetha, M.; Rajendran, S.; Sathiyabama, J.; Prabhakar, P. Eco Friendly Extract of Banana Peel as Corrosion Inhibitor for Carbon Steel in Sea Water. J. Nat. Prod. Plant Resour. 2012, 2, 601–610. [Google Scholar]
- Das, J.; Velusamy, P. Antibacterial Effects of Biosynthesized Silver Nanoparticles Using Aqueous Leaf Extract of Rosmarinus officinalis L. Mater. Res. Bull. 2013, 48, 4531–4537. [Google Scholar] [CrossRef]
- Alaa El-Din, G.; Amer, A.A.; Malsh, G.; Hussein, M. Study on the Use of Banana Peels for Oil Spill Removal. Alex. Eng. J. 2018, 57, 2061–2068. [Google Scholar] [CrossRef]
- Dudek, M.; Zajac, G.; Szafraniec, E.; Wiercigroch, E.; Tott, S.; Malek, K.; Kaczor, A.; Baranska, M. Raman Optical Activity and Raman Spectroscopy of Carbohydrates in Solution. Spectrochim. Acta Part A Mol. Biomol. Spectrosc. 2019, 206, 597–612. [Google Scholar] [CrossRef]
- Gnanasangeetha, D.; Thambavani, D.S. Biogenic Production of Zinc Oxide Nanoparticles Using Acalypha Indica. J. Chem. Biol. Phys. Sci. (JCBPS) 2013, 4, 238. [Google Scholar]
- Ramesh, M.; Anbuvannan, M.; Viruthagiri, G. Green Synthesis of ZnO Nanoparticles Using Solanum Nigrum Leaf Extract and Their Antibacterial Activity. Spectrochim. Acta Part A Mol. Biomol. Spectrosc. 2015, 136, 864–870. [Google Scholar] [CrossRef] [PubMed]
- Stan, M.; Popa, A.; Toloman, D.; Silipas, T.-D.; Vodnar, D.C. Antibacterial and Antioxidant Activities of ZnO Nanoparticles Synthesized Using Extracts of Allium Sativum, Rosmarinus officinalis and Ocimum Basilicum. Acta Metall. Sin. (Engl. Lett.) 2016, 29, 228–236. [Google Scholar] [CrossRef]
- Ghamsari, M.S.; Alamdari, S.; Razzaghi, D.; Pirlar, M.A. ZnO Nanocrystals with Narrow-Band Blue Emission. J. Lumin. 2019, 205, 508–518. [Google Scholar] [CrossRef]
- Ibrahem, E.J.; Yasin, Y.S.; Jasim, O.K. Antibacterial Activity of Zinc Oxide Nanoparticles Against Staphylococcus Aureus and Pseudomonas Aeruginosa Isolated from Burn Wound Infections. Cihan Univ.-Erbil Sci. J. 2017, 2017, 265–277. [Google Scholar] [CrossRef]
- Navarre, W.W.; Schneewind, O. Surface Proteins of Gram-Positive Bacteria and Mechanisms of Their Targeting to the Cell Wall Envelope. Microbiol. Mol. Biol. Rev. 1999, 63, 174–229. [Google Scholar] [CrossRef]
- Zare, E.; Pourseyedi, S.; Khatami, M.; Darezereshki, E. Simple Biosynthesis of Zinc Oxide Nanoparticles Using Nature’s Source, and It’s in Vitro Bio-Activity. J. Mol. Struct. 2017, 1146, 96–103. [Google Scholar] [CrossRef]
- Li, Y.; Liao, C.; Tjong, S.C. Recent Advances in Zinc Oxide Nanostructures with Antimicrobial Activities. Int. J. Mol. Sci. 2020, 21, 8836. [Google Scholar] [CrossRef]
- Sakthivel, R.; Geetha, A. Investigating the Effect of Post Annealing on Antibacterial Activity of Zno Thin Films Prepared by Modified Silar Technique. Prog. Chem. Sci. Res. 2023, 7, 18–29. [Google Scholar]
- Yang, J.; Liu, X.; Yang, L.; Wang, Y.; Zhang, Y.; Lang, J.; Gao, M.; Feng, B. Effect of Annealing Temperature on the Structure and Optical Properties of ZnO Nanoparticles. J. Alloys Compd. 2009, 477, 632–635. [Google Scholar] [CrossRef]
- Nazir, A.; Akbar, A.; Baghdadi, H.B.; ur Rehman, S.; Al-Abbad, E.; Fatima, M.; Iqbal, M.; Tamam, N.; Alwadai, N.; Abbas, M. Zinc Oxide Nanoparticles Fabrication Using Eriobotrya Japonica Leaves Extract: Photocatalytic Performance and Antibacterial Activity Evaluation. Arab. J. Chem. 2021, 14, 103251. [Google Scholar] [CrossRef]
- Miri, A.; Khatami, M.; Ebrahimy, O.; Sarani, M. Cytotoxic and Antifungal Studies of Biosynthesized Zinc Oxide Nanoparticles Using Extract of Prosopis Farcta Fruit. Green Chem. Lett. Rev. 2020, 13, 27–33. [Google Scholar] [CrossRef]
- Hussien, N.A. Antimicrobial Potential of Biosynthesized Zinc Oxide Nanoparticles Using Banana Peel and Date Seeds Extracts. Sustainability 2023, 15, 9048. [Google Scholar] [CrossRef]
- Shanavas, S.; Duraimurugan, J.; Kumar, G.S.; Ramesh, R.; Acevedo, R.; Anbarasan, P.M.; Maadeswaran, P. Ecofriendly Green Synthesis of ZnO Nanostructures Using Artabotrys Hexapetalu and Bambusa Vulgaris Plant Extract and Investigation on Their Photocatalytic and Antibacterial Activity. Mater. Res. Express 2019, 6, 105098. [Google Scholar] [CrossRef]
- Yuvakkumar, R.; Suresh, J.; Hong, S.I. Green Synthesis of Zinc Oxide Nanoparticles. Adv. Mater. Res. 2014, 952, 137–140. [Google Scholar] [CrossRef]
- Devi, R.S.; Gayathri, R. Green Synthesis of Zinc Oxide Nanoparticles by Using Hibiscus Rosa-Sinensis. Int. J. Curr. Eng. Technol. 2014, 4, 2444–2446. [Google Scholar]
- Hameed, A.S.H.; Karthikeyan, C.; Ahamed, A.P.; Thajuddin, N.; Alharbi, N.S.; Alharbi, S.A.; Ravi, G. In Vitro Antibacterial Activity of ZnO and Nd Doped ZnO Nanoparticles against ESBL Producing Escherichia Coli and Klebsiella Pneumoniae. Sci. Rep. 2016, 6, 24312. [Google Scholar] [CrossRef]
- Sultan, A.; Khan, H.M.; Malik, A.; Ansari, A.; Azam, A.; Perween, N. Antibacterial Activity of ZnO Nanoparticles against ESBL and Amp-C Producing Gram Negative Isolates from Superficial Wound Infections. Int. J. Curr. Microbiol. App. Sci. 2015, 1, 38–47. [Google Scholar]
- Hoseinzadeh, E.; Alikhani, M.-Y.; Samarghandi, M.-R.; Shirzad-Siboni, M. Antimicrobial Potential of Synthesized Zinc Oxide Nanoparticles against Gram Positive and Gram Negative Bacteria. Desalination Water Treat. 2014, 52, 4969–4976. [Google Scholar] [CrossRef]
- Jones, N.; Ray, B.; Ranjit, K.T.; Manna, A.C. Antibacterial Activity of ZnO Nanoparticle Suspensions on a Broad Spectrum of Microorganisms. FEMS Microbiol. Lett. 2008, 279, 71–76. [Google Scholar] [CrossRef]
- Kumari, S.; Tyagi, M.; Jagadevan, S. Mechanistic Removal of Environmental Contaminants Using Biogenic Nano-Materials. Int. J. Environ. Sci. Technol. 2019, 16, 7591–7606. [Google Scholar] [CrossRef]
- Hussain, I.; Singh, N.B.; Singh, A.; Singh, H.; Singh, S.C. Green Synthesis of Nanoparticles and Its Potential Application. Biotechnol. Lett. 2016, 38, 545–560. [Google Scholar] [CrossRef] [PubMed]
- Ying, S.; Guan, Z.; Ofoegbu, P.C.; Clubb, P.; Rico, C.; He, F.; Hong, J. Green Synthesis of Nanoparticles: Current Developments and Limitations. Environ. Technol. Innov. 2022, 26, 102336. [Google Scholar] [CrossRef]
- Duan, H.; Wang, D.; Li, Y. Green Chemistry for Nanoparticle Synthesis. Chem. Soc. Rev. 2015, 44, 5778–5792. [Google Scholar] [CrossRef]
- Naghdi, M.; Taheran, M.; Brar, S.K.; Verma, M.; Surampalli, R.Y.; Valéro, J.R. Green and Energy-Efficient Methods for the Production of Metallic Nanoparticles. Beilstein J. Nanotechnol. 2015, 6, 2354–2376. [Google Scholar] [CrossRef]
- Virkutyte, J.; Varma, R.S. Green Synthesis of Metal Nanoparticles: Biodegradable Polymers and Enzymes in Stabilization and Surface Functionalization. Chem. Sci. 2011, 2, 837–846. [Google Scholar] [CrossRef]
- Mulvihill, M.J.; Beach, E.S.; Zimmerman, J.B.; Anastas, P.T. Green Chemistry and Green Engineering: A Framework for Sustainable Technology Development. Annu. Rev. Environ. Resour. 2011, 36, 271–293. [Google Scholar] [CrossRef]
- Ehiowemwenguan, G.; Emoghene, A.O.; Inetianbor, J.E. Antibacterial and Phytochemical Analysis of Banana Fruit Peel. IOSR J. Pharm. 2014, 4, 18–25. [Google Scholar]
- Lin, C.-C.; You, Y.-C. Mass-Production of ZnO Nanoparticles by Precipitation in a Rotating Packed Bed: Effect of Zinc Salt. J. Mater. Res. Technol. 2020, 9, 8451–8458. [Google Scholar] [CrossRef]
- Rueden, C.T.; Schindelin, J.; Hiner, M.C.; DeZonia, B.E.; Walter, A.E.; Arena, E.T.; Eliceiri, K.W. ImageJ2: ImageJ for the next Generation of Scientific Image Data. BMC Bioinform. 2017, 18, 529. [Google Scholar] [CrossRef]
- Sandhu, R.; Singh, N.; Dhankhar, J.; Kama, G.; Sharma, R. Dynamic Light Scattering (DLS) Technique, Principle, Theoretical Considerations and Applications. In Nanotechnological and Biochemical Techniques for Assessing the Quality and Safety of Milk and Milk Products; ICAR-NDRI: Karnal, India, 2018; pp. 135–137. Available online: https://www.researchgate.net/publication/331022012 (accessed on 14 October 2021).
- Qaiyumi, S. Macro-and Microdilution Methods of Antimicrobial Susceptibility Testing. In Antimicrobial Susceptibility Testing Protocols; Taylor & Francis: Boca Raton, FL, USA, 2007; pp. 75–79. [Google Scholar]
- Khashan, K.S.; Sulaiman, G.M.; Abdulameer, F.A.; Albukhaty, S.; Ibrahem, M.A.; Al-Muhimeed, T.; AlObaid, A.A. Antibacterial Activity of TiO2 Nanoparticles Prepared by One-Step Laser Ablation in Liquid. Appl. Sci. 2021, 11, 4623. [Google Scholar] [CrossRef]
- Mahdy, S.A.; Raheed, Q.J.; Kalaichelvan, P.T. Antimicrobial Activity of Zero-Valent Iron Nanoparticles. Int. J. Mod. Eng. Res. 2012, 2, 578–581. [Google Scholar]
- Alekish, M.; Ismail, Z.B.; Albiss, B.; Nawasrah, S. In Vitro Antibacterial Effects of Zinc Oxide Nanoparticles on Multiple Drug-Resistant Strains of Staphylococcus Aureus and Escherichia Coli: An Alternative Approach for Antibacterial Therapy of Mastitis in Sheep. Vet. World 2018, 11, 1428. [Google Scholar] [CrossRef] [PubMed]
- Emami-Karvani, Z.; Chehrazi, P. Antibacterial Activity of ZnO Nanoparticle on Gram-Positive and Gram-Negative Bacteria. Afr. J. Microbiol. Res. 2011, 5, 1368–1373. [Google Scholar]
Figure 1.
Herbarium information: (A) banana dry leave; (B) herbarium no. and report.
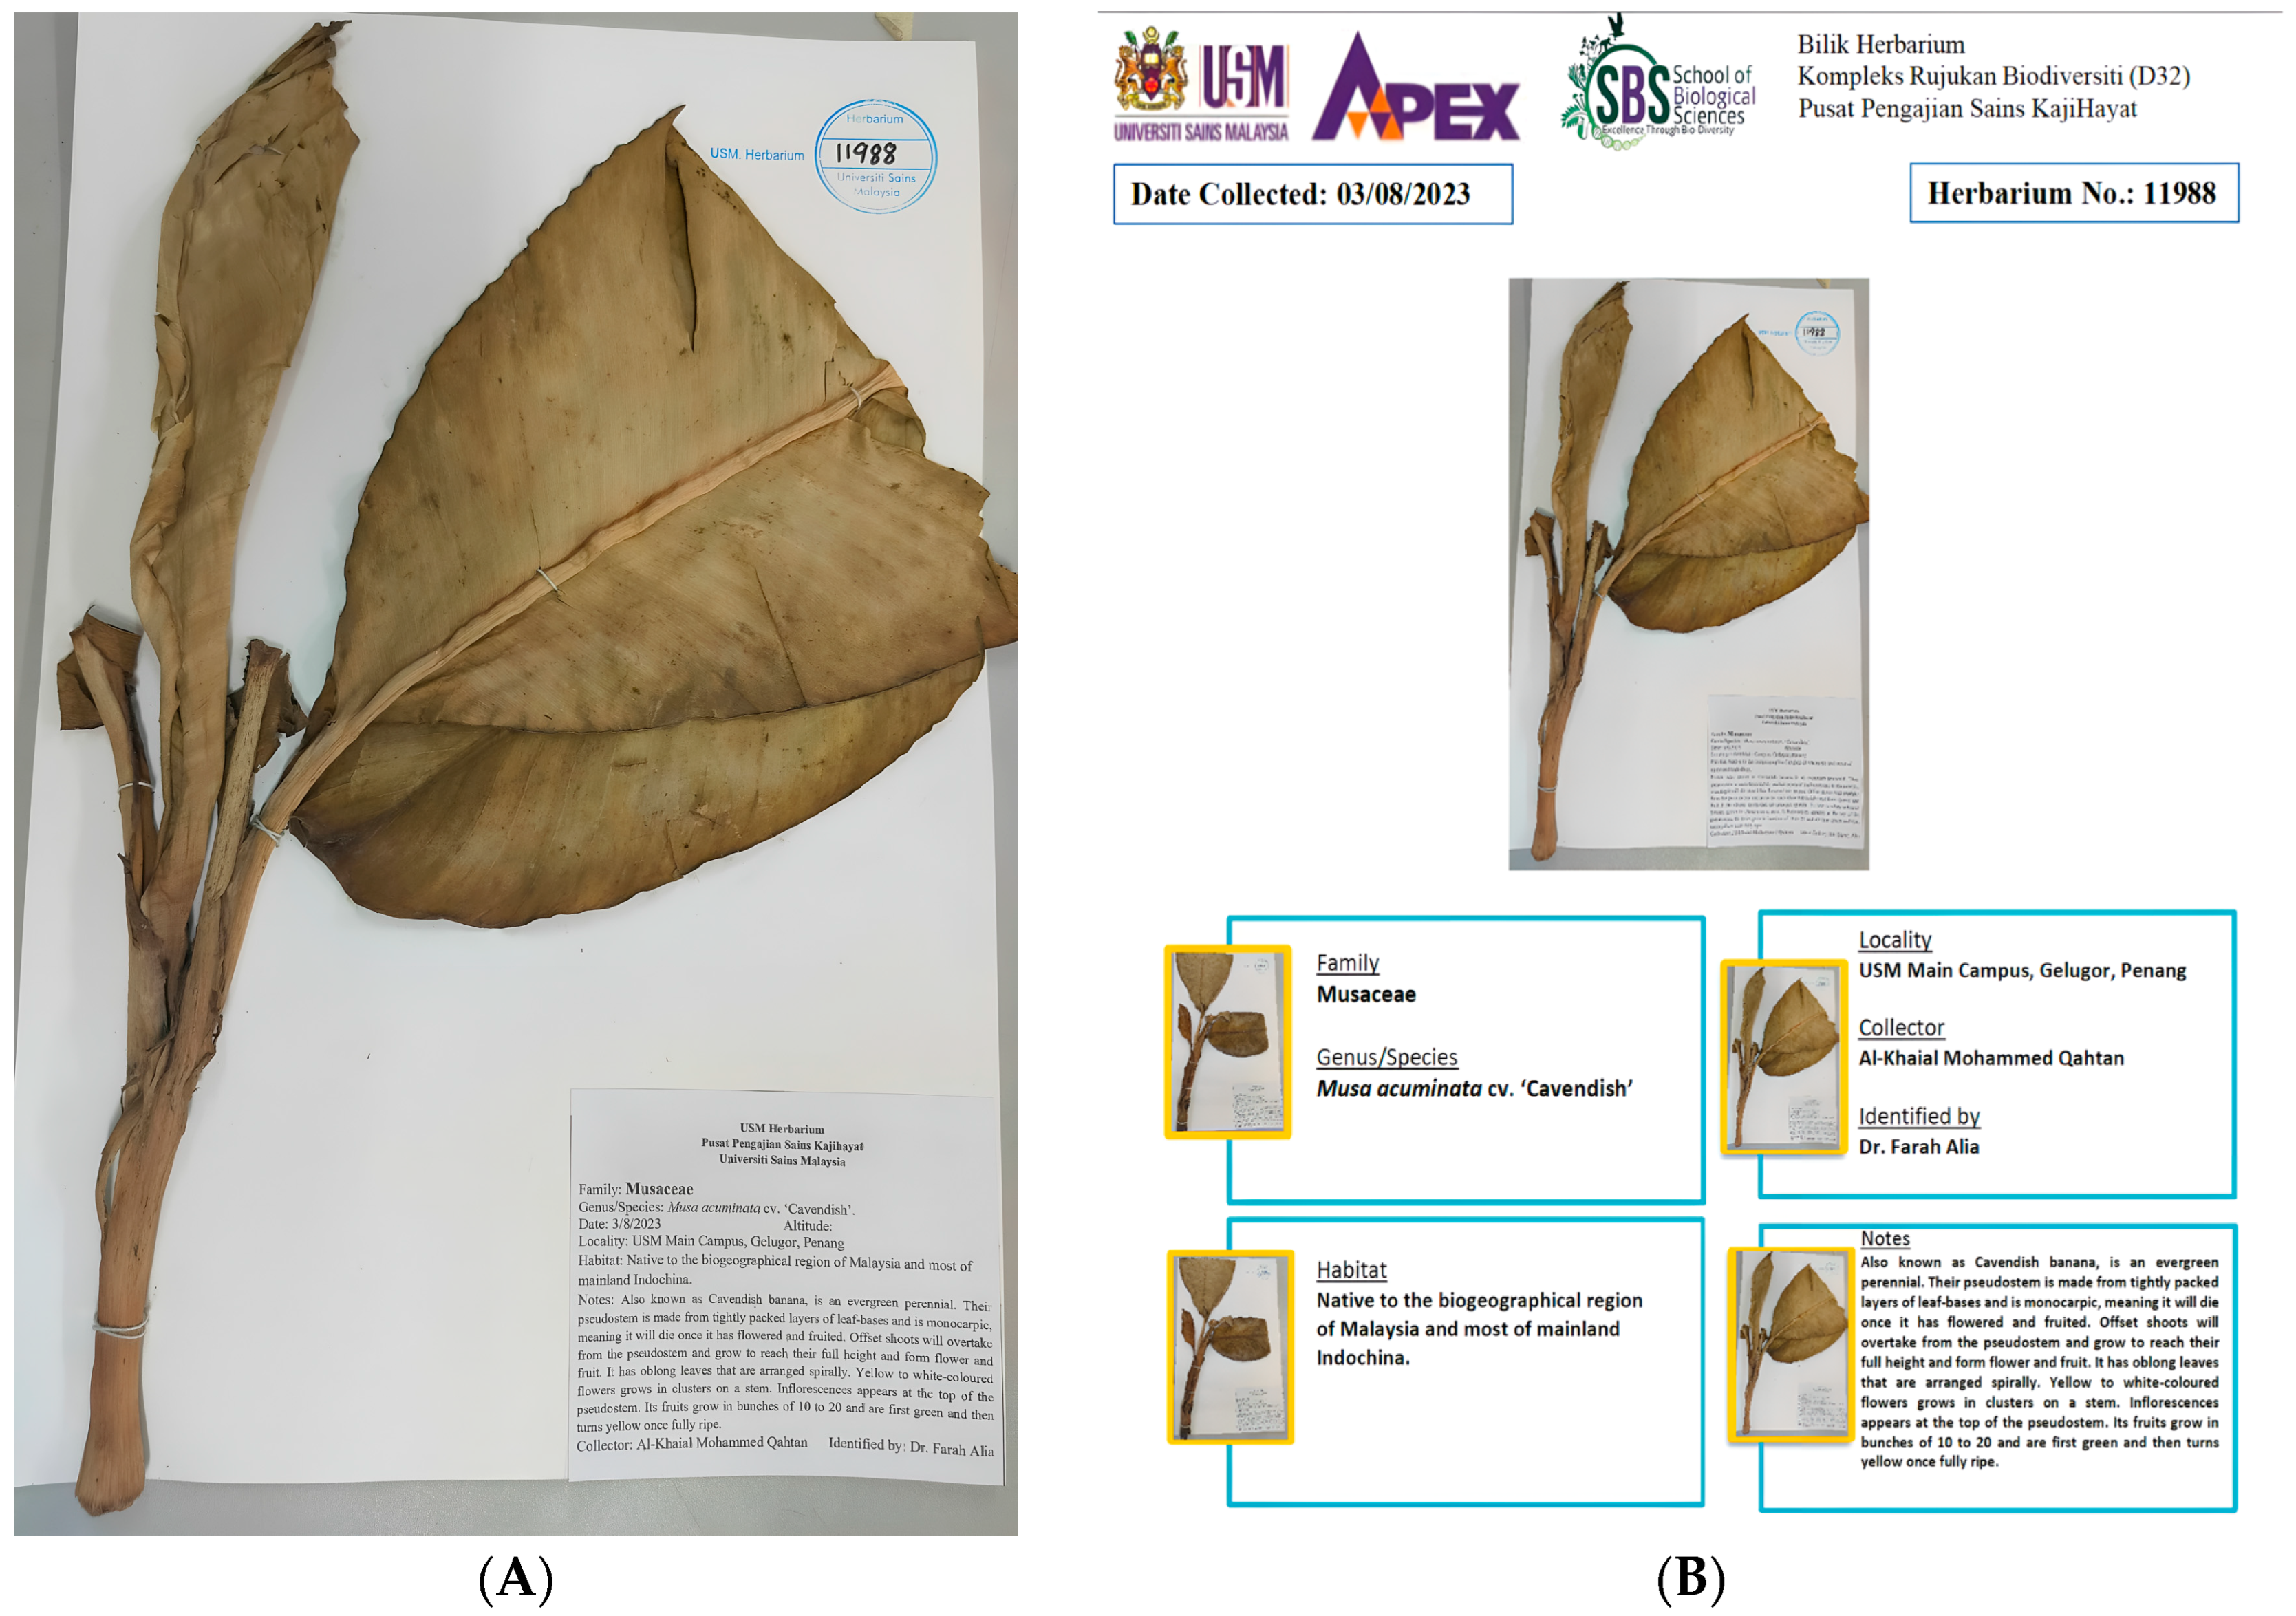
Figure 2.
Banana plant and fruits.

Figure 3.
Extract screening tests: (A) flavonoids test; (B) glycosides test; (C) emulsion test; (D) froth test; (E) ferric chloride test; (F) lead acetate test; (G) phlobatannins test.
Figure 3.
Extract screening tests: (A) flavonoids test; (B) glycosides test; (C) emulsion test; (D) froth test; (E) ferric chloride test; (F) lead acetate test; (G) phlobatannins test.
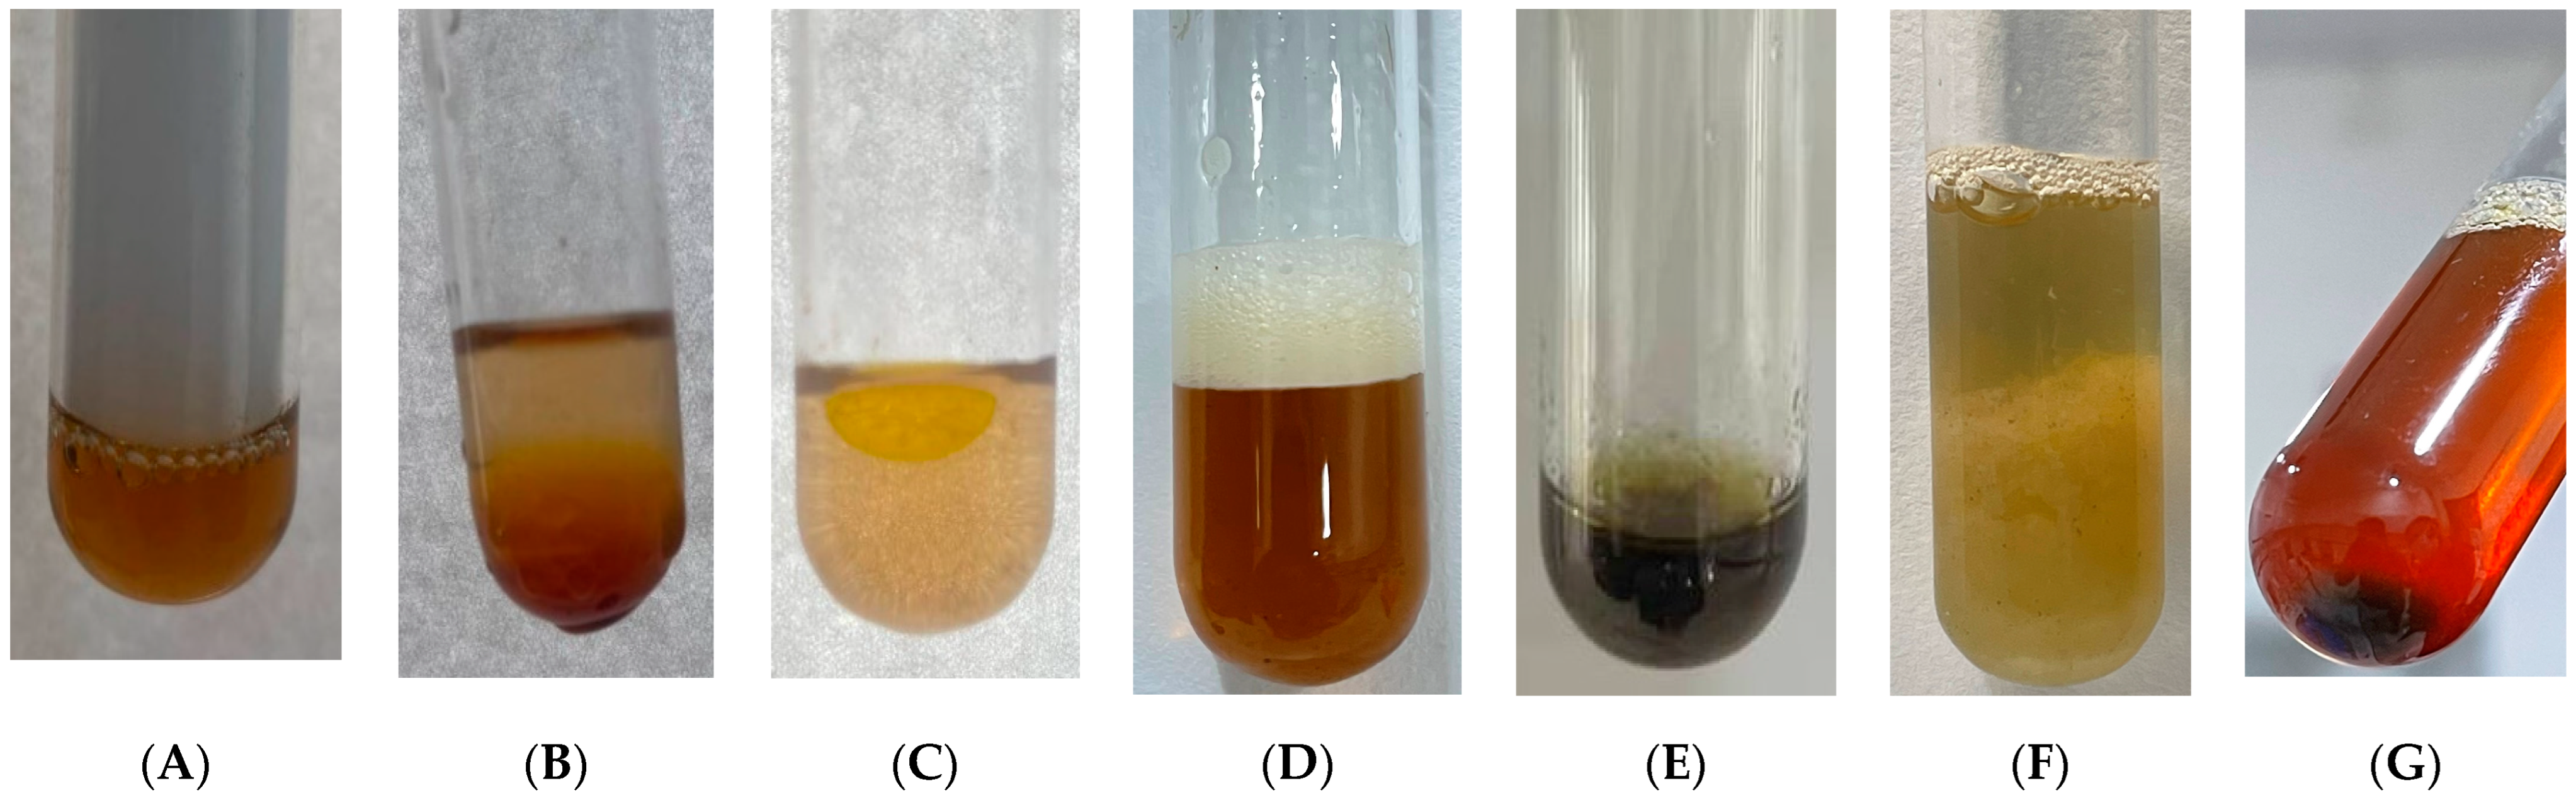
Figure 4.
Zn acetate concentration and the weight of yielded ZnO NPs.
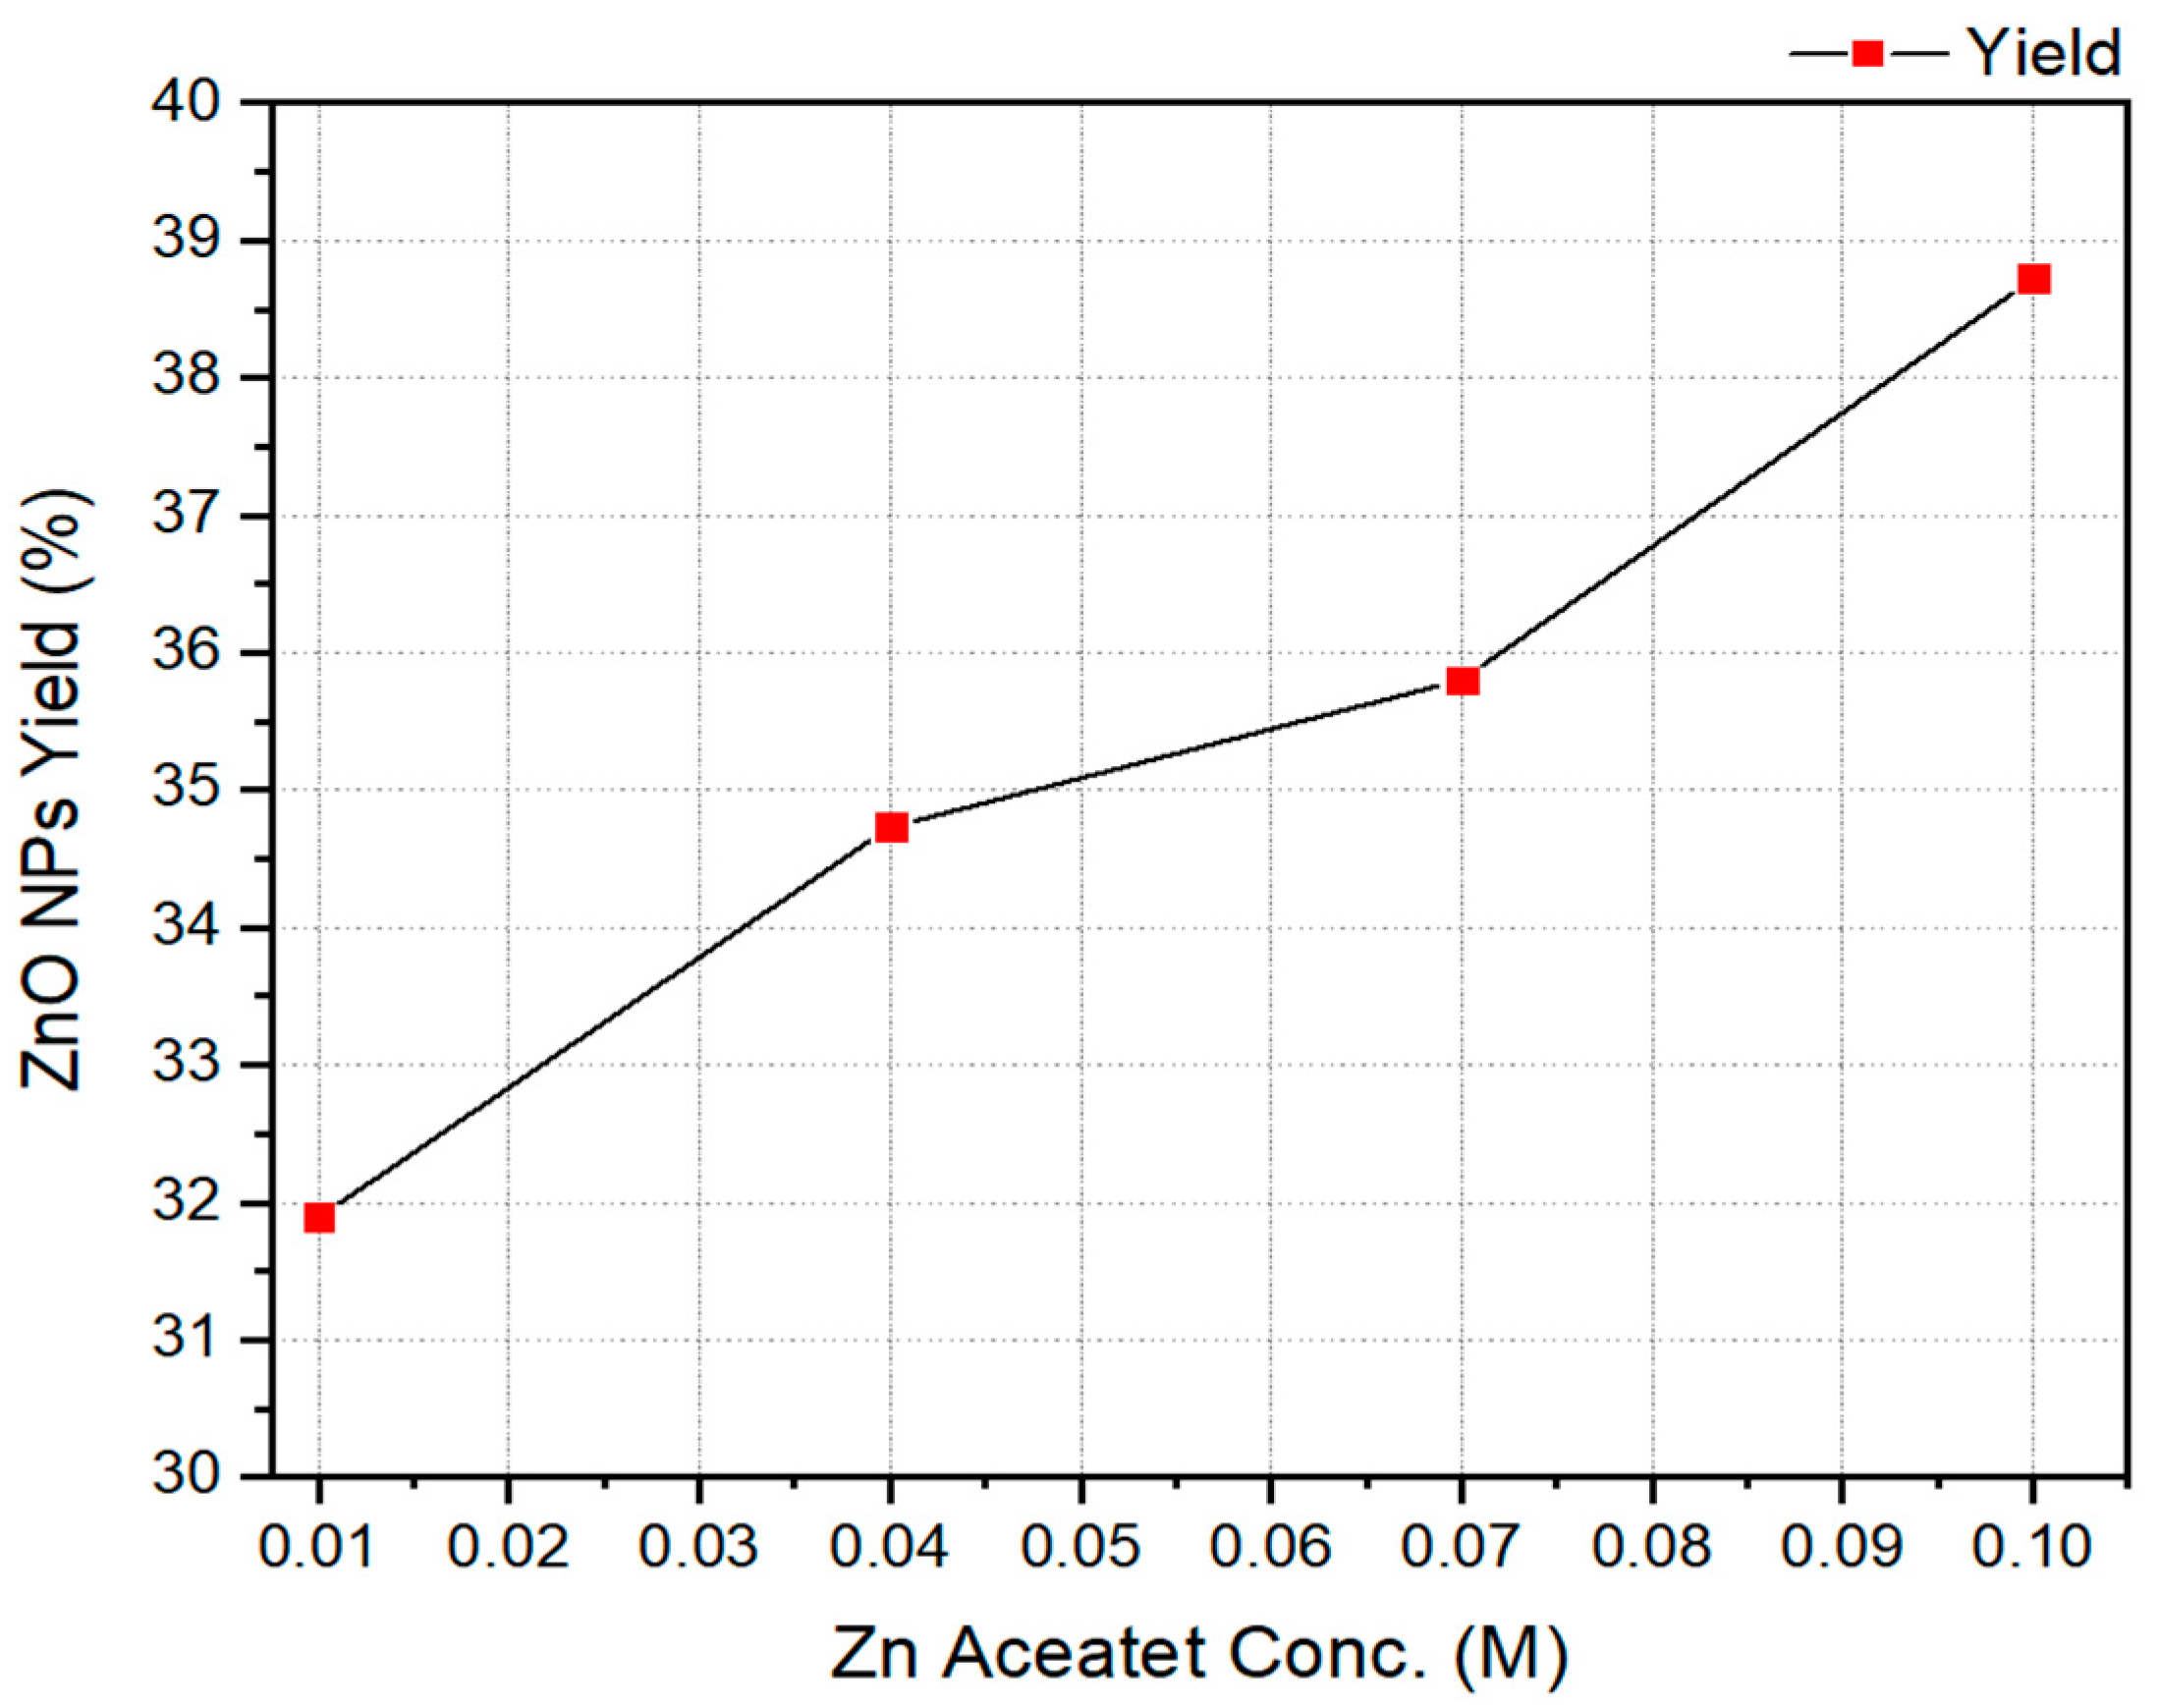
Figure 5.
UV–visible spectroscopy spectra of the prepared ZnO NPs. (A) ZnO NPs (0.1 M); (B) ZnO NPs (0.07 M); (C) ZnO NPs (0.04 M); (D) ZnO NPs (0.01 M).
Figure 5.
UV–visible spectroscopy spectra of the prepared ZnO NPs. (A) ZnO NPs (0.1 M); (B) ZnO NPs (0.07 M); (C) ZnO NPs (0.04 M); (D) ZnO NPs (0.01 M).
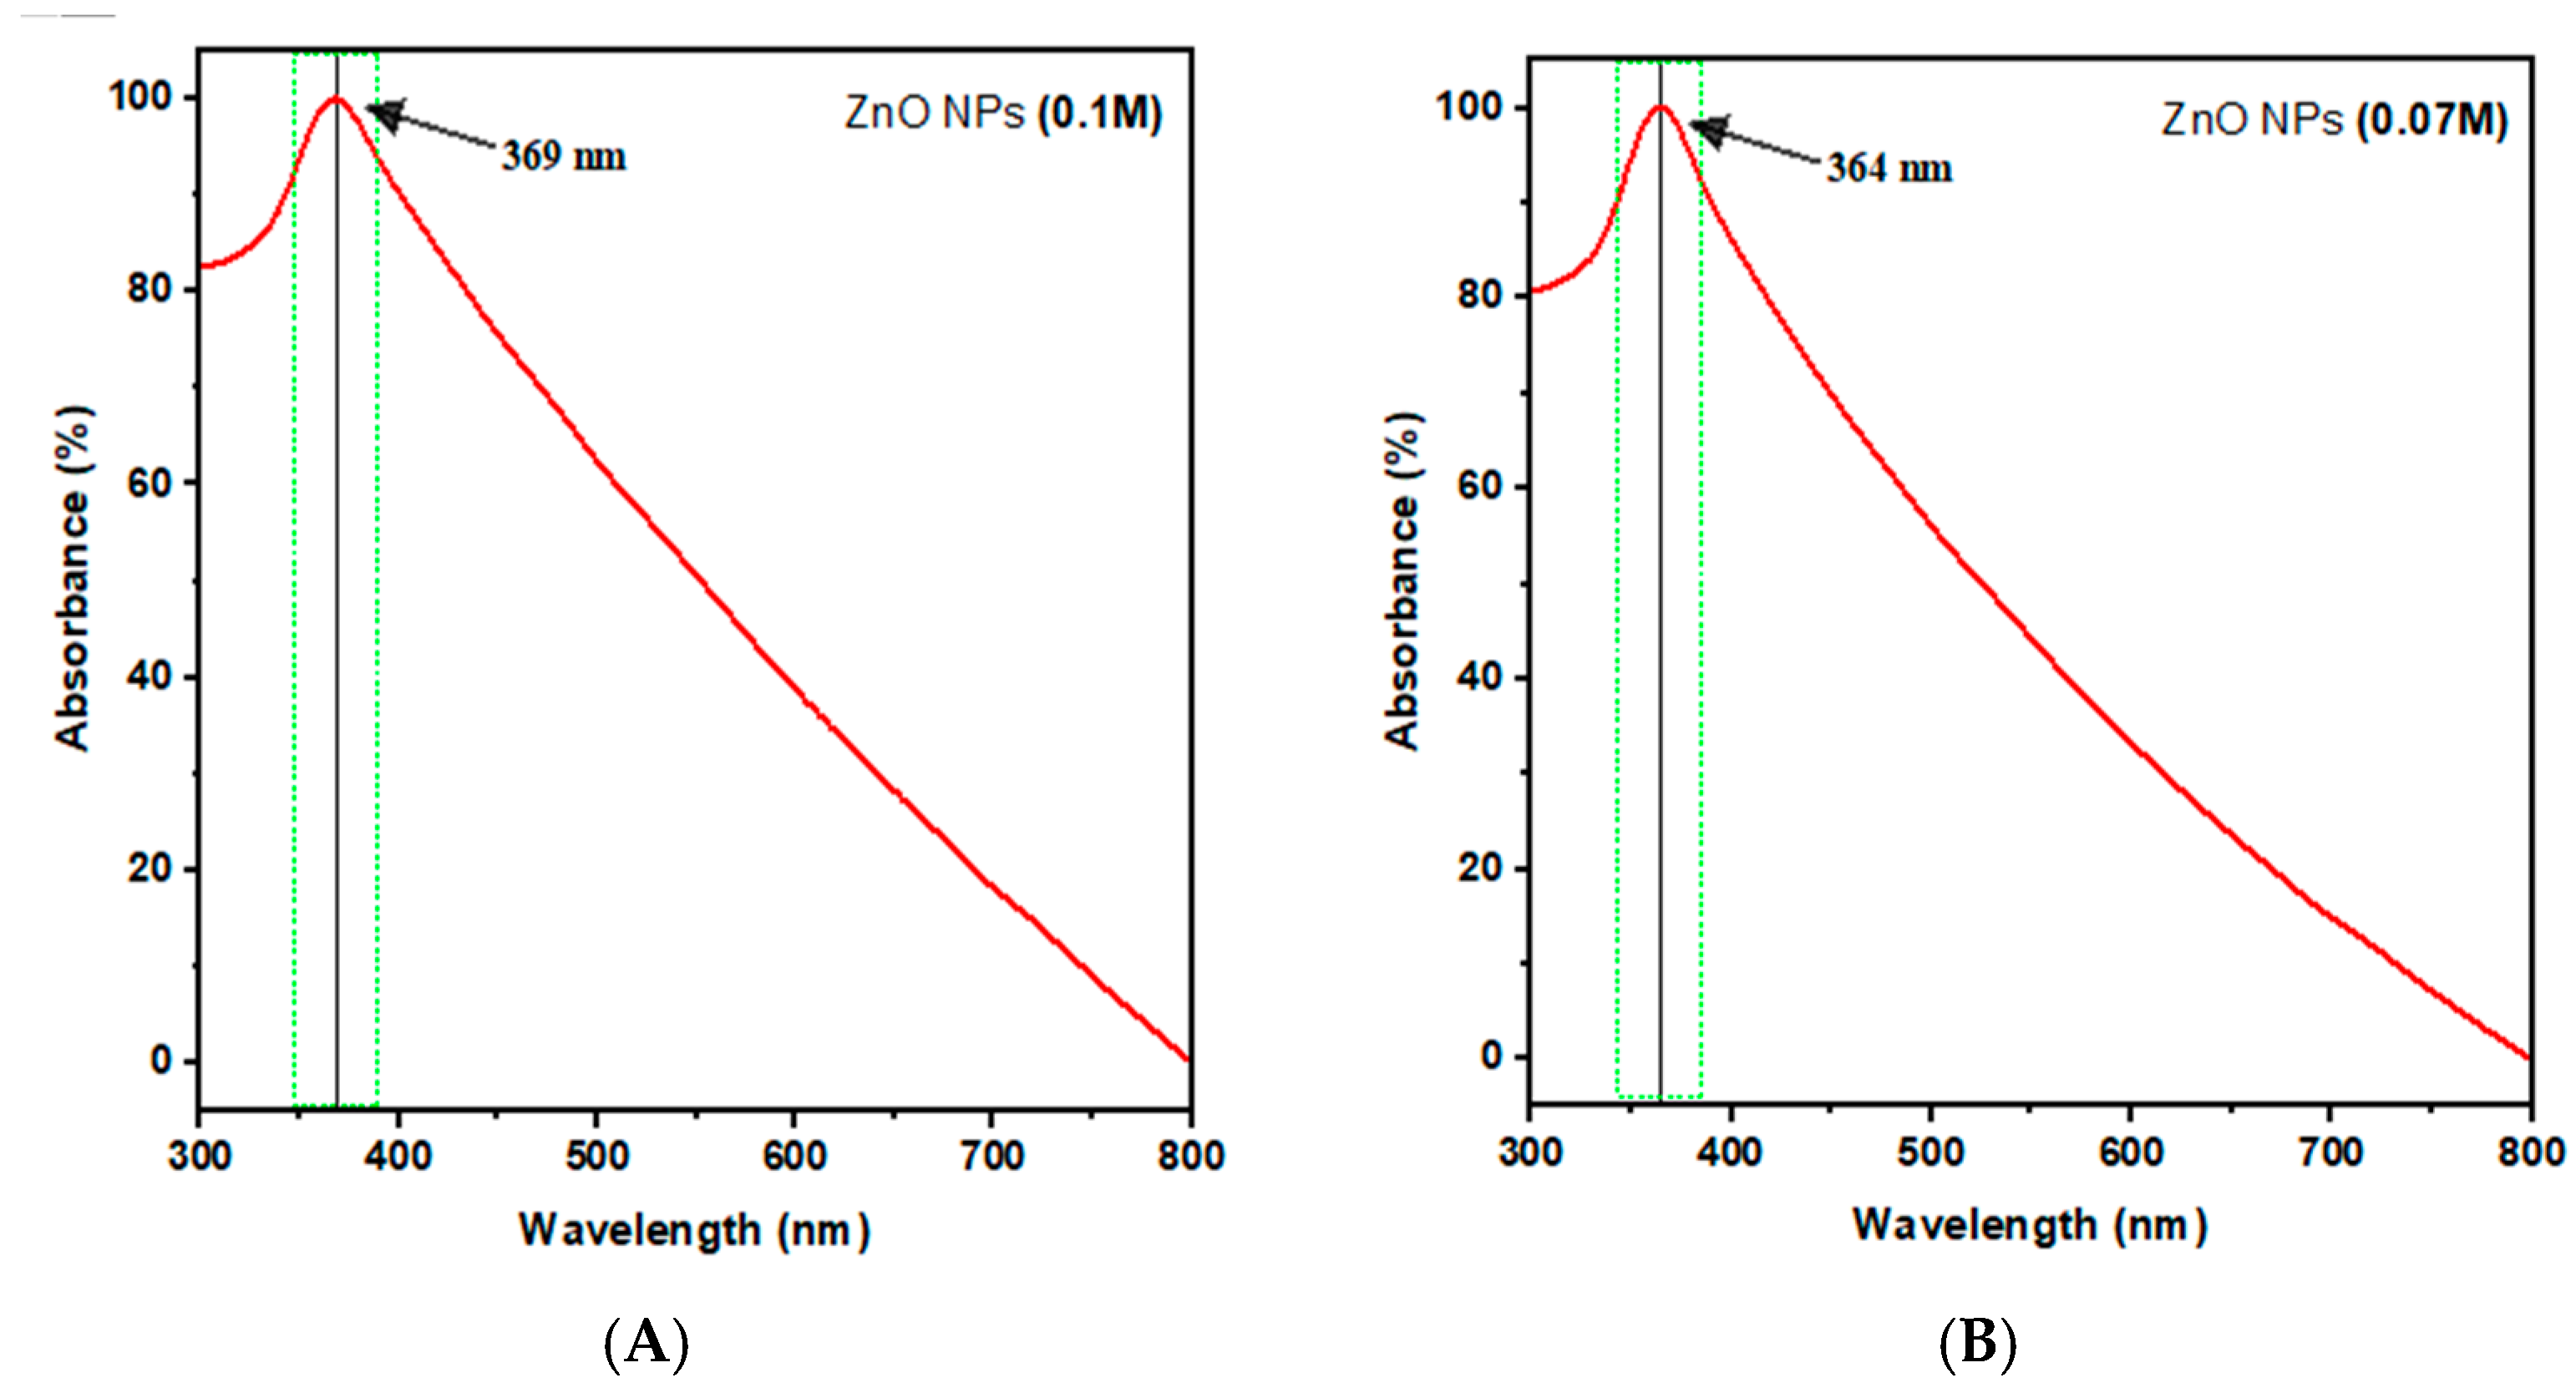
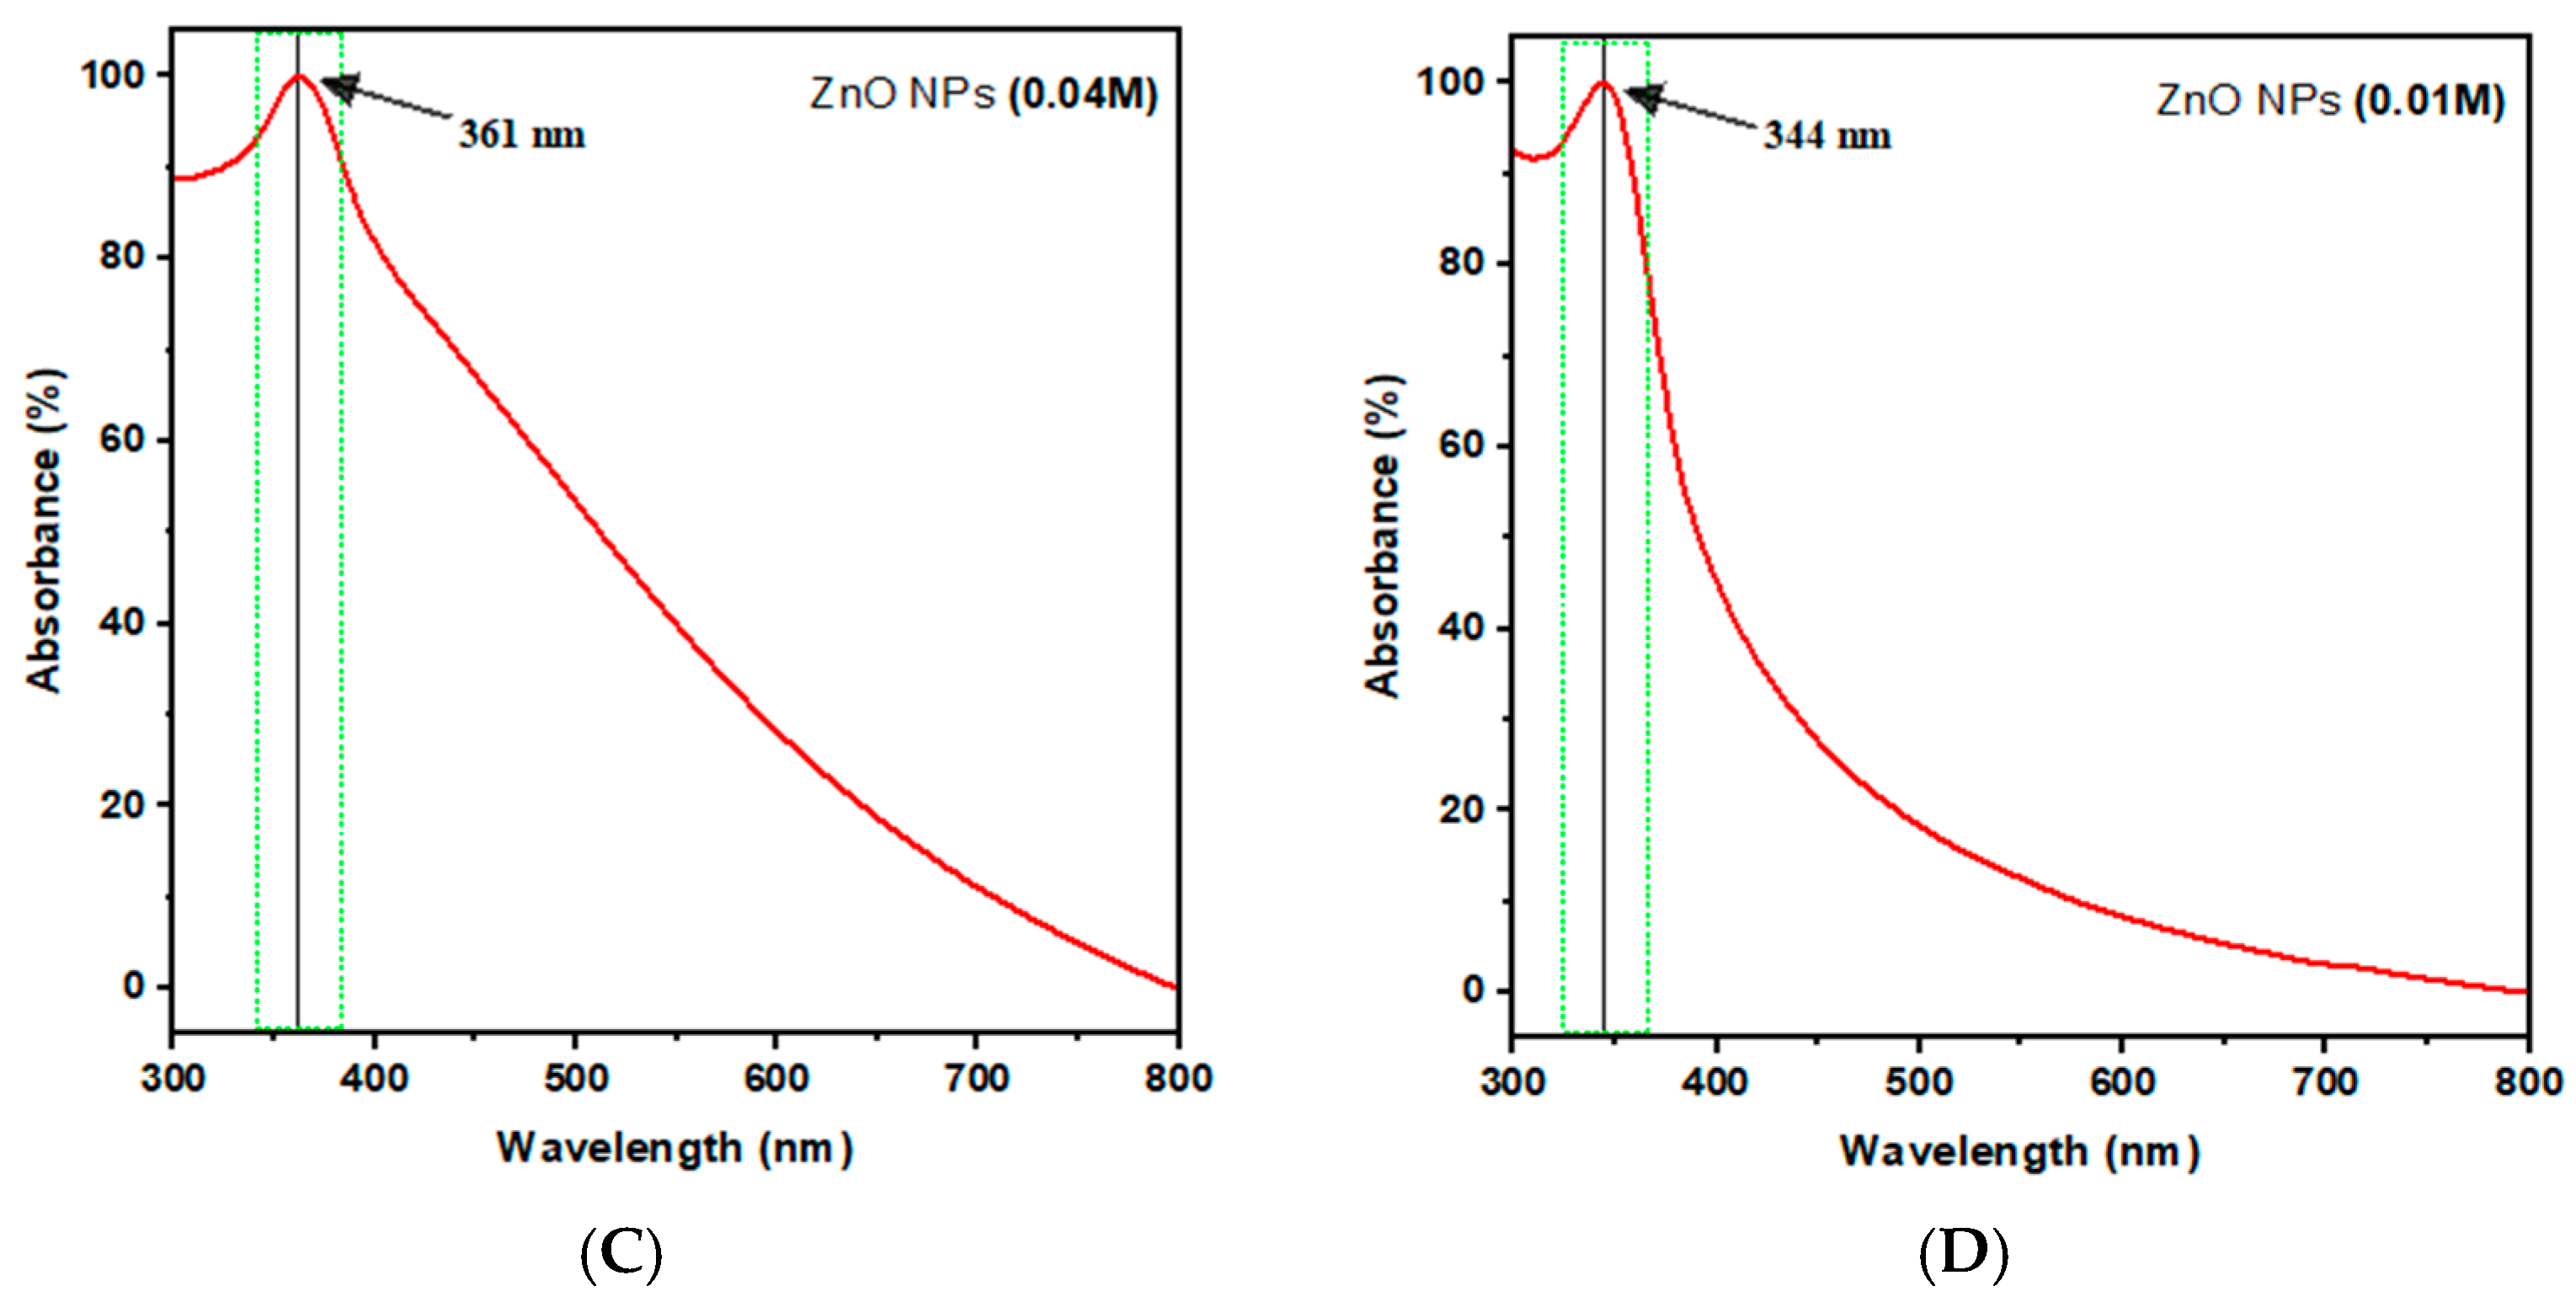
Figure 6.
SEM images of the prepared ZnO NPs powder. (A) ZnO NPs (0.1 M); (B) ZnO NPs (0.07 M); (C) ZnO NPs (0.04 M); (D) ZnO NPs (0.01 M).
Figure 6.
SEM images of the prepared ZnO NPs powder. (A) ZnO NPs (0.1 M); (B) ZnO NPs (0.07 M); (C) ZnO NPs (0.04 M); (D) ZnO NPs (0.01 M).
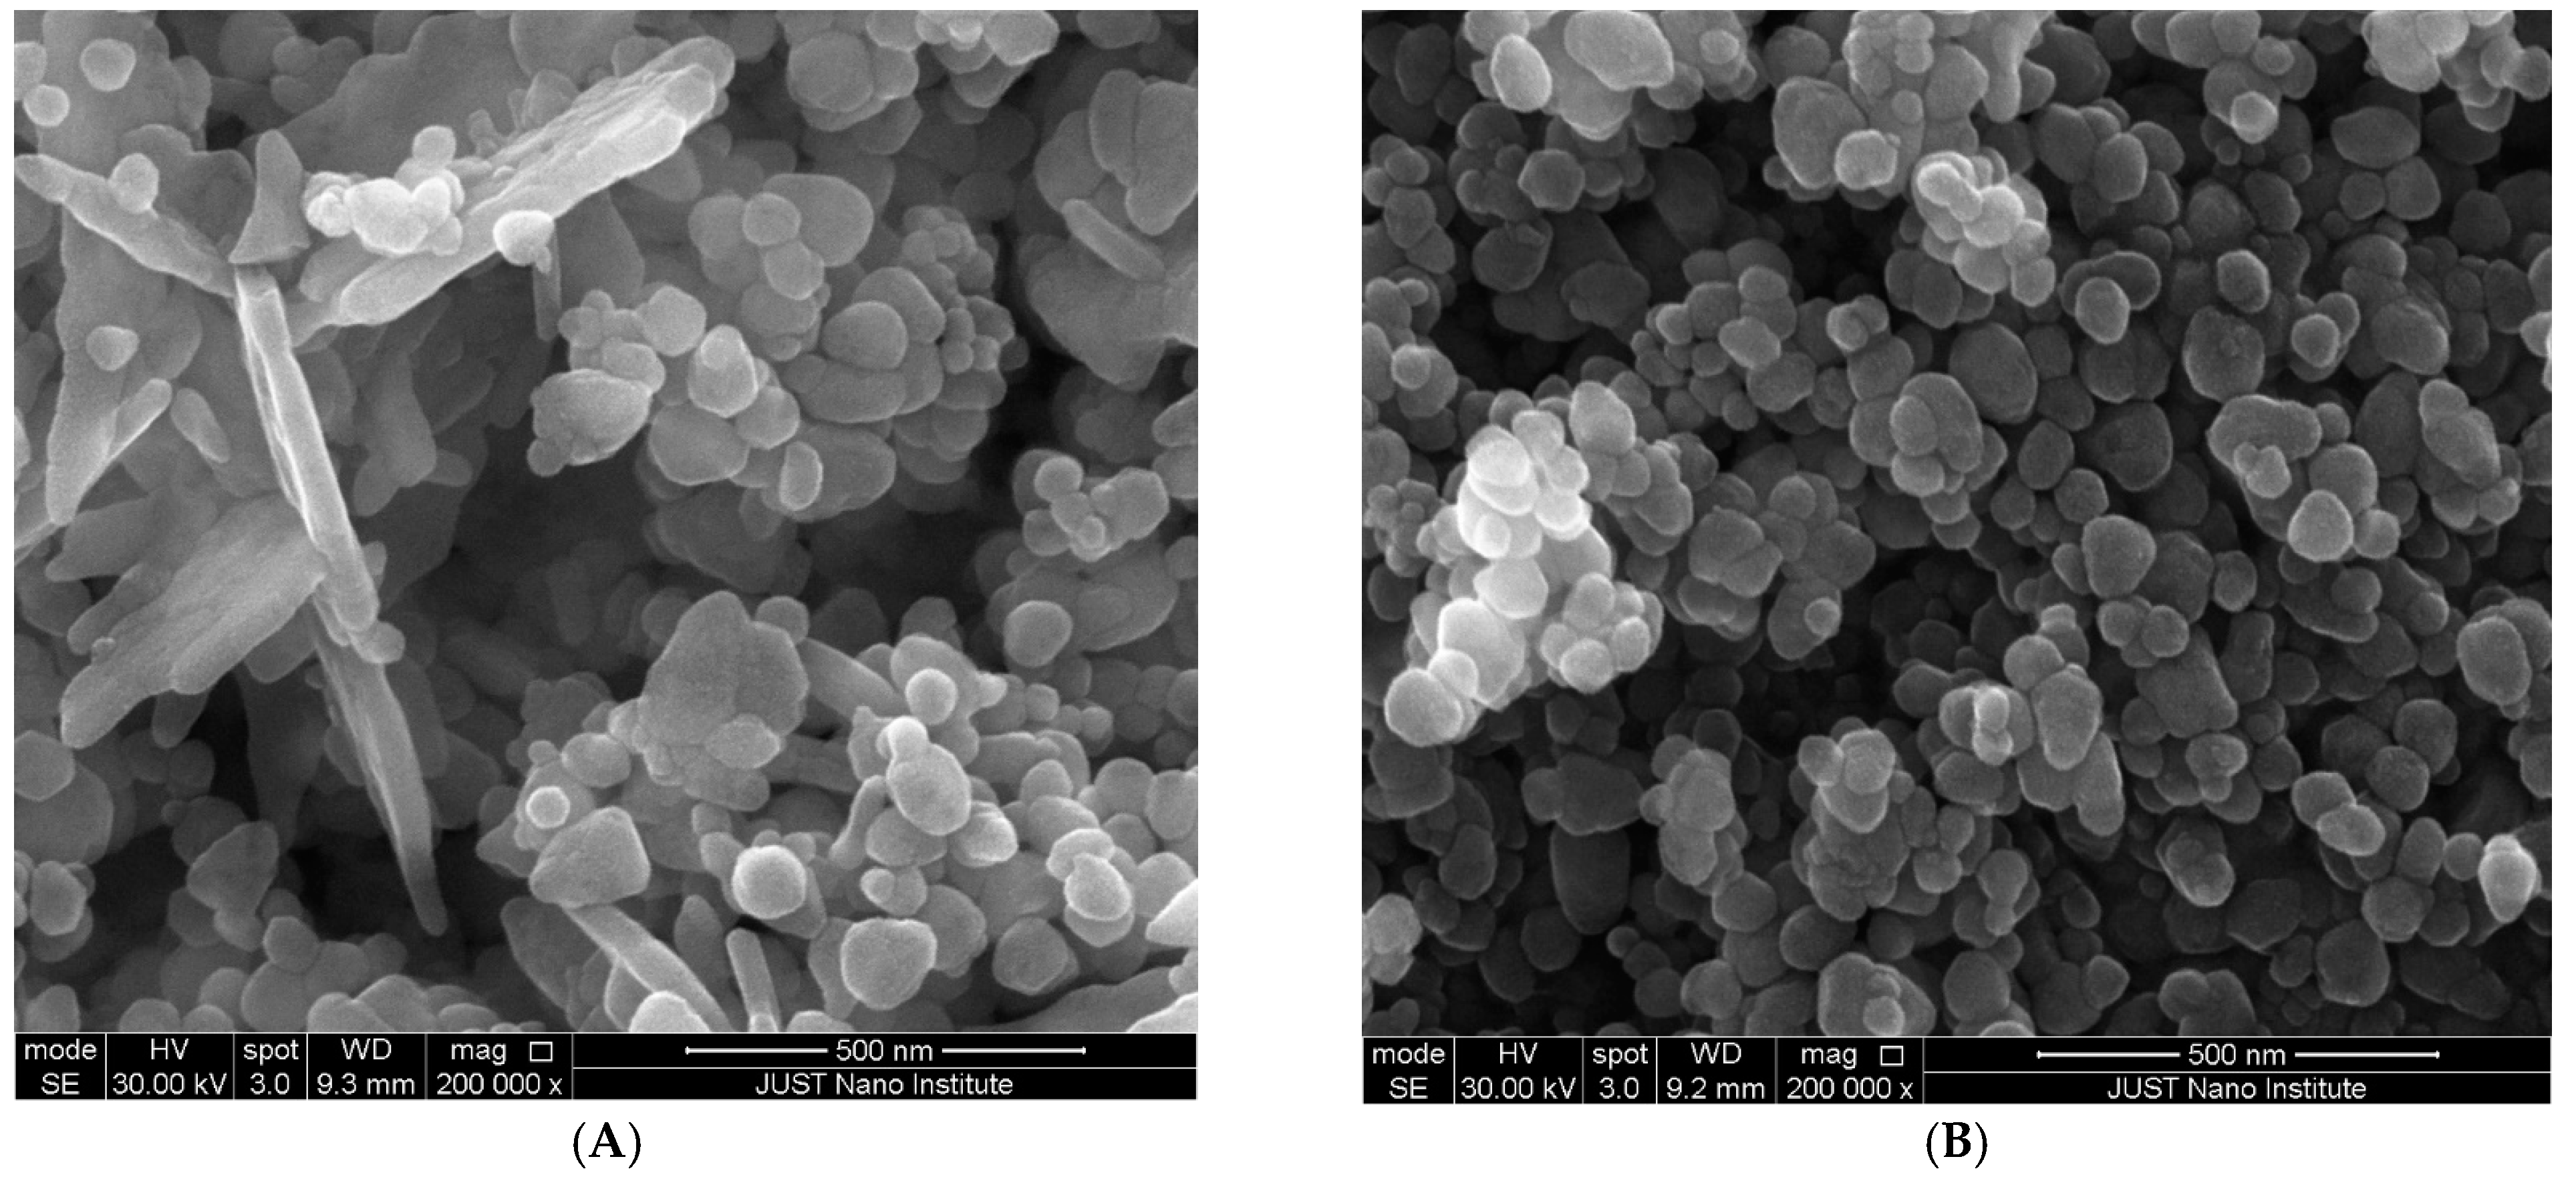
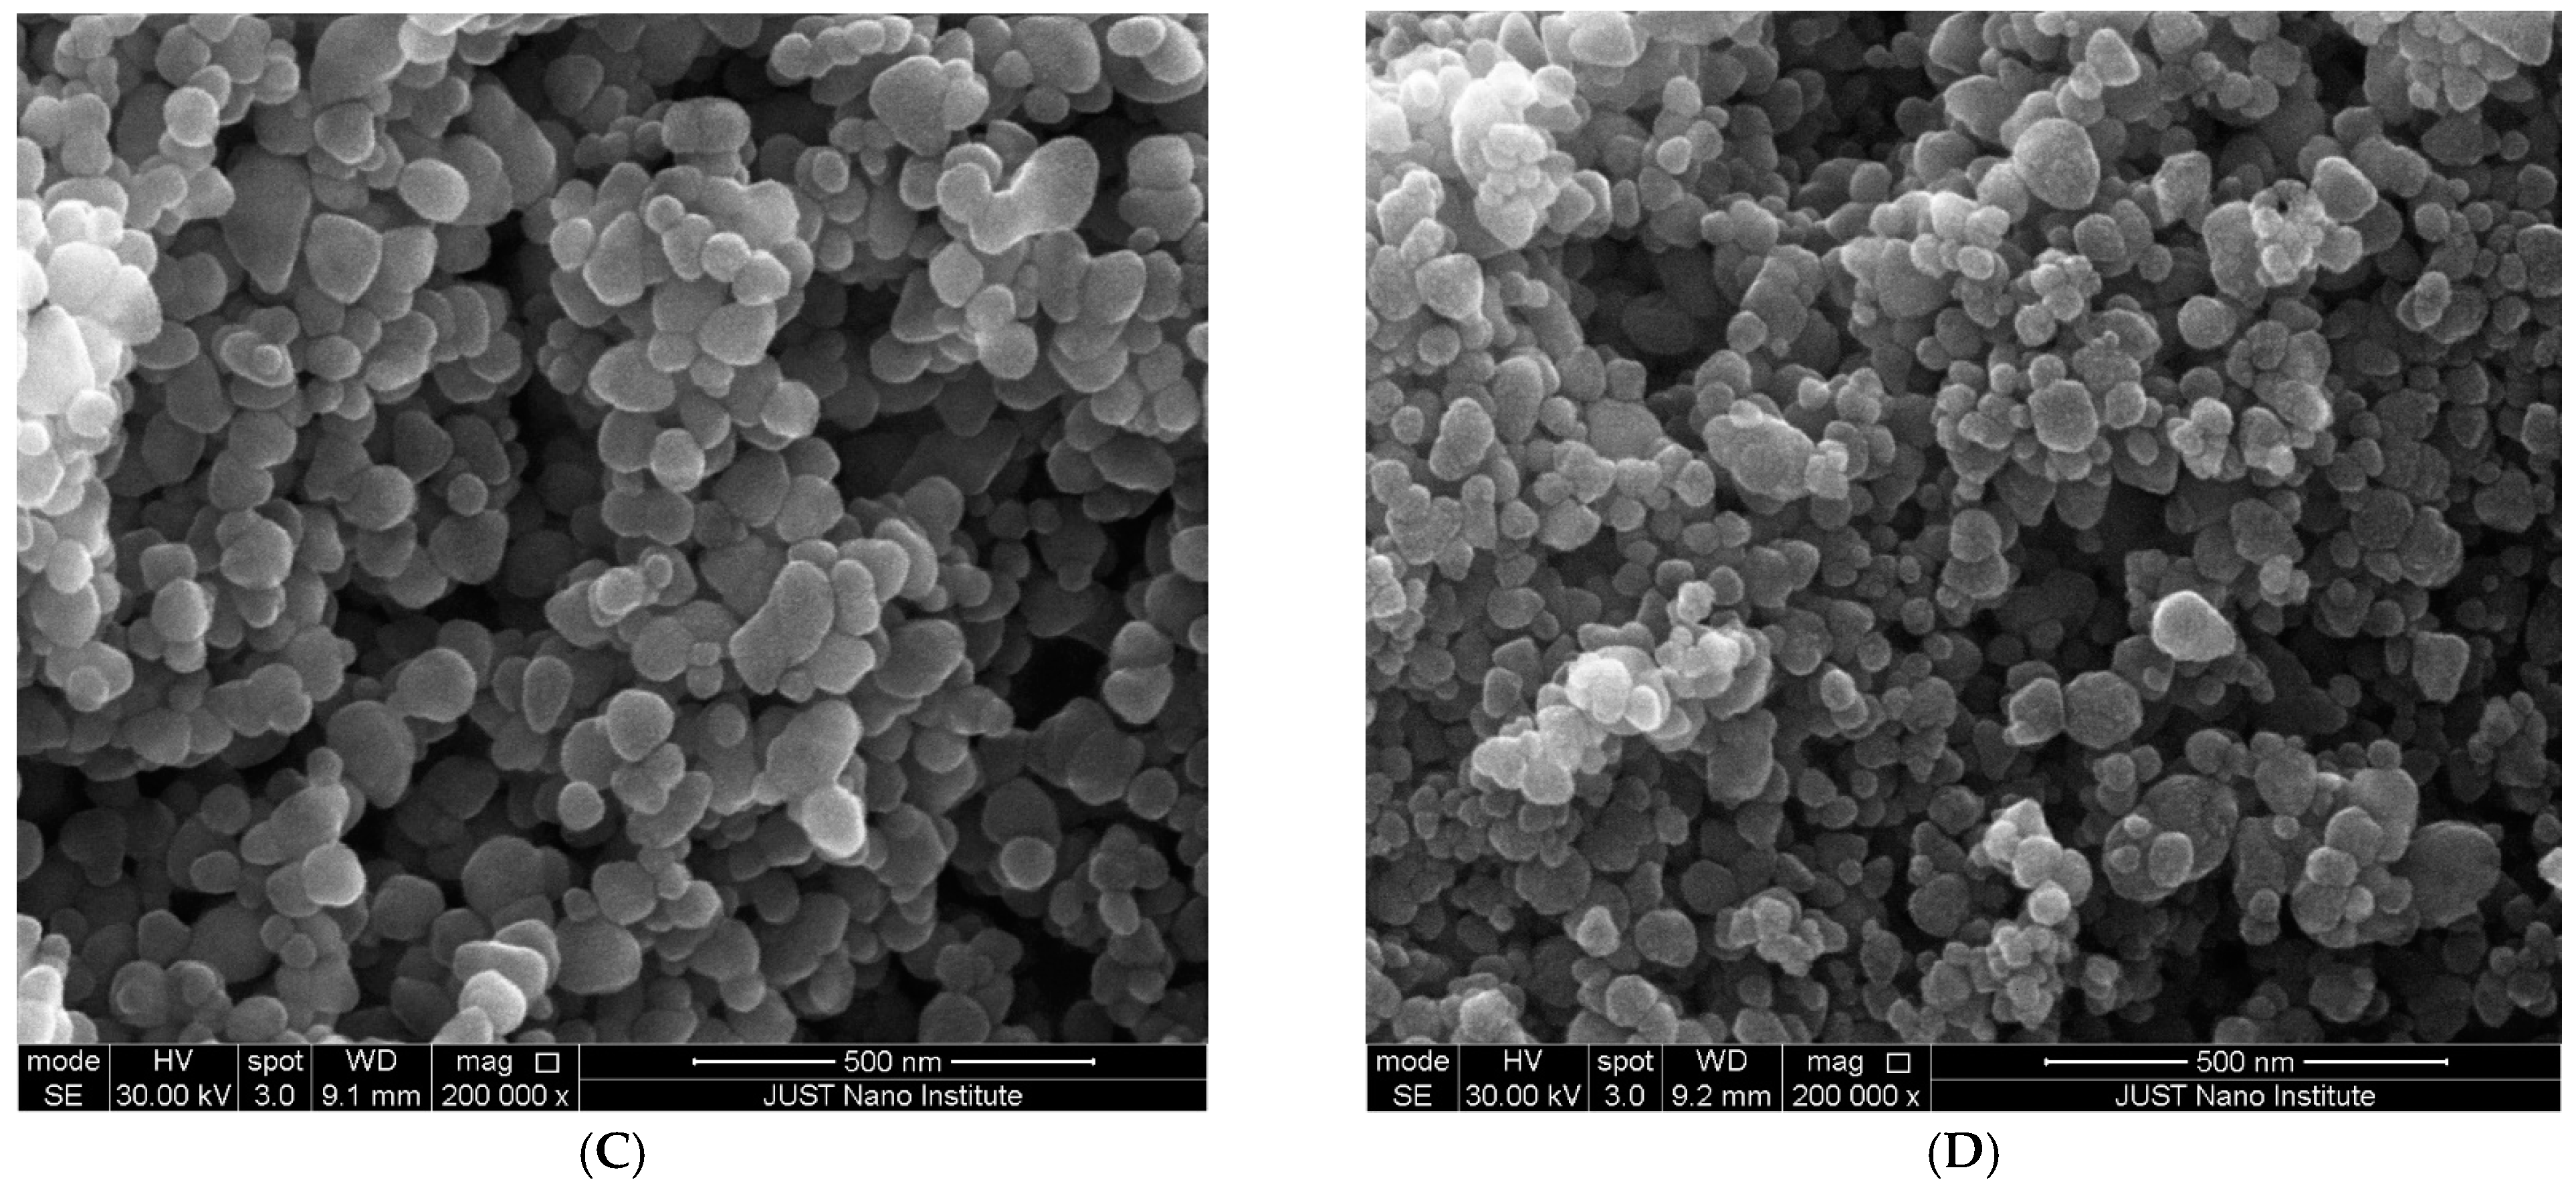
Figure 7.
ZnO NP size measurements by SEM and frequencies.
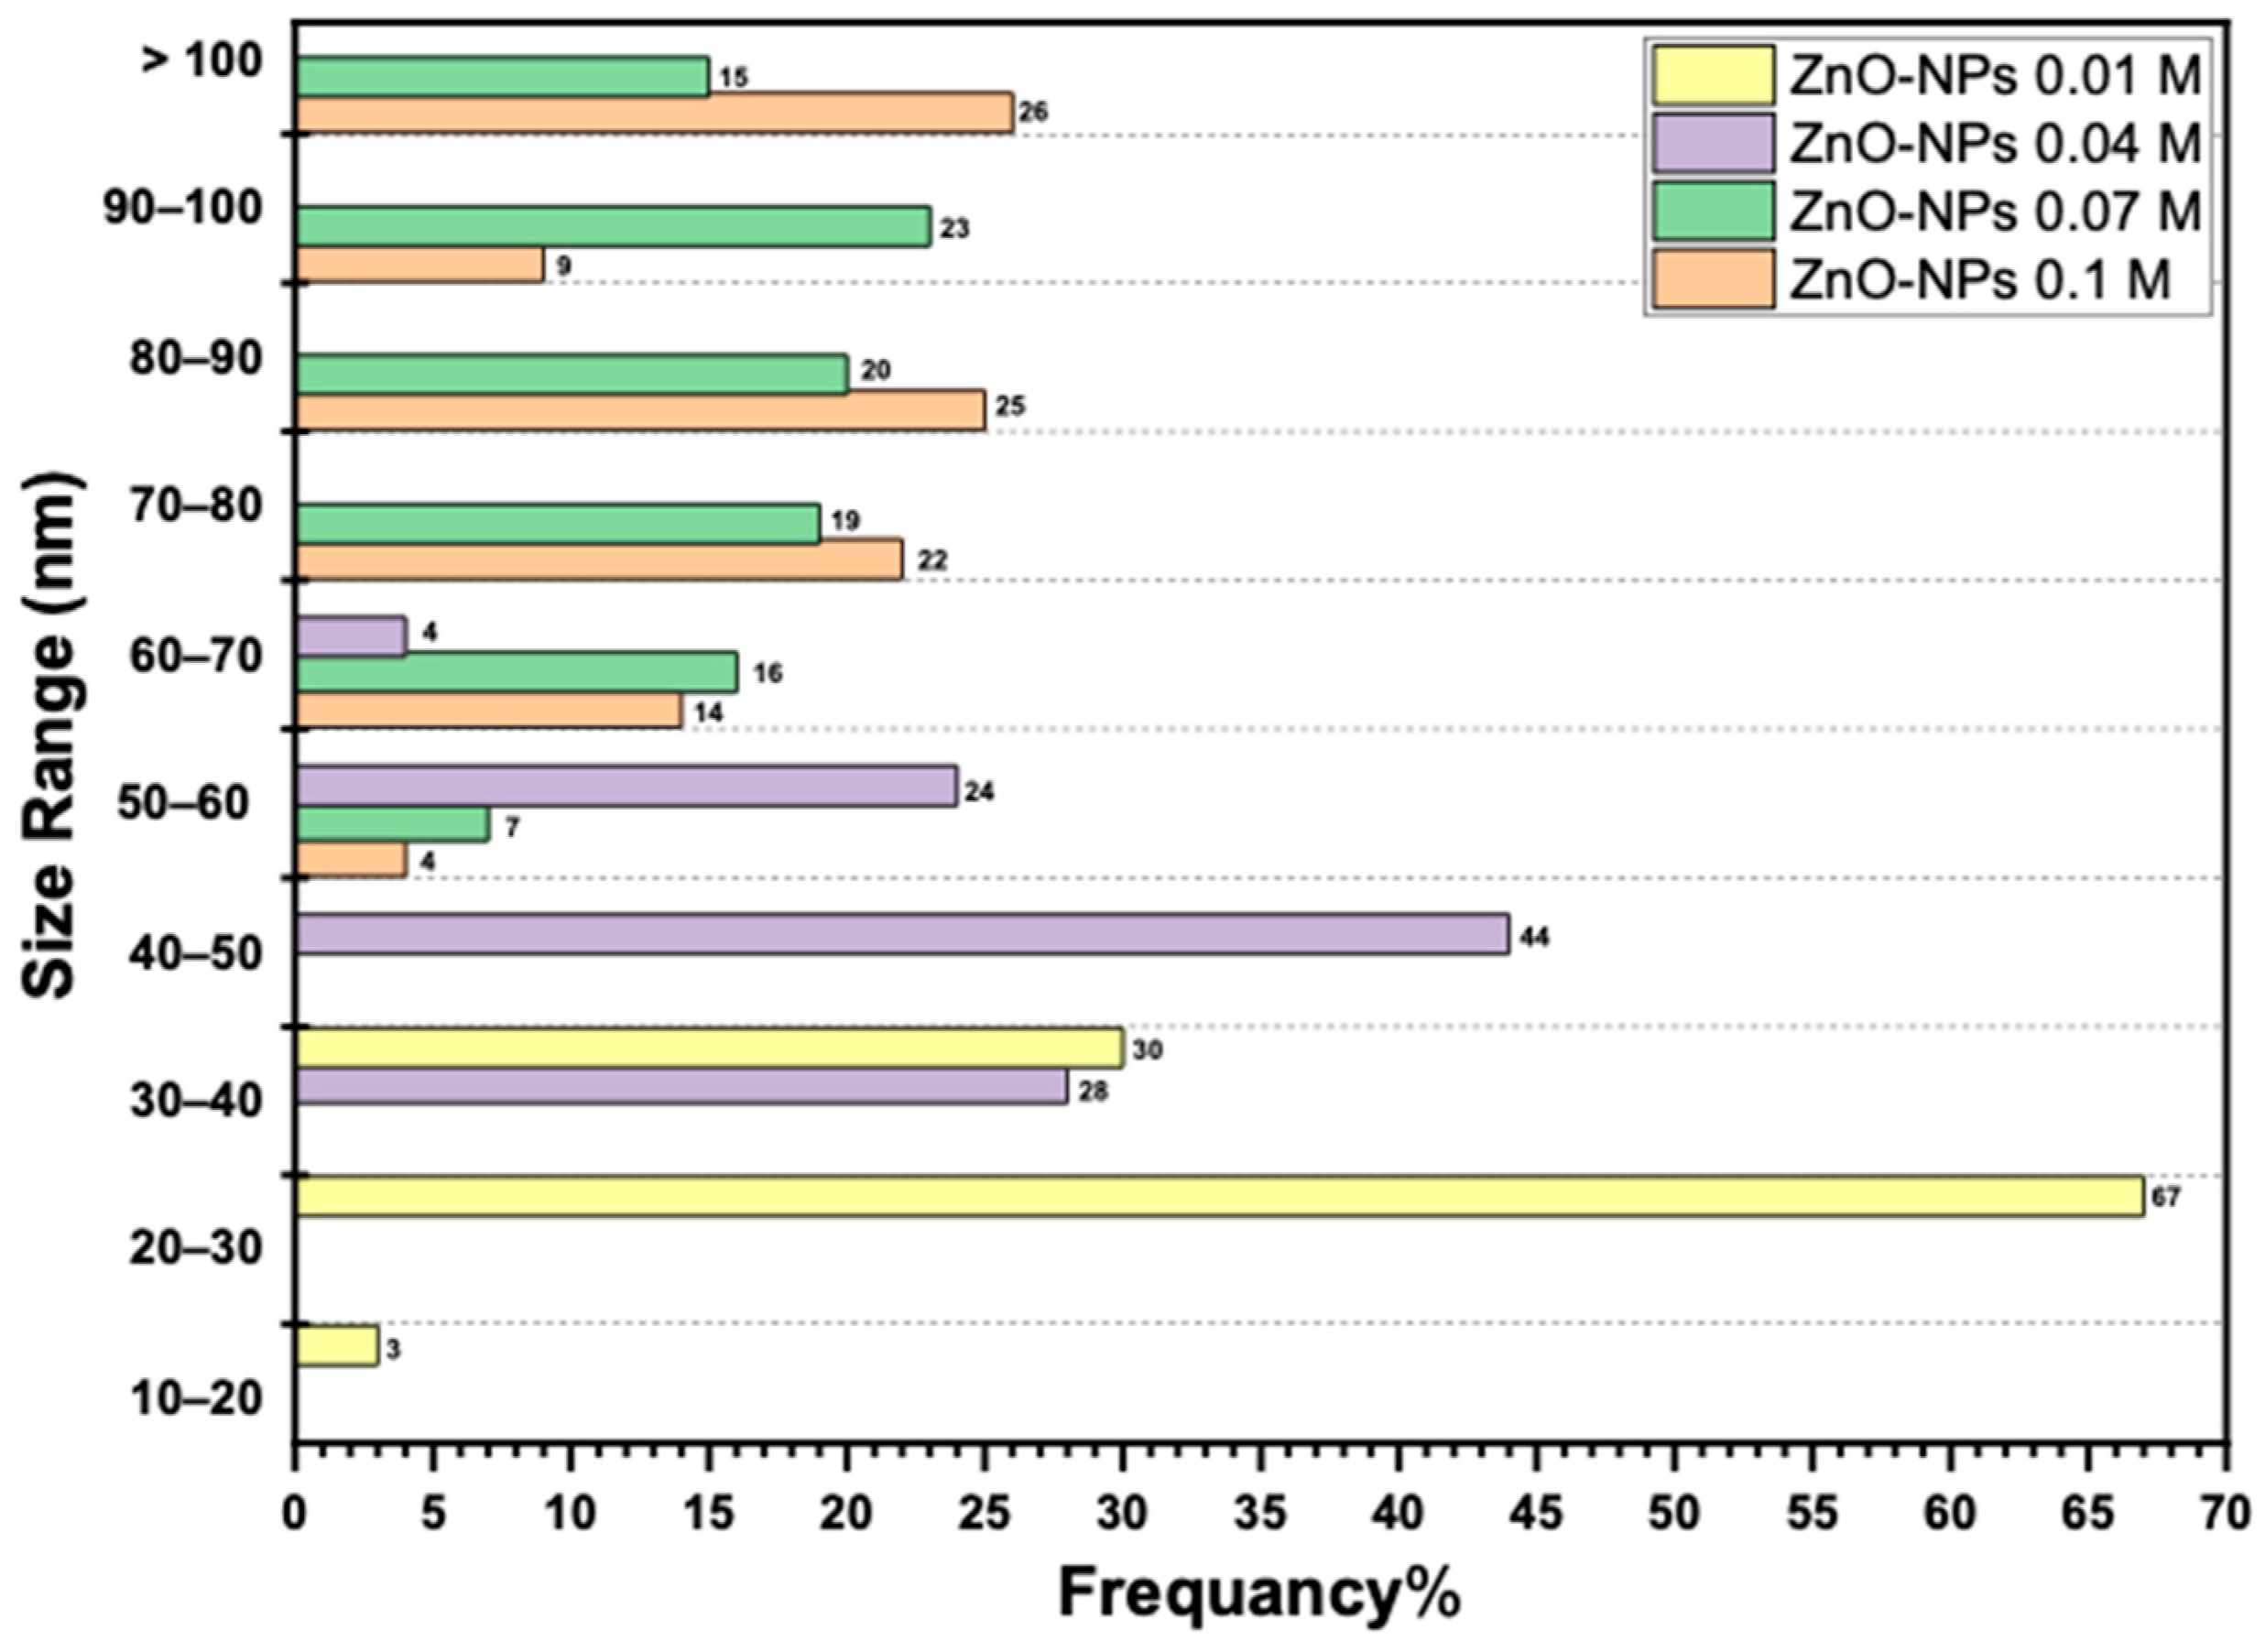
Figure 8.
Size distribution of the prepared ZnO NPs. (A) ZnO NPs (0.1 M); (B) ZnO NPs (0.07 M); (C) ZnO NPs (0.04 M); (D) ZnO NPs (0.01 M).
Figure 8.
Size distribution of the prepared ZnO NPs. (A) ZnO NPs (0.1 M); (B) ZnO NPs (0.07 M); (C) ZnO NPs (0.04 M); (D) ZnO NPs (0.01 M).
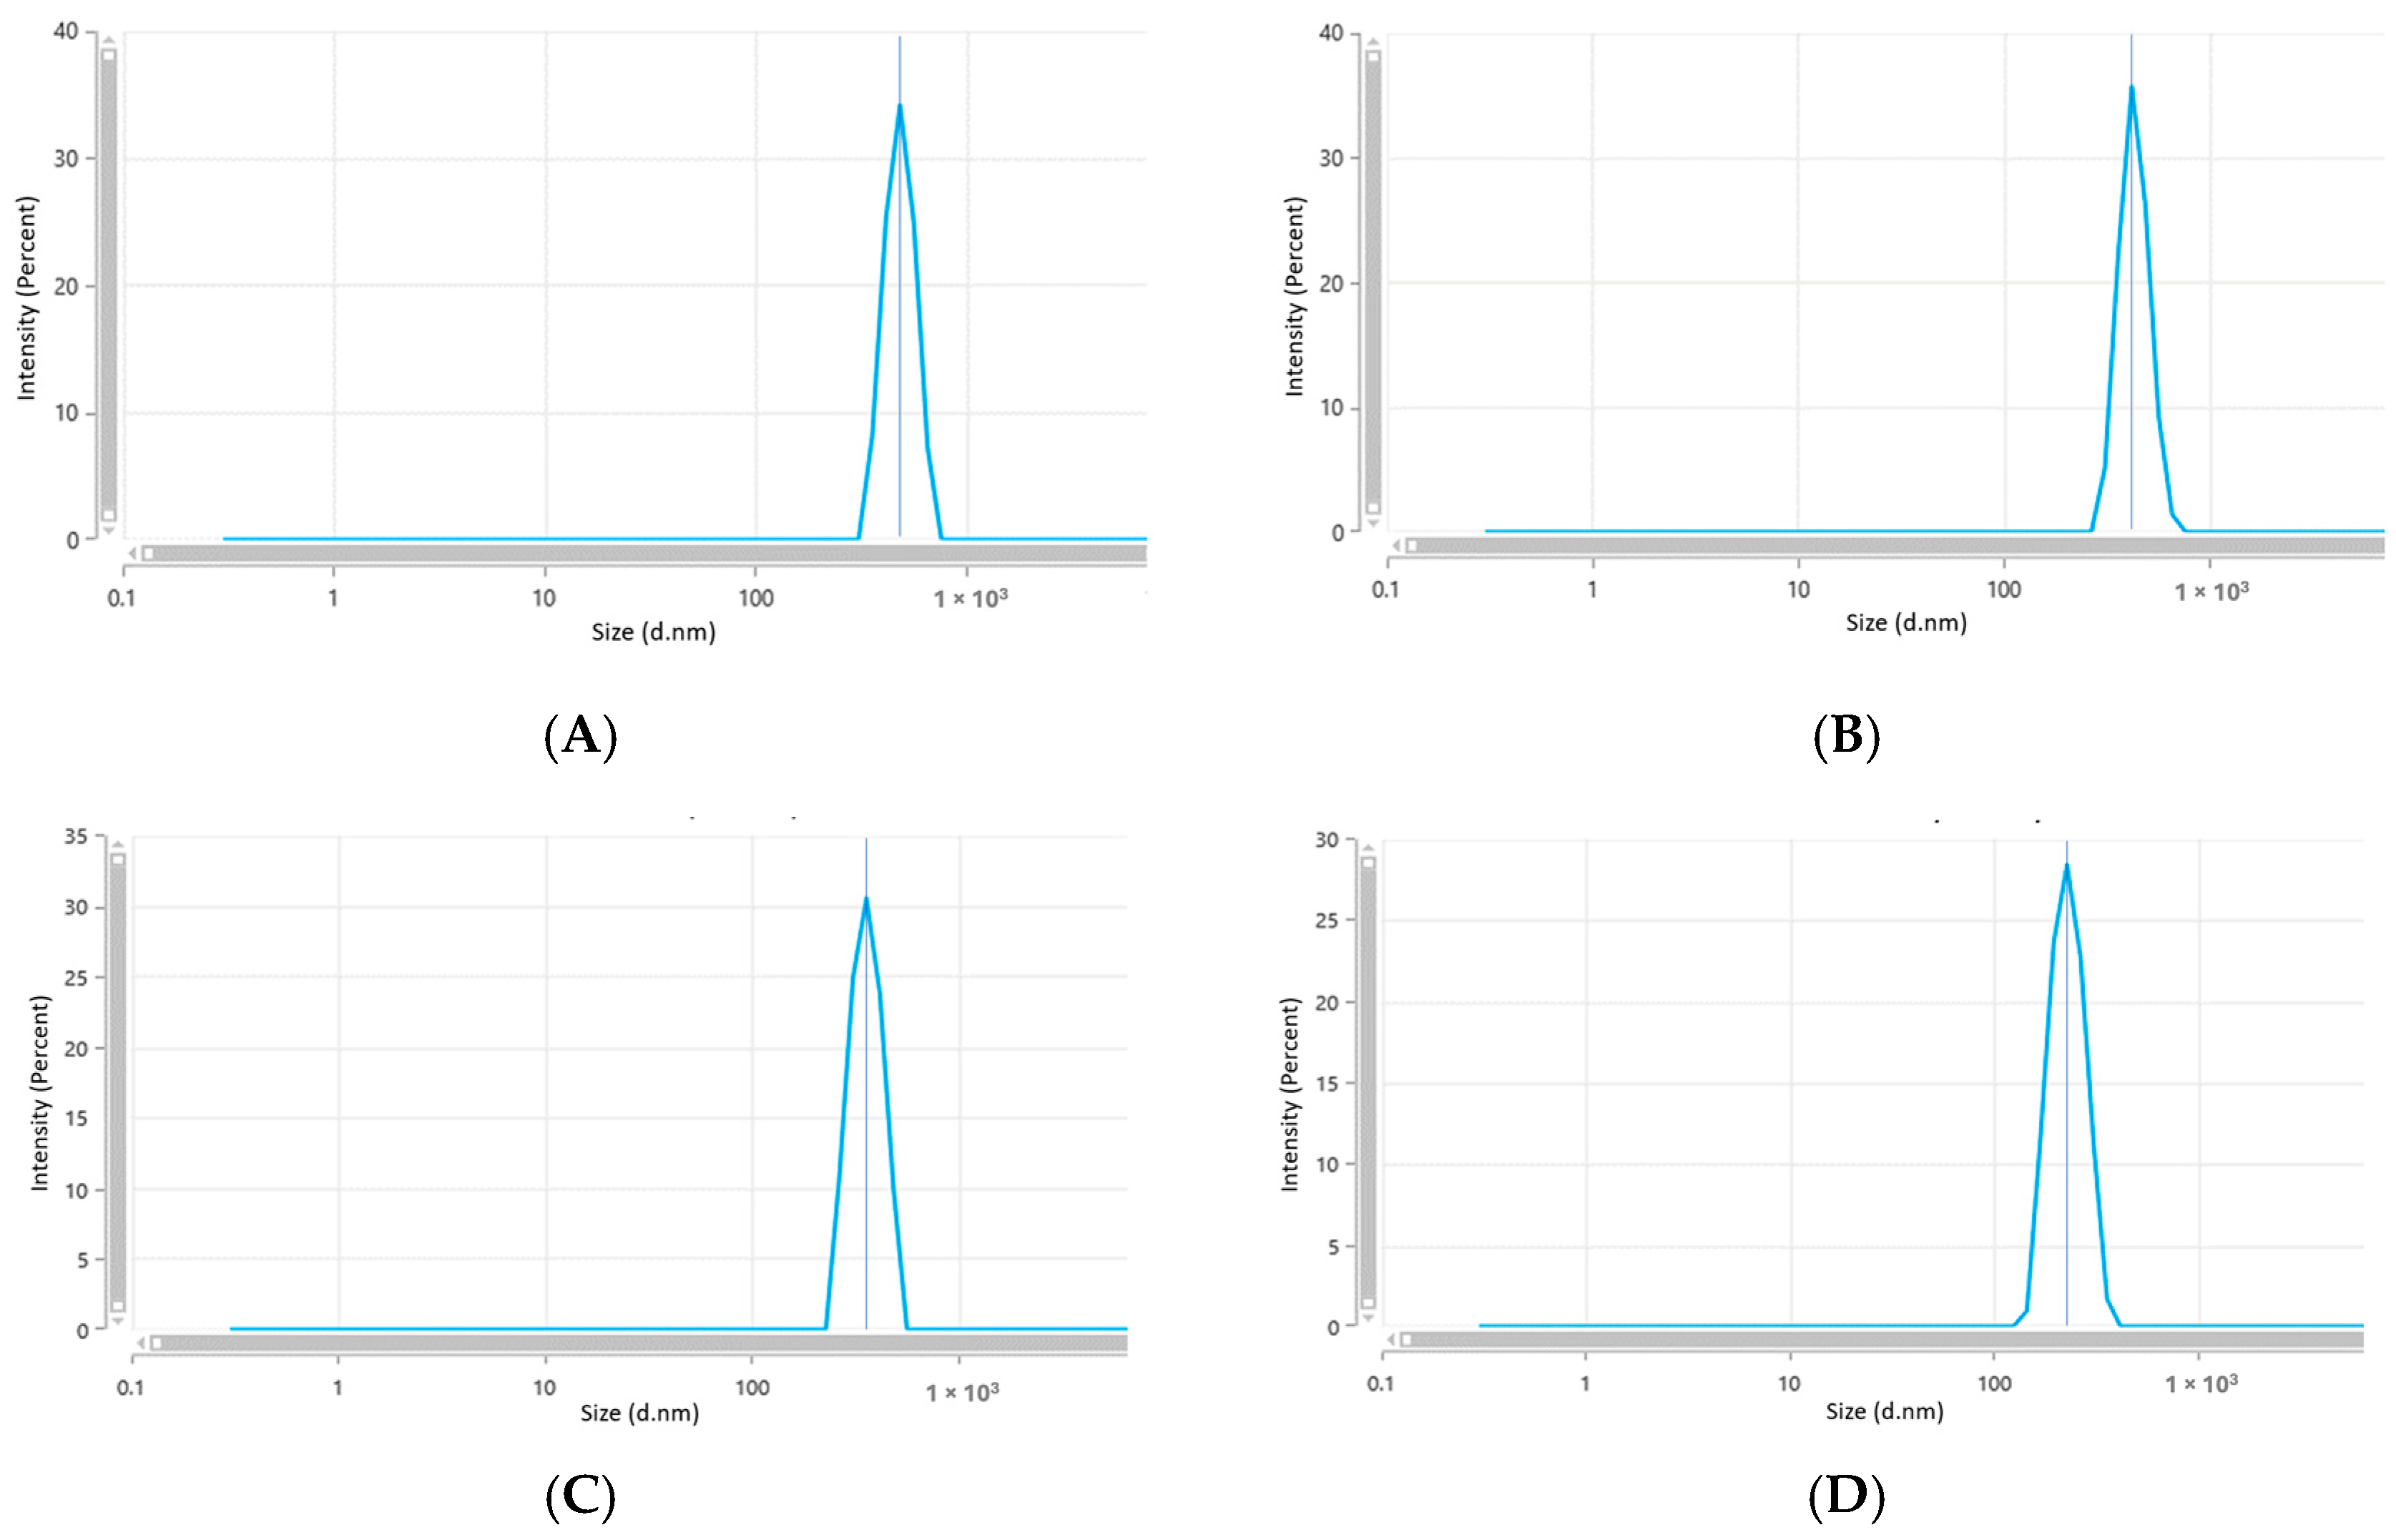
Figure 9.
Zeta potential distribution of the prepared ZnO NPs. (A) ZnO NPs (0.1 M); (B) ZnO NPs (0.07 M); (C) ZnO NPs (0.04 M); (D) ZnO NPs (0.01 M).
Figure 9.
Zeta potential distribution of the prepared ZnO NPs. (A) ZnO NPs (0.1 M); (B) ZnO NPs (0.07 M); (C) ZnO NPs (0.04 M); (D) ZnO NPs (0.01 M).

Figure 10.
(A) ATR-FTIR spectra of BPE and ZnO NPs; (B) ATR-FTIR spectra of Zn acetate and ZnO NPs.

Figure 11.
XRD pattern of the prepared ZnO NPs.
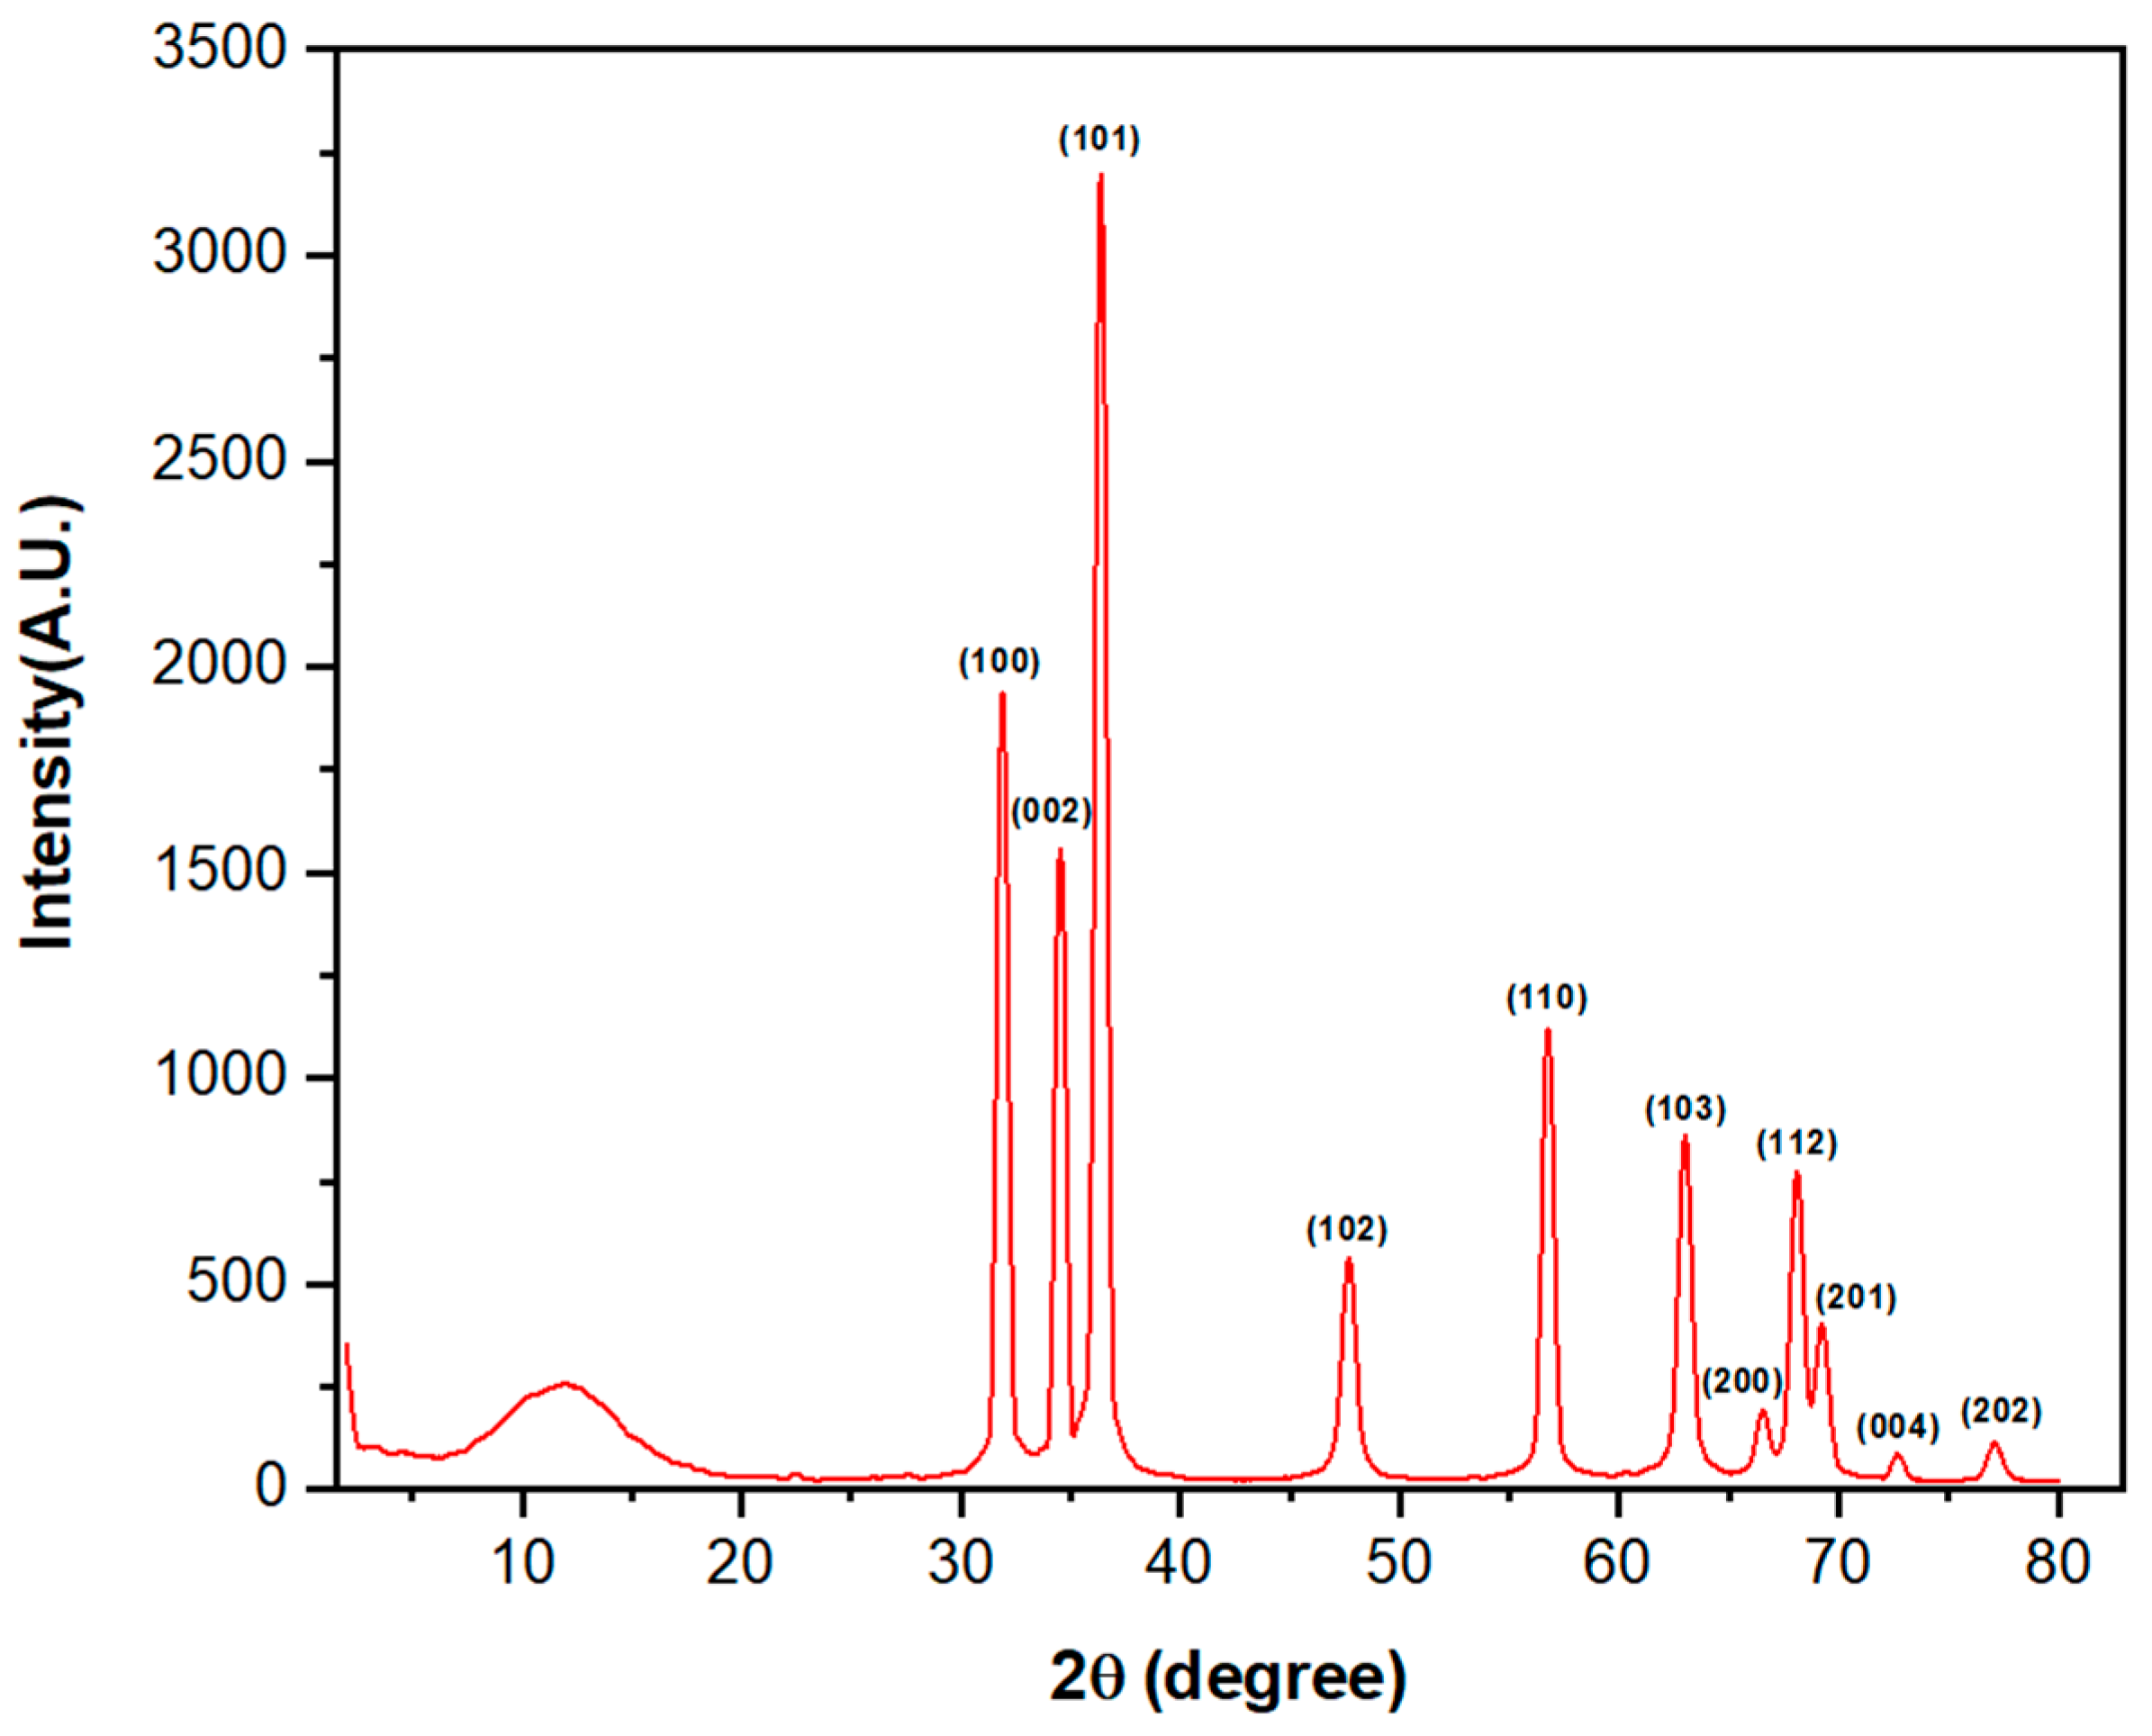
Figure 12.
Growth inhibition % of biosynthesized ZnO NPs against tested bacteria strains.


Table 1.
General phytochemical class tests and observations.
| Phytochemicals | Test | Result | Presence or Absence of Result | Figure |
|---|---|---|---|---|
| Flavonoids | Ammonia test | Pale brown color | + | Figure 3A |
| Glycosides | Glycosides test | Formation of an oil layer on the top | + | Figure 3B |
| Saponins | Emulsion test | Formation of a stable emulsion | + | Figure 3C |
| Froth test | Formation of stable froth | + | Figure 3D | |
| Phenols | Ferric chloride test | Dirty-green color | + | Figure 3E |
| Lead acetate test | Bulky white precipitate | + | Figure 3F | |
| Phlobatannins | Phlobatannins test | Red precipitate | + | Figure 3G |
(+): present.
Table 2.
Identified compounds in aqueous BPE and measured concentrations by LC/MS.
| Compound | Chemical Formula | Phytochemical Class | Molecular Wt. g/mol | Mass to Charge (m/z) | Retention Time (min) | Concentration (ppm) | Figure |
|---|---|---|---|---|---|---|---|
| Quercetin (3,3′,4′,5,7-pentahydroxyflavone) | C15H10O7 | Flavonol from the flavonoid group of polyphenols | 302.0342 | 301.0342 | 5.97 | 1.279 ± 0.086 | Figure A1 |
| Rutin (3′,4′,5,7-Tetrahydroxy-3-[α-L-rhamnopyranosyl-(1→6)-β-D-glucopyranosyloxy]flavone) | C27H30O16 | glycoside Flavonol from the flavonoid group of polyphenols | 610.1519 | 609.1447 | 4.77 | 5.877 ± 0.197 | Figure A2 |
| Catechin ((2R,3S)-2-(3,4-Dihydroxyphenyl)-3,4-dihydro-2H-chromene-3,5,7-triol) | C15H14O6 | flavonols from the flavonoid group of polyphenols | 290.0786 | 289.0713 | 4.11 | 0.476 ± 0.087 | Figure A3 |
| Ferulic acid ((2E)-3-(4-hydroxy-3-methoxyphenyl) prop-2-enoic acid) | C10H10O4 | flavonols from the flavonoid group of polyphenols | 194.0574 | 193.0501 | 4.61 | 1.068 ± 0.086 | Figure A4 |
| Caffeic acid (3,4-Dihydroxybenzeneacrylicacid) | C9H8O4 | Intermediate in the production of lignin | 180.0419 | 179.0346 | 4.19 | 5.446 ± 0.508 | Figure A5 |
| Vanillic acid (4-hydroxy-3-methoxybenzoic acid) | C8H8O4 | Intermediate in the production of vanillin from ferulic acid | 168.0419 | 167.0347 | 5.97 | 1.496 ± 0.263 | Figure A6 |
Table 3.
ZnO NP size range by SEM, band gap, and yield percentage.
| ZnO NPs Samples | Zn Acetate Conc. (M) | SEM Size Range (nm) | Band Gap (eV) | ZnO NPs Yield % |
|---|---|---|---|---|
| A | 0.1 | 89 ± 22 | 3.36 | 38.72 ± 1.56 |
| B | 0.07 | 83 ± 16 | 3.41 | 35.8 ± 0.87 |
| C | 0.04 | 45 ± 7 | 3.44 | 34.73 ± 0.66 |
| D | 0.01 | 27 ± 4 | 3.61 | 31.89 ± 0.72 |
Table 4.
Nanoparticle size range by DLS, zeta potential and PDI.
| ZnO NPs Samples | Size Range (nm) by DLS | Zeta Potential (mV) | PDI |
|---|---|---|---|
| A (0.1 M) | 609.5 ± 60.40 | −7.43 ± 0.35 | 0.694 ± 0.173 |
| B (0.07 M) | 554.7 ± 33.95 | −10.69 ± 20 | 0.618 ± 0.082 |
| C (0.04 M) | 435 ± 23.43 | −14.72 ± 0.77 | 0.253 ± 0.09 |
| D (0.01 M) | 278 ± 5.60 | −13.18 ± 1.15 | 0.28 ± 0.036 |
Table 5.
MIC and MBC of ZnO NPs and BPE against tested bacterial strains.
| Bacterial Strain | ZnO NPs | BPE | |
|---|---|---|---|
| MIC µg.mL−1 | MBC µg.mL−1 | MIC and MBC µg.mL−1 | |
| S. aureus ATCC no. 25913 | 500 | 500 | N.D. |
| S. epidermidis ATCC no. 12228 | 500 | 500 | N.D. |
| E. coli ATCC no. 25922 | 500 | N.D. * | N.D. |
| P. aeruginosa ATCC no. 27853 | 600 | N.D. | N.D. |
* N.D.; Not detected.
Table 6.
Recent studies of ZnO NPs compared their synthesis method, characterizations, and potential antibacterial effects.
Table 6.
Recent studies of ZnO NPs compared their synthesis method, characterizations, and potential antibacterial effects.
| Plant Used | Extract Type | Method | Particle Size | Potential Therapeutic Effect | MIC | MBC | Microorganism Strains | Bacterial Conc. (CFU/mL) | Annealing | Reference |
|---|---|---|---|---|---|---|---|---|---|---|
| Eriobotrya japonica leaves | Aqueous | Green | 13.4 nm by XRD | Antibacterial | 364–194 μg/mL | Not stated | E. coli, P. multocida, B. subtilis and S. aureus | 5.0 × 10⁶ | calcined at 300 °C for 2 h | [62] |
| Prosopis farcta fruit | Aqueous | Green | 40–50 nm | Antifungal | 64 µg/mL | 512 µg/mL | C. parapsilosis and C. albicans | 1.0 × 10⁵ | calcined at 500 °C, 600 °C, and 700 °C | [63] |
| Flower of Nyctanthes arbor-tristis | Aqueous | Green | 12–32 nm | Antifungal | 128–16 μg/mL | Not stated | A. alternata, A. niger, B. cinerea, F. oxysporum, P. expansum | 1.0 × 10⁵ | Not conducted | [13] |
| Banana peel | Aqueous | Green | 27 ± 4 nm by SEM | Antibacterial | 500–600 μg/mL | 500 μg/mL | S. aureus S. epidermidis E. coli P. aeruginosa | 6.0 × 10⁶ | 400 °C for 2 h | Current study |
| Banana peel | Aqueous | Green | 20–40 nm | Antibacterial | one concentration used only 250 μg/mL | Not stated | P. aeruginosa, S. aureus, Candida albicans | 1.5 × 10⁶ | Not conducted | [24] |
| Date seed and Banana peel | Aqueous | Green | 72.6–54.4 nm | Antibacterial activity | 750 µg/mL | 3000–1500 µg/mL | E.coli, Salmonella enteritidis, B. subtilis, S. aureus | 5.0 × 10⁵ | Not conducted | [64] |
| Banana peel | Aqueous | Green | Nanosheet length 345.61 nm, width 81.22 nm | Antibacterial activity and anti-cancer activity | IC50 of 0.1 M = 11,810 µg/mL, IC50 of 0.2 M = 11,920 µg/mL | Not stated | B. subtilis, S. epidermidis, E.coli, Enterobacter aerogenes | 1.0 × 10⁶ | Not conducted | [26] |
| Artabotrys hexapetalu, Bambusa vulgaris | Aqueous | Green | 33–24 nm by XRD | antibacterial activity-Zone inhibition | Not stated | Not stated | Streptococcus Serratia | Not stated | calcination at 500 °C for 3 h | [65] |
| Mango and Soursop Leaf | Aqueous | Green | 23–17 nm | Not stated | Not stated | Not stated | Not stated | Not stated | 400 °C-3 h | [12] |
| Cherry fruit | Aqueous | Green | 20.18 nm | Not stated | Not stated | Not stated | Not stated | Not stated | Not conducted | [31] |
| Phoenix Dactylifera L. leaves | Aqueous | Green | 19.77–26.28 nm | Not stated | Not stated | Not stated | Not stated | Not stated | 450 °C-3 h | [14] |
| Laurus nobilis L. leaves | Aqueous | Green | 21.49, 25.26 nm | Not stated | Not stated | Not stated | Not stated | Not stated | Not conducted | [15] |
| Nephelium lappaceum L. peels | Aqueous | Green | 20 nm by XRD | Not stated | Not stated | Not stated | Not stated | Not stated | 450 °C | [66] |
| Hibiscus rosa-sinensis | Aqueous | Green | 30–35 nm | Not stated | Not stated | Not stated | Not stated | Not stated | Not conducted | [67] |
| Plant not used | Extract not used | Chemical method | 47–33 nm | Antibacterial activity of ZnO and Nd doped ZnO NPs | 800 µg/mL | 800 µg/mL | E. coli, K. pneumoniae | Not stated | 700 °C for 5 h. | [68] |
| Plant not used | Extract not used | Commercial ZnO-NPs | Not stated | Antibacterial Activity | 1000–8000 µg/mL | 4000, 8000, 16,000 µg/mL | E. coli, K. pneumoniae, P. aeruginosa | 2.5 × 10⁵ | Not conducted | [69] |
| Plant not used | Extract not used | Chemical method | 50 nm | Antibacterial activity | 1250, 625, 1250, 156 μg/mL | 1250, 2500, 5000, 312.5 μg/mL | E. coli, S. epidermidis, S. aureus, P. aurugenosa | 1.0 × 10⁸ | Not conducted | [70] |
| Plant not used | Extract not used | Commercial ZnO-NPs | 50−70 nm | Antibacterial activity | 1200–80 μg/mL | Not stated | S. aureus, S. epidermidis, Streptococcus pyogenes, E. coli | Not stated | Not conducted | [71] |
Table 7.
General comparison between traditional and green synthesis methods for NP production.
| Comparison Aspect | Traditional Methods | Green Synthesis |
|---|---|---|
| Environmental Impact | Frequently entail the utilization of hazardous chemicals, solvents, and reducing agents. Produce substantial quantities of dangerous waste [73]. | Utilize natural, renewable, and non-toxic materials as reducing agents. Minimize the production of potentially dangerous waste [73]. |
| Energy Consumption | High temperatures, pressures, and extended reaction times are necessary, resulting in elevated energy consumption and the release of greenhouse gas emissions [74]. | Operate under milder reaction conditions, often at ambient temperatures and atmospheric pressure, resulting in lower energy requirements [75]. |
| Cost-Effectiveness | The high costs are attributed to the use of costly reagents, energy-intensive procedures, and restrictive waste management regulations [76]. | Utilize inexpensive and readily available biological materials as reducing and capping agents. Eliminate costly purification steps and reduce energy consumption [77]. |
| Product Quality and Purity | The production of nanoparticles results in the formation of particles that have a high level of purity and a consistent size distribution. However, it is possible for these particles to contain trace amounts of hazardous compounds or by-products, which can have an impact on their characteristics [3]. | The nanoparticles could show differences in both particle size and morphology, nevertheless, they demonstrate excellent biocompatibility and less toxicity [3]. |
| Regulatory Compliance | Concerns related to regulations governing occupational safety, waste disposal, and environmental protection arise from the use of hazardous chemicals. Compliance necessitates costly measures [78]. | Align well with emerging regulatory frameworks promoting sustainable manufacturing practices. Facilitate easier compliance with regulatory requirements [78]. |
Disclaimer/Publisher’s Note: The statements, opinions and data contained in all publications are solely those of the individual author(s) and contributor(s) and not of MDPI and/or the editor(s). MDPI and/or the editor(s) disclaim responsibility for any injury to people or property resulting from any ideas, methods, instructions or products referred to in the content. |
© 2024 by the authors. Licensee MDPI, Basel, Switzerland. This article is an open access article distributed under the terms and conditions of the Creative Commons Attribution (CC BY) license (https://creativecommons.org/licenses/by/4.0/).
Share and Cite
MDPI and ACS Style
Al-Khaial, M.Q.; Chan, S.Y.; Abu-Zurayk, R.A.; Alnairat, N. Biosynthesis and Characterization of Zinc Oxide Nanoparticles (ZnO-NPs) Utilizing Banana Peel Extract. Inorganics 2024, 12, 121. https://doi.org/10.3390/inorganics12040121
AMA Style
Al-Khaial MQ, Chan SY, Abu-Zurayk RA, Alnairat N. Biosynthesis and Characterization of Zinc Oxide Nanoparticles (ZnO-NPs) Utilizing Banana Peel Extract. Inorganics. 2024; 12(4):121. https://doi.org/10.3390/inorganics12040121
Chicago/Turabian StyleAl-Khaial, Mohammed Qahtan, Siok Yee Chan, Rund A. Abu-Zurayk, and Nour Alnairat. 2024. "Biosynthesis and Characterization of Zinc Oxide Nanoparticles (ZnO-NPs) Utilizing Banana Peel Extract" Inorganics 12, no. 4: 121. https://doi.org/10.3390/inorganics12040121
Note that from the first issue of 2016, this journal uses article numbers instead of page numbers. See further details here.