Article

Design and Construction of a Mixed-Ligand Coordinated Fluorescent Complex and Its Application for Sensing Ions, Antibiotics, and Pesticides in Aqueous Solution

1
Key Laboratory of Urban Agriculture in North China, Ministry of Agriculture P.R. China, College of Bioscience and Resources Environment, Beijing University of Agriculture, Beijing 102206, China
2
CAS Key Lab of Colloid, Interface and Chemical Thermodynamics, Institute of Chemistry, Chinese Academy of Sciences, Beijing 100190, China
3
State Key Laboratory of Advanced Technology for Materials Synthesis and Processing, Wuhan University of Technology, Wuhan 430070, China
4
Research School of Chemical and Biomedical Technologies, National Research Tomsk Polytechnic University, Lenin Avenue 30, 634050 Tomsk, Russia
*
Authors to whom correspondence should be addressed.
Inorganics 2024, 12(4), 93; https://doi.org/10.3390/inorganics12040093
Submission received: 19 January 2024 / Revised: 19 March 2024 / Accepted: 20 March 2024 / Published: 22 March 2024
(This article belongs to the Special Issue Feature Papers in Organometallic Chemistry 2024)

Abstract

:
In this work, a fluorescent complex [Zn(NTD)2(DTP)2(H2O)2]·(H2O)0.8 (Complex Zn), (H2NTD = 1,4-naphthalenedicarboxylic acid and DTP = 3,5-di(1,2,4-triazol-1-yl)pyridine) was synthesized. The fluorescent complex was characterized by single-crystal X-ray diffraction, powder X-ray diffraction, and thermogravimetric, elemental, infrared spectroscopy, and fluorescence analyses. In the fluorescence sensing tests, Complex Zn exhibited excellent fluorescence quenching efficiency towards Fe3+, MnO4, Cr2O72−, nitrofurantoin, and imidacloprid in aqueous media. A mechanism investigation suggested that the fluorescence quenching caused by the quenchers toward the sensor was due to the inner filter effect and the fluorescence resonance energy transfer effect in the fluorescent sensing process.

Graphical Abstract

1. Introduction

In association with the rapid development of the industrial, agricultural, and pharmaceutical industries, the amounts of various pollutants in the environment have increased, causing a severe threat to human health and ecosystems [1,2,3]. Inorganic ions are widely present in the wastewater generated during mineral and metal refinement, usually as persistent pollutants, with some even considered carcinogenic [4,5]. An excess intake of these pollutants may cause disruption and damage to the human body [6]. As organic pollutants, the residues of pesticides and antibiotics in the environment have always attracted tremendous attention in pollution monitoring [7]. The use of pesticides is beneficial for crops during agricultural production [8]. However, the leaching of excess pesticides from agricultural land to surface water bodies may damage the aquatic ecosystem balance [9].
Similarly, antibiotics are typical poisonous organic pollutants. High levels of antibiotic residues in the environment may lead to the breeding of “super-bacteria”, with possible sources including waste from the pharmaceutical industry and sewage from poultry or livestock production farms [10,11,12,13]. Currently, the detection methods for antibiotic residues generally include atomic absorption spectrometry [14], gas chromatography [15], high-performance liquid chromatography [16], ion mobility spectrometry [17], and liquid chromatography–tandem mass spectrometry [18]. These methods are limited by their high operating costs, area requirements, and expensive instruments, and they are time-consuming [19]. Consequently, it is urgent to develop a new detection method based on fluorescent substance sensing with a fast response, low cost, and ease of operation for different pollutants [20].
Metal complexes are molecular compounds that combine a central metal ion and one or more ligands through coordination bonds [21]. The ligand’s type and structure significantly influence its physical and chemical properties [22]. Nitrogen heterocyclic organic ligands and carboxylic-group-bearing ligands have been intensively studied in coordination chemistry because of their flexible coordination pattern and easy combination with metal ions to form complexes [23]. As metal complexes combine the advantages of both inorganic and organic fluorescent materials, the remarkable optical properties of their metal centers and organic ligands allow their structures to be designed, modified, and adapted to achieve the recognition of specific ions and molecules, making them a new type of multifunctional fluorescent material [24,25]. Metal complexes have been widely used to detect various organic/inorganic pollutants [6,26]. So far, metal complexes have shown fascinating applications in environmental pollution detection and have exhibited excellent fluorescence properties [27,28]. We believe that metal complexes will produce excellent results in environmental detection.
In this work, a Zn-based mixed-ligand coordinated fluorescent complex was designed and built, namely, Complex Zn, with the formula [Zn(NTD)2(DTP)2(H2O)2]·(H2O)0.8 (H2NTD = 1,4-naphthalene dicarboxylic acid and DTP = 3,5-di(1,2,4-triazol-1-yl)pyridine). The complex was characterized by means of infrared spectroscopy and thermogravimetric analysis (TGA), elemental analysis, powder X-ray diffraction (PXRD) analysis, single-crystal X-ray diffraction (SCXRD) analysis, and fluorescence measurements. Then, fluorescent sensing tests were conducted to examine Complex Zn’s performance in the sensing of anions, cations, antibiotics, and pesticides. The fluorescent sensing tests indicated that Complex Zn was effective, sensitive, and selective in sensing Fe3+, MnO4, and Cr2O72−. For the sensing of pesticides and antibiotics, the sensor’s highest quenching efficiency was reached using nitrofurantoin (NFT) and imidacloprid (IMI). The inner filter effect (IFE) and fluorescence resonance energy transfer (FRET) play a crucial role in the complex’s fluorescence quenching in the presence of ions, pesticides, and antibiotics.

2. Experimental Section

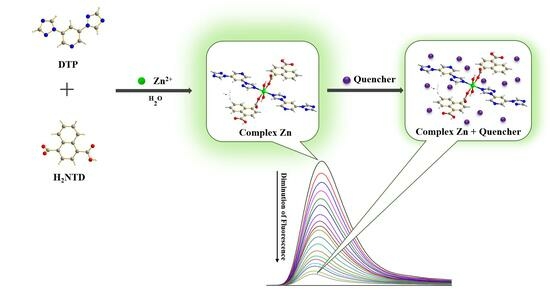
2.1. Synthesis of Complex Zn

ZnSO4·7H2O (2 eq., 13.5 mg, 0.047 mmol), KOH (0.5 eq., 0.5 mg, 0.011 mmol), DTP (1 eq., 5.0 mg, 0.024 mmol), H2NTD (1 eq., 5.2 mg, 0.024 mmol), and H2O were placed in a stainless-steel autoclave equipped with a Teflon liner (25 mL). Next, the mixture was kept at 120 °C for 72 h; thereafter, the mixture was cooled to r.t. Furthermore, the colorless crystals were filtrated and washed with deionized water. After drying in air, a solid crystalline material was obtained (13.7 mg, yield: 60%). The crystal suitable for X-ray diffraction was acquired from the synthesis procedure. Elemental analysis calcd. (%) for C42H33.6N14O10.8Zn (wt%): C, 51.82; H, 3.45; N, 20.15; found: C, 51.76, H, 3.10, N, 20.15; IR (neat, ν/cm−1): 3855(w), 3736(s), 3650(s), 3117(s), 1684(m), 1604(s), 1541(s), 1507(s), 1457(m), 1407(s), 1375(s), 1282(m), 1237(m), 1131(m), 991(s), 881(s), 779(s), 682(s), 669(w), 553(w).

2.2. Analyte Quenching Test

Before the fluorescent sensing test, well-mashed Complex Zn was ultrasonically suspended for 30 min in water at a concentration of 0.2 mg/mL. Meanwhile, the analytes’ aqueous solutions were then prepared at a concentration of 2 mM (the ions) and 0.2 mM (the pesticides and the antibiotics). During a typical florescent sensing process, the prepared sensor’s suspension and the analytes’ solution were mixed in equal volume and injected into a cuvette. The fluorescent spectra of the sensor with or without the presence of the analyte were excited with a wavelength of 259 nm.
The employed analytes include various cations (2 mM): MCl1–3 (M = Cd2+, Fe3+, Cr3+, Mn2+, Ba2+, Al3+, Na+, Pb2+, Ca2+, Zn2+, Ni2+, Co2+, Cu2+, Mg2+, and K+); different anions (2 mM): K1–2X (X = Ac, B4O72−, Br, Cl, ClO3, ClO4, CO32−, Cr2O72−, F, HPO42−, H2PO4, I, SCN, SO32−, SO42−, MnO4, and NO3); selected antibiotics (0.2 mM) (Table S3): lactams (amoxicillin, AML; cefixime, CFX; benzylpenicillin potassium, PK; penicillin V potassium, PVK), amino-glycosides (streptomycin, SM; gentamycin, GTM; tobramycin, TOB; karnamycin, KNM), chloramphenicol drugs (thiamphenicol, TAP; chloramphenicol, CAP), macrolides (roxithromycin, ROX; azithromycin, AZM), nitrofurans (nitrofurantoin, NFT; nitrofurazone, NFZ), nitromidazoles (1,2-dimethyl-5-nitro-imidazole, DMZ; metronidazole, MNZ), and sulfonamides (sulphamethazine, SMZ); selected pesticides (0.2 mM) (Table S4): 2,4-dichlorophenoxyacetic acid, 2,4-D; imazalil, IMZ; immidacloprid, IMI; pentachloro-nitrobenzene, PCNB; thiophanate-methyl, TPM; glyphosate, GLY; nitenpyram, NTP; dipterex, DIP; chlorothalonil, TPN; carbendazim, CAR; and metamitron, MMT.

2.3. Fluorescence Kinetic Titration

The kinetic titration of the analytes was performed in two different ways. In a typical experiment on the titrated sensing of ions or pesticides, 8.0 mg of finely ground Complex Zn was added to 40 mL of distilled water, and the resulting suspension was ultrasonicated for 30 min. Meanwhile, solutions containing different concentrations of ions (20 mM) or pesticide (5 mM) were prepared. Thereafter, in each sensing experiment, a 2 to 10 µL aliquot from the reservoir of the analyte was added and vortexed with the aqueous Complex Zn suspension (4 mL). Finally, the fluorescence spectrum of the mixture was recorded to determine the performance of the sensor.
For the sensing of NFT, a series of analyte stock solutions were prepared at various concentrations (0, 0.001, 0.005, 0.010, 0.020, 0.040, 0.050, 0.060, 0.080, 0.090, 0.100, 0.200, 0.300, 0.400, 0.500, and 0.600 mM). The fluorescence spectrum was analyzed after mixing equal volumes of the analyte solution with the Complex Zn suspension (0.2 mg/mL).

2.4. Recyclability Experiments

The recyclability of Complex Zn for fluorescence analysis was investigated. During the experiments, the fluorescence of the sensor was recorded, and the Complex Zn suspension was then collected by means of centrifugation and washed several times with deionized water. Thereafter, the fluorescence spectrum of the regenerated solid material was recorded. This procedure was repeated four more times.

2.5. pH Stability Test

The acid and alkali resistance of Complex Zn was determined by adding 50 mg of ground Complex Zn to 1000 mL of NaOH or HCl solution of pH 6–10 and leaving it to soak for 12 h. The Complex Zn crystals were filtered out and left at room temperature for 6 h, then characterized by means of PXRD analysis.

3. Results and Discussion

3.1. Structural Description of Complex Zn

The structural configuration of Complex Zn was revealed by means of SCXRD analysis. The result showed that Complex Zn crystallized in the trigonal space group of Pī (No. 2) (Table S1). The crystallographic asymmetric unit of Complex Zn contains one-half Zn(II) ions, one disordered DTP (with occupancies at 0.5 and 0.5, respectively), one coordination water molecule, 0.40 lattice water molecules, and one disordered monodeprotonated HNTD ligand (with major and minor occupancies at 0.8 and 0.2, respectively) (Figure 1a). The Zn(II) ion is six-coordinated by two water molecules, two DTPs, and two HNTD ligands, and the center ion displays an octahedral geometry (Figure 1b). Finally, along the b-axis, the cascade layers of Complex Zn are connected by additional strong and weak hydrogen atoms and π···π to form a lattice structure (Figure 1c). All the ligands are monocoordinated with the Zn(II) center, enabling the formation of the Complex Zn organometallic molecule. In addition, π···π stacking interactions and hydrogen bonds enable Complex Zn molecules to build up three-dimensional (3D) supramolecular architectures. The DTP and HNTD ligands alternatively stack with each other along the a-axis via the interactions of Cg(1)···Cg(2)#1, Cg(1)···Cg(3)#1, Cg(4)···Cg(3)#1, Cg(1)···Cg(2)#2, Cg(1)···Cg(3)#2, and Cg(4)···Cg(3)#2. Together with π···π interactions, the hydrogen bonding of O1W-H1WB···O2#3 and weak hydrogen bonds of C9-H9···O2#4, C13-H13···N7#5, and C20-H20···O1#1 allow the molecules to form a supramolecular 2D structure in the aob plane. Finally, the adjacent sheets pile on top of each other with O3-H3···N4#6 hydrogen bonds in the crystallographic direction of the 3D c-axis to build up the 3D supermolecule. Cg(1), Cg(2), Cg(3), and Cg(4) denote the centers of rings of N4-C16-C15-C19-C18-C17, C2-C3-C4-C5-C6-C7, C6-C7-C8-C9-C10-C11, and N1-C13-N2-N3-C14, respectively. As follows, #1: x, 1 + y, z; #2: 1 + x, 1 + y, z; #3: 1 + x, y, z; #4: −x, −y, 1 − z; #5: x, −1 + y, z; #6: 1 − x, 1 − y, 2 − z. Selected bond lengths and angles data for Complex Zn are listed in Table S2.

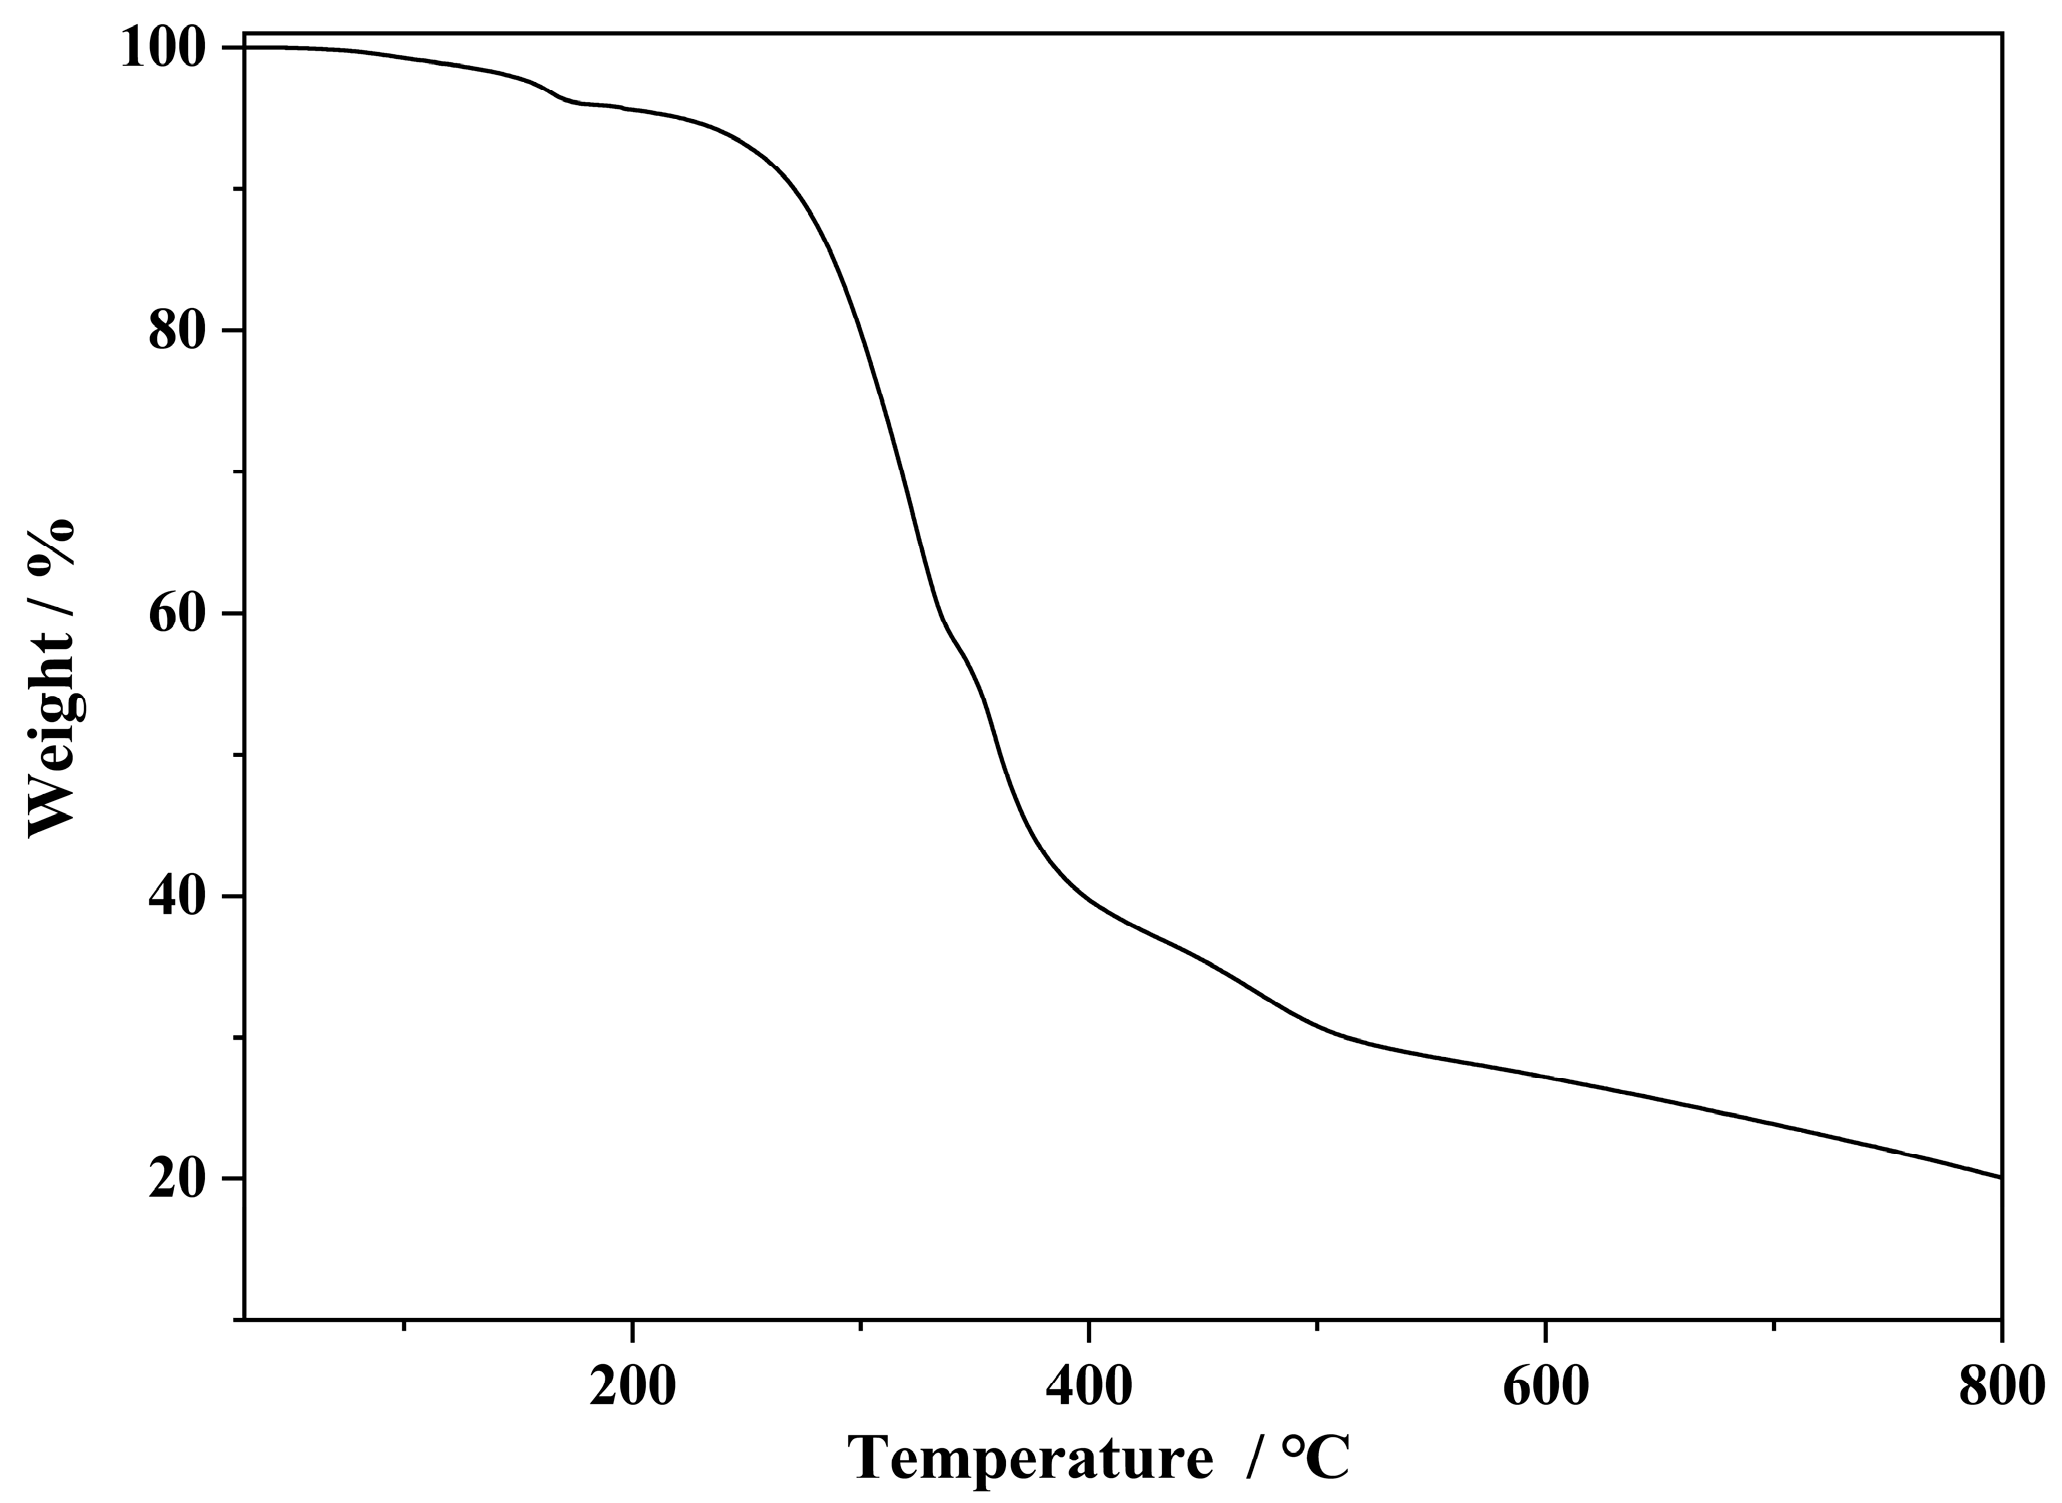
3.2. PXRD, FT-IR, and TGA

PXRD was employed to identify the phase purity of Complex Zn before the photofluorescence measurements. As shown in Figure S1, the simulated PXRD profile agreed with the measured one, which confirmed the high phase purity of the synthesized sample. The FT-IR spectrum of Complex Zn is shown in Figure S2. The peak at 1684 cm−1, attributed to the stretching vibration of carbonyl(-COOH), remained in the IR spectrum of Complex Zn [29], which proved the presence of free carboxylic acid and can be explained by the incomplete deprotonation of H2NTD in the process of Complex Zn formation. An absorption peak appeared at 1541 cm−1, which was attributed to the stretching vibrations of C=N bonds in the DTP [30], and additional peaks appeared at 1604 and 1375 cm−1, which were attributed to C=O asymmetric and symmetric telescopic vibrations [31], respectively.
The thermodynamic stability of the complex was assessed from room temperature to 800 °C (10 °C·min−1) under an atmosphere of N2. As shown in Figure 2, the first weight reduction for Complex Zn from room temperature to 182 °C was 4.5% (calculated: 4.2%), which is equivalent to the loss of coordination and lattice water molecules. A sudden drop in sample weight at 250 °C was noticed, which was due to structural decomposition.

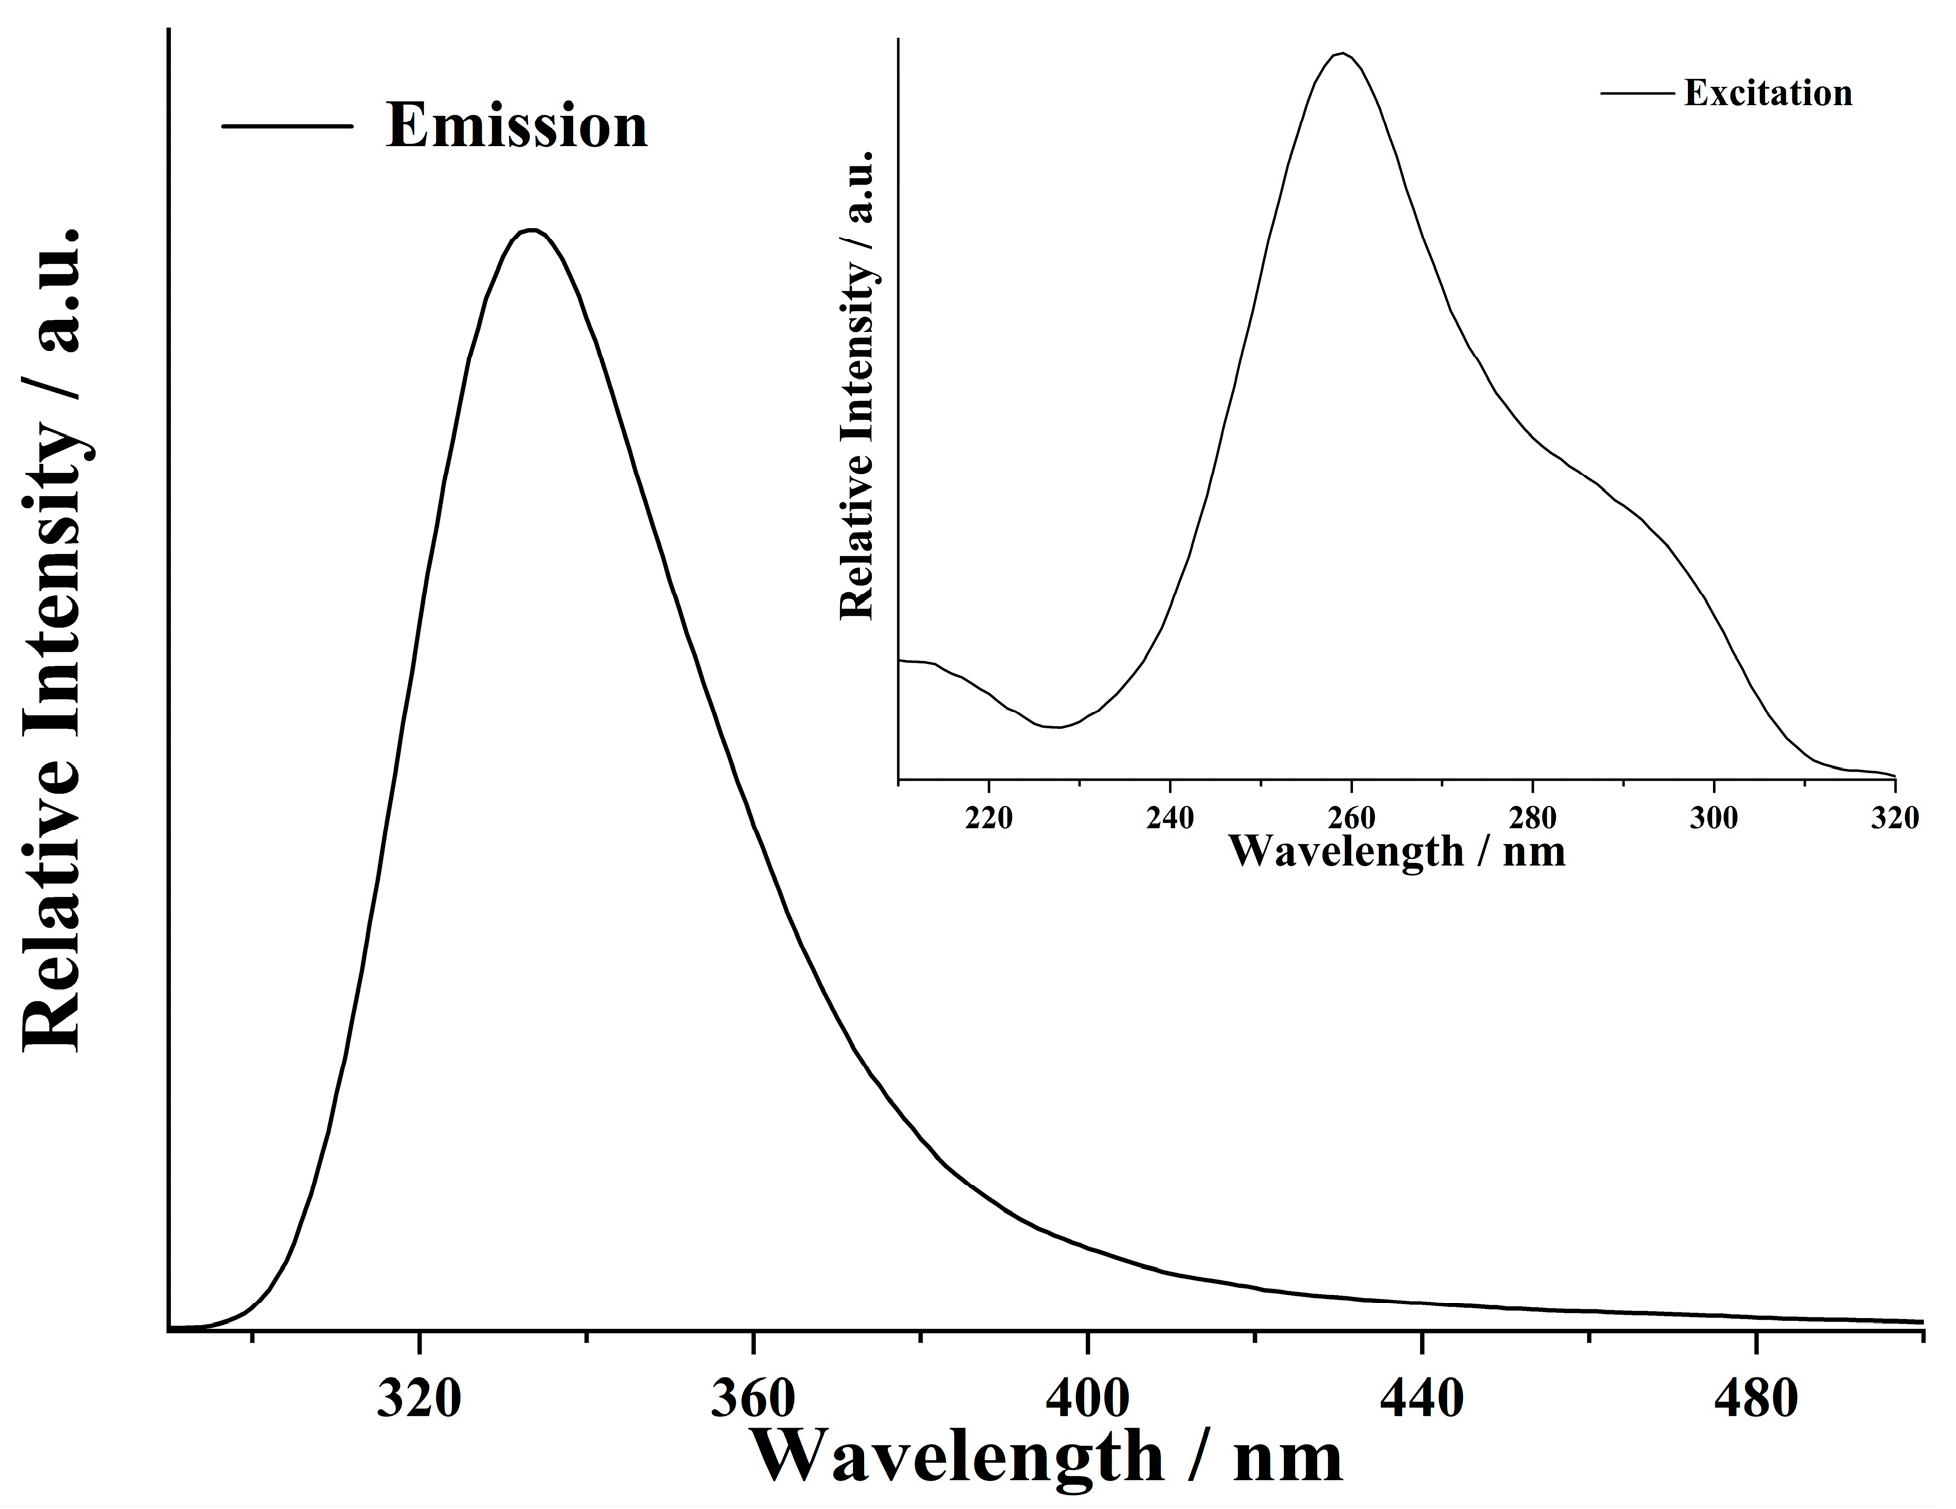
3.3. Fluorescence of the Complex
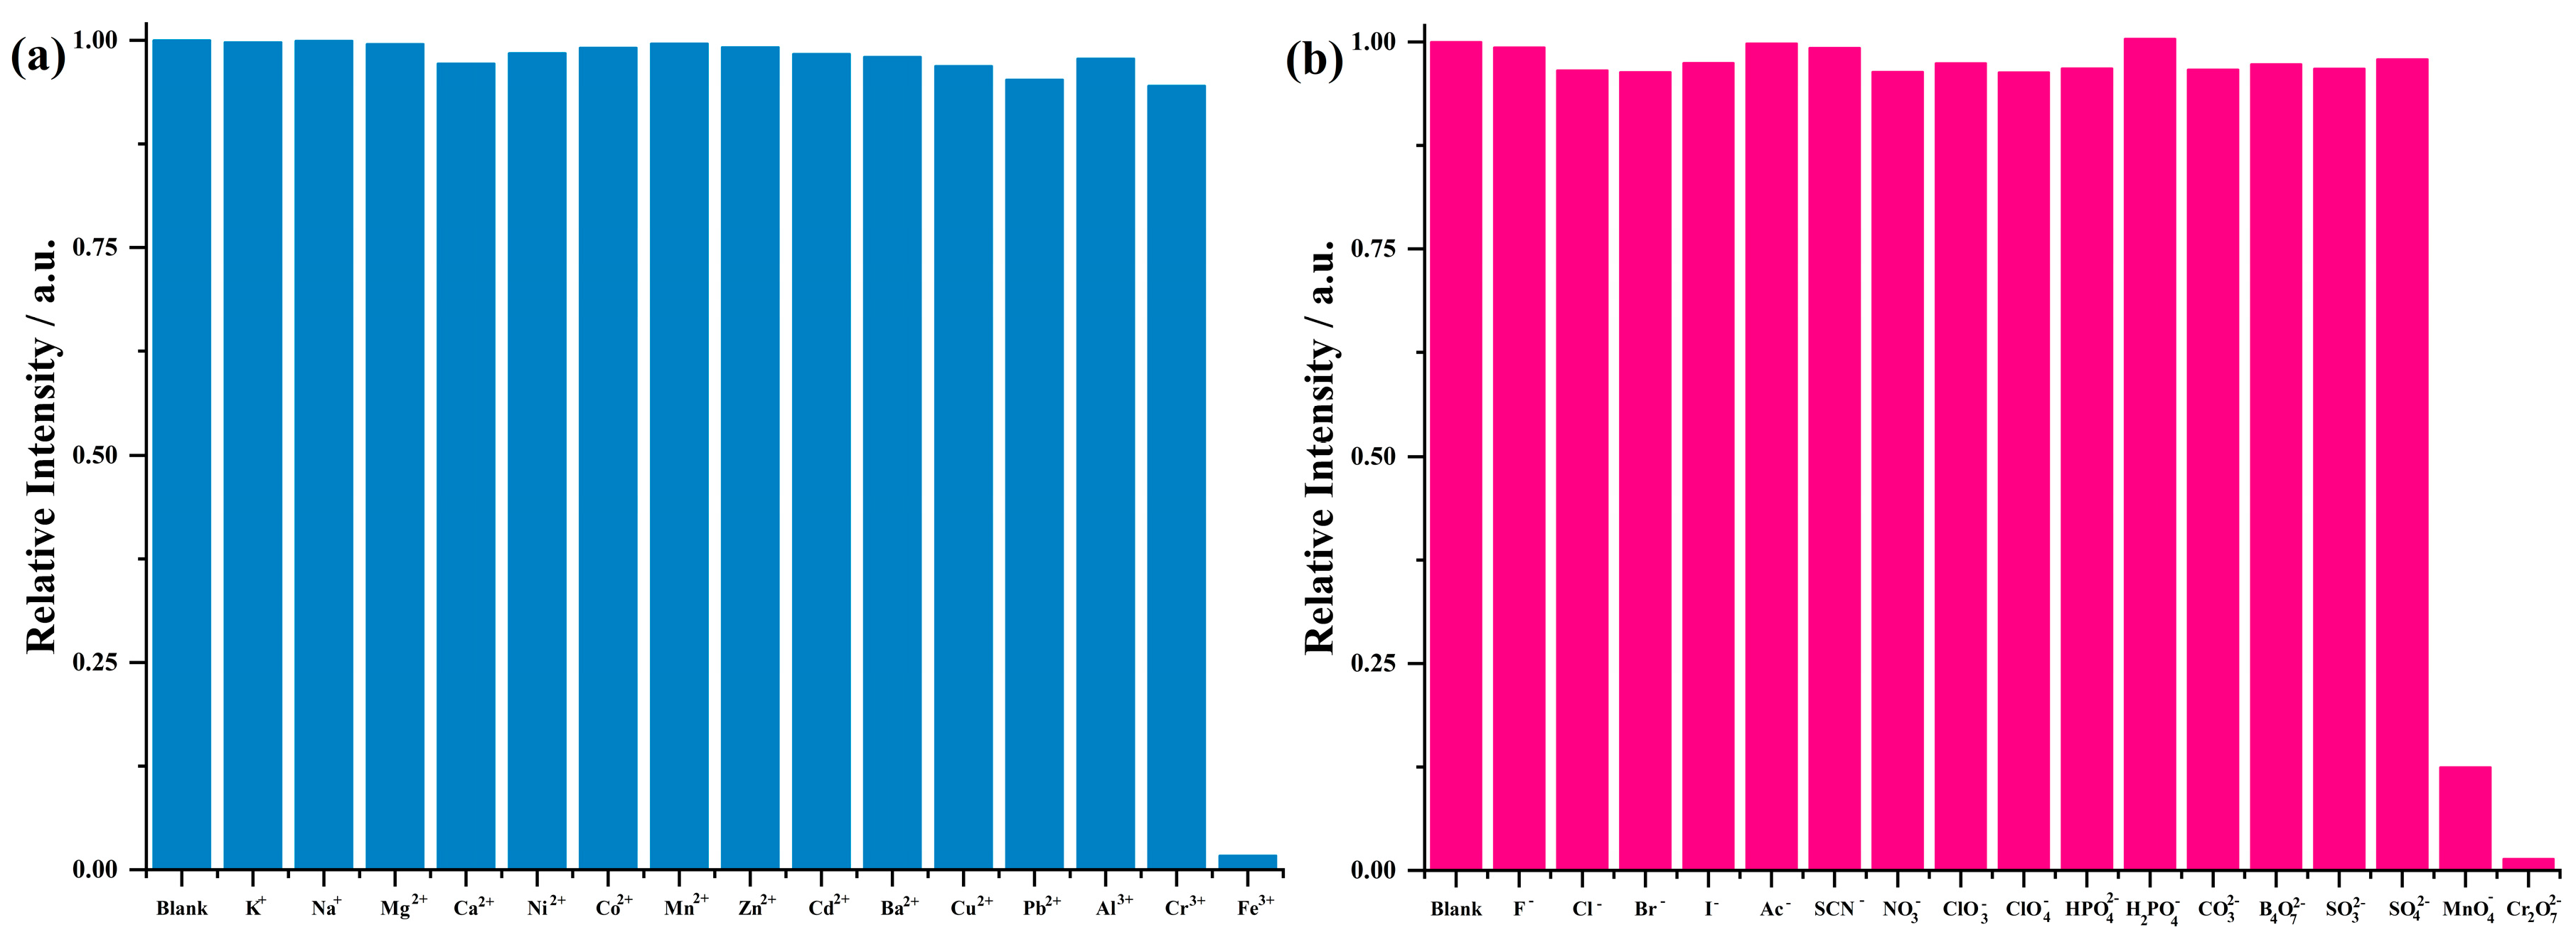
Complexes consisting of d10 metals containing organic linkers with N or carboxylic-containing groups have been widely exhibited as potential fluorescent materials [32]. As depicted in Figure 3, the fluorescence of suspended Complex Zn was investigated; the apex of its emission profile appeared at 333 nm upon excitation at 259 nm. The fluorescence of Complex Zn may be attributed to the intraligand ππ* or nπ* transition inside the DTP ligand [30]. The fluorescence of Complex Zn is further characterized in the ESI results presented in Table S3 [33,34,35,36,37].

3.4. Ionic Sensing

Before the sensing experiments, as-synthesized samples of Complex Zn (10 mg) were fully dispersed and soaked in 50 mL of H2O with ultrasonic treatment to obtain the suspensions used to evaluate the sensing abilities of Complex Zn. Different ionic solutions were prepared at a concentration of 2 mM. During the sensing experiment, the analyte solution (1.5 mL) was mixed with the complex suspension (1.5 mL) and subjected to fluorescence measurements. The final concentrations of ions and metallic complexes in the resulting mixtures were 1 mM and 0.1 mg/mL, respectively.
Figure 4 shows that the different ions exhibited varying influences on the fluorescence intensity of Complex Zn. Clearly, Fe3+, Cr2O72−, and MnO4 had an obvious quenching effect on the fluorescence emission of Complex Zn, whereas the rest of the ions showed no significant effect on fluorescence intensity. The quenching rate (1 − I/I0) was 98.3% when Fe3+ was introduced to the sensor. When Cr2O72− and MnO4 were employed, the quenching rates reached 87.5% and 98.6%, respectively.
The relationship between the quencher concentration and the fluorescence intensity of the sensor was subsequently determined in titrimetric experiments involving the gradual addition of aqueous solutions of Fe3+, Cr2O72−, and MnO4 to suspensions of Complex Zn. The fluorescent quenching constant (Ksv) was calculated using the Stern–Volmer (SV) equation, expressed as I0/I − 1 = Ksv[C] [38], where I0 and I are the fluorescence intensities of Complex Zn before and after addition of the analyte, respectively, and [C] represents the molar concentration of the analyte. Figures S4–S6 show the results of the fluorometric titration of the ions. The kinetic plots of Fe3+, Cr2O72−, and MnO4 exhibit a range of linear dependence for low analyte concentrations (0–0.10 mM for Fe3+ and Cr2O72−, 0–0.35 mM for MnO4). Furthermore, as the analyte concentration increases, the curve diverges upward from the linear relation. Ksv was calculated (Table S5) to be 1.55 × 10⁴ M−1 when Fe3+ was used for Complex Zn. When sensing anions, the Ksv values of Complex Zn were 1.21 × 10⁴ M−1 for MnO4 and 1.64 × 10⁴ M−1 for Cr2O72−. In combination with the SV equation, the limit of detection (LOD) is an additional valuable tool for assessing the sensing capabilities of a fluorescence sensor, where LOD = 3σ/Ksv [39] (σ is the relative standard error calculated from three replicate blank determinations). The LOD values of Complex Zn were 0.60 × 10⁻⁶ M for Fe3+, 0.77 × 10⁻⁶ M for MnO4, and 0.57 × 10⁻⁶ M for Cr2O72−.

3.5. Anti-Interference Experiments

Anti-interference experiments were carried out to assess the selectivity of Complex Zn with Fe3+, Cr2O72−, and MnO4 in the presence of interfering ions. The results showed that the fluorescence quenching response of the interfering ions had a small but significant effect on Fe3+, Cr2O72−, and MnO4 (Figure S7). In the absence of Fe3+, the fluorescence intensities with the other ions decreased by 15%. After Fe3+ ions were added, the fluorescence was obviously quenched. A similar phenomenon was observed in the case of MnO4 and Cr2O72−, where the fluorescence intensity of Complex Zn obviously decreased.

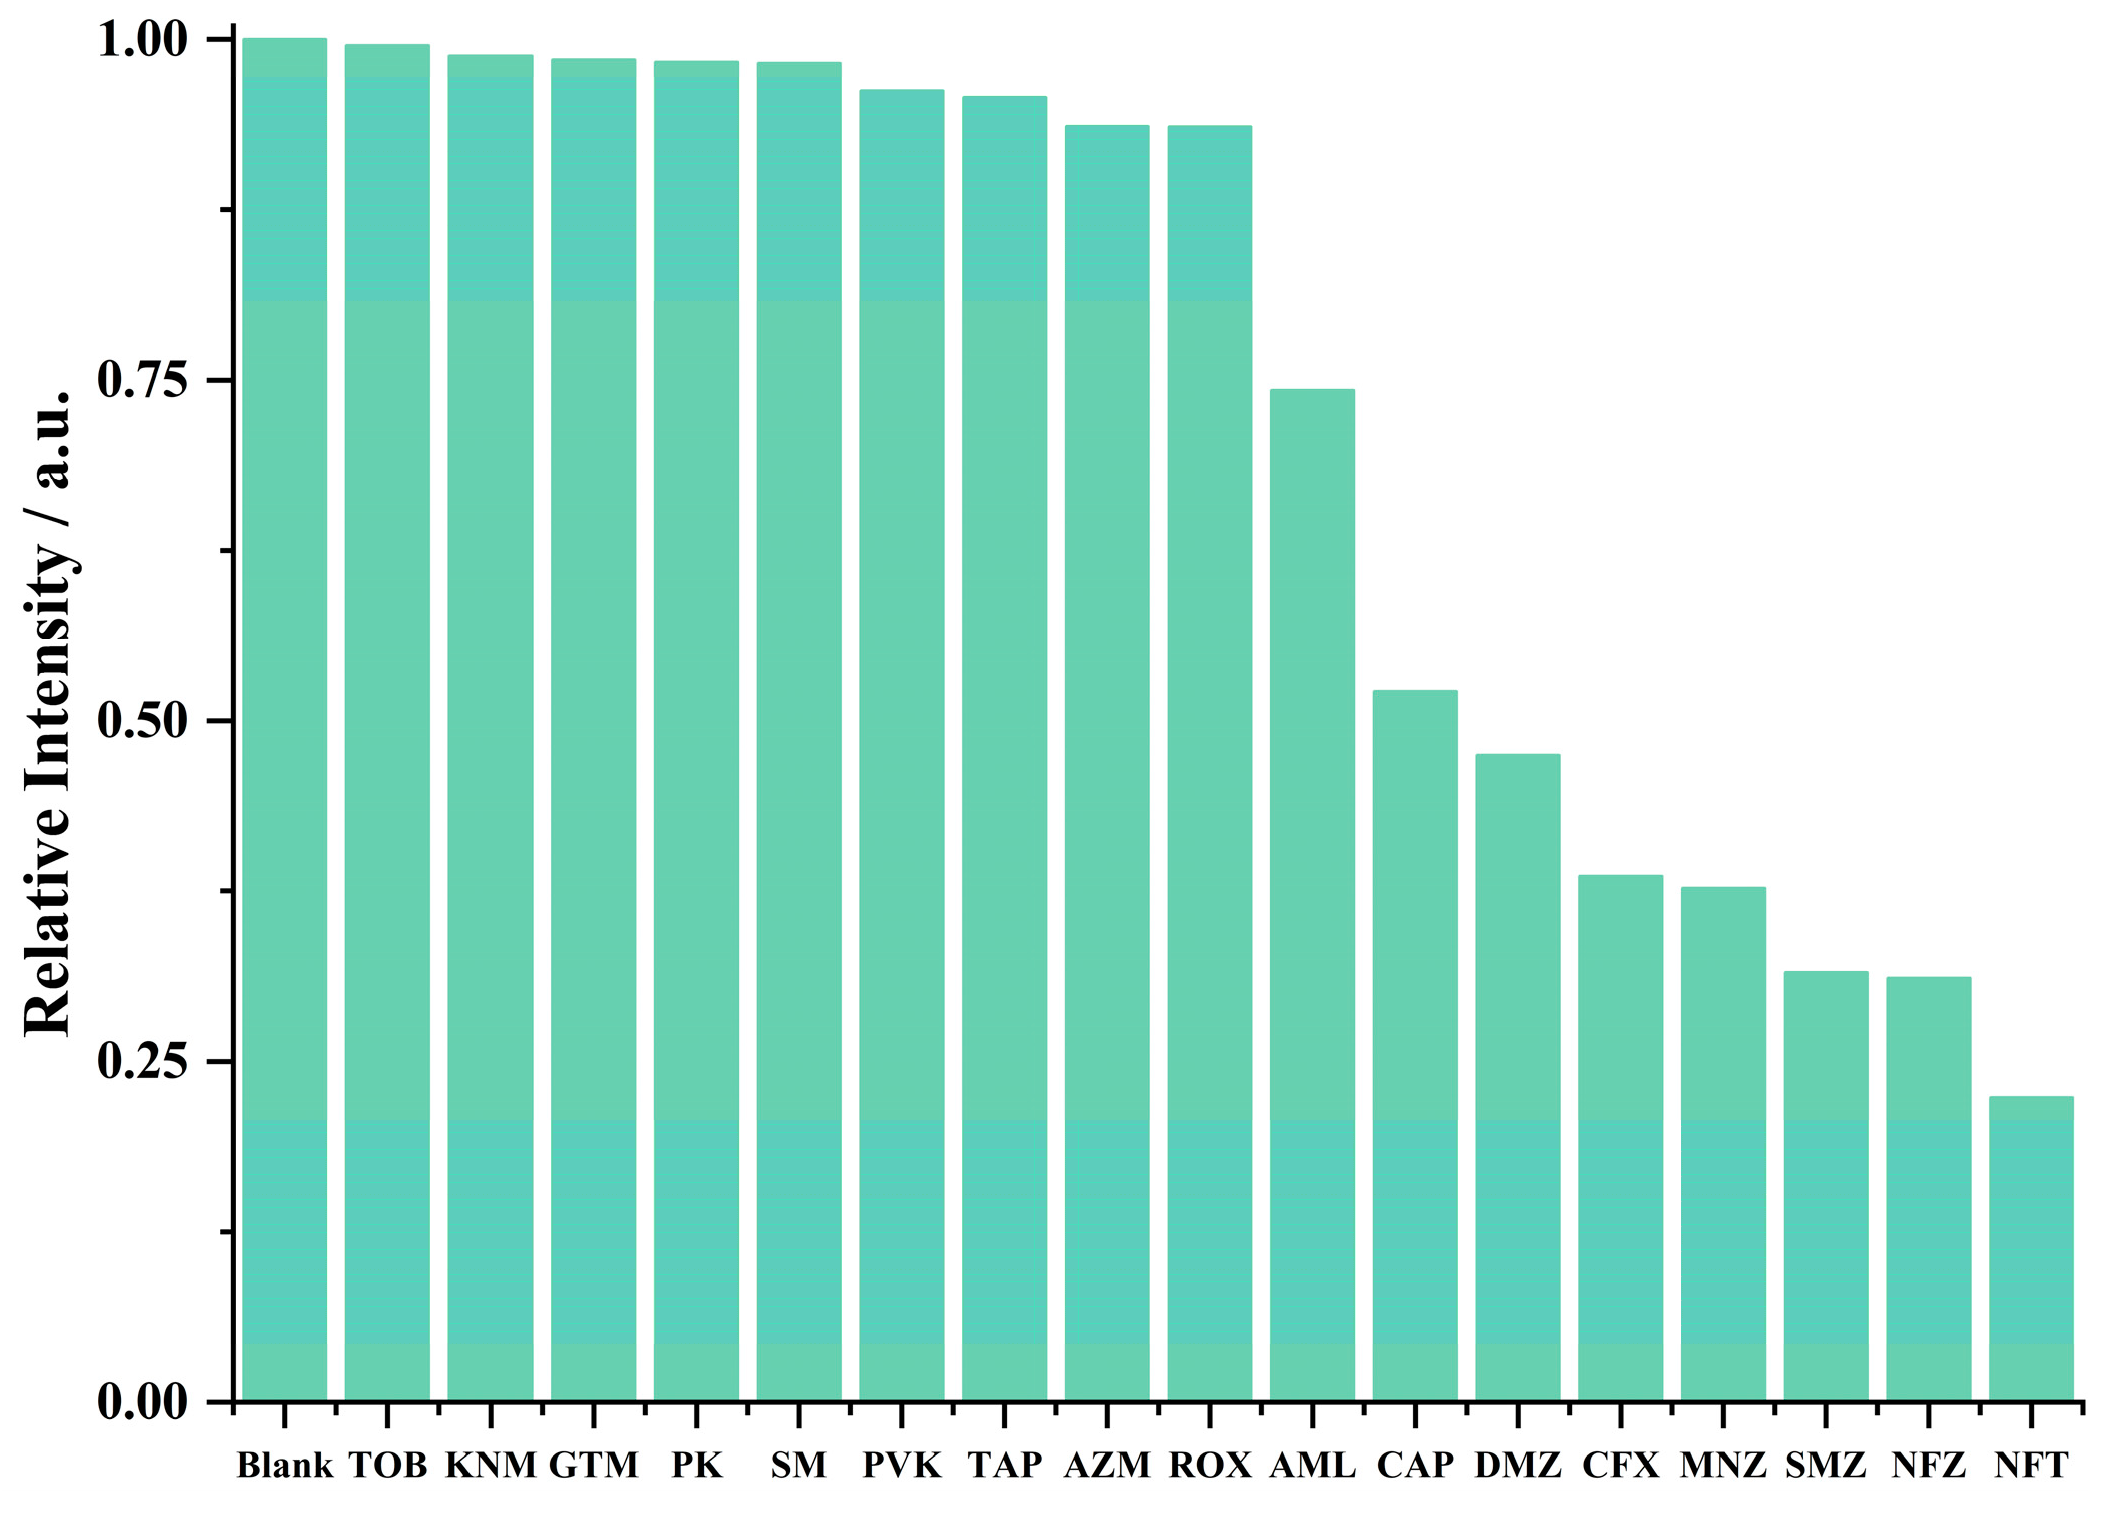
3.6. Antibiotics Sensing

In addition to its ion sensing ability, Complex Zn’s applicability to antibiotic sensing was investigated. The procedure used for sensing antibiotics was similar to that used for ions, except that the antibiotics were prepared at a concentration of 0.2 mM. During the sensing experiment, the sensor and analyte concentrations in the mixed solution were 0.1 mg/mL and 0.1 mM, respectively. As shown in Figure 5, the antibiotics GTM, ROX, AZM, PK, KNM, SM, PVK, TAP, and TOB exhibited no remarkable fluorescence quenching of Complex Zn. The rest of the antibiotics exhibited moderate to significant fluorescence quenching toward Complex Zn, with the quenching rates following the order of NFT > SMZ ≈ NFZ > CFX ≈ MNZ > DMZ > CAP > AML.
The highest-quenching antibiotic, NFT, was used in subsequent titration experiments in which NFT was added to a suspension of Complex Zn. Figure S8 shows that the fluorescence intensity of Complex Zn decreased as the concentration of NFT increased. At low analyte concentrations (0–0.05 mM), the Ksv values of NFT showed a linear correlation with the concentration of the analyte. At high analyte concentrations (0.05–0.30 mM), the values deviated upward from the linear relation. Complex Zn demonstrated lower detection limits and higher Ksv values for the quantification of contaminant NFT, as compared to the other reported materials [40,41,42,43,44,45]. The calculated Ksv and LOD values for Complex Zn were 2.34 × 10⁴ M−1 and 0.4 × 10⁻⁶ M, respectively (Table S6).

3.7. Pesticide Sensing

In addition to antibiotics, pesticides also represent important organic pollutants; therefore, pesticides were further investigated in the fluorescence sensing process. Firstly, an equal volume of pesticide (0.2 mM) (2,4-D, IMZ, CAR, DIP, NTP, GLY, IMI, TPM, PCNB, MMT, or TPN) was added to a suspension of Complex Zn (0.2 mg/mL). As depicted in Figure 6, the addition of IMZ, DIP, 2,4-D, GLY, or PCNB showed almost no impact on the fluorescence of Complex Zn. The other tested pesticides exhibited varying influences on the fluorescence intensity of the sensor. IMI achieved the most significant quenching rate toward the sensor among the pesticides used, followed by NTP, TPM, TPN, CAR, and MMT. IMI, which achieved the most significant quenching for Complex Zn, was further evaluated via kinetic titration experiments. Like in the analogous experiments with ions, the fluorescence spectra were collected as the concentration of IMI was gradually increased in a solution of Complex Zn (0.1 mg/mL) (Figure S9). Complex Zn had lower detection limits and higher Ksv values for the quantification of contaminant IMI compared to the other reported materials [46,47,48], as shown in Table S7; the calculated Ksv and LOD values for IMI in the Complex Zn suspension were 3.15 × 10⁴ M−1 and 0.29 × 10⁻⁶ M, respectively, at low concentrations (0–0.05 mM).

3.8. Recyclability

Recycling experiments were performed to determine the reusability of Complex Zn in the detection of analytical substances. The complex dispersed in an aqueous solution of MnO4 was recovered after the sensing experiment by means of centrifugation and washed with deionized water. During five consecutive cycles, the fluorescence intensity of Complex Zn remained constant, which suggests the good recycling performance of the sensor (Figure S10).

3.9. Resistance to pH

To test the acid–base resistance of Complex Zn, it was immersed in HCl and NaOH solutions at pH 6–10 for 12 h and then characterized by means of PXRD. Figure S11 displays a comparison of the PXRD results for Complex Zn at pH 6, 7, 8, 9, and 10 before and after immersion in the solutions. The results revealed no significant change in the PXRD patterns, which led to the conclusion that Complex Zn has good resistance to pH within the range of 6–10.

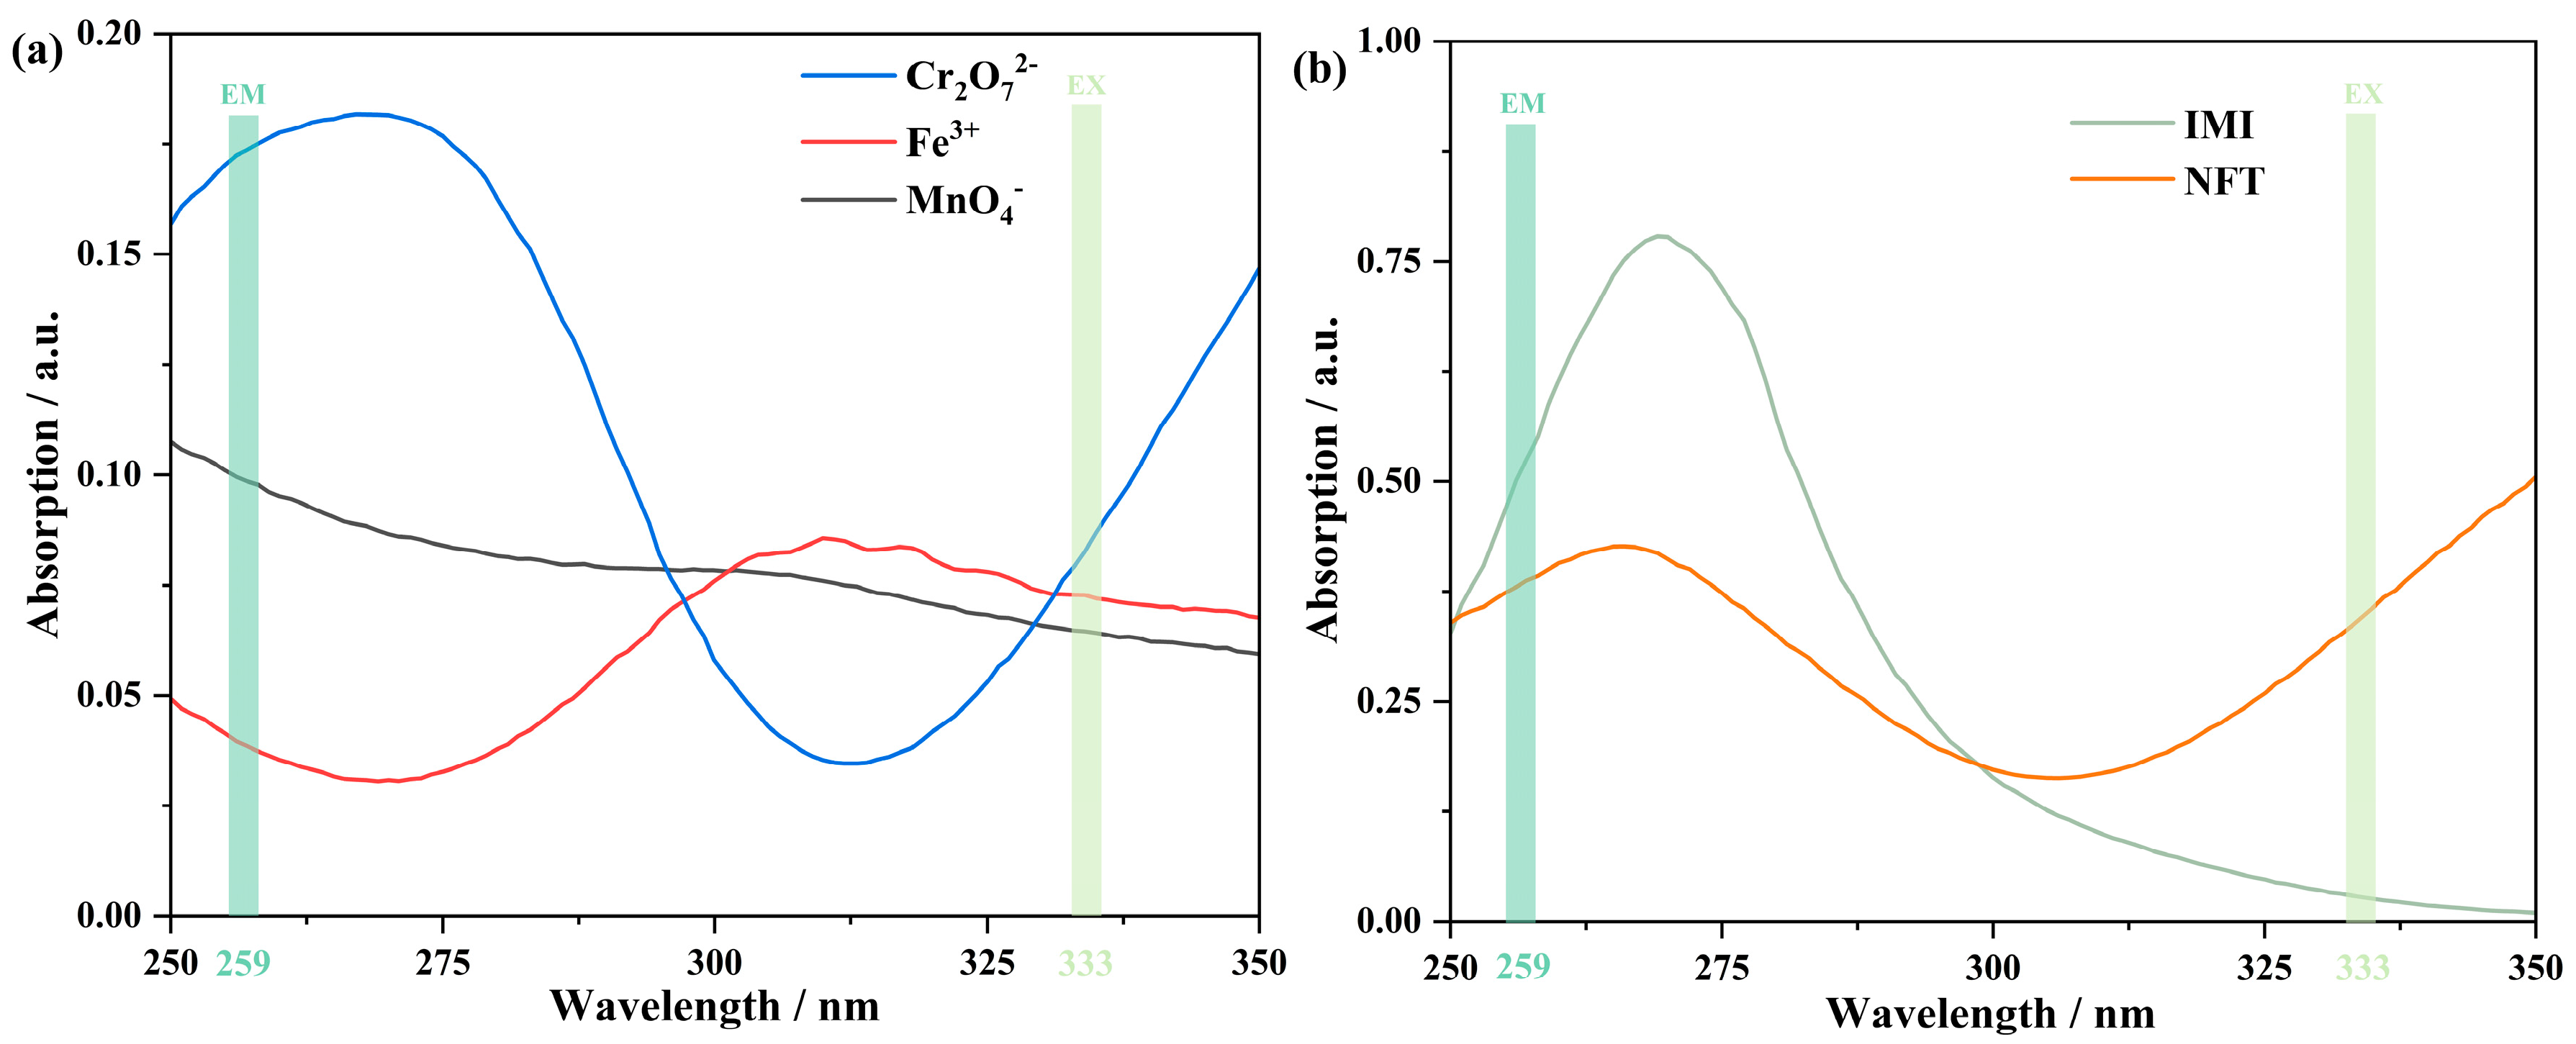
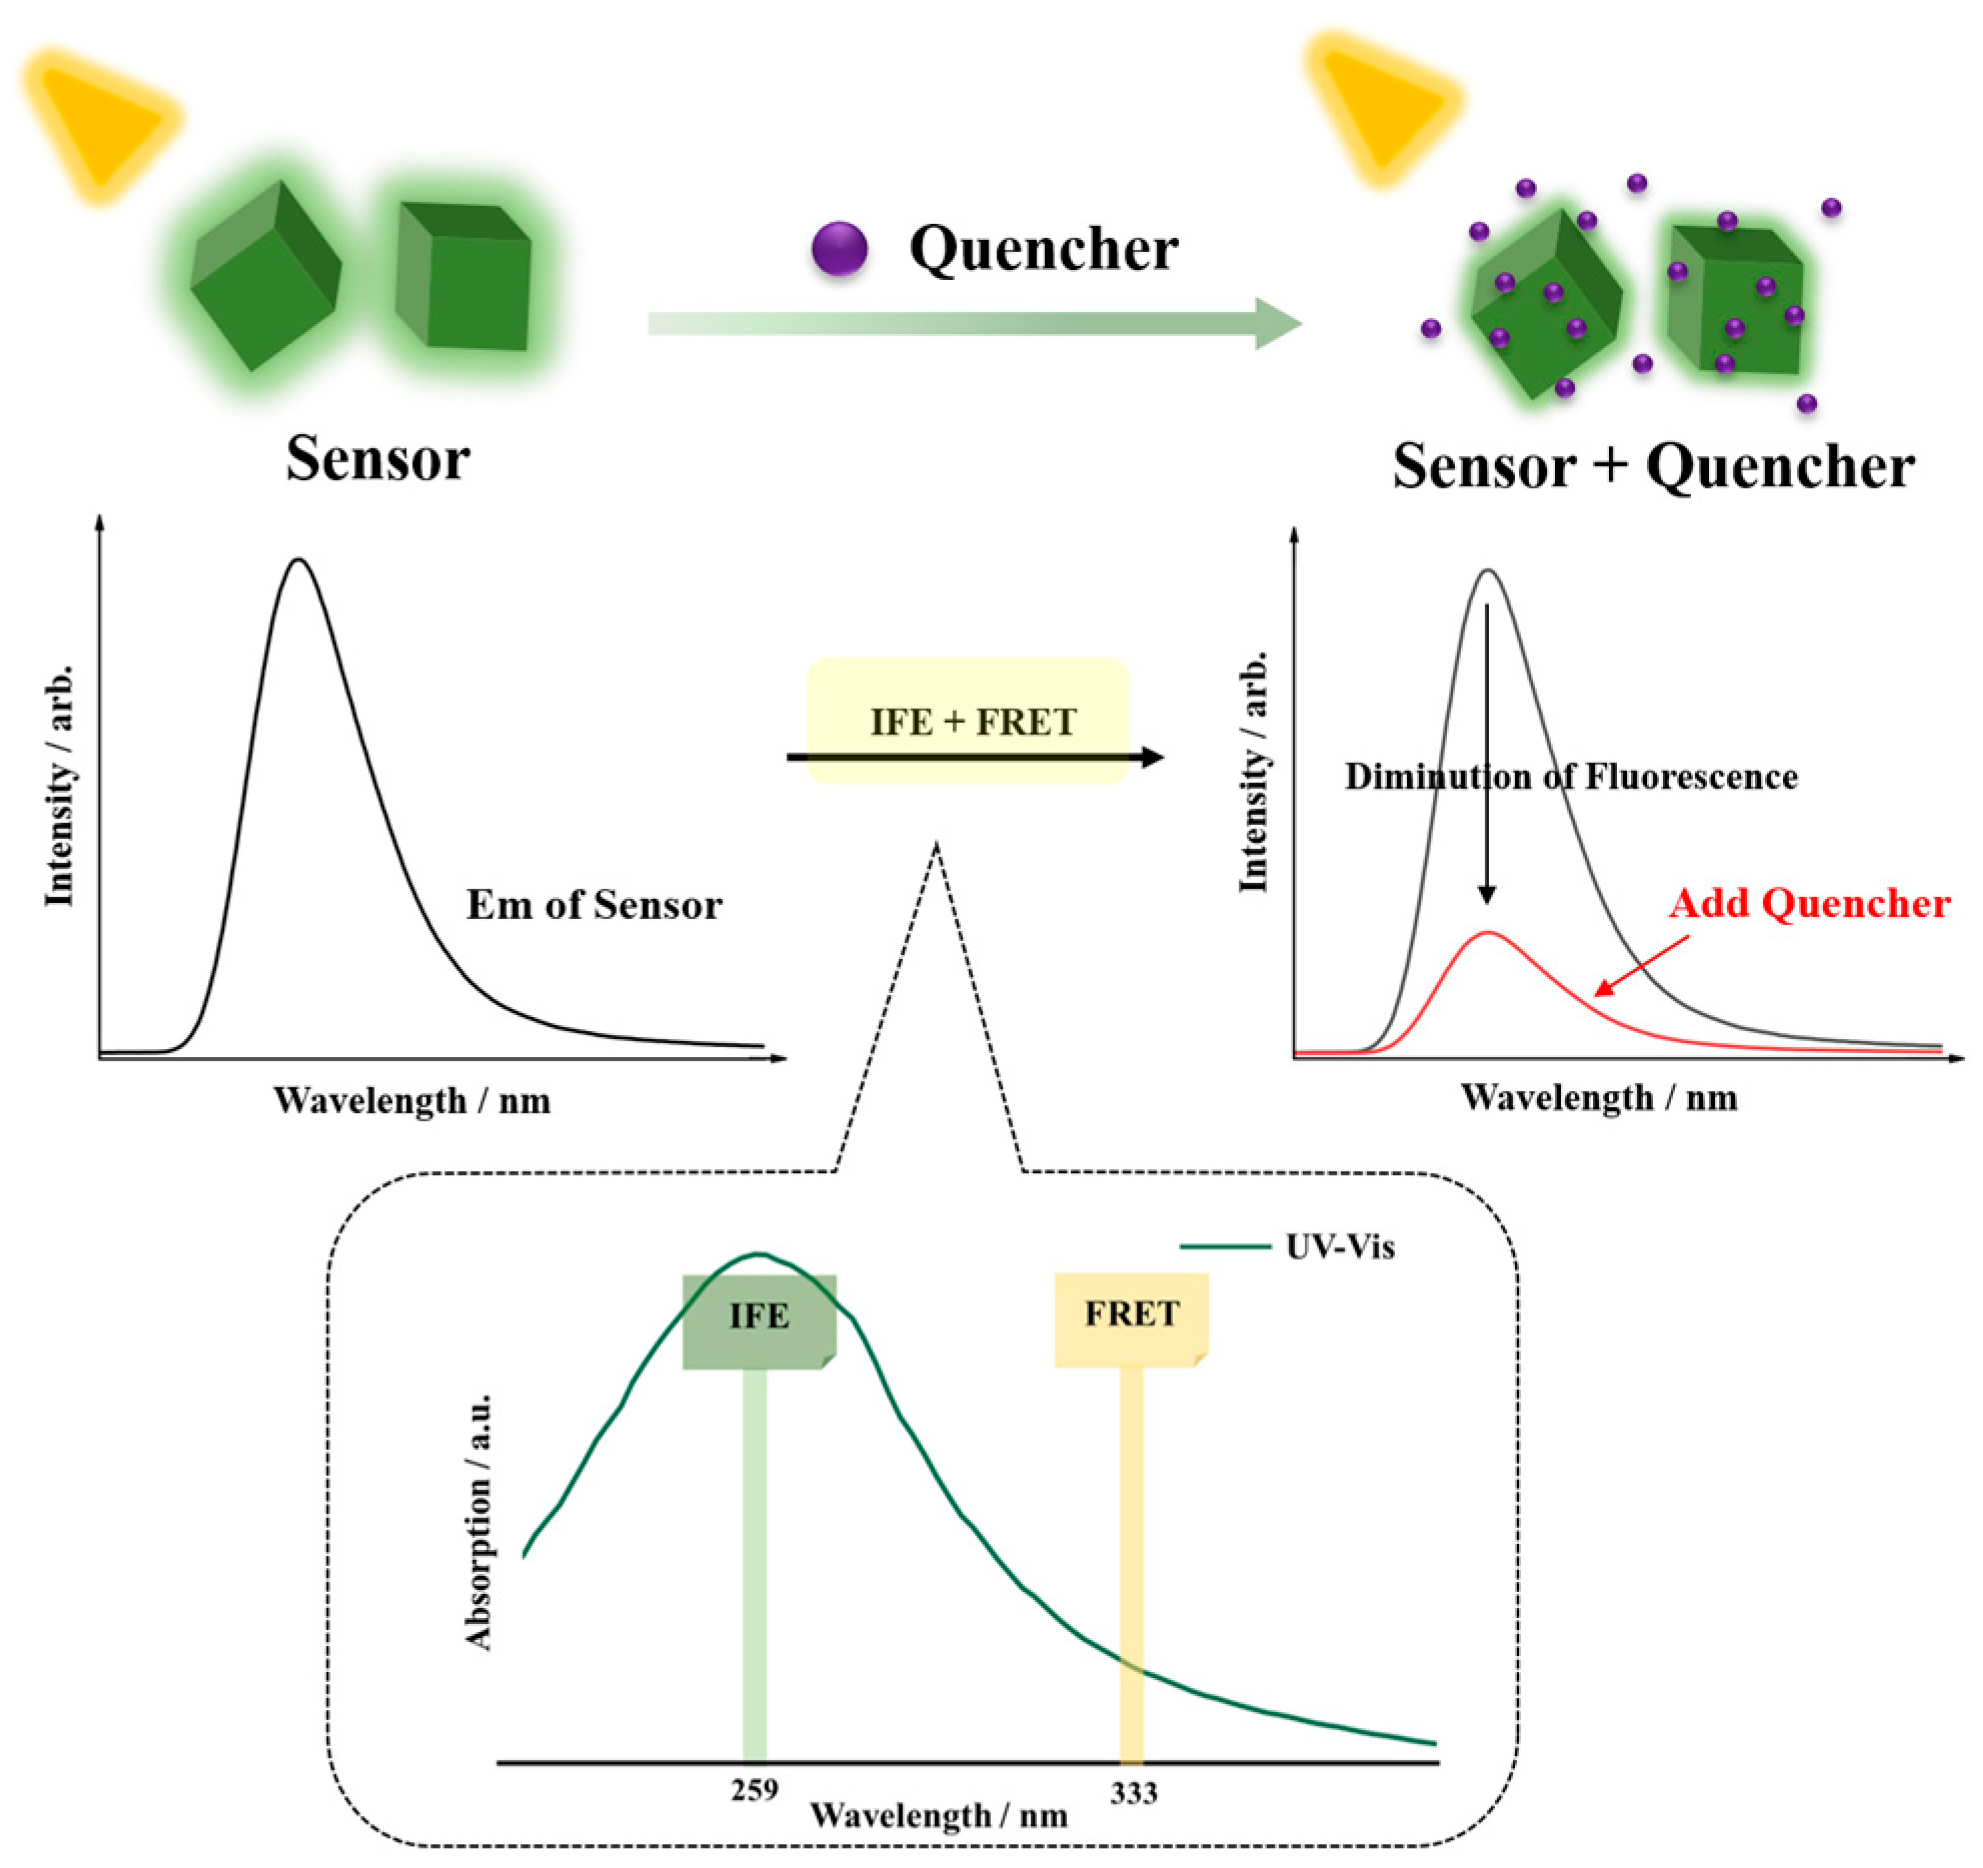
3.10. Discussion and Possible Mechanism for Fluorescent Sensing

In order to understand the underlying mechanisms involved in the fluorescence quenching procedure, further investigations were performed, and the results are discussed. In summary, the impact of fluorescence can be attributed to two primary processes: structural transformations [49] and energy transformations [50]. In structural transformation, skeleton destruction [51], ion or ligand exchange [52], and charge transfer are the major issues [53]. FT-IR and PXRD analyses of Complex Zn impregnated with various quenchers (Figures S11 and S12) revealed no discernible discrepancies in the FT-IR and PXRD spectra pre- and post-impregnation. Thus, it can be inferred that the observed fluorescence quenching is not attributed to substance transformation. Subsequently, the search for the fluorescence quenching mechanism shifted to the induction of energetic transfer. Generally, energy transfer mechanisms include IFE [54,55] and FRET [56,57]. IFE refers to an effective overlap between the excitation spectrum of the analytes and the excitation or emission spectrum of the sensor, which enhances the sensitivity of the analytical detection as the variation in absorbance of the analytes can be translated into an exponential change in the sensor signal. A higher extinction coefficient of the analytes is associated with a larger spectral overlap region with the sensor and a higher fluorescence quenching efficiency. FRET refers to the phenomenon in which the emission spectrum of one analyte in two different fluorescence groups overlaps somewhat with the excitation spectrum of the sensor, resulting in a decrease in fluorescence intensity. Thus, UV–Vis profiles of the analytes at different concentrations were compared to the excitation and emission spectra of the sensor. As shown in Figure 7, there is a clear overlap between both the excitation and emission ranges of Complex Zn and those of MnO4, Fe3+, Cr2O72− (Figure 7a), NFT, and IMI (Figure 7b) at wavelengths of 259 and 333 nm. As can be seen from the UV–Vis spectra, neither IFE nor FRET as the sole mechanism could effectively explain the quenching rate. Both mechanisms involve fluorescence quenching, which also occurs while sensing pesticides and ions. In summary, in the present study, IFE and FRET both perform an essential role in sensing (Figure 8). Furthermore, all obtained Ksv curves were linear at low analyte concentrations, thus revealing a dynamic quenching process; at higher analyte concentrations, the curves deviated upward, thus demonstrating the engagement of a static quenching process [58].

4. Materials and Methods

All reagents were analytical grade and used as received without further treatment. The chemicals of ZnSO4·7H2O, KOH, and H2NTD were provided by Shanghai Aladdin Biochemical Technology Co., Ltd. (Shanghai, China); DTP was synthesized according to the relevant literature method [30].
PXRD measurements were performed under a Bruker D8 FOCUS diffractometer (Bruker Corporation, Karlsruhe, Germany). The X-ray diffractometer was equipped with a copper target tube and a graphite monochromator scanning in the range of 5–50° at 0.2°/s. Simulated X-ray diffraction patterns were generated from properly processed cif files of the target complex crystals using Mercury software (Cambridge Crystallographic Data Centre, Cambridge, UK). TGA was performed using a Mettler-Toledo 1600TH (Mettler-Toledo International Inc., Zurich, Switzerland) thermal analyzer to record TG profiles at a heating rate of 10 °C/min in a flowing nitrogen atmosphere from r.t. to 800 °C. Elemental analysis of C, H, and N was performed using a Perkin-Elmer 240 CHN (Perkin-Elmer inc., Waltham, MA, USA) elemental analyzer. Fourier transform infrared spectra (FT-IR) were obtained with an Agilent Cary 630 spectrophotometer (Agilent Technologies Co., Ltd., Santa Clara City, CA, USA) in the range of 4000 to 500 cm−1. UV-Vis spectroscopy studies were performed using a Varian UV50 Conc spectrophotometer (Varian Medical Systems, Inc., Palo Alto, CA, USA). All fluorescence measurements were performed using an Agilent Cary Eclipse (Agilent Technologies Co., Ltd., Santa Clara City, CA, USA) fluorescence spectrophotometer at room temperature.
The SCXRD intensity data were subjected to processing and absorption correction using SAINT and SADABS software (Version: 2016/2) [59]. The line-shot data were then resolved using the SIR 2004 [60] structure-solving program within the Olex2 software (Version: 1.3, OlexSys Ltd., Durham, UK) [61]. To further enhance structural accuracy, a full-matrix least-squares F2 refinement was performed for the non-hydrogen atoms, employing the ShelXL refinement package (Version: 2017/1) [62]. The positions of hydrogen atoms were determined through a combination of theoretical hydrogenation and Fourier methods [63]. During this process, isotropic refinement was applied to the non-hydrogen atoms, and the coefficients for both the riding mode and the isotropic temperature were fixed at 1.2 times the U(eq) value of the parent atom.

5. Conclusions

In this work, a Zn-based complex bearing mixed ligands was synthesized. The configuration and purity of the complex were analyzed and identified by means of SCXRD, PXRD, FT-IR, TGA, and elemental analysis. In the complex, the Zn(II) atom is coordinated with two mono-protonated HNTD ligands, two DTP ligands, and two water molecules. In terms of the fluorescence sensing of different ions and organic pollutants, Complex Zn showed high sensitivity and selectivity towards Fe3+, MnO4, and Cr2O72−. For the sensing of antibiotics and pesticides, Complex Zn was sensitive to NFT and IMI, respectively. An investigation into the mechanism of the sensing process showed that IFE and FRET both play an essential role in fluorescence intensity.

Supplementary Materials

The following supporting information can be downloaded at https://www.mdpi.com/article/10.3390/inorganics12040093/s1. Table S1: Crystal data for Complex Zn. Table S2: The selected bond lengths [Å] and angles [°] for Complex Zn; Table S3: Chemical structure of the selected antibiotics. Table S4: Chemical structure of the selected pesticides; Figure S1: PXRD patterns of Complex Zn (as synthesized and simulated); Figure S2: FT-IR spectra of Complex Zn; Figure S3: Emission spectra (excitation at 259 nm) of H2NTD, H2NTD+ DTP, and Complex Zn; Figure S4: Fluorescence intensities of Complex Zn (a) dispersed in different concentrations of Fe3+; the plot of I0/I − 1 of Complex Zn (b) vs. concentration of Fe3+ in aqueous solution (Inset: The plot of I0/I − 1 of the Complex Zn with the concentration over a Fe3+ concentration range of 0–0.10 mM in aqueous solution); Figure S5: Fluorescence intensities of Complex Zn (a) dispersed in different concentrations of MnO4; the plot of I0/I − 1 of Complex Zn (b) vs. concentration of MnO4 in aqueous solution (Inset: The plot of I0/I − 1 of the Complex Zn with the concentration over a MnO4 concentration range of 0–0.35 mM in aqueous solution); Figure S6: Fluorescence intensities of Complex Zn (a) dispersed in different concentrations of Cr2O72−; the plot of I0/I − 1 of Complex Zn (b) vs. concentration of Cr2O72− in aqueous solution (Inset: The plot of I0/I − 1 of the Complex Zn with the concentration over a Cr2O72− concentration range of 0–0.10 mM in aqueous solution); Table S5: Ksv and LODs values of Complex Zn for ions detection; Figure S7: Fluorescent intensity of Complex Zn in the presence of other cations and anions. (The other cations = K+, Na+, Mg2+, Ca2+, Ni2+, Co2+, Mn2+, Cu2+, Zn2+, Cd2+, Pb2+, Ba2+, Al3+, Cr3+and Fe3+; The other anions = F, Cl, Br, I, Ac, SCN, NO3, ClO3, ClO4, HPO42−, H2PO4, CO32−, B4O72−, SO32− and SO42−), before and after addition of Fe3+, MnO4 or Cr2O72−; Figure S8: Fluorescence intensities of Complex Zn (a) dispersed in different concentrations of NFT; the plot of I0/I − 1 of Complex Zn (b) vs. concentration of NFT in aqueous solution (Inset: The plot of I0/I − 1 of the Complex Zn with the concentration over a NFT concentration range of 0–0.05 mM in aqueous solution); Table S6: Ksv and LOD values for recently reported lanthanide CP-based luminescence probes for sensing of NFT; Figure S9: Fluorescence intensities of Complex Zn (a) dispersed in different concentrations of IMI; the plot of I0/I − 1 of Complex Zn (b) vs. concentration of IMI in aqueous solution (Inset: The plot of I0/I − 1 of the Complex Zn with the concentration over a IMI concentration range of 0–0.05 mM in aqueous solution); Table S7: Ksv and LOD values for recently reported CP-based luminescence probes for IMI; Figure S10: Recyclability of Complex Zn implemented with 1 mM MnO4 aqueous solution; Figure S11: PXRD patterns of Complex Zn about pH resistance test: Complex Zn displayed strong stability in an aqueous solution with the pH values ranging from 6 to 10; Figure S12: Comparison before and after adding test substance of FT-IR spectra of Complex Zn; Figure S13: Comparison before and after adding test substance of PXRD patterns of Complex Zn.

Author Contributions

G.-S.Z.: conceptualization, data curation, visualization, writing—original draft. Y.J.: investigation, methodology. J.-Y.D.: resources. H.Y.: supervision. Y.C.: supervision. B.-Y.Y.: funding acquisition, project administration, writing—review and editing. Y.-Y.Z.: supervision, funding acquisition. F.V.: supervision, writing—review and editing, validation. All authors have read and agreed to the published version of the manuscript.

Funding

This research was funded by the Project of Science Platform of BUA in 2023 (No. BUAOP202313) and the Youth Innovation Promotion Association of CAS (No. 2020036).

Data Availability Statement

CCDC contains the supplementary crystallographic data for 2082189. These data can be obtained free of charge via http://www.ccdc.cam.ac.uk/conts/retrieving.html, accessed on 19 January 2023, or from the Cambridge Crystallographic Data Centre, 12 Union Road, Cambridge CB2 1EZ, UK; fax: (+44) 1223-33-033; or email: [email protected].

Acknowledgments

The authors gratefully acknowledge the “Project of Science Platform of BUA in 2023 and the Youth Innovation Promotion Association of CAS” for their financial support.

Conflicts of Interest

The authors declare that they have no known competing financial interests or personal relationships that could have appeared to influence the work reported in this paper.

References

  1. Yang, Q.Q.; Li, Z.Y.; Lu, X.N.; Duan, Q.N.; Huang, L.; Bi, J. A review of soil heavy metal pollution from industrial and agricultural regions in China: Pollution and risk assessment. Sci. Total Environ. 2018, 642, 690–700. [Google Scholar] [CrossRef]
  2. Liu, Y.; Wang, P.; Gojenko, B.; Yu, J.J.; Wei, L.Z.; Luo, D.G.; Xiao, T.F. A review of water pollution arising from agriculture and mining activities in central asia: Facts, causes and effects. Environ. Pollut. 2021, 291, 118209. [Google Scholar] [CrossRef] [PubMed]
  3. Souza, H.D.O.; Costa, R.D.S.; Quadra, G.R.; Fernandez, M.A.D.S. Pharmaceutical pollution and sustainable development goals: Going the right way? Sustain. Chem. Pharm. 2021, 21, 100428. [Google Scholar] [CrossRef]
  4. Chen, Y.G.; He, X.L.S.; Huang, J.H.; Luo, R.; Ge, H.Z.; Wołowicz, A.; Wawrzkiewicz, M.; Gładysz-Płaska, A.; Li, B.; Yu, Q.X.; et al. Impacts of heavy metals and medicinal crops on ecological systems, environmental pollution, cultivation, and production processes in China. Ecotoxicol. Environ. Saf. 2021, 219, 112336. [Google Scholar] [CrossRef] [PubMed]
  5. Fanton, H.; Affre, L.; Franquet, E.; Bertrand, C.; Cavalli, L.; Dumas, E.; Guiller, C.; Kaldonski, N.; Meineri, E.; Mutillod, C.; et al. Heavy ionic pollution disrupts assemblages of algae, macroinvertebrates and riparian vegetation. Environ. Pollut. 2023, 331, 121791. [Google Scholar] [CrossRef] [PubMed]
  6. Zhang, S.; Wang, B.; Li, S.; Xiao, H.L.; Liu, G.; Zhang, Z.; Wang, X. Metal-/carboxylate-directed four d10 piperazine-amide-based coordination polymers for the fluorescent detection of nitrophenol and nitroaniline in various water environments. J. Mol. Struct. 2024, 1297, 136929. [Google Scholar] [CrossRef]
  7. Qadeer, A.; Rui, G.; Ya, Q.L.; Ran, D.; Liu, C.Y.; Jing, D.; Anis, M.; Liu, M.Y.; Wang, S.H.; Jiang, X.; et al. A mega study of antibiotics contamination in eastern aquatic ecosystems of China: Occurrence, interphase transfer processes, ecotoxicological risks, and source modeling. J. Hazard. Mater. 2023, 458, 131980. [Google Scholar] [CrossRef]
  8. Wei, Y.L.; Wang, L.P.; Liu, J. The diabetogenic effects of pesticides: Evidence based on epidemiological and toxicological studies. Environ. Pollut. 2023, 331, 121927. [Google Scholar] [CrossRef]
  9. Li, W.T.; Xin, S.H.; Deng, W.J.; Wang, B.B.; Liu, X.X.; Yuan, Y.; Wang, S.L. Occurrence, spatiotemporal distribution patterns, partitioning and risk assessments of multiple pesticide residues in typical estuarine water environments in eastern China. Water Res. 2023, 245, 120570. [Google Scholar] [CrossRef]
  10. Li, S.; Ondon, B.S.; Ho, S.H.; Li, F.X. Emerging soil contamination of antibiotics resistance bacteria (ARB) carrying genes (Args): New challenges for soil remediation and conservation. Environ. Res. 2023, 219, 115132. [Google Scholar] [CrossRef]
  11. Broom, A.; Peterie, M.; Ridge, D.; Lafferty, L.; Kenny, K.; Broom, J.; Kelly, H.A.; Treloar, C.; Applegate, T. Sex, drugs and superbugs: The rise of drug resistant STIs. SSM-Qual. Res. Health 2023, 4, 100310. [Google Scholar] [CrossRef]
  12. Anthony, A.A.; Adekunle, C.F.; Thor, A.S. Residual antibiotics, antibiotic resistant superbugs and antibiotic resistance genes in surface water catchments: Public health impact. Phys. Chem. Earth 2018, 105, 177–183. [Google Scholar] [CrossRef]
  13. Yadav, S.; Jijoe, S.P.; Thinley, T.; Hosakote, A.; Anil, K.K.M.; Shivaraju, H.P. Hybrid ZnFe2O4/Ag2S nanocomposite for enhanced photocatalytic and bacterial activity towards targeted superbugs. Mater. Today Proc. 2023, 75, 46–57. [Google Scholar] [CrossRef]
  14. Yadav, N.; Maurya, B.M.; Chettri, D.; Pooja; Pulwani, C.; Jajula, M.; Kanda, S.S.; Babu, H.W.S.; Elangovan, A.; Velusamy, P.; et al. Artificial intelligence in heavy metals detection: Methodological and ethical challenges. Hyg. Environ. Health Adv. 2023, 7, 100071. [Google Scholar] [CrossRef]
  15. Wang, S.Q.; Chen, H.T.; Sun, B.G. Recent progress in food flavor analysis using gas chromatography-ion mobility spectrometry (GC-IMS). Food Chem. 2020, 315, 126158. [Google Scholar] [CrossRef] [PubMed]
  16. Ocampo, A.Y.D.; Salazar, R.E.; Ramírez, C.M.Á.; Rios, M.Y. Comprehensive review of liquid chromatography methods for fumonisin determination, a 2006–2022 update. Arab. J. Chem. 2023, 16, 104716. [Google Scholar] [CrossRef]
  17. Amini, S.; Ebrahimzadeh, H.; Seidi, S.; Jalilian, N. Preparation of polyacrylonitrile/Ni-MOF electrospun nanofiber as an efficient fiber coating material for headspace solid-phase microextraction of diazinon and chlorpyrifos followed by CD-IMS analysis. Food Chem. 2021, 350, 129242. [Google Scholar] [CrossRef] [PubMed]
  18. Pallavi, M.S.; Harischandra, N.R.; Pavankumar, K.; Ratnamma, N.; Shwetha, A.; Naveenkumar, P.; Paramasivam, M.; Udaykumar, N.R.; Prabhuraj, A.; Bheemanna, M. Determination of 73 multi-class pesticides in okra (Abelmoschus esculentus L.) fruits using LC-MS/MS and GC-MS/MS and estimation of analytical uncertainty of measurement. Food Chem. X 2023, 19, 100814. [Google Scholar] [CrossRef] [PubMed]
  19. Jia, Q.; Liao, G.Q.; Chen, L.; Qian, Y.Z.; Yan, X.; Qiu, J. Pesticide residues in animal-derived food: Current state and perspectives. Food Chem. 2024, 438, 137974. [Google Scholar] [CrossRef]
  20. Bin, D.N.; Kurdi, A.; Alshihri, S.; Tabbakh, T. Organic heterocyclic-based colorimetric and fluorimetric chemosensors for the detection of different analytes: A review (from 2015 to 2022). Mater. Today Chem. 2023, 27, 101347. [Google Scholar]
  21. Kumar, G.; Guda, R.; Husain, A.; Bodapati, R.; Das, S.K. A functional Zn(II) metallacycle formed from an n-heterocyclic carbene precursor: A molecular sensor for selective recognition of Fe3+ and IO4 ions. Inorg. Chem. 2017, 56, 5017–5025. [Google Scholar] [CrossRef] [PubMed]
  22. Pathan, I.R.; Patel, M.K. A comprehensive review on the synthesis and applications of Schiff base ligand and metal complexes: A comparative study of conventional heating, microwave heating, and sonochemical methods. Inorg. Chem. Commun. 2023, 158, 111464. [Google Scholar] [CrossRef]
  23. Retnam, C.T.G.; Rose, S.V.; Kumari, B.S. Synthesis, characterization, biological activity and molecular docking study of transition metal complexes from heterocyclic ligand system. J. Mol. Struct. 2023, 1282, 135162. [Google Scholar] [CrossRef]
  24. Ziółkowska, A.; Doroszuk, J.; Ponikiewski, Ł. Overview of the synthesis and catalytic reactivity of transition metal complexes based on C=P bond systems. Organometallics 2023, 42, 505–537. [Google Scholar] [CrossRef]
  25. Li, B.; Xu, Z.Q.; Xu, Y.B.; Yong, G.P. Effects of substituent groups on the crystal structures and luminescence properties of zero-/two-dimensional Zn(II) complexes. Inorg. Chem. Commun. 2019, 102, 57–60. [Google Scholar] [CrossRef]
  26. Li, S.; Sun, J.Y.; Liu, G.C.; Zhang, S.; Zhang, Z.; Wang, X.L. A new keggin-type polyoxometallate-based bifunctional catalyst for trace detection and pH-universal photodegradation of phenol. Chin. Chem. Lett. 2023, 21, 109148. [Google Scholar] [CrossRef]
  27. Fang, W.Q.; Zhang, L.; Feng, H.R.; Meng, J.X.; Zhang, Z.P.; Liu, Z.B. Research progress of fluorescent-substance@MOFs. Microchem. J. 2023, 185, 108265. [Google Scholar] [CrossRef]
  28. Das, R.; Pal, R.; Bej, S.; Mondal, M.; Kundu, K.; Banerjee, P. Recent progress in 0D optical nanoprobes for applications in the sensing of (bio)analytes with the prospect of global health monitoring and detailed mechanistic insights. Adv. Mater. 2022, 3, 4421–4459. [Google Scholar] [CrossRef]
  29. Zhou, Z.D.; Li, S.Q.; Liu, Y.; Du, B.; Shen, Y.Y.; Yu, B.Y.; Wang, C.C. Two bis-ligand-coordinated Zn(II)-MOFs for luminescent sensing of ions, antibiotics and pesticides in aqueous solutions. RSC Adv. 2022, 12, 7780–7788. [Google Scholar] [CrossRef]
  30. Wang, C.L.; Song, C.Q.; Shen, W.H.; Qi, Y.Y.; Xue, Y.; Shi, Y.C.; Yu, H.G.; Feng, L.G. A two-dimensional Ni(II) coordination polymer based on a 3,5-bis(1′,2′,4′-triazol-1′-yl)pyridine ligand for water electro-oxidation. Catal. Sci. Technol. 2019, 9, 1769. [Google Scholar] [CrossRef]
  31. Hadjiivanov, K.I.; Panayotov, D.A.; Mihaylov, M.Y.; Ivanova, E.Z.; Chakarova, K.K.; Andonova, S.M.; Drenchev, N.L. Power of infrared and raman spectroscopies to characterize metalorganic frameworks and investigate their interaction with guest molecules. Chem. Rev. 2021, 121, 1077–1980. [Google Scholar] [CrossRef]
  32. Yam, V.W.W.; Wong, K.M.C. Luminescent metal complexes of d6, d8 and d10 transition metal centres. Chem. Commun. 2011, 47, 11579–11592. [Google Scholar] [CrossRef] [PubMed]
  33. Curiel, D.; Más-Montoya, M.; Sánchez, G. Complexation and sensing of dicarboxylate anions and dicarboxylic acids. Coord. Chem. Rev. 2015, 284, 19–66. [Google Scholar] [CrossRef]
  34. Li, Y.M.; Xiao, C.Y.; Zhang, X.D.; Xu, Y.H.; Li, J.R.; Lun, H.J.; Chen, Q. Two new coordination polymers constructed by naphthalene-1,4-dicarboxylic acid and 2,4-diamino-6-methyl-triazine. J. Solid State Chem. 2013, 204, 190–196. [Google Scholar] [CrossRef]
  35. Han, S.D.; Hu, J.X.; Wang, G.M. Recent advances in crystalline hybrid photochromic materials driven by electron transfer. Coord. Chem. Rev. 2022, 452, 214304. [Google Scholar] [CrossRef]
  36. Shao, Z.C.; Wu, Q.; Han, X.; Zhao, Y.J.; Xie, Q.; Wang, H.F.; Hou, H.W. Proton coupled electron transfer: Novel photochromic performance in a host–guest collaborative MOF. Chem. Commun. 2019, 55, 10948. [Google Scholar] [CrossRef] [PubMed]
  37. Jiang, M.; Weng, Y.G.; Zhou, Z.Y.; Ge, C.Y.; Zhu, Q.Y.; Dai, J. Cobalt metal−organic frameworks incorporating redox-active tetrathiafulvalene ligand: Structures and effect of LLCT within the MOF on photoelectrochemical properties. Inorg. Chem. 2020, 59, 10727–10735. [Google Scholar] [CrossRef] [PubMed]
  38. Zhu, G.S.; Cheng, S.L.; Zhou, Z.D.; Du, B.; Shen, Y.Y.; Yu, B.Y. Bisligand-coordinated cadmium organic frameworks as fluorescent sensors to detect ions, antibiotics and pesticides in aqueous solutions. Polyhedron 2022, 217, 115759. [Google Scholar] [CrossRef]
  39. Yu, B.Y.; Wang, Z.P.; Ding, H.; Miao, F.F.; Yang, A.Z.; Zhao, W.T.; Jia, Y.; Zhao, H.Q. Fluorescent metal-organic frameworks based on cadmium(II) coordinated by a mixture of ligands for sensitively sensing ions and pesticides. J. Mol. Struct. 2023, 1291, 135891. [Google Scholar] [CrossRef]
  40. Zhu, H.B.; Shen, Y.; Fu, Z.Z.; Yu, Y.Y.; Jiang, Y.F.; Zhao, Y. A multifunctional Zn(II)-based four-fold interpenetrated metal-organic framework for highly sensitive sensing 2,4,6-trinitrophenol (TNP), nitrofurazone (NFZ) and nitrofurantoin (NFT). Inorg. Chem. Commun. 2019, 103, 21–24. [Google Scholar] [CrossRef]
  41. Li, J.; Chen, T.J.; Han, S.; Song, L.F. Four Zn(II)-organic frameworks as luminescent probe for highly selectivity detection of Cr(VI) ions and antibiotics. J. Solid State Chem. 2019, 277, 107–114. [Google Scholar] [CrossRef]
  42. Zhang, Y.Q.; Wu, X.H.; Mao, S.; Tao, W.Q.; Li, Z. Highly luminescent sensing for nitrofurans and tetracyclines in water based on zeolitic imidazolate framework-8 incorporated with dyes. Talanta 2019, 204, 344–352. [Google Scholar] [CrossRef]
  43. He, H.; Zhu, Q.Q.; Li, C.P.; Du, M. Design of a highly-stable pillar-layer Zinc(II) porous framework for rapid, reversible, and multi-responsive luminescent sensor in water. Cryst. Growth Des. 2018, 19, 694–703. [Google Scholar] [CrossRef]
  44. Ying, Y.M.; Tao, C.L.; Yu, M.; Xiong, Y.; Guo, C.R.; Liu, X.G.; Zhao, Z. In situ encapsulation of pyridine-substituted tetraphenylethene cations in metal-organic framework for the detection of antibiotics in aqueous medium. J. Mater. Chem. C 2019, 7, 8383–8388. [Google Scholar] [CrossRef]
  45. Fan, L.; Wang, F.; Zhao, D.; Peng, Y.; Deng, Y.; Luo, Y.; Zhang, X. A self-penetrating and chemically stable Zinc(II)-organic framework as multi-responsive chemo-sensor to detect pesticide and antibiotics in water. Appl. Organomet. Chem. 2020, 34, e5960. [Google Scholar] [CrossRef]
  46. Zhou, Z.D.; Wang, C.Y.; Zhu, G.S.; Du, B.; Yu, B.Y.; Wang, C.C. Water-stable europium(III) and terbium(III)-metal organic frameworks as fluorescent sensors to detect ions, antibiotics and pesticides in aqueous solutions. J. Mol. Struct. 2022, 1251, 132009. [Google Scholar] [CrossRef]
  47. Zhou, Z.D.; Xu, Z.L.; Jia, L.F.; Wang, D.; Zhao, H.Q.; Yu, B.Y.; Wang, C.C. Two bisligand-coordinated luminescent Zn(II)-coordination polymers for sensing of ions and pesticides in aqueous solutions. Chin. J. Struct. Chem. 2022, 41, 2209087–2209093. [Google Scholar]
  48. Yu, B.Y.; Wang, D.; Zhu, G.S.; Wei, C.J.; Jia, Y.; Song, C.L.; Cheng, J.; Zhao, H.Q. Synthesis, crystal structure of four 1D to 3D coordination polymers as potential sensor for the detection of ions, antibiotics and pesticides in water media. Polyhedron 2023, 230, 116242. [Google Scholar] [CrossRef]
  49. Mingke, Y.; Ying, X.; Xin, Y.W.; Yu, X.L.; Guang, M.L. Highly water-stable Dye@Ln-MOFs for sensitive and selective detection toward antibiotics in water. ACS Appl. Mater. Interfaces 2019, 11, 21201–21210. [Google Scholar]
  50. Feng, Z.; Hua, Y.; Tian, S.C.; Gao, W.Z.; Yi, W.; Yang, Y.Y. A lanthanide MOF thin-film fixed with Co3O4 nano-anchors as a highly efficient luminescent sensor for nitrofuran antibiotics. Chem. Eur. J. 2017, 23, 10293–10300. [Google Scholar]
  51. Wang, H.S.; Liu, H.L.; Wang, K.; Ding, Y.; Xu, J.J.; Xia, X.H.; Chen, H.Y. Insight into the unique fluorescence quenching property of metal-organic frameworks upon DNA binding. Anal. Chem. 2017, 21, 11366–11371. [Google Scholar] [CrossRef] [PubMed]
  52. Jing, L.; Fan, M.; Lei, G.; Jun, H.H.; Zheng, L.; Qin, X.; Hong, B.L. Ligand reduction and cation exchange on nanostructures for an elegant design of copper ions photoelectrochemical sensing. Sens. Actuators B Chem. 2021, 328, 129032. [Google Scholar]
  53. Wang, Z.Q.; Wang, C.; Zhang, H.; Liu, Z.M.; Zhao, B.; Li, W.L. The application of charge transfer host based exciplex and thermally activated delayed fluorescence materials in organic light-emitting diodes. Org. Electron. 2019, 66, 227–241. [Google Scholar] [CrossRef]
  54. Ma, S.Y.; Wang, Y.H.; Wang, C.; Wang, L.L.; Miao, Q.; Liu, Y.X.; Ma, Y.M.; Chen, G. Accurate photoactivation monitoring via the construction of an intramolecular synergistic counteracting mechanism of FRET and IFE. Chem. Comm. 2023, 59, 5599–5602. [Google Scholar] [CrossRef]
  55. Qiu, H.M.; Yang, H.; Gao, X.; Nie, C.; Gu, Y.; Shen, Y.Z. Inner filter effect-based fluorescence assays toward environmental pesticides and antibiotics. Coord. Chem. Rev. 2023, 493, 215309. [Google Scholar] [CrossRef]
  56. Wu, L.L.; Huang, C.S.; Emery, B.P.; Sedgwick, A.C.; Bull, S.D.; He, X.P.; Tian, H.; Yoon, J.Y.; Sessler, J.L.; James, T.D. Förster resonance energy transfer (FRET)-based small-molecule sensors and imaging agents. Chem. Soc. Rev. 2020, 49, 5110–5139. [Google Scholar] [CrossRef]
  57. Ling, Q.H.; Cheng, T.Y.; Tan, S.Y.; Huang, J.H.; Xu, L. Fluorescence-resonance energy transfer (FRET) within the fluorescent metallacycles. Chin. Chem. Lett. 2020, 31, 2884–2890. [Google Scholar] [CrossRef]
  58. Marcelo, H.G. The centenary of the Stern-Volmer equation of fluorescence quenching: From the single line plot to the SV quenching map. J. Photochem. Photobiol. C 2020, 42, 100338. [Google Scholar]
  59. Krause, L.; Herbst, I.R.; Sheldrick, G.M.; Stalke, D. Comparison of silver and molybdenum microfocus X-ray sources for single-crystal structure determination. J. Appl. Crystallogr. 2015, 48, 3–10. [Google Scholar] [CrossRef]
  60. Burla, M.C.; Caliandro, R.; Camalli, M.; Carrozzini, B.; Cascarano, G.L.; De Caro, L.; Giacovazzo, C.; Polidori, G.; Siliqi, D.; Spagna, R. Il milione: A suite of computer programs for crystal structure solution of proteins. J. Appl. Crystallogr. 2007, 40, 609–613. [Google Scholar] [CrossRef]
  61. Dolomanov, O.V.; Bourhis, L.J.; Gildea, R.J.; Howard, J.A.K.; Puschmann, H. OLEX2: A complete structure solution, refinement and analysis program. J. Appl. Crystallogr. 2009, 42, 339–341. [Google Scholar] [CrossRef]
  62. Sheldrick, M.G. A short history of SHELX. Acta Crystallogr. A 2007, 64, 112–122. [Google Scholar] [CrossRef] [PubMed]
  63. Sheldrick, M.G. SHELXT-integrated space-group and crystal-structure determination. Acta Crystallogr. A 2015, 71, 3–8. [Google Scholar] [CrossRef] [PubMed]
Figure 1. (a) Coordination environment of Zn(II) ions in Complex Zn. (b) Molecular structure of Complex Zn, in which Zn(II)1 and carboxylic H atoms are labeled. (c) View of the metal layer along the b-axis. The hydrogen atoms (except carboxylic hydrogen) and lattice water molecules in (b), as well as the disorder of the phenyl groups in the HNTD ligand and the triazole moieties in the DTP ligand, have been excluded for the sake of clarity.
Inorganics 12 00093 g001
Figure 2. TGA curve of Complex Zn from room temperature to 800 °C under an atmosphere of N2.
Inorganics 12 00093 g002
Figure 3. Fluorescence spectra of Complex Zn: excitation (insert) and emission.
Inorganics 12 00093 g003
Figure 4. Relative intensity values of Complex Zn dispersed in aqueous solution (0.1 mg/mL) treated with (a) different metal ions and (b) inorganic anions (1 mM).
Inorganics 12 00093 g004
Figure 5. Relative intensity values of Complex Zn dispersed in aqueous solution (0.1 mg/mL) treated with different antibiotics (0.1 mM).
Inorganics 12 00093 g005
Figure 6. Relative intensity values of Complex Zn dispersed in aqueous solution (0.1 mg/mL) treated with different pesticides (0.1 mM).
Inorganics 12 00093 g006
Figure 7. UV–Vis absorbance spectra of various (a) ions, (b) antibiotics, and pesticides.
Inorganics 12 00093 g007
Figure 8. Schematic illustration of the sensor’s fluorescence quenching mechanisms.
Inorganics 12 00093 g008
Disclaimer/Publisher’s Note: The statements, opinions and data contained in all publications are solely those of the individual author(s) and contributor(s) and not of MDPI and/or the editor(s). MDPI and/or the editor(s) disclaim responsibility for any injury to people or property resulting from any ideas, methods, instructions or products referred to in the content.

