Article

Synthesis, Spectroscopic Characterization, and Photophysical Studies of Heteroleptic Silver Complexes Bearing 2,9-Bis(styryl)-1,10-phenanthroline Ligands and Bis[(2-diphenylphosphino)phenyl] Ether

by
Dimitrios Glykos
1,
Athanassios C. Tsipis
1,
John C. Plakatouras
1,2 and
Gerasimos Malandrinos
1,*
1
Laboratory of Inorganic Chemistry, Department of Chemistry, University of Ioannina, 451 10 Ioannina, Greece
2
Institute of Materials Science and Computing, University Research Center of Ioannina, 451 10 Ioannina, Greece
*
Author to whom correspondence should be addressed.
Inorganics 2024, 12(5), 131; https://doi.org/10.3390/inorganics12050131
Submission received: 7 April 2024 / Revised: 26 April 2024 / Accepted: 30 April 2024 / Published: 2 May 2024
(This article belongs to the Special Issue Synthesis and Application of Luminescent Materials)

Abstract

:
Three new heteroleptic Ag(I) complexes, labeled as [AgL(POP)]BF4 (13), were successfully synthesized and comprehensively characterized. Here, L represents 2,9-bis((E)-4-methoxystyryl)-1,10-phenanthroline (L1), 2,9-bis((E)-4-methylthiostyryl) -1,10-phenanthroline (L2), and 2,9-bis((E)-4-diethylaminostyryl)-1,10-phenanthroline (L3), while POP stands for Bis[(2-diphenylphosphino)phenyl] ether. The stability of these compounds in solution was confirmed through multinuclear 1D (1H, 13C, 31P) and 2D NMR (COSY, NOESY, HMBC, HSQC) spectroscopies. Additionally, their molecular structure was elucidated via X-ray crystallography. The photophysical properties of the complexes were assessed both in the solid state and in solution (dichloromethane). Compounds 13 demonstrated moderate emissions in solution, with quantum yields ranging from 11–23%. Interestingly, their solid-state luminescent behavior differed. Large bathochromic shifts (42–75 nm) of the emission maxima and a decrease in quantum yields (2.5–9.5%) were evident, possibly due to the presence of excimers. Compound 3 stands out as a rare example of an Ag(I) red-color emitter.

Graphical Abstract

1. Introduction

Luminescent compounds based on transition metals are increasingly garnering attention for various applications, such as organic light-emitting diodes (OLEDs), photocatalysis, and luminescence sensing and imaging [1,2,3]. The focal point of these research efforts has predominantly centered on late-transition metal-containing materials, specifically those featuring third-row transition metal complexes with d6 or d8 electronic configurations, which serve as prominent models. Nonetheless, there exists a developing interest in the exploration of emissive metal complexes with d10 configurations due to their abundant availability [4,5,6].
Group 11 metal(I) complexes capable of emitting light through phosphorescence and/or thermally activated delayed fluorescence (TADF) at room temperature have emerged as promising emitters for OLED devices because they can utilize both triplet (T1) and singlet (S1) excitons. Among them, silver(I) complexes are potential candidates for highly efficient emitters with shorter decay times. However, the inherent redox potential of the silver ion limits metal-to-ligand charge transfer (MLCT) characteristics, often leading to emissions dominated by ligand-centered ππ* transitions. Consequently, luminescent Ag(I) complexes displaying TADF are uncommon [7,8].
Among the most promising emissive silver(I) compounds are heteroleptic [Ag(P^P)(N^N)]+ species, where N^N represents an aromatic diimine type ligand and P^P denotes a sterically demanding bis(phosphino) chelate such as Bis[(2-diphenylphosphino)phenyl] ether (POP). The coordination chemistry of the large-bite bidentate POP ligand has been subject to an extensive investigation by Van Leeuwen and colleagues, as well as by other researchers [9,10]. This interest stems from its adaptable coordination behavior and its efficacy as a catalyst in various organic transformations. Copper(I)-POP species have undergone extensive scrutiny, whereas analogous silver complexes are less studied. On the other hand, a careful choice of the N^N ligand is also important to optimize the complexes’ photophysical characteristics. Rigid structures based on 2,2′-bipyridine or 1,10-phenanthroline cores are commonly employed, while the extent of conjugation and the electronic properties of the N^N ligand are more easily controlled than those of the P^P ligand [6,7,11,12,13].
Building upon our previous research on the coordination chemistry and luminescent properties of heteroleptic Ir(III), Cu(I), and Ag(I) compounds [14,15,16,17,18], herein, we present our findings on mixed-ligand emissive Ag(I) complexes comprising POP (P^P ligand) and 2,9-Bis(styryl)-1,10-phenanthroline derivatives (N^N ligands). The latter differ only in the nature of the X group located in position 4 of the styryl ring. (X= -methoxy, -methythio, -diethylamino). We believe that it would also be of interest to examine the impact of these electron-donating substituents on the structural, optical, and photophysical properties of the compounds.

2. Results and Discussion

2.1. Synthesis and Characterization

The N^N type ligand 2,9-bis((E)-4-methoxystyryl)-1,10-phenanthroline (L1) was synthesized according to a previously described method [19]. The same procedure was followed for the new ligands 2,9-bis((E)-4-methylthioystyryl)-1,10-phenanthroline (L2), and 2,9-bis((E)-4-dietlylaminostyryl)-1,10-phenanthroline (L3) (experimental details are provided in Supplementary Materials). The synthetic route yielding the heteroleptic silver(I) complexes containing the aforementioned ligands and POP is illustrated in Scheme 1.
The procedure involves the reaction of AgBF4 with POP (2 h at room temperature), followed by the addition of L1L3 Unfortunately, only complex 2 crystallized as a BF4 salt, while crystallization of 1 and 3 was achieved using the same synthetic procedure, but with a different Ag(I) source (AgPF6). However, it should be noted that all the solution work was performed on the [Ag(N^N)(POP)][BF4] compounds. In the ATR-IR spectra (Figures S1–S3), all complexes exhibited absorption bands located in the range of 1575–1460 cm−1 and ascribed to ν(C=N) and ν (C=C) (POP and N^N ligands). In addition, the characteristic absorption band of the anion (BF4) was observed at approximately 1050 cm−1 (ν(B-F)) [20,21].

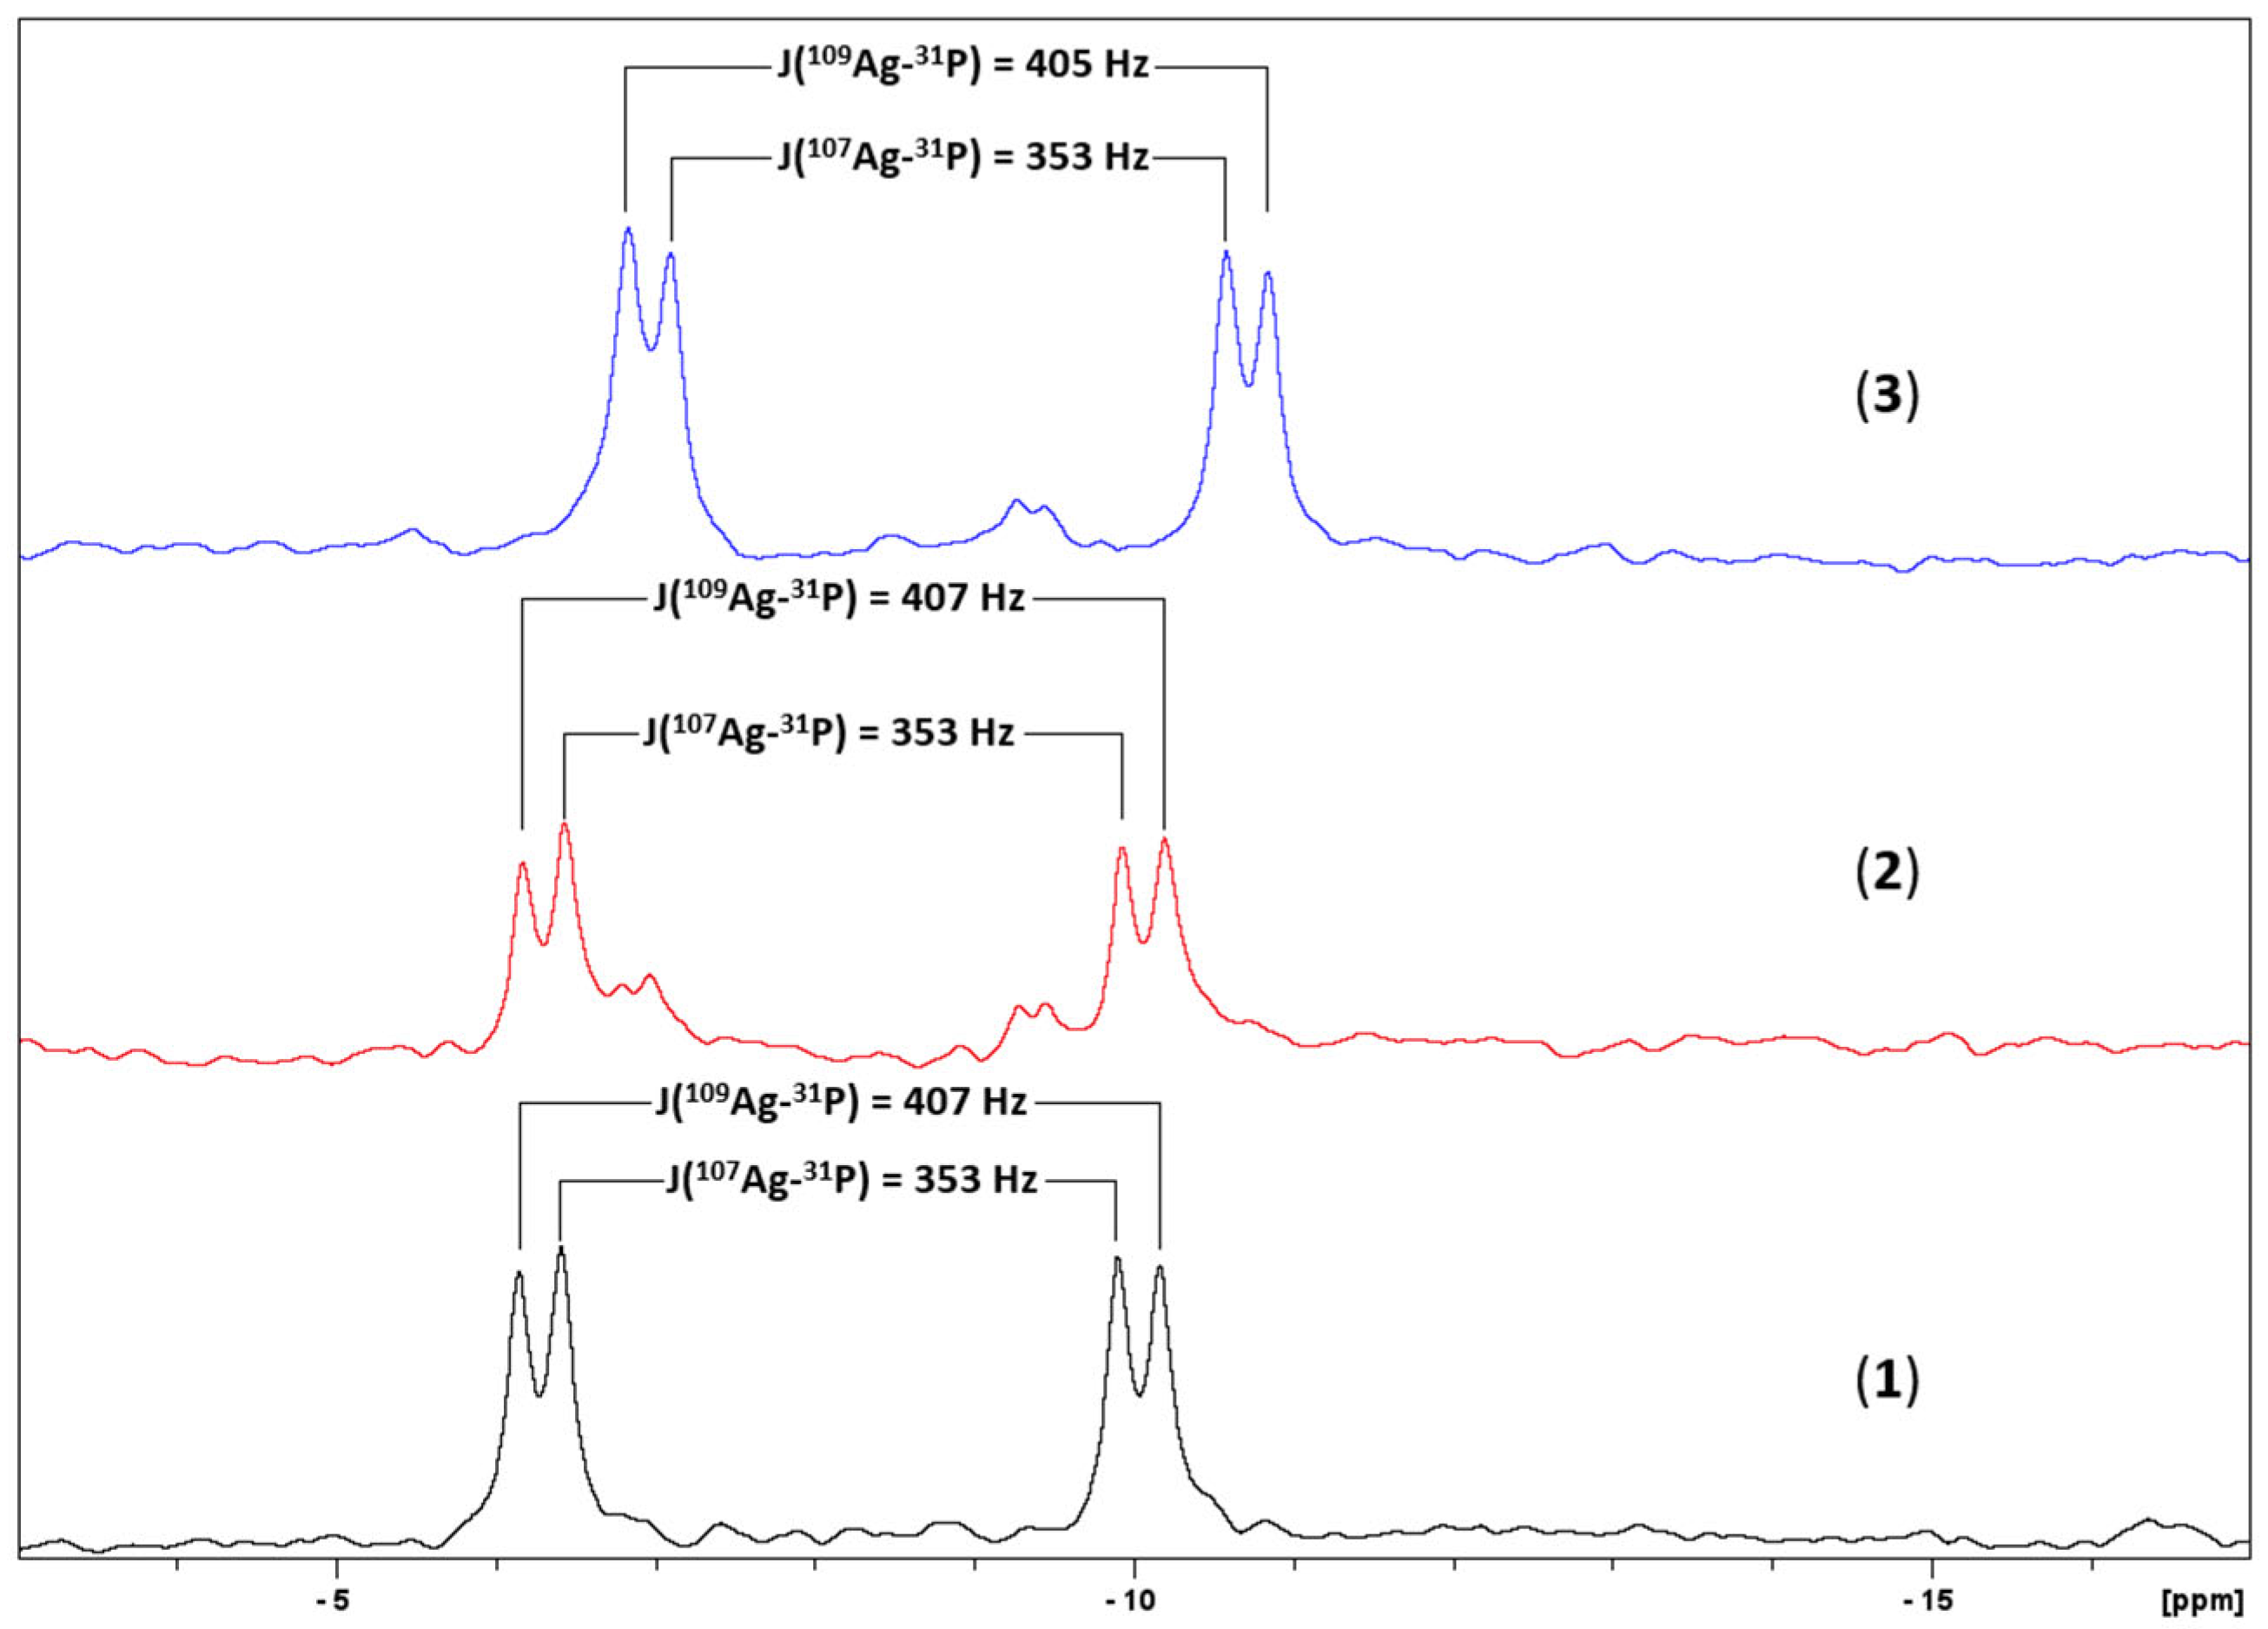
2.2. Characterization in Solution

The 1H NMR and 13C{1H} NMR spectra of ligands and complexes in CDCl3 are provided in the ESI, Figures S4–S16. The 1H chemical shifts (δ, ppm), as well as Δδ values (Δδ = δcomplex − δligand) derived from the spectra analysis, are listed in Table 1. The 31P{1H} NMR spectra in CDCl3 of all complexes are depicted in Figure 1. In the 1H NMR spectra, 13 exhibit sharp and resolved signals, indicating the integrity of the compounds. The data presented in Table 1, and especially the chemical shifts differences induced by complexation (Δδ), confirm the strong interaction of both ligands with Ag(I). The double bonds of the two styryl moieties adopt an E-configuration, inferred by the calculated J-coupling of 16 Hz.
Further insight into the Ag(I) coordination sphere and geometry was obtained through 31P NMR spectroscopy. A well-resolved doublet of doublets appeared for all complexes due to the coupling of 107Ag and 109Ag nuclei with P atoms. This phenomenon has also been observed for similar complexes in the literature. The values of J(107Ag-31P) and J(109Ag-31P) shown in Figure 1 suggest that Ag(I) adopts a tetrahedral geometry employing the diimine ligand and the phosphine POP [22,23].

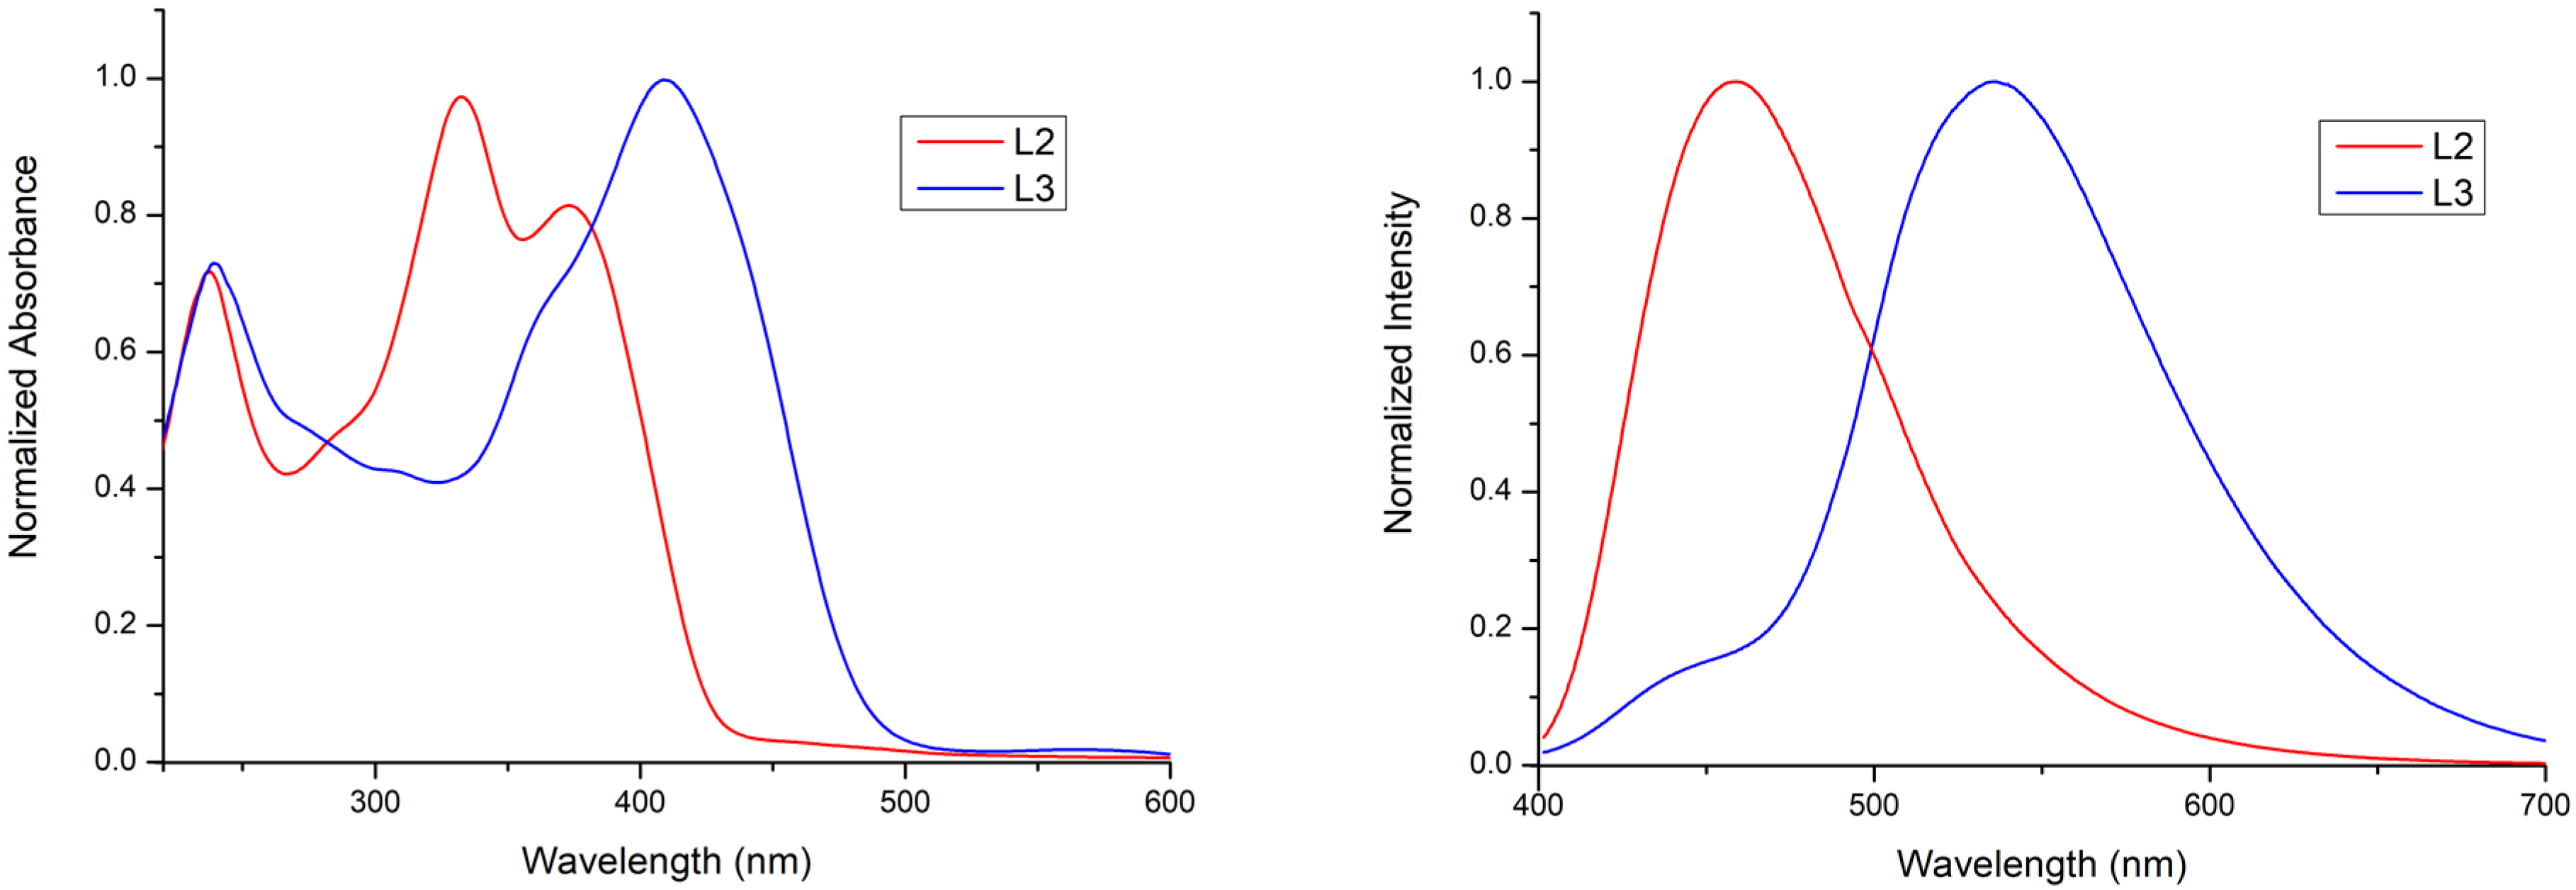
2.3. Optical-Photophysical Properties of Ligands in Solution

The optical and photophysical characteristics of ligand L1 were previously documented in our earlier work (λem = 433 nm, Φem = 6% in DCM) [17]. Figure 2 displays the UV-Vis and emission spectra of ligands L2 and L3 in CH2Cl2, with corresponding photophysical data outlined in Table 2. Both ligands exhibit absorption bands around 240 nm and within the 330–380 nm wavelength range. However, only L3 displays a noticeable absorption beyond 400 nm. The former is likely attributed to ligand-centered π → π* and n → π* transitions, while the characteristic band beyond 400 nm is probably associated with ILCT transitions. Ligands L2 and L3 demonstrate luminescence exclusively in solution (dichloromethane, RT). The relative photoluminescent quantum yields (Φem) calculated for L2 and L3 are 10% and 6%, respectively. The influence of altering the electron-donating substituent at position 4 of the styryl moiety is evident in the position of the emission band. L3, which contains the strongest donor (-NEt2), emits at a significantly lower energy compared to L1 and L2.

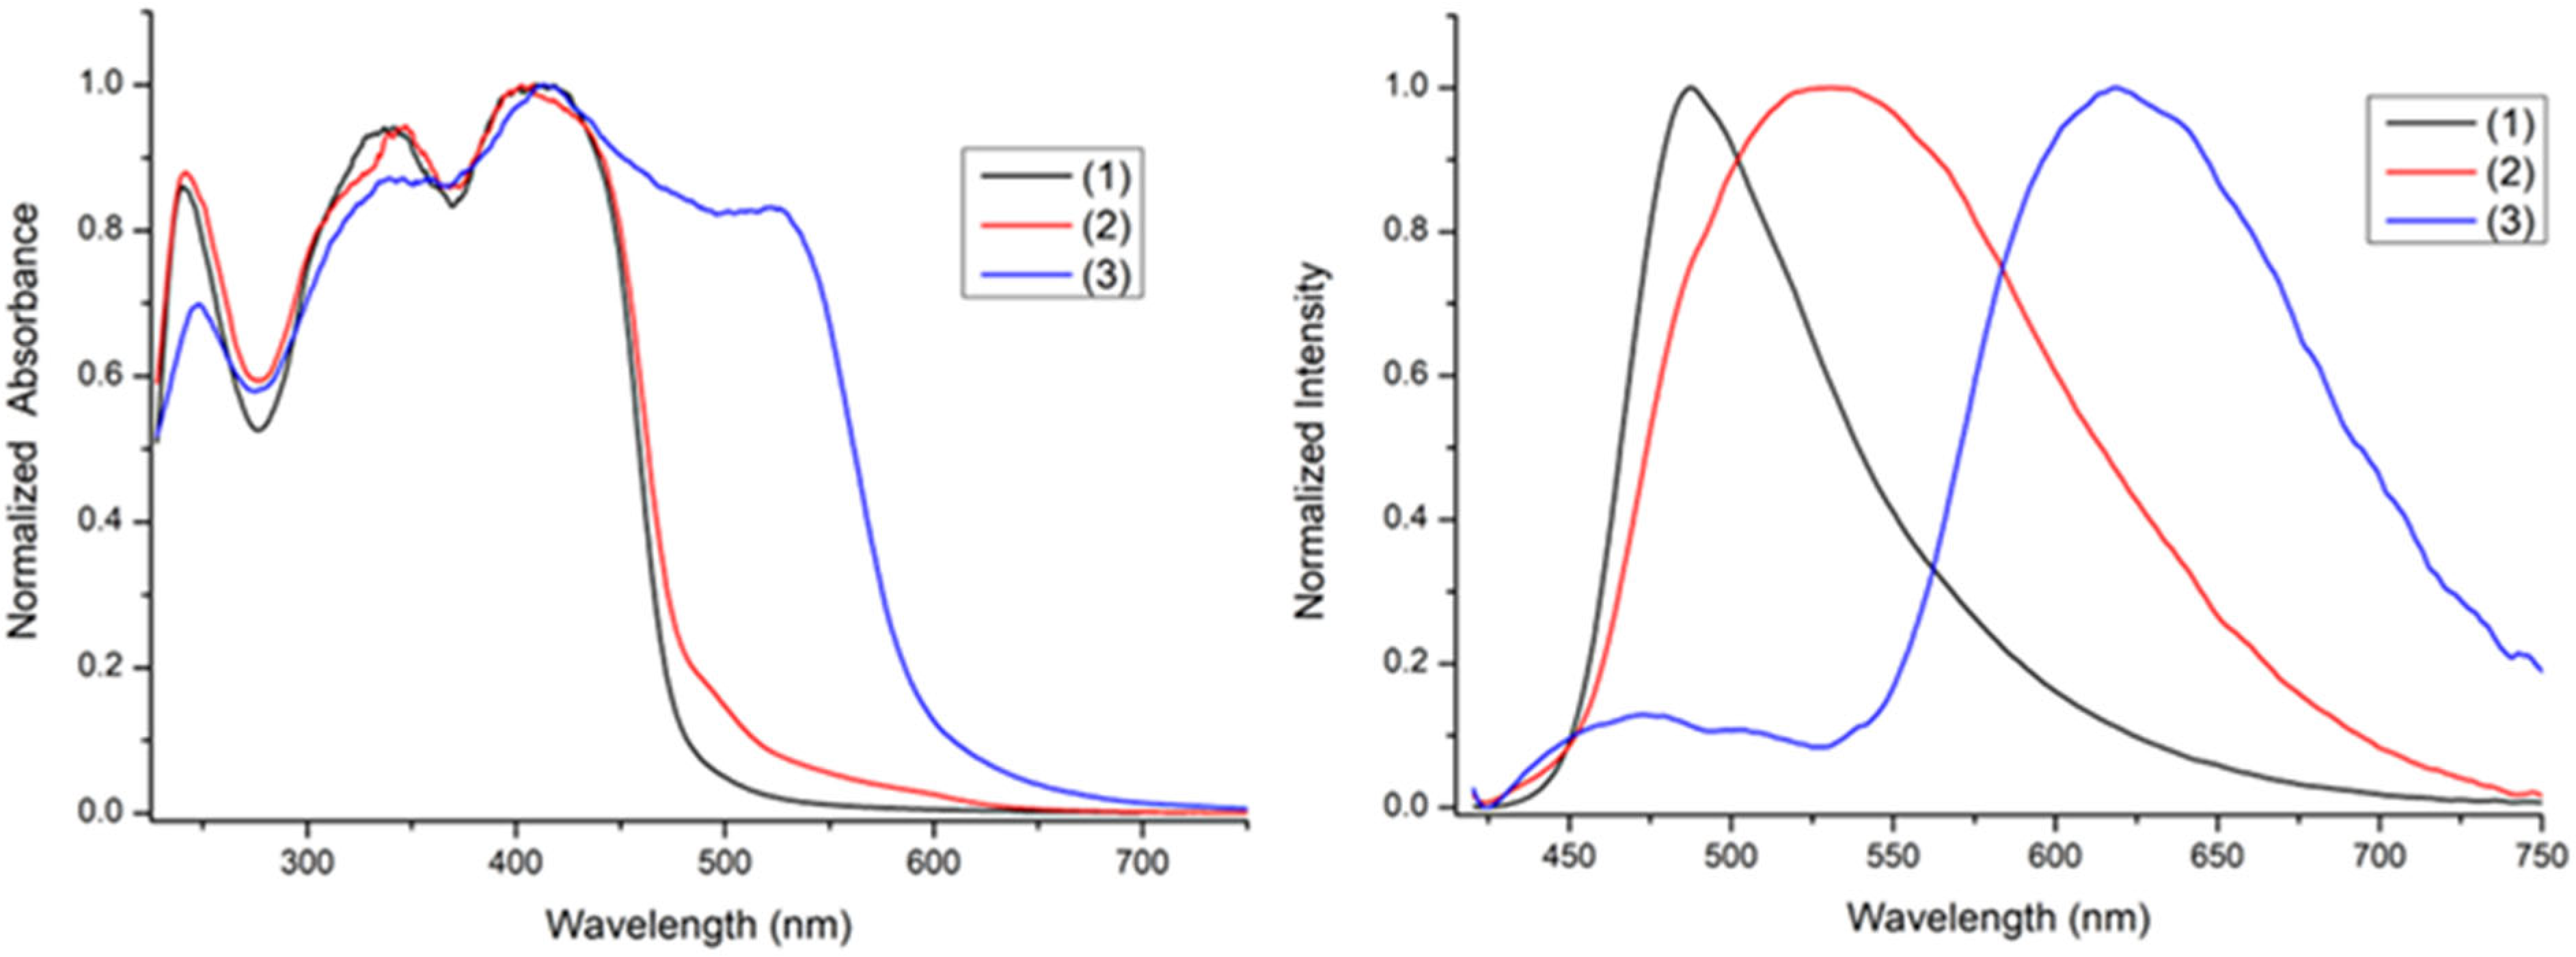
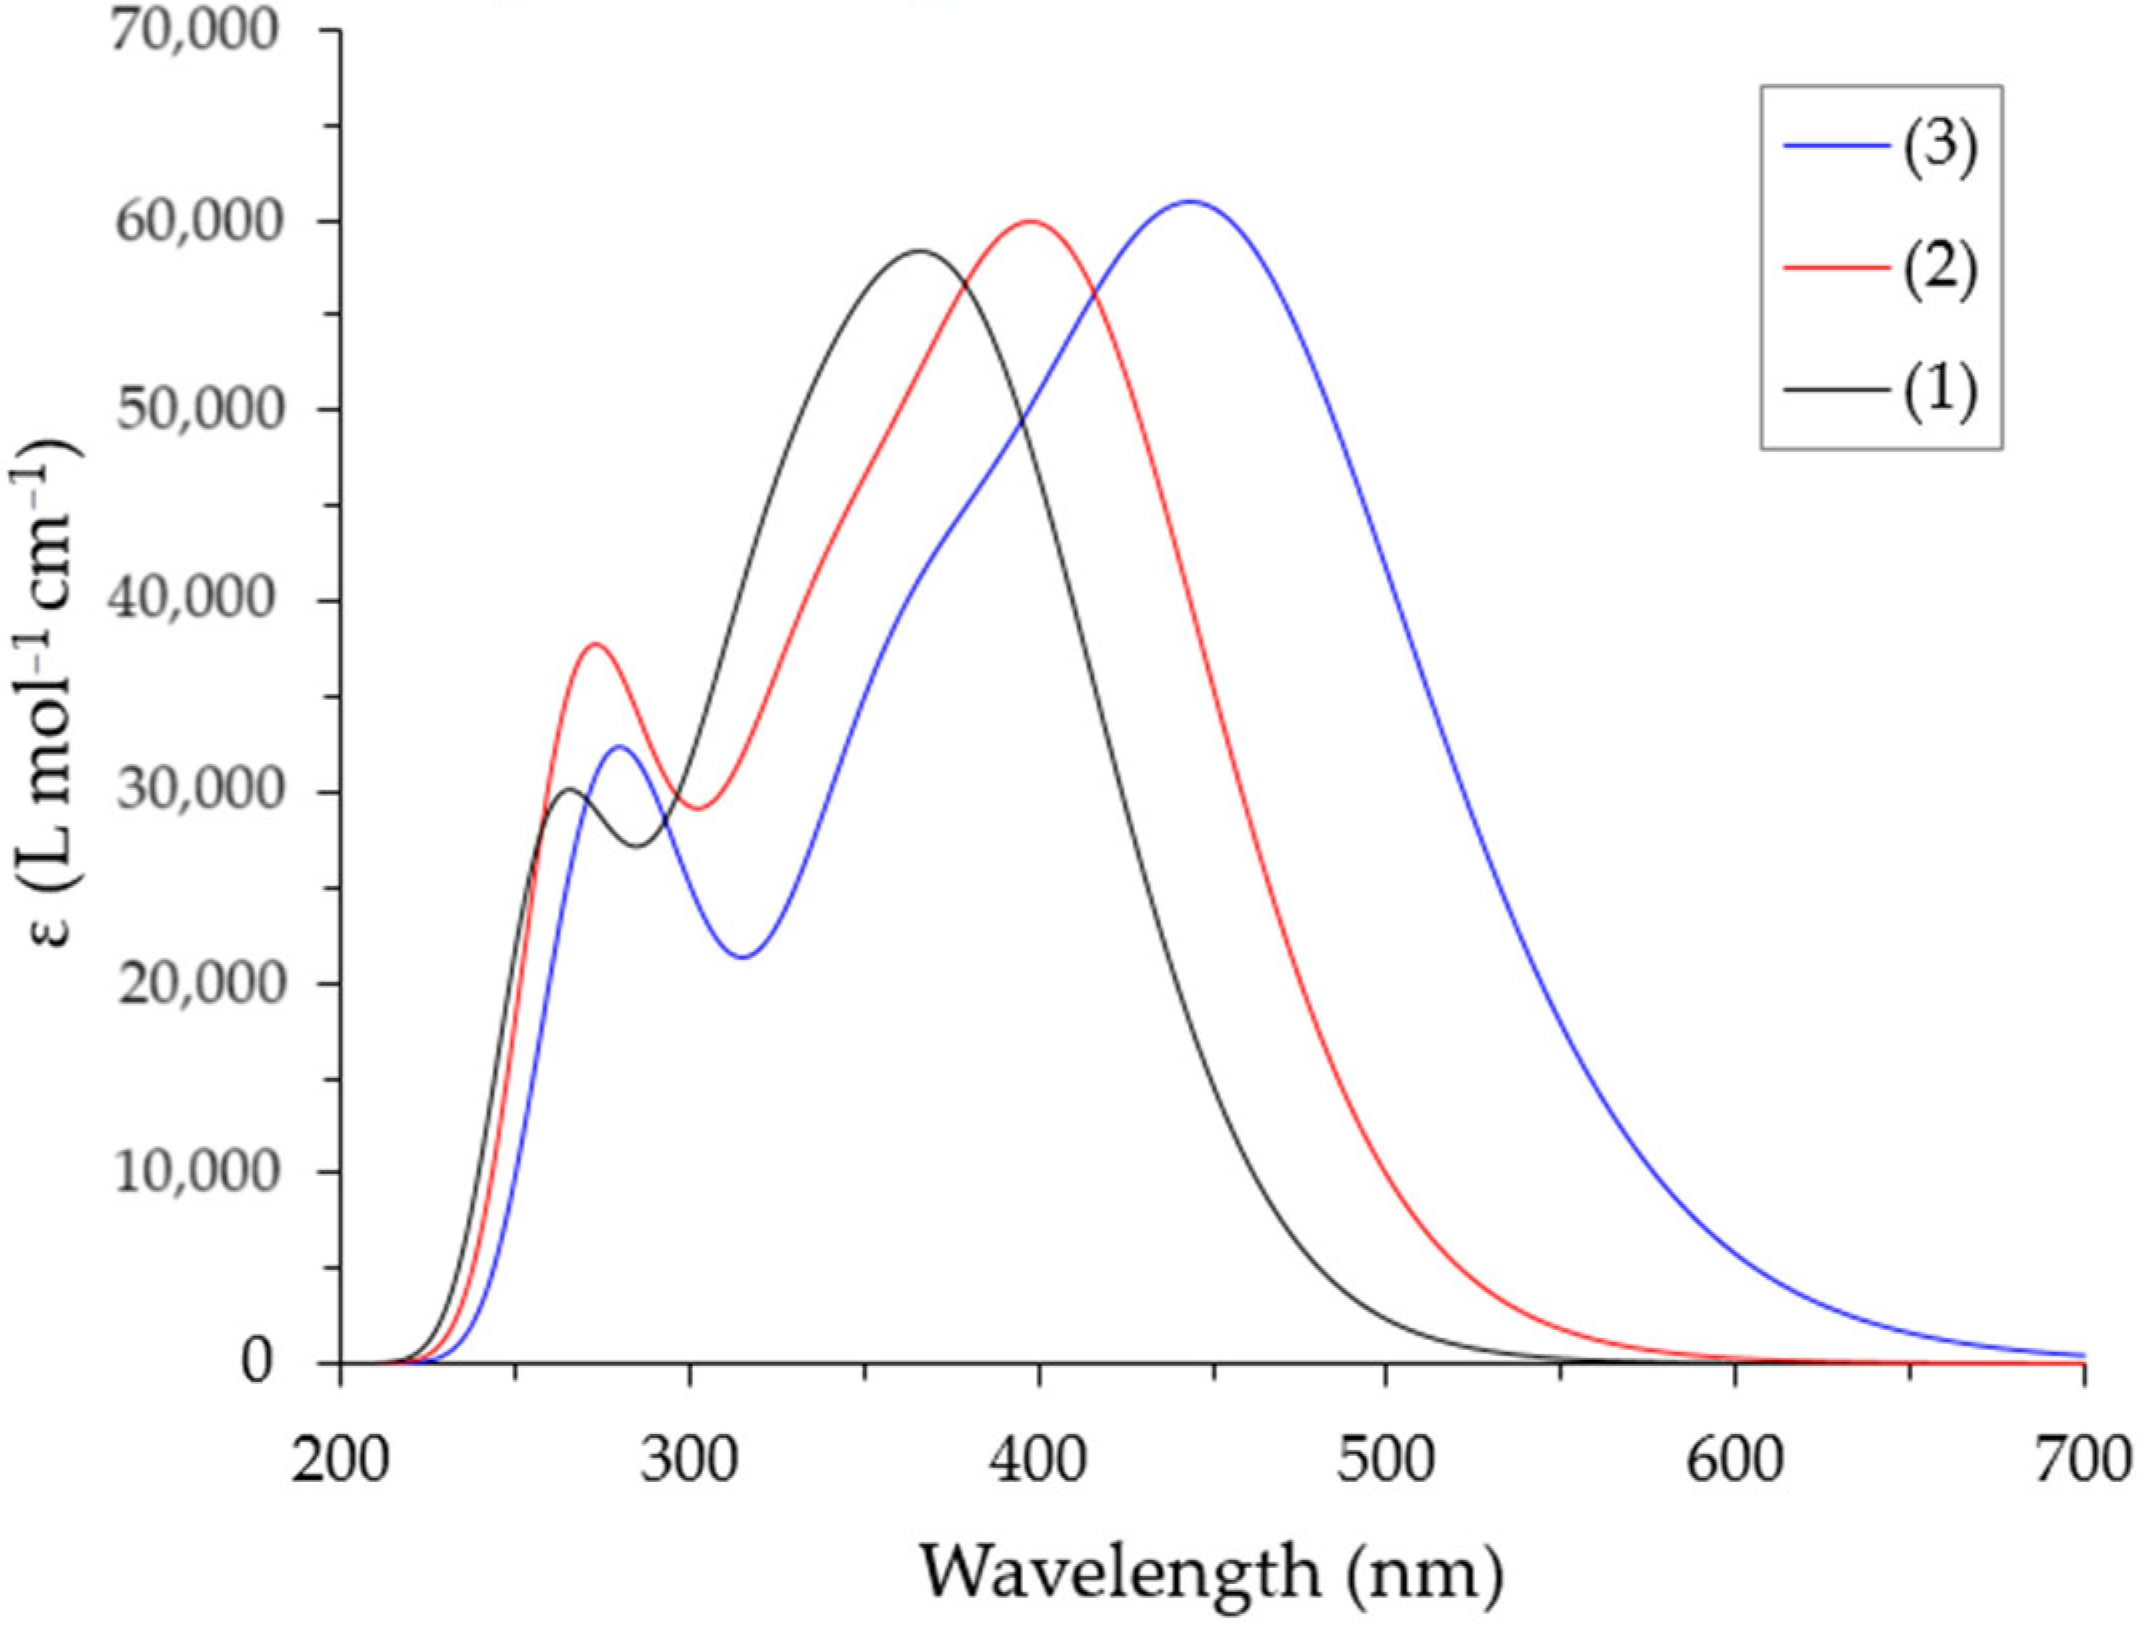
2.4. Optical Properties of Complexes in Solution

The UV-Vis and emission spectra of complexes in CH2Cl2 (10−5 M) at 298 K are depicted in Figure 3, and the corresponding absorption and photophysical data are summarized in Table 3.
The absorption characteristics of complexes 1 and 2 are nearly identical across the entire recorded wavelength region. Both exhibit absorption bands at 240 nm and within the 330–380 nm range, with no discernible absorption observed beyond 450 nm. The former is attributed to ligand-centered (LC) π → π* transitions, while the latter is expected to have a combined character of ligand-to-ligand charge transfer (LLCT) and metal-to-ligand charge transfer (MLCT). This behavior is commonly observed in [Ag (N^N)(P^P)] type complexes [20,21]. In contrast, the absorption spectrum of complex 3 is notably different. A strong band centered at λ = 450 nm is evident, possibly attributed to MLCT and ILCT (intraligand) transitions.
Complexes 1 and 2 display nearly identical emission wavelengths (λem). A slight red shift in the emission maxima of about 20 nm can be observed when transitioning from the –OMe to the –SMe derivative. However, the most notable difference lies in the quantum yield (Φem). Complex 2 shows an almost twofold increase in Φem (20%) compared to 1 (11%), suggesting a more efficient radiative relaxation of the excited state for the former.
Complex 3 displays a distinct emission spectrum profile. The strong electron-donating properties of diimine L3, attributed to the presence of the (-NEt2) group, effectively destabilize Ag(I) 4d orbitals, resulting in a 100 nm red-shift of the emission maximum compared to 1 and 2, with a Φem = 22%. Solution luminescence studies for mononuclear silver(I) complexes are limited, as most are only investigated in the solid state [20,21,22,23,24,25]. In this context, compounds 13 demonstrate superior photoluminescence characteristics in solution, which are easily tunable through the replacement of a single group present on the diimine ligand.

2.5. Luminescent Behavior in Solid State

The diffuse reflectance (DRS) and emission spectra (λexc = 350 nm) of the complexes obtained in the solid state are illustrated in Figure 4, with corresponding data listed in Table 3. The emission spectra of 1–3 exhibit broad and unstructured profiles, consistent with the expectations for luminescent Ag[(N^N)(P^P)]-type complexes [26,27,28,29]. The significant bathochromic shifts observed for λem (42–75 nm) when transitioning from solution to the solid state, particularly for complexes 2 and 3, may suggest the formation of excimers. As we will discuss later while examining the crystal structures of the compounds, the presence of C-H···π intermolecular interactions, with strength following the order 3 > 2 > 1, may account for this phenomenon [30,31]. Simultaneously, the Φem values for complexes 2 and 3 drop significantly compared to their solution states. This observation suggests that the excited dimers may undergo substantial energy loss, likely due to geometrical reorganization and/or Jahn–Teller distortion, in the excited state. Finally, it is noteworthy that complex 3, emitting at λem = 625 nm, represents a rare instance of an Ag(I) mononuclear red emitter [32,33,34,35].

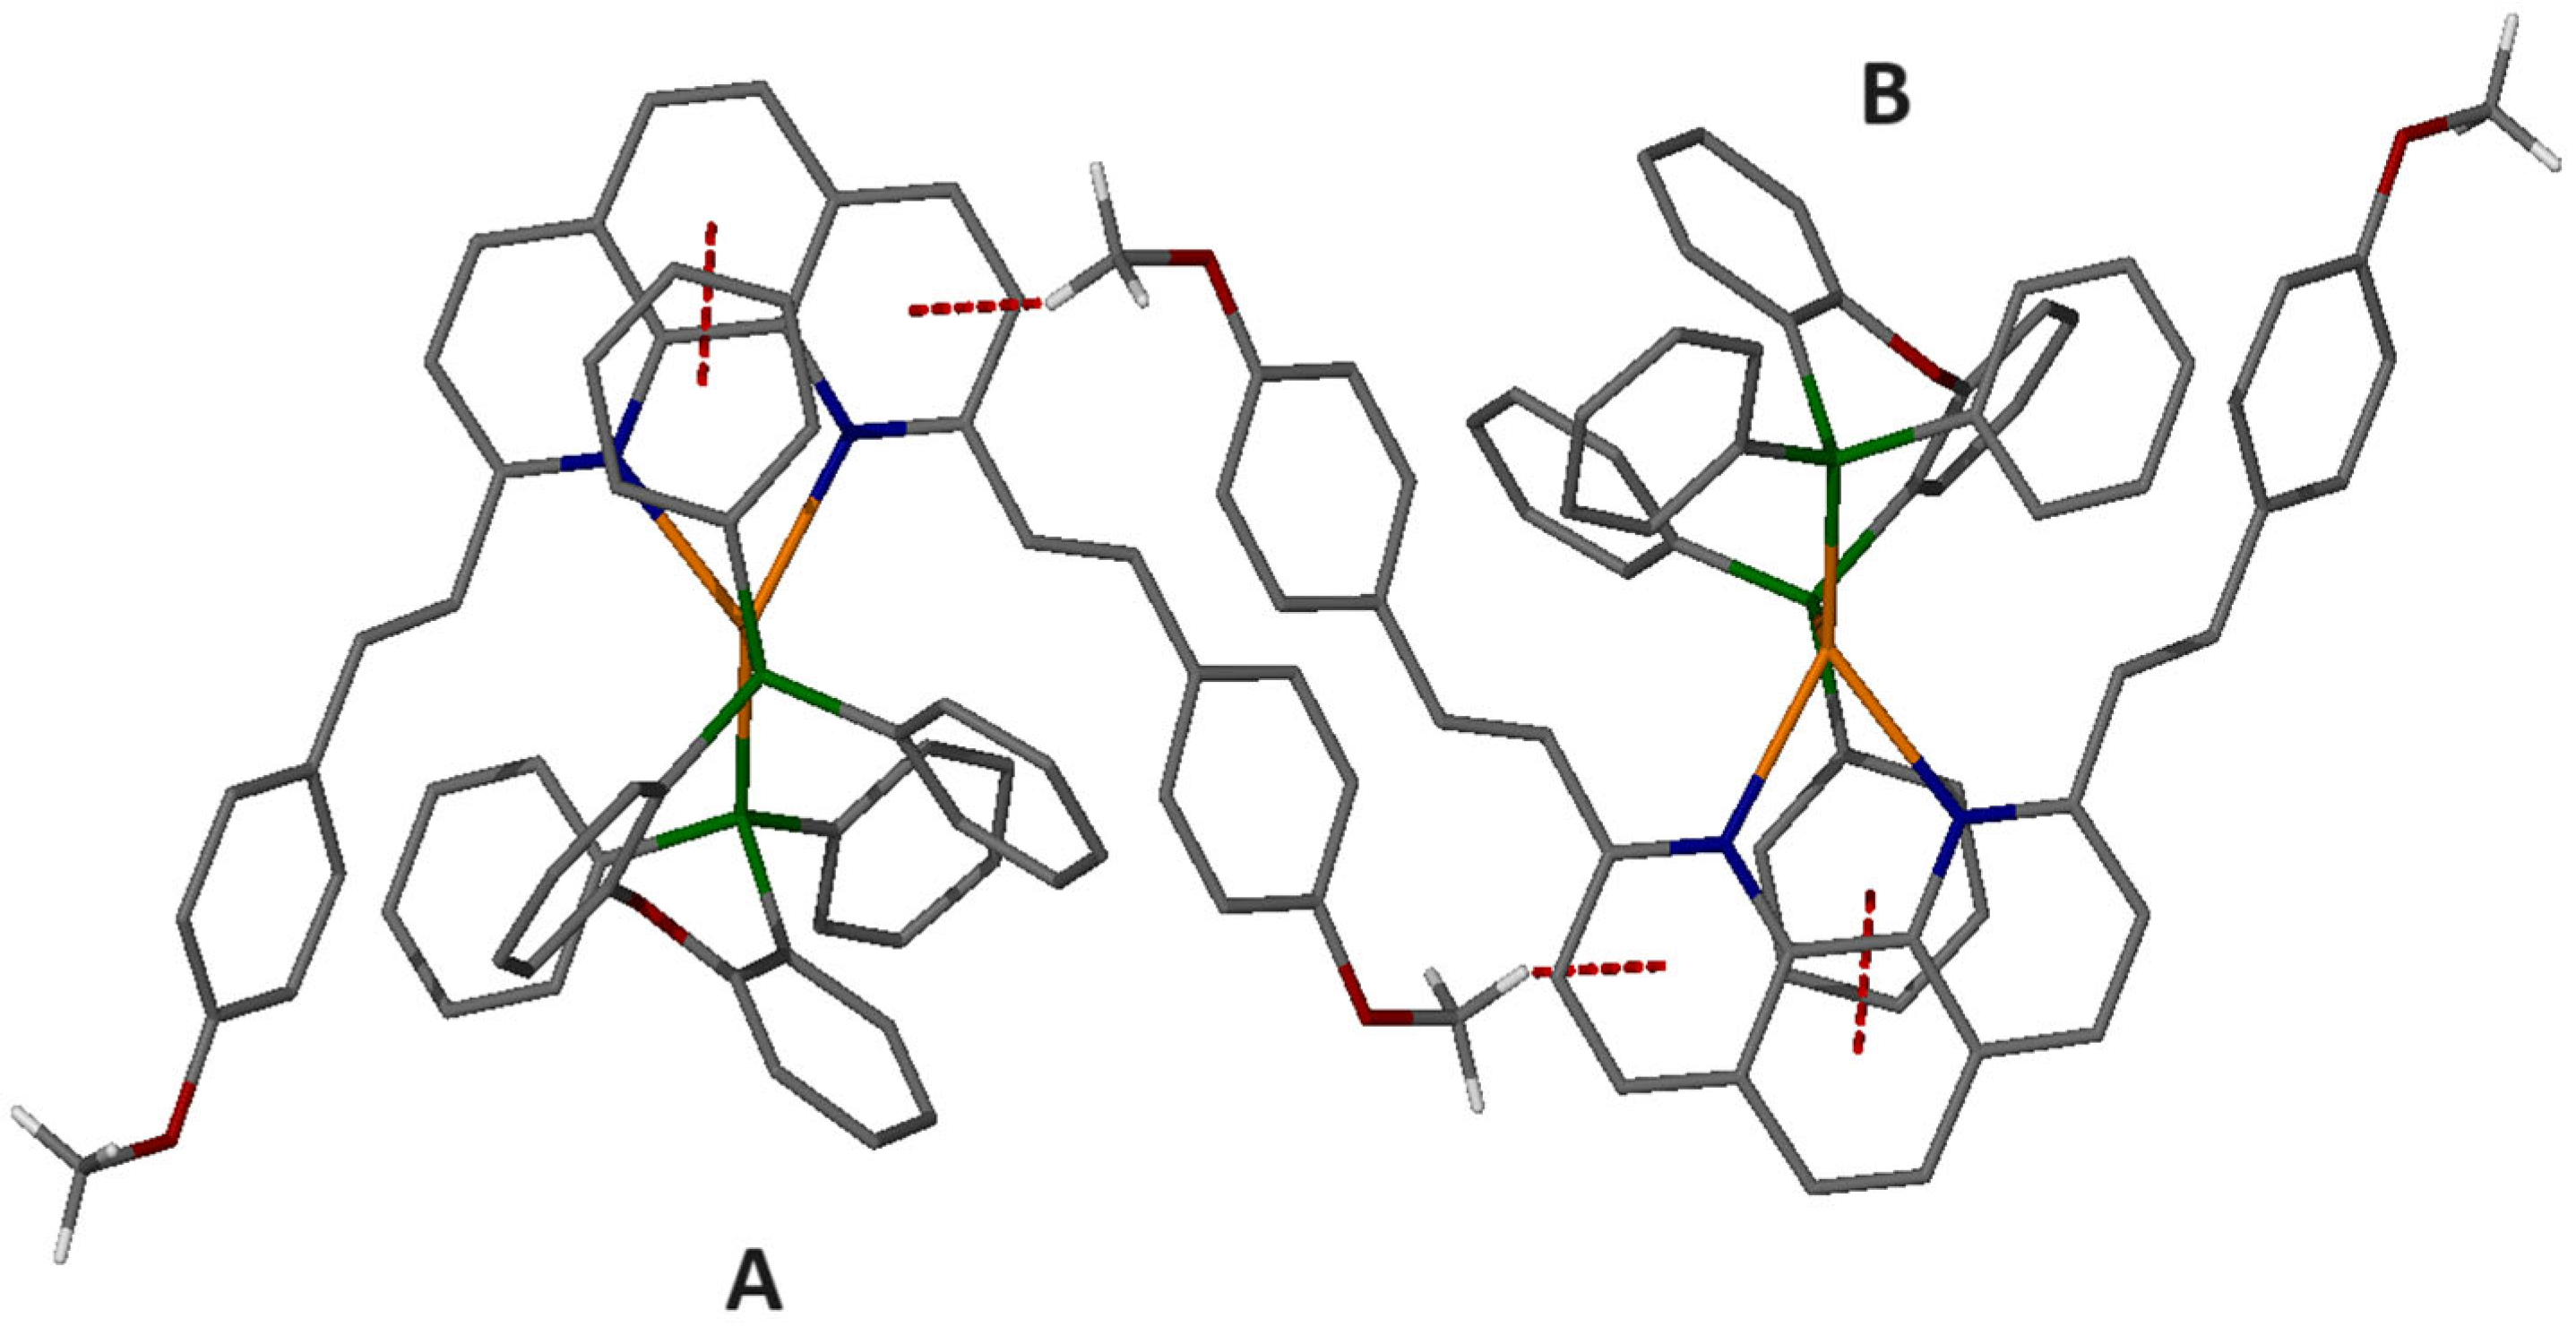
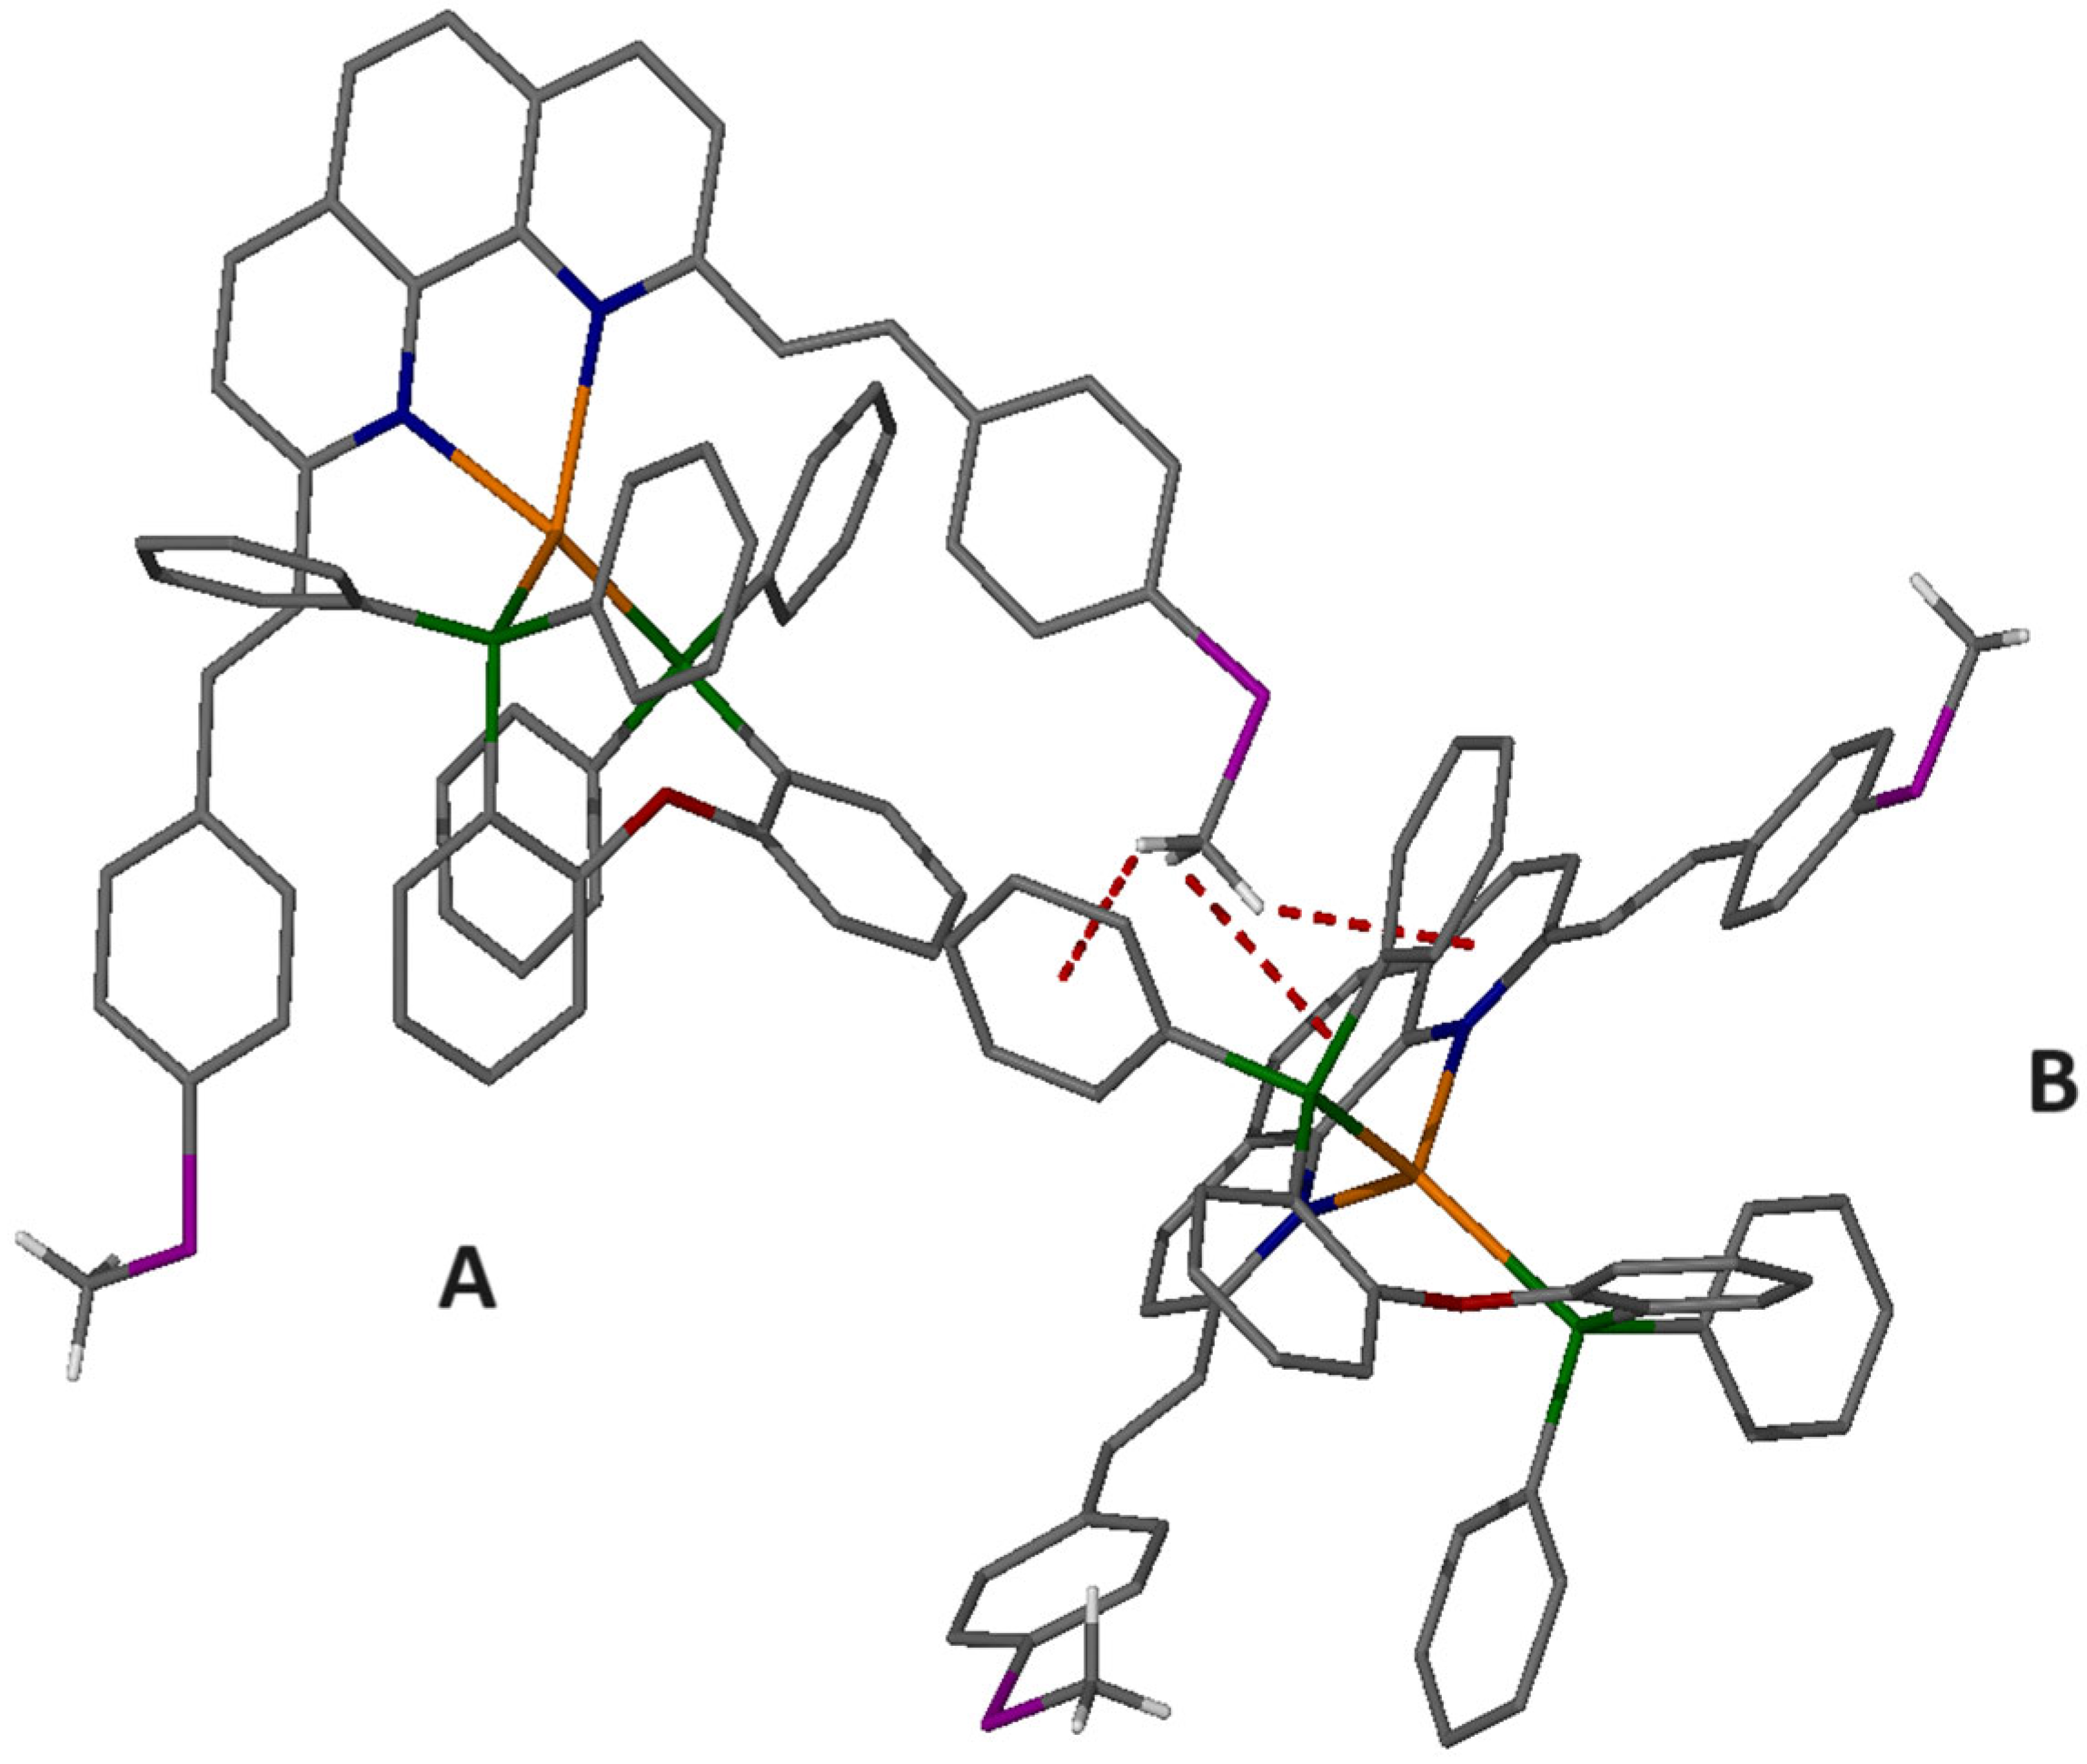
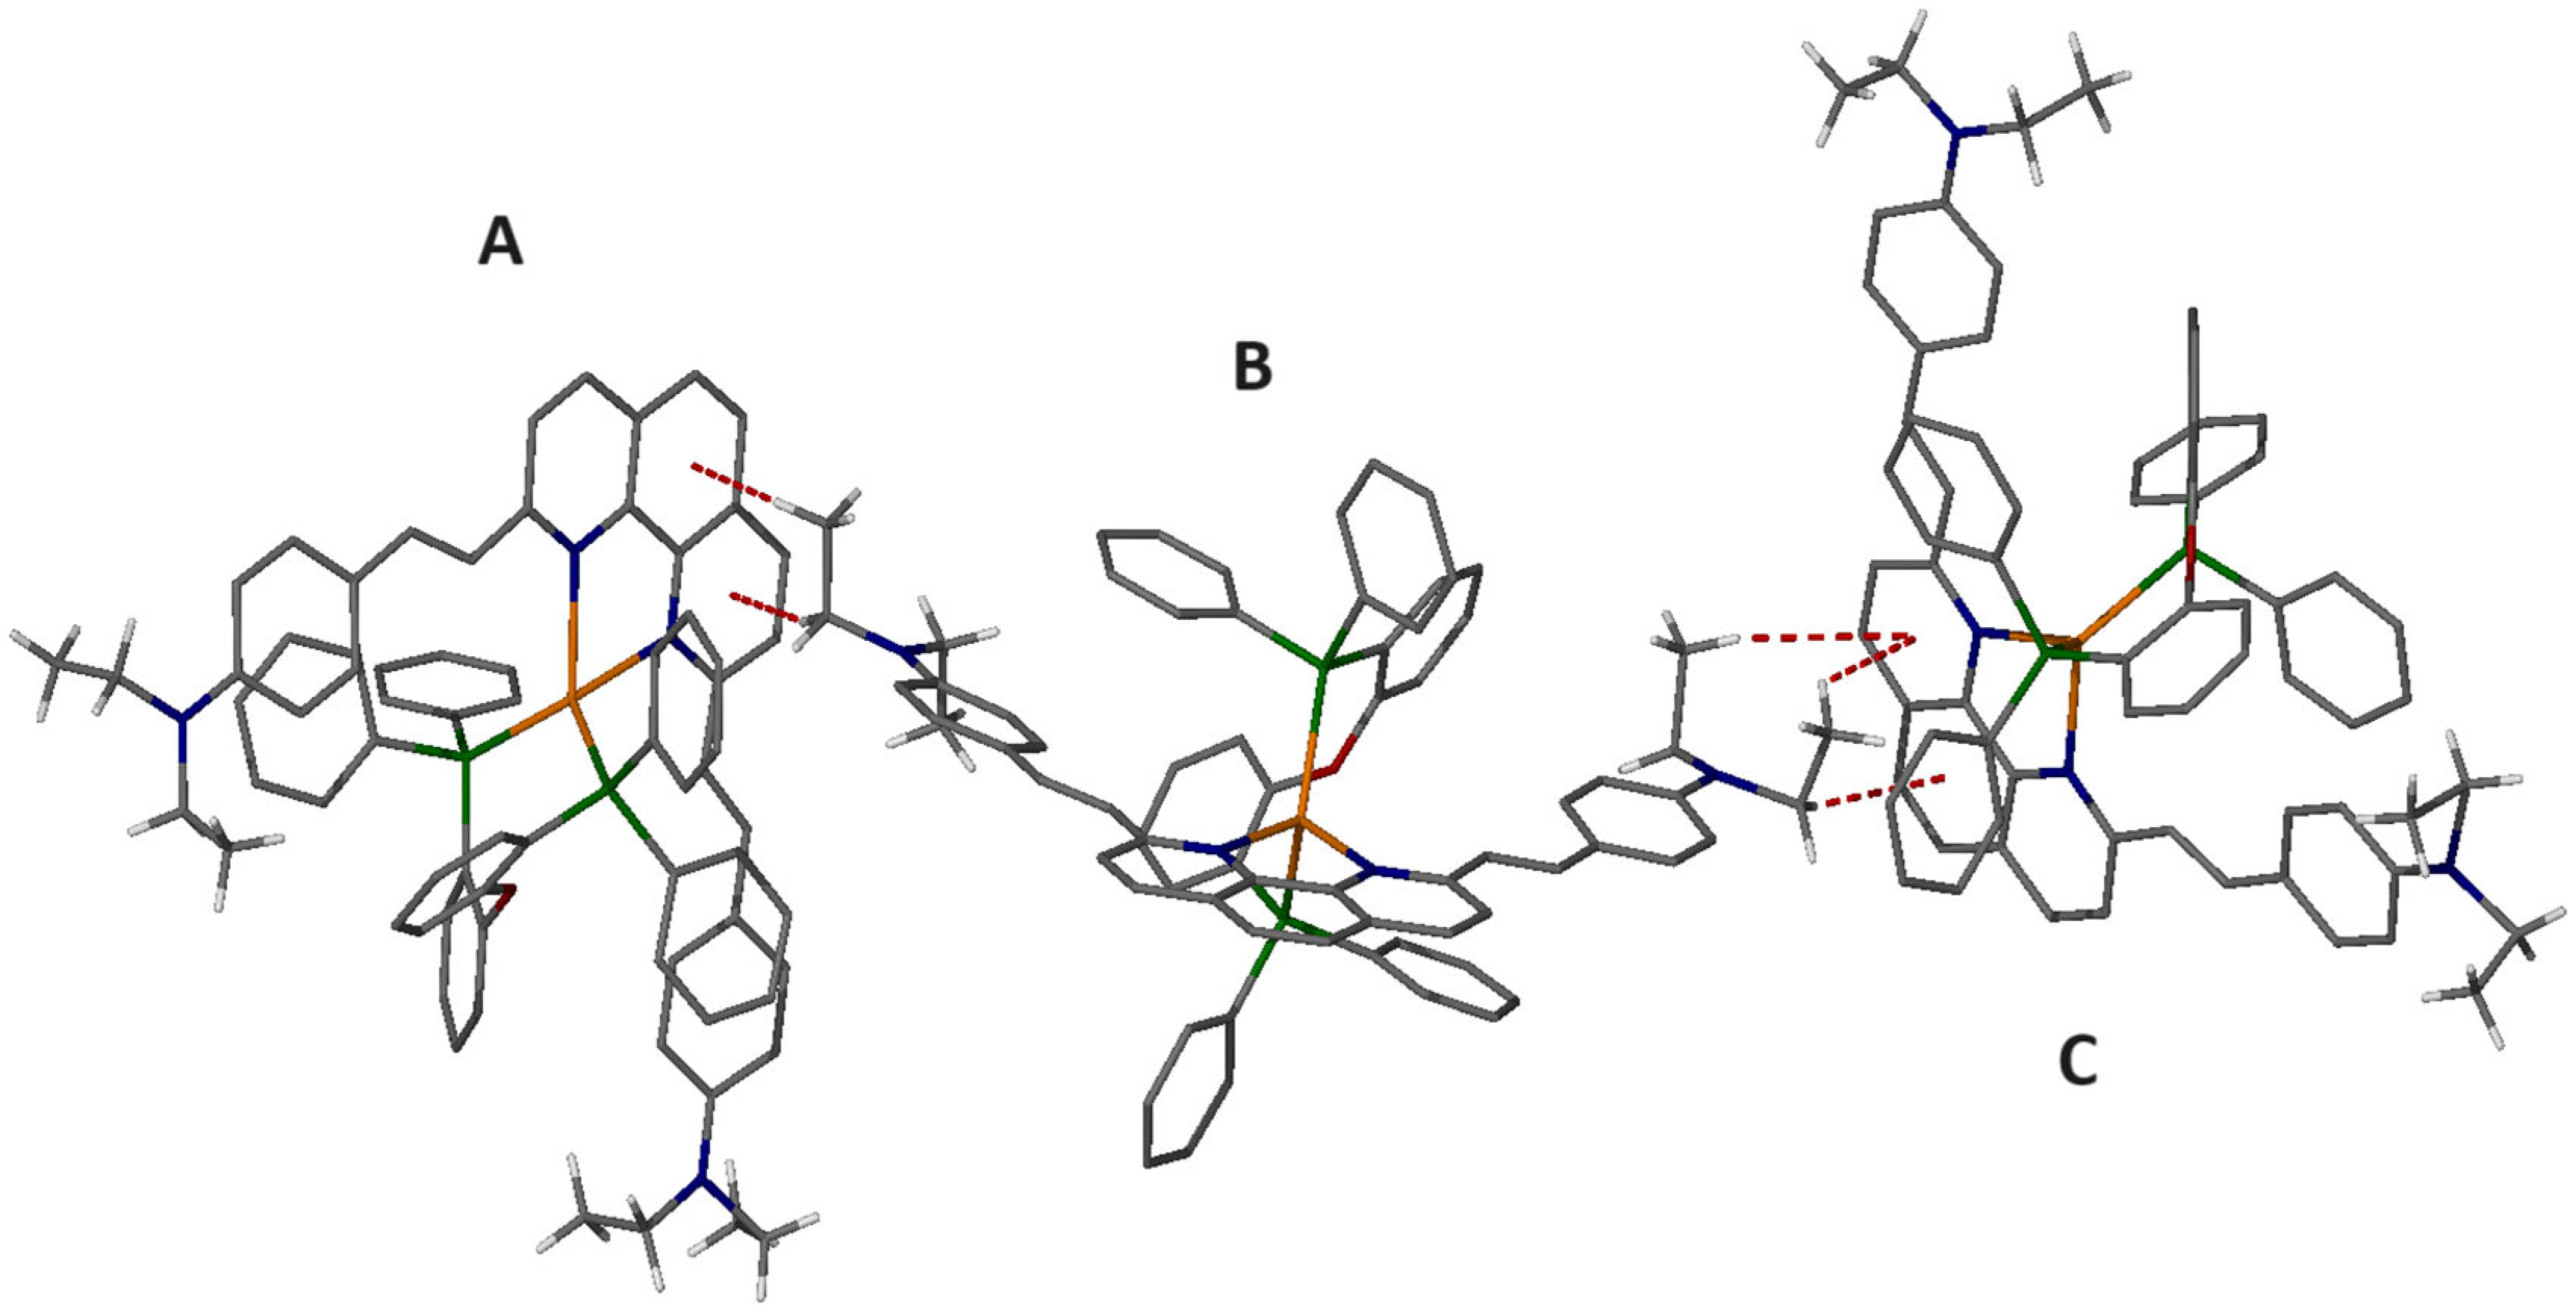
2.6. Single-Crystal Structure Analysis

High-quality X-ray crystals were obtained by introducing diethyl ether vapor into a solution of complexes. In instances where crystal growth posed challenges, various solvents and crystallization techniques were employed.
Compound 1 (PF6) crystallizes in the triclinic space group P-1. A visual representation of the cation’s structure, as well as a section of the packing, is presented in Figure 5. Important bond distances (in Å) and angles (in degrees) within the coordination sphere of Ag(I) in the cation are listed in Table 4.
Compound 2 crystallizes in the monoclinic space group P21/c. The asymmetric unit comprises the cation [AgL(POP)]+ and its corresponding counter-anion, BF4. A visual representation of the cation’s structure, as well as a section of the packing, can be found in Figure 6, while the structural characteristics are detailed in Table 5.
Compound 3 (PF6) crystallizes in the trigonal space group P 31 2 1. Figure 7 illustrates the cation geometry and a section of the packing. Values for the most significant bonds and angles are summarized in Table 6.
X-ray structural analysis revealed the formation of mononuclear heteroleptic complexes, where the silver(I) cation adopts a distorted tetrahedral environment with N2P2 coordination. Both the phenanthroline and diphosphine moieties act as chelating ligands. Notably, the POP ligand binds to the metal solely through its pair of P donor atoms, while the ether O atom remains at a nonbonding distance from the Ag(I) center (with Ag(1)−O(1) ranging from 3.173 to 3.199 Å). The bond distances of Ag–P and Ag–N, as well as the chelating angles N–Ag–N and P–Ag–P, exhibit typical values across all complexes [32,33,34,35].
Interestingly, π–π stacking interactions involving the phenathroline cores in the crystal lattice were not observed. Instead, C-H···π intermolecular interactions between –OMe, -SMe, -NEt2, and adjacent aromatic (phen/and or phenyl) rings predominate. It is noteworthy that the strength of these interactions follows the order –OMe (4.22 Å) < -SMe (3.30 Å) < -NEt2 (3.03 Å) (the reported values refer to the C-H···phen core distances).

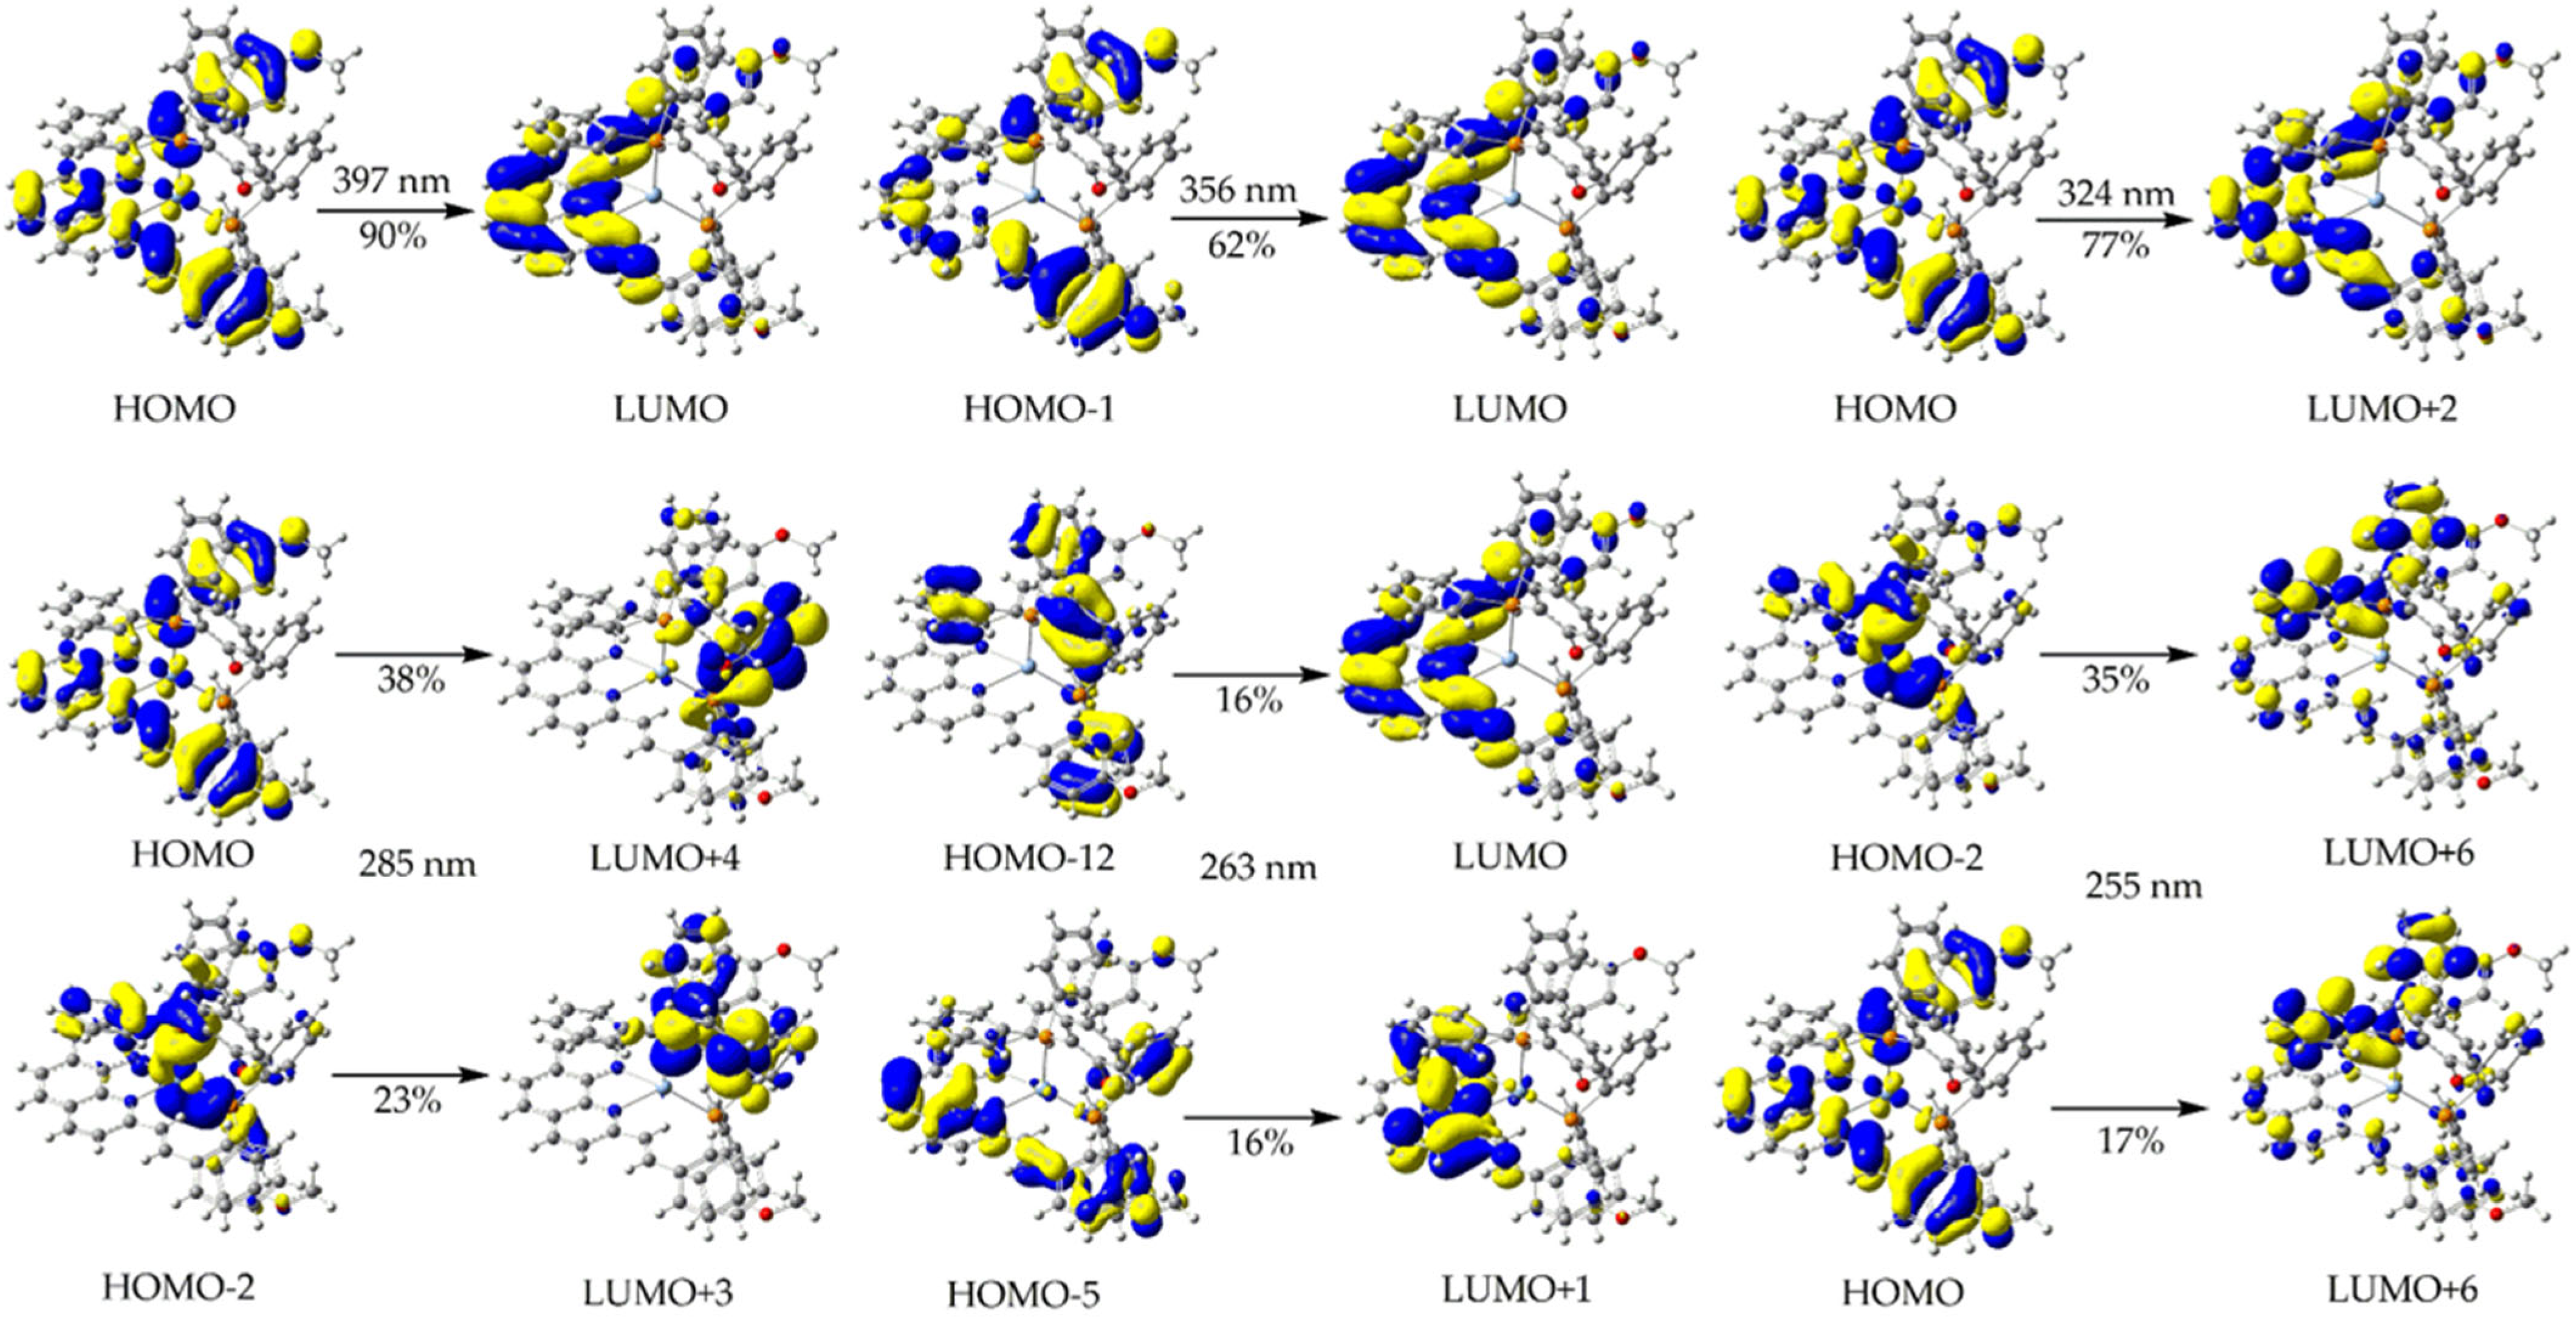
2.7. Computational Study

To obtain further insight into the photophysical properties of the new Ag(I) complexes under study, we employed TDDFT electronic structure calculations in order to simulate and assign their UV-Vis absorption spectra. The simulated absorption spectra of 13 in DCM are depicted in Figure 8.
Inspection of Figure 8 reveals that the simulated absorption spectra reproduce the respective experimentally recorded spectra of 13. Accordingly, the simulated spectra of 1 and 2 exhibit a low-energy band peaking at 370 and 400 nm, respectively, in excellent agreement with the experimental spectra showing peaks at 372 and 390 nm, respectively. In addition, the simulated spectra of 1 and 2 show high-energy bands in the region of 250–280 nm, in line with the respective experimental findings. On the other hand, the simulated absorption spectrum of 3 exhibits a low-energy band at 447 nm, in excellent agreement with the experiment, as well as a high-energy band peaking around 280 nm, in line with the experimental spectrum of 3. It should be noticed, however, that, although the simulated spectrum of 3 is qualitatively similar to those found for 1 and 2, there is a striking difference with respect to its low-energy band. Thus, the latter appears in the visible, being red-shifted by about 30–50 nm, as compared to the respective low-energy bands of 1 and 2, which in contrast appears in the ultraviolet. Let us now assign the UV-Vis spectra in terms of electronic excitations between MOs. In Table 7, the most intense electronic transitions corresponding to the two bands appearing in the absorption spectra of 13 in DCM are given.
Perusal of Table 7 reveals that the low-energy bands in the absorption spectra of 13 in DCM arise mainly from three electronic transitions. Thus, the band peaking around 350 nm in the absorption spectrum of 1 in DCM arises mainly from electronic transitions appearing at 397, 356, and 324 nm. The former is the most intense, and this is due to a HOMO to LUMO excitation. The other two electronic transitions are due to a combination of a multitude of electronic excitations involving the HOMO-1, HOMO, LUMO, LUMO + 1, and LUMO + 2 MOs. In Figure 9, the 3D isocontour surfaces of the MOs involved in the electronic excitations relevant to the electronic transitions related to the low-energy band around 350 nm are depicted in the simulated absorption of 1 in DCM. The MOs depicted in Figure 9 are mainly located on the ligands, with the exception of HOMO, which also exhibits a small localization on the metal. Therefore, the electronic transitions at 397 and 324 nm could be assigned as of Metal to Ligand Charge Transfer (MLCT), Intraligand (IL) and Ligand to Ligand Charge Trans-fer (LL’CT) mixed character (MLCT/IL/LL’CT). On the other hand, the electronic transition at 356 nm could be assigned as of IL/LL’CT character. Consequently, the band around 350 nm is assigned as of MLCT/IL/LL’CT character.
Next, the high-energy band around 250 nm, appearing in the simulated absorption spectrum of 1 in DCM, arises mainly from three electronic transitions at 285, 263, and 255 nm (Table 7). These electronic transitions are due to a multitude of electronic excitations which exhibit IL/LL’CT characters, and, accordingly, the band at 250 nm could assigned the same way (IL/LL’CT).
The low-energy band appearing around 400 nm in the simulated absorption spectrum of 2 in DCM arises mainly from three electronic transitions at 420, 400, and 358 nm. The former is almost solely due a HOMO to LUMO electronic excitation, which occurs on the diimine ligand (see Figure S17 of the Supporting Information). Thus, the electronic excitation at 420 nm is characterized as IL.
The electronic transition at 400 nm is basically due to a HOMO-1 to LUMO excitation, and is also characterized as IL (Figure S17). The same also holds true for the electronic transition at 358 nm, which is due to a HOMO-1 to LUMO + 1 excitation, both of which are located on the diimine ligand.
Next, the high-energy band appearing around 260 nm arises mainly from three electronic transitions at 299, 278, and 266 nm (Table 7). Based upon the shapes of the Mos, all these transitions exhibit IL character; therefore, the band at 260 nm is assigned as IL as well.
The absorption spectrum of 3 in DCM, as mentioned earlier (vide supra), is distinct compared to those found for the other two complexes under study, namely, 1 and 2. Accordingly, the low-energy band appears in the visible around 450 nm. This band arises from three electronic transitions at 471, 431, and 372 nm (Table 7). These electronic transitions are due to excitations involving HOMO-1, HOMO, LUMO, and LUMO + 2, which are located on the diimine ligands. Thus, the low-energy band at 450 nm could be assigned as IL (Figure S18).
Finally, the high-energy band around 270 nm appearing in the simulated absorption spectrum of 3 in DCM arises mainly from three electronic transitions at 306, 285, and 264 nm. Based upon the shapes of the MOs involved in these electronic transitions, the band at 270 nm could be assigned as IL.

3. Materials and Methods

3.1. Materials

All solvents were of analytical grade and used without further processing. AgBF4, AgPF6, POP, 4-methylthiobenzaldehyde, 4-diethylaminobenzaldehyde, and 4-anisaldehyde were purchased from Sigma-Aldrich (Burlington, MA, USA), while neocuproine was obtained from TCI Chemicals (Tokyo, Japan).

3.2. Methods

The instruments and procedures used for acquiring 1H, 13C{1H}, and 31P {1H} NMR spectra, ATR-IR spectra, and emission spectra (in both solution and solid state), as well as DRS and UV-Vis absorption spectra, were similar to those described previously [14,15,16,17,18]. The luminescence quantum yields of complexes 1, 2, and 3 in CH2Cl2 solutions were determined and calculated at room temperature using [Ru(bpy)3]Cl2 in water as the reference (Φem = 0.04) [36].

3.3. Crystal Structure Determination

Single crystals of complexes 13 were selected from crystallization solutions and mounted on a Bruker D8 Quest Eco diffractometer. Measurements were conducted using graphite-monochromatic Mo-Ka radiation (λ = 0.71073 Å) and a Photon II detector. The structure was solved using direct methods, and the ShelXle interface enabled full-matrix least-squares methodology to be used on F2. The SQUEEZE procedure of the PLATON program was utilized to remove disordered counter-anion molecules. Non-hydrogen atoms of the complexes were refined by anisotropic thermal parameters, while hydrogen atoms were refined by isotropic thermal parameters and constrained to ride on their parent atoms. X-Seed software (Version 4.10) was employed to generate molecular graphics [37,38,39,40,41,42].
In complex 3 (PF6), one ethyl group was found to be disordered, possibly due to its lack of interaction with other lattice constituents. Unfortunately, the counter-anion in this compound was severely disordered and could not be adequately modeled. As a final solution, it was eliminated using the SQUEEZE routine from the PLATON program.
Crystal data for 1 (PF6): C132H103Ag2F12N4O6P6, M = 2470.75, yellow polyhedral, 0.50 x 0.32 x 0.28 mm3, triclinic, space group P-1 (No. 2), a = 17.5294(8), b = 18.6280(9), c = 19.9345(9) Å, α = 70.918(3), β = 67.775(2), γ = 82.362(3)°, V = 5694.3(5) Å3, Z = 2, Dc = 1.441 g cm−3, F000 = 2526, Bruker D8 Eco with PHOTON II detector, MoKa radiation, λ = 0.71073 Å, T = 296(2) K, 2θmax = 50.0°, 230,911 reflections collected, 17,980 unique (Rint = 0.0793). Final GooF = 1.081, R1 = 0.0535, wR2 = 0.1339, R indices based on 13,600 reflections with I > 2σ(I) (refinement on F2), 1462 parameters, 0 restraints. Lp and absorption corrections applied, μ = 0.508 mm−1.
Crystal data for 2 (BF4): C66H52AgBF4N2OP2S2, M = 1209.83, yellow needle, 0.300 x 0.080 x 0.060 mm3, monoclinic, space group P21/c (No. 14), a = 14.2376(12), b = 20.6038(17), c = 20.3351(16) Å, β = 104.476(3)°, V = 5775.9(8) Å3, Z = 4, Dc = 1.391 g cm−3, F000 = 2480, Bruker D8 Eco with PHOTON II detector, MoKa radiation, λ = 0.71073 Å, T = 296(2) K, 2θmax = 50.0°, 185,416 reflections collected, 10,152 unique (Rint = 0.1269). Final GooF = 1.171, R1 = 0.0649, wR2 = 0.1077, R indices based on 7846 reflections with I > 2σ(I) (refinement on F2), 714 parameters, 0 restraints. Lp and absorption corrections applied, μ = 0.535 mm−1.
Crystal data for 3 (PF6): C72H66AgN4OP2, M = 1173.10, yellow block, 0.600 x 0.500 x 0.400 mm3, trigonal, space group P3121 (No. 152), a = 19.328(4), b = 19.328(4), c = 32.247(6) Å, V = 10,433(5) Å3, Z = 6, Dc = 1.120 g cm−3, F000 = 3666, Bruker D8 Eco with PHOTON II detector, MoKa radiation, λ = 0.71073 Å, T = 293(2) K, 2θmax = 50.1°, 127,376 reflections collected, 12,286 unique (Rint = 0.0360). Final GooF = 1.079, R1 = 0.0366, wR2 = 0.0804, R indices based on 11,128 reflections with I > 2σ(I) (refinement on F2), 743 parameters, 64 restraints. Lp and absorption corrections applied, μ = 0.377 mm−1.
CCDC2344379, CCDC2344380 and CCDC2344381 contain the supplementary crystallographic data for this paper. These data can be obtained free of charge via https://www.ccdc.cam.ac.uk/structures/? (accessed on 29 March 2024).

3.4. Computational Details

The TDDFT calculations were performed employing the Gaussian16W software (Version C.02) [43] using the 1997 hybrid functional of Perdew, Burke, and Ernzerhof [44,45,46,47,48,49]. This functional uses 25% exchange and 75% weighting correlation and is denoted as PBE0. The LANL2TZ basis set was used for the Ag atoms, while for non-metal atoms, we employed the 6-31G(d,p) basis set. The TDDFT calculations were performed for the S0 ground state using the structures obtained from X-ray analysis and taking into account 50 excited states. Solvent effects were calculated using the Polarizable Continuum Model (PCM) with the integral equation formalism variant (IEF-PCM), which is the default method of G16W (self-consistent reaction field (SCRF)) [50], while Dichloromethane (DCM) was used as the solvent.

3.5. Synthesis of Complexes

  • [Ag(L1)(POP)][BF4] (1)
For this step, 0.1 mmol of POP was added to a solution containing 0.1 mmol of AgBF4 in CH2Cl2/MeOH (5:1 v/v) at room temperature. The mixture was stirred for 2 h. Following this, L1 was introduced, and stirring continued for an additional 2 h. The solvents were then evaporated under vacuum. The resulting yellow solid residue was isolated and dried, yielding 78%.
C66H52AgBF4N2O3P2: 1H NMR (500 MHz, CDCl3) (ppm): 8.44 (d, J = 8.5 Hz, 2H); 8.24 (d, J = 8.6 Hz, 2H); 7.84 (s, 2H); 7.49 (d, J = 16.3 Hz, 4H); 7.42 (d, J = 16.3 Hz, 4H); 7.05–7.23 (m, 18H); 6.92 (t, J = 7.5 Hz, 8H); 6.85 (d, J = 8.6 Hz, 4H); 6.74 (d, J = 7.9 Hz, 2H); 6.65 (d, J = 8.6 Hz, 4H); 3.89 (s, 6H). 13C NMR (125 MHz, CDCl3) (ppm): 160.5; 157.9; 155.7; 143.1; 138.3; 137; 134; 132.8; 131.9; 130.1; 129; 128.5; 127.9; 127.5; 126.3; 124.87, 120.2; 119.3; 114; 55.4. 31P NMR (101.25 MHz), CDCl3) (ppm): −8.21 (dd, J(109Ag-31P) = 407 Hz, J(107Ag-31P) = 353 Hz).
HR ESI-MS: m/z = 1091.2487 for [Ag(L1)POP)]+ (Figure S19).
  • [Ag(L2)(POP)][BF4] (2)
The synthetic procedure for compound 1 was followed, employing L2 instead (orange solid, yield 70%).
C66H52AgBF4N2O1S2P2: 1H NMR (500 MHz, CDCl3) (ppm): 8.48 (d, J = 8.5 Hz, 2H); 8.29 (d, J = 8.6 Hz, 2H); 7.86 (s, 2H); 7.52 (d, J = 16.3 Hz, 4H); 7.48 (d, J = 16.3 Hz, 4H); 7.02–7.25 (m, 19H); 6.96 (d, J = 8.3 Hz, 4H); 6.91 (t, 8H); 6.82 (d, J = 8.3 Hz, 4H); 6.73 (m, 2H); 2.56 (s, 6H). 13C NMR (125 MHz, CDCl3) (ppm): 157.9; 155.3; 143.1; 140.2; 138.5; 136.8; 134.1; 133.7; 132.8; 131.9; 130.2; 129; 128.8; 127.8; 126.5, 125.8; 124.8; 120.52; 119.2; 15.4. 31P NMR (101.25 MHz), CDCl3) (ppm): −8.20 (dd, J(109Ag-31P) = 407 Hz, J(107Ag-31P) = 353 Hz).
HR ESI-MS: m/z = 1121.2020 for [Ag(L2)(POP)]+ (Figure S20).
  • [Ag(L3)(POP)][BF4] (3)
The synthetic procedure for compound 1 was followed, employing L3 instead (red solid, yield 68%).
C72H66AgBF4N4OP2: 1H NMR (500 MHz, CDCl3) (ppm): 8.32 (d, J = 8.6 Hz, 2H); 8.14 (d, J = 8.6 Hz, 2H); 7.77 (s, 2H); 7.40 (d, J = 16.1 Hz, 4H); 7.31 (d, J = 16.3 Hz, 4H); 6.88–7.20 (m, 28H); 6.71 (d, J = 8.6 Hz, 4H); 6.32 (d, J = 7.9 Hz, 4H); 3.43 (q, J = 7.0 Hz, 8H); 1.25 (t, J = 7.1 Hz, 12H). 13C NMR (125 MHz, CDCl3) (ppm): 157.76; 156.26; 148.44; 143.25; 137.6; 134.2; 132.9; 131.8; 130; 129.2; 128.5; 128; 125.6; 124.85; 124.4; 122.2; 119.6; 118.9; 111.18; 44.6; 12.6. 31P NMR (101.25 MHz), CDCl3) (ppm): −8.63 (dd, J(109Ag-31P) = 405 Hz, J(107Ag-31P) = 353 Hz).
HR ESI-MS: m/z = 1173.3764 for [Ag(L3)(POP)]+ (Figure S21).

4. Conclusions

In summary, we successfully synthesized and characterized three new Ag(I) heteroleptic complexes of the Ag(N^N)(P^P) type, which contain 2,9-Bis(styryl)-1,10- phenanthroline ligands and the diphosphine POP. X-ray crystallography revealed that Ag(I) adopts a distorted tetrahedral geometry formed by two chelating nitrogen (N^N) and two phosphorus (P^P) atoms. This structural arrangement persists in solution, as indicated by the NMR data.
Compounds 13 exhibit superior photoluminescence properties in solution compared to the majority of the reported examples. These properties are easily modifiable by replacing a single group on the diimine ligand. However, a different luminescent behavior was observed in the solid state, characterized by large bathochromic shifts and poor emissive properties, possibly due to the formation of excimers. Notably, compound 3 is a rare example of an Ag(I) red emitter in the solid state.
We intend to extend our studies towards optimizing the photophysical properties of similar compounds and fully elucidating the emission mechanism.

Supplementary Materials

The following supporting information can be downloaded at: https://www.mdpi.com/article/10.3390/inorganics12050131/s1, Synthesis and NMR-MS data for ligands L2 and L3. Figures S1–S3: ATR-IR spectra of complexes 1–3, respectively; Figure S4: 1H-NMR spectrum of L2 (500 MHz, CDCl3, 298 K); Figure S5: 13C-NMR spectrum of L2 (500 MHz, CDCl3, 298 K); Figure S6: 1H-NMR spectrum of L3 (500 MHz, CDCl3, 298 K); Figure S7: 13C-NMR spectrum of L3 (500 MHz, CDCl3, 298 K); Figure S8: 1H-NMR spectrum of 1 (500 MHz, CDCl3, 298 K); Figure S9: 13C-NMR spectrum of 1 (500 MHz, CDCl3, 298 K); Figure S10: 1H-1H COSY NMR spectrum of 1 (500 MHz, CDCl3, 298 K); Figure S11: 1H-NMR spectrum of 2 (500 MHz, CDCl3, 298 K); Figure S12: 13C-NMR spectrum of 2 (500 MHz, CDCl3, 298 K); Figure S13: 1H-1H COSY NMR spectrum of 2 (500 MHz, CDCl3, 298 K); Figure S14: 1H-NMR spectrum of 3 (500 MHz, CDCl3, 298 K); Figure S15: 13C-NMR spectrum of 3 (500 MHz, CDCl3, 298 K); Figure S16: 1H-1H COSY NMR spectrum of 3 (500 MHz, CDCl3, 298 K); Figure S17: 3D contour plots of the MOs involved in the electronic excitations giving rise to the two bands appearing in the simulated absorption spectra of 2 calculated at the PBE0/LANL2TZ(Ag)U6-31G(d,p) level of theory in DCM solvent; Figure S18: 3D contour plots of the MOs involved in the electronic excitations giving rise to the two bands appearing in the simulated absorption spectra of 3 calculated at the PBE0/LANL2TZ(Ag)U6-31G(d,p) level of theory in DCM solvent; Figure S19: HR-ESI-MS spectrum of the fragment [AgL]+ 1 (top) and theoretical spectrum; Figure S20: HR-ESI-MS spectrum of the fragment [AgL]+ 2 (top) and theoretical spectrum; Figure S21: HR-ESI-MS spectrum of the fragment [AgL]+ 3 (top) and theoretical spectrum; Figure S22: HR-ESI-MS spectrum of the fragment [L2 + H+]+ (top) and theoretical spectrum; Figure S23: HR-ESI-MS spectrum of the fragment [L3 + H+]+ (top) and theoretical spectrum; File S1: gm7_23_a_sq (*.cif file); File S2: gm7_23_a_sq (checkcif, pdf file); File S3: GM16_22B_0m (*.cif file); File S4: GM16_22B_0m (checkcif, pdf file); File S5: GM31_23_0m_a (*.cif file); File S5: GM31_23_0m_a (checkcif, pdf file).

Author Contributions

Conceptualization: G.M.; supervision: G.M.; formal analysis: D.G. and J.C.P.; investigation: D.G.; computational study: A.C.T.; X-ray crystallography: J.C.P. and D.G.; writing—original draft: D.G.; writing—review and editing: G.M. and J.C.P. All authors have read and agreed to the published version of the manuscript.

Funding

This research received no external funding.

Data Availability Statement

The information provided in this research is accessible in both the article and its Supplementary Materials. CCDC2344379, CCDC2344380, and CCDC2344381 contain the supplementary crystallographic data for this paper. These data can be obtained free of charge via https://www.ccdc.cam.ac.uk/structures/ (accessed on 29 March 2024). All other data in this study can be found in the Supplementary Materials.

Acknowledgments

The authors would like to thank the Network of Research Supporting Laboratories at the University of Ioannina for providing access to the use of NMR, ESI-MS, and X-ray diffraction facilities.

Conflicts of Interest

The authors declare no conflicts of interest.

References

  1. Fernández-Moreira, V.; Thorp-Greenwood, F.L.; Coogan, M.P. Application of D6 Transition Metal Complexes in Fluorescence Cell Imaging. Chem. Commun. 2010, 46, 186–202. [Google Scholar] [CrossRef]
  2. Yam, V.W.W.; Wong, K.M.C. Luminescent Metal Complexes of D6, D8 and d 10 Transition Metal Centres. Chem. Commun. 2011, 47, 11579–11592. [Google Scholar] [CrossRef]
  3. Lo, K.K.-W.; Choi, A.W.; Law, W.H.-T. Applications of Luminescent Inorganic and Organometallic Transition Metal Complexes as Biomolecular and Cellular Probes. Dalton Trans. 2012, 41, 6021. [Google Scholar] [CrossRef]
  4. Min, J.; Zhang, Q.; Sun, W.; Cheng, Y.; Wang, L. Neutral Copper(i) Phosphorescent Complexes from Their Ionic Counterparts with 2-(2′-Quinolyl)Benzimidazole and Phosphine Mixed Ligands. Dalton Trans. 2011, 40, 686–693. [Google Scholar] [CrossRef]
  5. Zhang, Q.; Ding, J.; Cheng, Y.; Wang, L.; Xie, Z.; Jing, X.; Wang, F. Novel Heteroleptic Cu1 Complexes with Tunable Emission Color for Efficient Phosphorescent Light-Emitting Diodes. Adv. Funct. Mater. 2007, 17, 2983–2990. [Google Scholar] [CrossRef]
  6. Takeda, H.; Kobayashi, A.; Tsuge, K. Recent Developments of Photoactive Cu(I) and Ag(I) Complexes with Diphosphine and Related Ligands. Coord. Chem. Rev. 2022, 470, 214700. [Google Scholar] [CrossRef]
  7. Shafikov, M.Z.; Czerwieniec, R.; Yersin, H. Ag(i) Complex Design Affording Intense Phosphorescence with a Landmark Lifetime of over 100 Milliseconds. Dalton Trans. 2019, 48, 2802–2806. [Google Scholar] [CrossRef]
  8. Shafikov, M.Z.; Suleymanova, A.F.; Czerwieniec, R.; Yersin, H. Thermally Activated Delayed Fluorescence from Ag(I) Complexes: A Route to 100% Quantum Yield at Unprecedentedly Short Decay Time. Inorg. Chem. 2017, 56, 13274–13285. [Google Scholar] [CrossRef]
  9. Zuideveld, M.A.; Swennenhuis, B.H.G.; Boele, M.D.K.; Guari, Y.; Van Strijdonck, G.P.F.; Reek, J.N.H.; Kamer, P.C.J.; Goubitz, K.; Fraanje, J.; Lutz, M.; et al. The Coordination Behaviour of Large Natural Bite Angle Diphosphine Ligands towards Methyl and 4-Cyanophenylpalladium(II) Complexes. J. Chem. Soc. Dalton Trans. 2002, 11, 2308–2317. [Google Scholar] [CrossRef]
  10. Freixa, Z.; Van Leeuwen, P.W.N.M. Bite Angle Effects in Diphosphine Metal Catalysts: Steric or Electronic? Dalton Trans. 2003, 10, 1890–1901. [Google Scholar] [CrossRef]
  11. Flecken, F.; Grell, T.; Hanf, S. Transition Metal Complexes of the PPO/POP Ligand: Variable Coordination Chemistry and Photo-Luminescence Properties. Dalton Trans. 2022, 51, 8975–8985. [Google Scholar] [CrossRef]
  12. Zhao, Y.H.; Li, H.Y.; Young, D.J.; Cao, X.; Zhu, D.L.; Ren, Z.G.; Li, H.X. Heteroleptic Copper(i) Complexes [Cu(Dmp)(N^P)]BF4 for Photoinduced Atom-Transfer Radical Addition Reactions. Dalton Trans. 2023, 52, 8142–8154. [Google Scholar] [CrossRef]
  13. Beaudelot, J.; Oger, S.; Peruško, S.; Phan, T.A.; Teunens, T.; Moucheron, C.; Evano, G. Photoactive Copper Complexes: Properties and Applications. Chem. Rev. 2022, 122, 16365–16609. [Google Scholar] [CrossRef]
  14. Glykos, D.; Plakatouras, J.C.; Malandrinos, G. Bis(2-Phenylpyridinato,-C2′,N)[4,4′-Bis(4-Fluorophenyl)-6,6′-Dimethyl-2,2′-Bipyridine] Iridium(III) Hexafluorophosphate. Molbank 2023, 2023, 4–11. [Google Scholar] [CrossRef]
  15. Kouvatsis, P.; Glykos, D.; Plakatouras, J.C.; Malandrinos, G. [6-(Furan-2-Yl)-2,2′-Bipyridine]Bis(Triphenylphosphine) Copper(I) Tetrafluoroborate. Molbank 2023, 2023, M1724. [Google Scholar] [CrossRef]
  16. Glykos, D.; Plakatouras, J.C.; Malandrinos, G. [4,4′-Bis(4-Fluorophenyl)-6,6′-Dimethyl-2,2′-Bipyridine] [Bis (2-(Diphenylphosphino) Phenyl) Ether] Silver(I) Hexafluorophosphate. Molbank 2023, 2023, M1675. [Google Scholar] [CrossRef]
  17. Glykos, D.; Plakatouras, J.C.; Malandrinos, G. Solution-State Studies, X-Ray Structure Determination and Luminescence Properties of an Ag(I) Heteroleptic Complex Containing 2,9-Bis(Styryl)-1,10-Phenanthroline Derivative and Triphenylphosphine. Inorganics 2023, 11, 467. [Google Scholar] [CrossRef]
  18. Kouvatsis, P.; Glykos, D.; Plakatouras, J.C.; Malandrinos, G. [6-(Thiophen-2-Yl)-2,2′-Bipyridine]Bis(Triphenylphosphine) Copper(I) Tetrafluoroborate. Molbank 2023, 2023, M1605. [Google Scholar] [CrossRef]
  19. Bonaccorso, C.; Cesaretti, A.; Elisei, F.; Mencaroni, L.; Spalletti, A.; Fortuna, C.G. New Styryl Phenanthroline Derivatives as Model D−π−A−π−D Materials for Non-Linear Optics. ChemPhysChem 2018, 19, 1917–1929. [Google Scholar] [CrossRef]
  20. Sun, L.Z.; Kuang, X.N.; Lin, S.; Zhao, L.; Yu, X.; Li, Z.F.; Liu, M.; Xin, X.L.; Yang, Y.P.; Jin, Q.H. Nine Heteroleptic Copper(I)/Silver(I) Complexes Prepared from Phosphine and Diimine Ligands: Syntheses, Structures and Terahertz Spectra. Polyhedron 2020, 175, 114177. [Google Scholar] [CrossRef]
  21. Zhang, Y.R.; Cui, Y.Z.; Jin, Q.H.; Yang, Y.P.; Liu, M.; Li, Z.F.; Bi, K.L.; Zhang, C.L. Syntheses, Structural Characterizations and Terahertz Spectra of Ag(I)/Cu(I) Complexes with Bis[2-(Diphenylphosphino)Phenyl]Ether and N^N Ligands. Polyhedron 2017, 122, 86–98. [Google Scholar] [CrossRef]
  22. Wu, Z.; Cui, S.; Zhao, Z.; He, B.; Li, X.L. Photophysical Properties of Homobimetallic Cu(i)-Cu(i) and Heterobimetallic Cu(i)-Ag(i) Complexes of 2-(6-Bromo-2-Pyridyl)-1H-Imidazo[4,5-f][1,10]Phenanthroline. New J. Chem. 2022, 46, 8881–8891. [Google Scholar] [CrossRef]
  23. Kaeser, A.; Delavaux-Nicot, B.; Duhayon, C.; Coppel, Y.; Nierengarten, J.F. Heteroleptic Silver(I) Complexes Prepared from Phenanthroline and Bis-Phosphine Ligands. Inorg. Chem. 2013, 52, 14343–14354. [Google Scholar] [CrossRef]
  24. Moudam, O.; Tsipis, A.C.; Kommanaboyina, S.; Horton, P.N.; Coles, S.J. First Light-Emitting Electrochemical Cell with [Ag(i)(N^N)(P^P)] Type Complex. RSC Adv. 2015, 5, 95047–95053. [Google Scholar] [CrossRef]
  25. Wang, Y.; Kuang, X.N.; Cui, Y.Z.; Xin, X.L.; Han, H.L.; Liu, M.; Yang, Y.P.; Jin, Q.H. Synthesis, Structure, Luminescent Properties, and Photocatalytic Behavior of 0D–3D Silver(I) Complexes Bearing Both Diphosphine Ligands and 1,10-Phenanthroline Derivatives. Polyhedron 2018, 155, 135–143. [Google Scholar] [CrossRef]
  26. Lipinski, S.; Cavinato, L.M.; Pickl, T.; Biffi, G.; Pöthig, A.; Coto, P.B.; Fernández-Cestau, J.; Costa, R.D. Dual-Phosphorescent Heteroleptic Silver(I) Complex in Long-Lasting Red Light-Emitting Electrochemical Cells. Adv. Opt. Mater. 2023, 11, 2203145. [Google Scholar] [CrossRef]
  27. Teng, T.; Li, K.; Cheng, G.; Wang, Y.; Wang, J.; Li, J.; Zhou, C.; Liu, H.; Zou, T.; Xiong, J.; et al. Lighting Silver(I) Complexes for Solution-Processed Organic Light-Emitting Diodes and Biological Applications via Thermally Activated Delayed Fluorescence. Inorg. Chem. 2020, 59, 12122–12131. [Google Scholar] [CrossRef]
  28. Nemati Bideh, B.; Shahroosvand, H.; Nazeeruddin, M.K. High-Efficiency Deep-Red Light-Emitting Electrochemical Cell Based on a Trinuclear Ruthenium(II)–Silver(I) Complex. Inorg. Chem. 2021, 60, 11915–11922. [Google Scholar] [CrossRef]
  29. Beliaeva, M.; Belyaev, A.; Grachova, E.V.; Steffen, A.; Koshevoy, I.O. Ditopic Phosphide Oxide Group: A Rigidifying Lewis Base to Switch Luminescence and Reactivity of a Disilver Complex. J. Am. Chem. Soc. 2021, 143, 15045–15055. [Google Scholar] [CrossRef]
  30. Wang, C.; Li, Z. Molecular Conformation and Packing: Their Critical Roles in the Emission Performance of Mechanochromic Fluorescence Materials. Mater. Chem. Front. 2017, 1, 2174–2194. [Google Scholar] [CrossRef]
  31. Yuan, M.-S.; Du, X.; Xu, F.; Wang, D.-E.; Wang, W.-J.; Li, T.-B.; Tu, Q.; Zhang, Y.; Du, Z.; Wang, J. Aggregation-Induced Bathochromic Fluorescent Enhancement for Fluorenone Dyes. Dye Pigment 2015, 123, 355–362. [Google Scholar] [CrossRef]
  32. Jia, J.H.; Liang, D.; Yu, R.; Chen, X.L.; Meng, L.; Chang, J.F.; Liao, J.Z.; Yang, M.; Li, X.N.; Lu, C.Z. Coordination-Induced Thermally Activated Delayed Fluorescence: From Non-TADF Donor-Acceptor-Type Ligand to TADF-Active Ag-Based Complexes. Chem. Mater. 2020, 32, 620–629. [Google Scholar] [CrossRef]
  33. Balakrishna, M.S.; Venkateswaran, R.; Mobin, S.M. Mixed-Ligand Silver(I) Complexes Containing Bis[2-(Diphenylphosphino)Phenyl]Ether and Pyridyl Ligands. Inorganica Chim. Acta 2009, 362, 271–276. [Google Scholar] [CrossRef]
  34. Cui, Y.Z.; Yuan, Y.; Han, H.L.; Li, Z.F.; Liu, M.; Jin, Q.H.; Yang, Y.P.; Zhang, Z.W. Synthesis, Characterization, and Luminescent Properties of Silver(I) Complexes Based on Diphosphine Ligands and 2,9-Dimethyl-1,10-Phenanthroline. Z. Anorg. Allg. Chem. 2016, 642, 953–959. [Google Scholar] [CrossRef]
  35. Wang, Y.; Cui, Y.Z.; Li, Z.F.; Liu, M.; Yang, Y.P.; Zhang, Z.W.; Xin, X.L.; Jin, Q.H. Synthesis, Characterization, and Luminescent Properties of Silver(I) Complexes Based on Diphosphine Ligands and 6,7-Dicyanodipyridoquinoxaline. Z. Anorg. Allg. Chemie 2017, 643, 1253–1261. [Google Scholar] [CrossRef]
  36. Ishida, H.; Tobita, S.; Hasegawa, Y.; Katoh, R.; Nozaki, K. Recent Advances in Instrumentation for Absolute Emission Quantum Yield Measurements. Coord. Chem. Rev. 2010, 254, 2449–2458. [Google Scholar] [CrossRef]
  37. APEX 3; SAINT, SHELXT 2016; Bruker AXS Inc.: Madison, WI, USA, 2016.
  38. Sheldrick, G.M. SADABS 1996; University of Göttingen: Göttingen, Germany.
  39. Sheldrick, G.M. Crystal Structure Refinement with SHELXL. Acta Crystallogr. Sect. C Struct. Chem. 2015, 71, 3–8. [Google Scholar] [CrossRef]
  40. Hübschle, C.B.; Sheldrick, G.M.; Dittrich, B. ShelXle: A Qt Graphical User Interface for SHELXL. J. Appl. Crystallogr. 2011, 44, 1281–1284. [Google Scholar] [CrossRef]
  41. Spek, A.L. Structure Validation in Chemical Crystallography. Acta Crystallogr. Sect. D Biol. Crystallogr. 2009, 65, 148–155. [Google Scholar] [CrossRef]
  42. Barbour, L.J. X-Seed—A Software Tool for Supramolecular Crystallography. J. Supramol. Chem. 2001, 1, 189–191. [Google Scholar] [CrossRef]
  43. Frisch, M.J.; Trucks, G.W.; Schlegel, H.B.; Scuseria, G.E.; Robb, M.A.; Cheeseman, J.R.; Scalmani, G.; Barone, V.; Petersson, G.A.; Nakatsuji, H.; et al. Gaussian 16W, Revision C.01; Gaussian, Inc.: Wallingford, CT, USA, 2016.
  44. Vetere, V.; Adamo, C.; Maldivi, P. Performance of the ‘parameter free’ PBE0 functional for the modeling of molecular properties of heavy metals. Chem. Phys. Lett. 2000, 325, 99–105. [Google Scholar] [CrossRef]
  45. Adamo, C.; Barone, V. Inexpensive and accurate predictions of optical excitations in transition-metal complexes: The TDDFT/PBE0 route. Theor. Chem. Acc. 2000, 105, 169–172. [Google Scholar] [CrossRef]
  46. Adamo, C.; Barone, V. Toward reliable density functional methods without adjustable parameters: The PBE0 model. J. Chem. Phys. 1999, 110, 6158–6170. [Google Scholar] [CrossRef]
  47. Ernzerhof, M.; Scuseria, G.E. Assessment of the Perdew–Burke–Ernzerhof exchange-correlation functional. J. Chem. Phys. 1999, 110, 5029–5036. [Google Scholar] [CrossRef]
  48. Adamo, C.; Scuseria, G.E.; Barone, V. Accurate excitation energies from time-dependent density functional theory: Assessing the PBE0 model. J. Chem. Phys. 1999, 111, 2889–2899. [Google Scholar] [CrossRef]
  49. Adamo, C.; Barone, V. Toward reliable adiabatic connection models free from adjustable parameters. Chem. Phys. Lett. 1997, 274, 242–250. [Google Scholar] [CrossRef]
  50. Tomasi, J.; Mennucci, B.; Cammi, R. Quantum Mechanical Continuum Solvation Models. Chem. Rev. 2005, 105, 2999–3093. [Google Scholar] [CrossRef]
Scheme 1. The synthetic procedure for complexes 13, along with the atom numbering used for NMR assignments.
Inorganics 12 00131 sch001
Figure 1. 31P{1H} NMR spectrum of 13 in CDCl3 (101.25 MHz, 298 K).
Inorganics 12 00131 g001
Figure 2. The UV-vis spectrum of ligands L2 and L3 (on the left) and their emission spectra in dichloromethane (10−5 M, λexc = 350 nm) (on the right).
Inorganics 12 00131 g002
Figure 3. The UV-Vis spectra of complexes 13 (on the left) and the emission spectra (λexc = 350 nm) in dichloromethane (298 K, 10−5 M) (on the right).
Inorganics 12 00131 g003
Figure 4. The DRS spectra of complexes 13 (on the left) and the emission spectra (λexc = 350 nm) in solid state (on the right).
Inorganics 12 00131 g004
Figure 5. A section of the packing in the crystal structure of complex 1, illustrating the intermolecular CH…π and π…π stacking interactions (red dotted lines). Symmetry operations to generate equivalent atoms: (A), x, y, z; (B), 2 − x, 1 − y, 1 − z. For clarity, the counter-anion and aromatic hydrogen atoms are omitted. Atom labeling: Ag (orange), N (blue), P (green), and O (red).
Inorganics 12 00131 g005
Figure 6. A section of the packing in the crystal structure of complex 2, illustrating the intermolecular CH…π stacking interactions (red dotted lines). Symmetry operations to generate equivalent atoms: (A), x, y, z; (B), 1 − x, 1/2 + y, 3/2 − z. For clarity, the counter-anion and aromatic hydrogen atoms are omitted. Atom labeling: Ag (orange), N (blue), P (green), O (red), and S (purple).
Inorganics 12 00131 g006
Figure 7. A section of the packing in the crystal structure of complex 3, illustrating the intermolecular CH…π stacking interactions (red dotted lines). Symmetry operations to generate equivalent atoms: (A), 1 − y, 1 + x − y, 1/3 + z; (B), x,y,z; and (C), 1 − x + y, 1 − x, z − 1/3. For clarity, the counter-anion and aromatic hydrogen atoms are omitted. Atom labeling: Ag (orange), N (blue), P (green), and O (red).
Inorganics 12 00131 g007
Figure 8. Absorption spectra of 13 calculated at the PBE0/LANL2TZ(Ag)U6-31G(d,p) level of theory in DCM solvent.
Inorganics 12 00131 g008
Figure 9. Three-dimensional contour plots of the MOs involved in the electronic excitations giving rise to the two bands appearing in the simulated absorption spectra of 1, calculated at the PBE0/LANL2TZ(Ag)U6-31G(d,p) level of theory in DCM solvent.
Inorganics 12 00131 g009
Table 1. 1H-NMR data (δ/ppm) for complexes 13.
H Atoms123Δδ (1) *Δδ (2) *Δδ (3) *
H(3)/H(8)8.248.288.140.310.340.24
H(4)/H(7)8.448.488.320.220.250.16
H(5)/H(6)7.837.867.770.090.110.09
H(a)7.487.517.39−0.29−0.26−0.33
H(b)7.427.487.30−0.2−0.21−0.24
A, H(2,6)6.856.956.70−0.83−0.69−0.9
A, H(3,5) 6.656.816.33−0.34−0.51−0.4
(-OMe) (-CH3)3.88--−0.02--
(-SMe) (-CH3)-2.56--0-
(-NEt2)(-CH2)--3.42--−0.03
(-NEt2)(-CH3)--1.25--−0.01
POP(C ring) H36.736.746.850.010.020.13
POP(C ring) H47.197.217.02−0.03−0.01−0.20
POP(C ring) H57.127.127.150.130.130.16
POP(C ring) H66.916.926.930.070.080.09
* Δδ = δcomplex − δligand.
Table 2. Selected photophysical data for ligands L2 and L3 in both solution and solid states.
Compoundλabs/nm (ε/Μ−1cm−1)
(CH2Cl2)
λem/nm (CH2Cl2)Φem
(CH2Cl2)
λem/nm
(Solid)
Φem
(Solid)
L2235 (44,000), 332 (60,000),
377 (48,000)
46010%--
L3239 (45,454), 360 (40,184),
407 (62,582)
5386%--
Table 3. Selected photophysical data for compounds 1–3 both in solution and solid state.
Compoundλabs/nm (ε/Μ−1cm−1)
(CH2Cl2)
λem/nm (CH2Cl2)Φem
(CH2Cl2)
λem/nm
(Solid)
Φem
(Solid)
1230 (96,153), 335 (62,500),
385 (65,384)
44511%4879.5%
2235 (63,532), 350 (55,908),
390 (60,991)
46520%5345.6%
3245 (56,112), 445 (80,160)55023%6252.5%
Table 4. Selected structural characteristics of 1 (PF6).
Bond Distances(Å)Bond Angles(°)
Ag(1)-N(1)2.350(3)N(1)-Ag(1)-N(2)72.11(12)
Ag(1)-N(2)2.356(4)N(1)-Ag(1)-P(2)127.15(9)
Ag(1)-P(2)2.4104(12)N(2)-Ag(1)-P(2)133.36(9)
Ag(1)-P(1)2.5661(12)N(1)-Ag(1)-P(1)97.05(9)
N(2)-Ag(1)-P(1)96.20(9)
P(2)-Ag(1)-P(1)118.64(4)
Table 5. Selected structural characteristics of 2 (BF4).
Bond Distances(Å)Bond Angles(°)
Ag(1)-N(1)2.385(3)N(1)-Ag(1)-N(2)70.43(11)
Ag(1)-N(2)2.392(3)N(1)-Ag(1)-P(2)114.60(9)
Ag(1)-P(2)2.5240(12)N(2)-Ag(1)-P(2)118.77(8)
Ag(1)-P(1)2.5245(12)N(1)-Ag(1)-P(1)117.89(8)
N(2)-Ag(1)-P(1)110.36(9)
P(2)-Ag(1)-P(1)116.67(4)
Table 6. Selected crystallographic data of 3 (PF6).
Bond Distances(Å)Bond Angles(°)
Ag(1)-N(1)2.362(4)N(1)-Ag(1)-N(2)71.13(12)
Ag(1)-N(2)2.377(4)N(1)-Ag(1)-P(2)114.57(9)
Ag(1)-P(2)2.5117(14)N(2)-Ag(1)-P(2)118.83(9)
Ag(1)-P(1)2.5144(13)N(1)-Ag(1)-P(1)116.75(9)
N(2)-Ag(1)-P(1)113.40(9)
P(2)-Ag(1)-P(1)115.11(5)
Table 7. Principal singlet–singlet electronic transitions in the simulated absorption spectra for complexes 13 calculated in DCM solvent at the PBE0/LANL2TZ(Ag)U6-31G(d,p) level of theory a.
Excitation (% Composition)λ (nm)fAssignment
1
H → L (90%)3970.723MLCT/IL/LL’CT
H-1 → L (62%), H → L + 1 (27%), H-2 → L + 1 (8%)3560.352IL/LL’CT
H → L + 2 (77%), H-2 → L + 1 (5%), H-2 → L + 2 (5%)3240.482MLCT/IL/LL’CT
H → L + 4 (38%), H-2 → L + 3 (23%), H → L + 3 (11%), H-2 → L + 4 (10%) 2850.056IL/LL’CT
H-12 → L (16%), H-5 → L + 1 (16%), H-9 → L + 1 (13%)2630.058IL/LL’CT
H-2 → L + 6 (35%), H → L + 6 (17%), H → L + 9 (10%)2550.087IL/LL’CT
2
H → L (94%)4200.846IL
H-1 → L (90%), H → L + 1 (6%)4000.575IL
H-1 → L + 1 (92%)3580.136IL
H-6 → L (55%), H-4 → L + 1 (16%)2990.093IL
H-6 → L + 1 (38%), H-8 → L (9%), H-3 → L + 2 (9%)2780.078IL
H-4 → L + 2 (34%), H-12 → L (17%)2660.089IL
3
H → L (90%), H-1 → L (6%)4750.827IL
H-1 → L (90%), H → L (7%)4310.658IL
H → L + 2 (95%)3720.540IL
H-4 → L (83%)3060.078IL
H → L + 9 (48%), H → L + 11 (12%)2850.160IL
H-11 → L (28%), H-2 → L + 6 (26%), H-1 → L + 11 (19%)2640.098IL
a H and L stand for HOMO and LUMO, respectively.
Disclaimer/Publisher’s Note: The statements, opinions and data contained in all publications are solely those of the individual author(s) and contributor(s) and not of MDPI and/or the editor(s). MDPI and/or the editor(s) disclaim responsibility for any injury to people or property resulting from any ideas, methods, instructions or products referred to in the content.

