Article

Tris-{Hydridotris(1-pyrazolyl)borato}lanthanide Complexes: Synthesis, Spectroscopy, Crystal Structure and Bonding Properties

European Commission, Joint Research Centre, Postfach 2340, D-76125 Karlsruhe, Germany
*
Authors to whom correspondence should be addressed.
These authors have retired.
Inorganics 2021, 9(6), 44; https://doi.org/10.3390/inorganics9060044
Submission received: 30 April 2021 / Revised: 20 May 2021 / Accepted: 27 May 2021 / Published: 3 June 2021
(This article belongs to the Section Coordination Chemistry)

Abstract

:
Complexes of trivalent lanthanides (Ln) with the hydridotris(1-pyrazolyl)borato (Tp) ligand Ln[η3-HB(N2C3H3)3]3 (LnTp3) were subjected to a joint experimental–theoretical analysis. X-ray diffraction experiments have been performed on CeTp3, NdTp3, SmTp3, GdTp3, and TbTp3 in the nine-fold coordination and on DyTp3, HoTp3, ErTp3, TmTp3, YbTp3, and LuTp3 in the eight-fold coordination form. Density functional theory (DFT) calculations were carried out for all 15 LnTp3 complexes. They extended the X-ray diffraction data available on the LnTp3 compounds and facilitated a straightforward interpretation of trends in the structural parameters. As a result of the joint analysis, significant steric strain in the equatorial coordination sites of the nine-coordinate structures was recognized. Trends in the bonding properties were elucidated by energy decomposition and quantum theory of atoms in molecules (QTAIM) analysis of the electron density distribution. These results revealed the major electrostatic character of the Ln…Tp bonding and fine variation of charge transfer effects across the Ln row.

Graphical Abstract

1. Introduction

The hydridotris(1-pyrazolyl)borato (Tp) molecule was first synthesized in 1966 [1]. Trofimenko named this ligand and its derivatives ‘scorpionates’ based on their characteristic shape: the pseudo-axial pyrazole rings resemble the stinger while the two equatorial pyrazole rings are like the claws of a scorpion [2]. Within the past two and a half decades, the Tp ligand and its derivatives have developed into popular ligands in the chemistry of transition metals [2,3,4,5]. They form a great variety of complexes in a tridentate fashion with most metals and metalloids.
The synthesis and structural data of Tp complexes of trivalent lanthanides (LnTp3) have been previously reported by some of us. The complexes have been obtained by reaction of LnCl3 with K[HB(N2C3H3)3] (KTp) [6]. Crystal structures have been reported for six complexes (Ln = La [7], Pr [6], Nd [6], Sm [8], Eu [7], and Yb [9]). In these studies, two structural isomers were identified: the light Ln (La, Pr, Nd, Sm, Eu) showed coordination numbers 9 in the complexes (in the following denoted by CN9), while in YbTp3, the Yb ion turned out to be eight-fold coordinated (denoted by CN8). In the CN9 isomers, the nine coordinating pyrazole rings form a tricapped prismatic coordination environment with high symmetry. In the CN8 isomers, the symmetry is reduced as one of the pyrazole rings is turned away from Ln, leaving only eight donor nitrogens for complex formation [9]. The two isomers also differ in morphology: CN9 crystallizes with high crystallographic symmetry in the hexagonal system while CN8 is orthorhombic. Additional structural information has been gained from IR spectra on the LnTp3 complexes of the whole Ln row (except the radioactive Pm) [6]. Three spectral ranges have been identified (2440–2460, 650–800, and 150–290 cm−1), where the two isomers show slight differences. On the basis of systematic IR spectral data, the CN9 isomers could unambiguously be assigned to light Ln (from La to Tb), while the CN8 isomers were assigned to the heavy Ln (Dy to Lu) complexes. DyTp3 was found to be a borderline case: its dimorphic crystals contained both isomers.
Additional experimental studies included the measurement of absorption spectra and detailed analysis of the electronic transitions [7,8,10,11,12]. The thermal behavior of some LnTp3 compounds was also analyzed using TG/DTG and DSC methods [13]. Recently, we reported a joint experimental and theoretical study on the structural, bonding, and magnetic properties of AnTp3 complexes, in which LaTp3 and LuTp3 were also included for comparison [14].
In the present study, we extend the characterization of LnTp3 complexes with new structural data. This includes the crystal structures of CeTp3, NdTp3, SmTp3, GdTp3, and TbTp3 (CN9 isomers) and DyTp3, HoTp3, ErTp3, TmTp3, YbTp3, and LuTp3 (CN8 isomers). Density Functional Theory (DFT) calculations were performed on the whole series, facilitating the recognition of trends in the structural properties. Metal–ligand bonding was studied using energy decomposition [15] and quantum theory of atoms in molecules (QTAIM) [16].

2. Results and Discussion

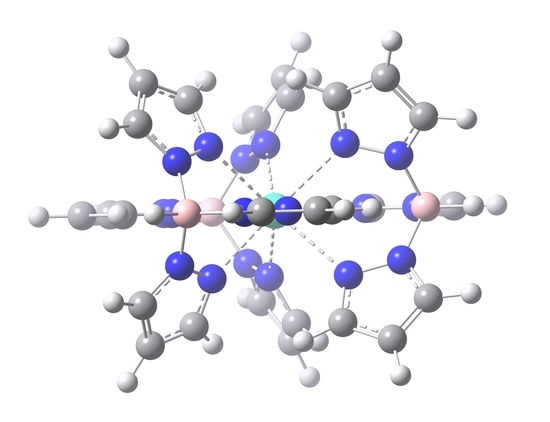
2.1. Crystal and Molecular Structures

The crystal and molecular structures of the nine-fold coordinated complexes CeTp3, NdTp3, SmTp3, and TbTp3 were determined in the present study. Additional unpublished data from our archive on the nine-fold coordinated GdTp3 plus the series of the eight-fold coordinated complexes DyTp3, HoTp3, ErTp3, TmTp3, YbTp3, and LuTp3 are given in the Supplementary Materials (see Table S3). In the latter series, HoTp3 is isostructural with its YbTp3 analog reported in Ref. [9], whereas all the others are isostructural to each other. The single crystal structure determinations of NdTp3 and SmTp3 are re-investigations of older structures, as the present qualities are superior to the published ones from Refs. [6,8], respectively.
The ninefold-coordinated complexes CeTp3, NdTp3, SmTp3, GdTp3, and TbTp3 are isostructural and crystallize in the hexagonal space group P63/m (Table 1 and Table S3) showing very little differences in the cell parameters.
The high symmetry of the hexagonal space group is retained in the C3h symmetry of the molecular complexes. In the crystal, only 1/6 of the molecule is found in the crystallographically independent unit of the elementary cell. The entire molecules are then generated by the crystallographic symmetry operations, leading to two entire molecules in the elementary cell separated by an inversion center (Figure S2). The central Ln3+ ion coordinates to the nine N atoms of the three Tp ligands in a tricapped trigonal prismatic geometry (Figure 1). Each Tp ligand coordinates in a typical scorpionate-like way with two pyrazole rings forming the claws in the corners of the trigonal prism, whereas the third pyrazole ring takes over the role of the stinger capping the rectangular faces of the prism [2] (Figure 1). The high symmetry is also reflected in the packing, where the views along the a- and b-axis are identical (Figure S2) and always show the parallel orientation of one pyrazole ring to the axis. The view along the c-axis shows the perpendicular orientation of the third ring to this axis. All these together result in two distinct Ln–N bonds (Table 2): the shorter one in the range from 2.659 Å (La) to 2.523 Å (Tb) covers the six N atoms forming the edges of the trigonal prism (apical positions) and nicely reflects the ‘lanthanide contraction’ with a shortening of ca 0.01 Å going from one element to the next. This effect is much less expressed in the longer Ln–N bonds to the capping (equatorial) N atoms in plane with the central metal ion (Figure 1) which cover a range from 2.80 Å to 2.75 Å (Gd, Tb, Table 2).
Our DFT calculations reproduced both the CN9 and CN8 structures of the LnTp3 complexes as minima on the potential energy surfaces of the molecules. However, deviating somewhat from the crystal structure results, the calculations predicted the CN9 isomer as most stable for all the Ln in terms of electronic energies. Probing other DFT functionals did not change the trend in the relative stabilities of the two isomers. The effect of thermal corrections (in the Gibbs free energies) was a decrease in the relative energies by ca. 10 kJ/mol to the favor of CN8. It seems that theory is consistent for the energetic preference of the CN9 isomer even for the smallest LuTp3 complex at the molecular level. These calculations, however, do not account for intermolecular steric forces from crystal packing, which may be a significant source for the deviation. Nevertheless, the gradually decreasing preference of the CN9 isomer over the CN8 one across the Ln row is predicted correctly by the calculations (see Figure S3 in the Supplementary Materials).
The computed apical and equatorial Ln–N distances of the two isomers are depicted together with available experimental crystal structure data in Figure 2. The computed geometrical parameters agree well with the literature [6,7,9] and new X-ray diffraction results. We note the considerable improvement in the NdTp3 and SmTp3 crystal structure data with respect to those in the literature [6,8].
In Figure 2, the following main features can be recognized:
(i) The Ln–N bond distances in the CN8 structures are shorter than their analogs in the CN9 isomers. This is the result of the steric release upon turning one equatorial pyrazole ring away from Ln in the former isomers, facilitating more relaxed interaction for the remaining eight N donors. While the stronger (shorter) Ln–Nap bonds gain only slightly from the steric release, the weaker (longer) Ln–Neq bonds decrease by 0.1–0.2 Å.
(ii) In the CN9 structures, the Ln–Neq bond distances scatter around 2.78 Å without any definite trend. In contrast, in the CN8 isomers, a decreasing trend (obeying more-or-less the contracting Ln3+ radii) can be recognized in the Ln–Neq bonds. This significant change of character is the results of the reduced steric strain. Apparently, in the CN9 isomers the crowded surroundings of Ln do not allow for the weaker equatorial Ln–N bonds a relaxation with decreasing Ln3+ radii.
(iii) The ‘lanthanide contraction’ is well reproduced in the Ln–Nap distances of both isomers. In fact, the decreasing trend is more pronounced in the Ln–Nap distances than in the above discussed Ln–Neq ones of the CN8 isomers. This suggests that the Ln–Neq interactions still suffer slightly from steric disadvantages in the latter structures as well.

2.2. Bonding Analysis

The bonding properties of the complexes were analyzed using the extended transition state (ETS) energy decomposition [15,18] and the quantum theory of atoms in molecules (QTAIM) models [16]. These theoretical models have been successfully applied in numerous studies of bonding trends in organometallic complexes [14,19,20,21,22,23,24,25,26,27,28,29,30,31,32,33,34].
In the ETS approach [15,18], the interaction energy between the selected fragments, ΔEint, is defined as
ΔEint = ΔVelst + ΔEPauli + ΔEoi
where ΔVelst corresponds to the classical electrostatic interaction between the charge distributions of the isolated fragments upon complex formation, ΔEPauli is the repulsion between occupied orbitals (practically the steric repulsion), and ΔEoi is the orbital interaction energy between the fragments in the complex, including electron pair bonding, charge transfer, and polarization [18]. We focus here on the total interaction energy as well as on the ratio of the ΔVelst and ΔEoi components.
The ETS analysis could be performed in a straightforward manner for the La, Gd, and Lu complexes based on the distinguished ground electronic states of these three lanthanides (4f0, 4f7, and 4f14 configurations, respectively). Their energy decomposition data are shown in Table 3.
The main interaction in the title complexes is the electrostatic attraction between the charged Ln and Tp moieties. This amounts to ca. 70% of the total attraction (ΔVelst + ΔEoi) interactions. The trend in the attractive bonding interactions is a gradual increase from La to Lu as the contracting Ln radii strengthen both the electrostatic attraction and electron-sharing interactions. The repulsive Pauli interaction shows an opposite trend, but its magnitude is considerably smaller. Hence, the overall trend appearing in the total interaction energy is the increase from LaTp3 to LuTp3 as observed also in the computed dissociation energies of other Ln compounds [35,36,37,38]. The main metal–ligand bonding differences between the CN9 and CN8 isomers of LuTp3 appear in the somewhat stronger orbital and Pauli interactions in the CN8 form as a result of the shortened Lu–ligand distances (vide supra). The marginal effect of the change from CN9 to CN8 on the global character of bonding can be seen in the marginal decrease of % ΔVelst/(ΔVelst + ΔEoi) in Table 3.
The covalent part of bonding corresponds to the Tp → Ln charge transfer, in which the N lone pairs donate electrons to the empty valence orbitals of the Ln3+ ions. The charge transfer interactions in the CN9 structures of LaTp3 and LuTp3 complexes have recently been studied [14] by means of the natural bond orbital (NBO) model [39]. This analysis predicted an energetically somewhat stronger Tp → Ln charge transfer in the LuTp3 complex, in agreement with the present ETS results. No Ln → Tp back-donation was found in the NBO analysis.
The QTAIM analysis provided descriptive integrated properties of the electron density distribution. The Ln atomic charges and non-localized electron densities around Ln are given in Figure 3. The latter quantity was obtained by subtracting the localized electron density (non-bonding electron density) from the total electron population assigned to Ln. Extended with the electron densities from the N bonding partners, it forms the Ln–N bonding densities. They, in terms of the number of electrons localized in the space between two interacting atoms, are manifested in the delocalization indices (DI).
The presented QTAIM results provide insight into the charge transfer interactions (CT) in the complexes. They do not show a consistent gradual trend like the Ln3+ ionic radii (‘lanthanide contraction’) and the Ln–N bond distances (vide supra) or the electron densities at the Ln–N bond critical points (Figure S4 in the Supplementary Materials, cf. also Ref. [40] for other Ln complexes). In fact, such a trend is often absent in the physicochemical properties not strongly related to the structure of lanthanide compounds [41].
The Ln atomic charges in Figure 3 are between +2.1 and +2.3 due to the CT from Tp to Ln3+. The behavior of the Ln charge curve is different at the light and heavy lanthanides, the breaking point being Gd (with 4f7 configuration). In the region of the light lanthanides a small minimum is formed, while for the heavy lanthanides the Ln charge slightly decreases. The minimum curve in the first half of the Ln row is associated with the maximum of the non-localized electron density, gained from the larger CT (cf. Figure 3). The decrease from Tb to Yb implies a slightly increasing CT from Tp. This slight increase, however, is accumulated in the non-bonding localized density around Ln as both the non-localized electron density (Figure 3) and DI (Figure 4) are marginally decreasing in this region. The exceptional behavior of Lu may be attributed to its compact 4f14 configuration.
The covalent interaction between Ln and N is demonstrated in more detail in Figure 4, depicting both the single-bond DI values between Ln and the apical as well as the equatorial N donors and the sum of all delocalization indices, Σ(Ln–N). The trend of Σ(Ln–N) curve agrees with the trend of Lnnon-localized in Figure 3, except that the values are somewhat larger (e.g., 0.15 e vs. 0.1 e for PrTp3) because DI incorporates also the bonding density from N.
The single-bond DI data demonstrate the expected stronger character of the Ln–Nap bonds in agreement with their shorter bond distances. On the other hand, the character of the Σ(Ln–N) curve, i.e., the maximum in the early Ln and the decrease in the late Ln sections, can be more clearly recognized in the Ln–Neq data. The Ln–Nap data are nearly constant with a weak maximum between La and Gd.
The Tp → Ln CT is mainly governed by a balance of Ln–N distances, donor and acceptor orbital energies, and repulsion from the electron density distribution around Ln3+. The Ln–N distances cover the steric factor due to the ‘lanthanide contraction’. The decreasing Ln–N distances (forced by the decreasing Ln3+ ionic radii) generate increasing steric interactions between the Tp ligands. This effect was shown above for the Ln–Neq bond distances (cf. Figure 2) and is also reflected in the DI values of these bonds in Figure 4. In the LnTp3 complexes, the above conditions for CT in terms of transferred electrons appear to be most favorable in the Ce3+–Sm3+ region. Less favorable is the CT to Ln3+ ions with 4f0, 4f7, 4f14 configurations as well as in the second half of the Ln row.

3. Materials and Methods

3.1. Materials

The complexes LnTp3 were prepared by various routes following published procedures [6,7,8]. The lanthanide salts were dissolved in water and added to a solution of KTp in water under formation of the LnTp3 precipitates. These were washed with water, EtOH, Et2O, and dried in vacuum. Single crystals of the CN9 isomers of LnTp3 were obtained by extraction with benzene, whereas single crystals of the CN8 isomers were the product of vacuum sublimation at 200 °C and 0.014 mbar. Potassium tri(1-pyrazolyl)borohydride was purchased from Sigma-Aldrich (St. Louis, MO, USA) and used directly. The salts of the lanthanides, chlorides, or nitrates contain water and were used without further purification.

3.2. X-Ray Diffraction

Single crystal XRD measurements were performed at 100 K on a Bruker APEX II Quazar (Ce, Nd, Sm) or at 200 K on a Bruker SMART CCD 1K (Tb) diffractometer with monochromated Mo Kα irradiation collecting at least one sphere of data in the range θ ≤ 28.5° [42,43]. Frames were collected with an appropriate irradiation time between 1 and 10 s per frame using ω- scan technique (SMART CCD 1K, Δω = 0.45°) or combined ω- and φ- scan technique (Bruker APEX II Quazar, Δω = Δφ = 0.5°). Data were integrated with SAINT and corrected to Lorentz and polarization effects, and an experimental adsorption correction with SADABS was applied [42,43]. The structures were solved by direct methods and refined to an optimum R1 value with SHELX-2013 [44]. Visualization for evaluation was performed with winray-32 [45]. For more details see Table 1.
The structures have been deposited at The Cambridge Crystallographic Data Centre with the reference CCDC numbers 2,074,868 (Ce), 2,074,869 (Nd), 2,074,870 (Sm), 2,074,871 (Tb), they contain the supplementary crystallographic data for this paper. These data can be obtained free of charge from the CCDC via www.ccdc.cam.ac.uk/data_request/cif (accessed on 19 March 2021).
In addition, we report here unpublished X-ray diffraction data from our archive on all the eight-fold coordinated LnTp3 complexes plus the nine-fold coordinated GdTp3. These measurements were performed in the late 1980s and early 1990s on an ENRAF-NONIUS CAD4 diffractometer at room temperature. Structure determination and refinement was carried out with the Enraf-Nonius SDP-Plus software [46]. The intensity data do not exist anymore, but for completeness we deposited the coordinates at The Cambridge Crystallographic Data Centre with the reference CCDC numbers 2078671-2078677; the crystallographic details of these complexes are presented in Table S3 of the Supplementary Materials.

3.3. Computational Details

Our previous DFT calculations on AnTp3, LaTp3, and LuTp3 were performed with the Gaussian09 code utilizing small-core relativistic pseudopotentials [14]. Unfortunately, this 4f-in-valence approach failed for most LnTp3 complexes because of severe self-consistent field (SCF) convergence problems. Therefore, in the present study, we chose another code and theoretical level. The geometry optimizations and bonding analyses were performed with the Amsterdam Density Functional (ADF2017) software [47,48]. Scalar (SF) relativistic effects were accounted for by utilizing the zeroth-order regular approximation (ZORA) [49]. The theoretical level of the calculations consisted of the B3LYP exchange-correlation functional [50,51] in conjunction with an uncontracted set of Slater-type orbitals (STOs) of triple-zeta-plus-polarization quality optimized for use with ZORA [52]. The small-core frozen-core option and an auxiliary set of s, p, d, f, and g STOs was used to fit the molecular density and to represent the Coulomb and exchange potentials accurately in each SCF cycle. For the sake of consistency, both the closed- (La, Lu) and open-shell systems were treated using the spin-unrestricted formalism. Only the high-spin electron configurations of the Ln3+ ions were considered. The minimum characters of the obtained structures were confirmed by frequency analyses. The dispersion effects were taken into account using the empirical D3 parameters of Grimme et al. [53].
The quantum theory of atoms in molecules (QTAIM [16,54,55]) analysis was also performed with ADF2017.

4. Conclusions

We reported a joint experimental–theoretical analysis of the complexes of trivalent lanthanides with the hydridotris(1-pyrazolyl)borato (scorpionate) ligand focusing on the structural and bonding properties. The experimental part included advanced X-ray diffraction experiments on CeTp3, NdTp3, SmTp3, TbTp3 while the theoretical analysis covered the whole lanthanide row. The structural studies confirmed the CN = 9 character of the complexes in the first two-third section of the Ln row. The DFT computations predicted that there is an increasing steric strain in the equatorial coordination sites of the CN9 structures upon decreasing Ln3+ radii, which leads to a destabilization of these structures towards a CN = 8 coordination. The above steric strain is well manifested in the nearly constant Ln–Neq distances in the CN9 structures in contrast to the Ln–Nap ones which follow consistently the decreasing trend in the Ln3+ radii.
Energy decomposition analysis of the electron density distribution revealed the major electrostatic character of the Ln…Tp bonding. Together with the steric effects it determines the metric parameters of the complexes at the first place. The minor contributor CT obeys to the metric conditions but can also influence them in some extent through back-coupling. The QTAIM data indicate characteristic differences in the CT in the first and second half of the Ln row. The largest CT (in terms of transferred electrons) occurs to the lanthanides from Ce3+ to Sm3+, facilitated by an optimal balance of the orbital energies, Ln–N distances and repulsion from filled 4f orbitals. Less favorable is the CT to the Ln3+ ions with 4f0, 4f7, 4f14 configurations as well as in the second half of the Ln row.

Supplementary Materials

The following are available online at https://www.mdpi.com/article/10.3390/inorganics9060044/s1. Computed data presented in Figure 2, Figure 3 and Figure 4 (Tables S1–S2); figures with the structures (Figures S1–S2) and relative energies (Figure S3) of the CN9 and CN8 isomers; figure with electron densities at the Ln–N bond critical points (Figure S4); Crystallographic details for GdTp3, DyTp3, HoTp3, ErTp3, TmTp3, YbTp3, LuTp3 (Table S3); Cartesian coordinates of the optimized CN9 and CN8 structures of LaTp3, GdTp3, and LuTp3; the CIF and the checkCIF output files of the CeTp3, NdTp3, SmTp3, and TbTp3 crystal structures.

Author Contributions

C.A. and A.M. carried out the syntheses; O.W. and J.R. performed the XRD measurements; A.K. carried out the DFT calculations; A.K. and O.W. wrote the paper. All authors have read and agreed to the published version of the manuscript.

Funding

This research received no external funding.

Institutional Review Board Statement

Not applicable.

Informed Consent Statement

Not applicable.

Conflicts of Interest

The authors declare no conflict of interest.

References

  1. Trofimenko, S. Boron-Pyrazole Chemistry. J. Am. Chem. Soc. 1966, 88, 1842–1844. [Google Scholar] [CrossRef]
  2. Trofimenko, S. Recent advances in poly(pyrazolyl)borate (scorpionate) chemistry. Chem. Rev. 1993, 93, 943–980. [Google Scholar] [CrossRef]
  3. Trofimenko, S. Skorpionates—The Coordination Chemistry of Pyrazolylborate Ligands; World Scientific Publishing: London, UK, 1999. [Google Scholar]
  4. Marques, N.; Sella, A.; Takats, J. Chemistry of the lanthanides using pyrazolylborate ligands. Chem. Rev. 2002, 102, 2137–2159. [Google Scholar] [CrossRef]
  5. Pettinari, C. Scorpionates II—Chelating Borate Ligands; Imperial College Press: London, UK, 2008. [Google Scholar]
  6. Apostolidis, C.; Rebizant, J.; Kanellakopulos, B.; Ammon, R.v.; Dornberger, E.; Müller, J.; Powietzka, B.; Nuber, B. Homoscorpionates (hydridotris(1-pyrazolyl)borato complexes) of the trivalent 4f ions. The crystal and molecular structure of [(HB(N2C3H3)3]3LnIII, (Ln = Pr, Nd). Polyhedron 1997, 16, 1057–1068. [Google Scholar] [CrossRef]
  7. Apostolidis, C.; Rebizant, J.; Walter, O.; Kanellakopulos, B.; Reddmann, H.; Amberger, H.-D. Electronic structures of highly symmetrical compounds of f elements. 35 [1]—Crystal and molecular structure of tris(hydrotris(1-pyrazolyl)borato)lanthanide(III) (LnTp3; Ln = La, Eu), and electronic structure of EuTp3. Z. Anorg. Allg. Chem. 2002, 628, 2013–2025. [Google Scholar] [CrossRef]
  8. Reddmann, H.; Apostolidis, C.; Walter, O.; Rebizant, J.; Amberger, H.-D. Electronic structures of highly symmetrical compounds of f elements. 38 [1] Crystal, molecular and electronic structure of tris(hydrotris(1-pyrazolyl) borato)samarium(III). Z. Anorg. Allg. Chem. 2005, 631, 1487–1496. [Google Scholar] [CrossRef]
  9. Stainer, M.V.R.; Takats, J. X-ray Crystal and Molecular Structure of Tris[hydridotris(pyrazol-1-yl)borato]ytterbium(III), Yb(HBPz3)3. Inorg. Chem. 1982, 21, 4050–4053. [Google Scholar] [CrossRef]
  10. Seminara, A.; Musumeci, A. Absorption and Emission Spectra of Neodymium(III) and Europium(III) Complexes*. Inorg. Chim. Acta 1984, 95, 291–307. [Google Scholar] [CrossRef]
  11. Amberger, H.-D.; Reddmann, H.; Apostolidis, C.; Kanellakopulos, B. Electronic structures of highly symmetrical compounds of f elements. 36 [1]: Parametric analysis of the optical spectra of an oriented tris(hydrotris(1-pyrazolyl)borato)praseodymium(III) single crystal. Z. Anorg. Allg. Chem. 2003, 629, 147–160. [Google Scholar] [CrossRef]
  12. Faltynek, R.A. Lanthanide Coordination Chemistry: Spectroscopic Properties of Terbium and Europium Poly(Pyrazol-1-YL)- and Poly(Imidazol-1-Yl)Borate Complexes. J. Coord. Chem. 1989, 20, 73–80. [Google Scholar] [CrossRef]
  13. Miranda, P., Jr.; Aricó, E.M.; Máduar, M.F.; Matos, J.R.; De Carvalho, C.A.A. Study of the thermal decomposition of the Nd(III), Eu(III) and Tb(III) scorpionates. J. Alloys Comp. 2002, 344, 105–109. [Google Scholar] [CrossRef]
  14. Apostolidis, C.; Kovács, A.; Walter, O.; Colineau, E.; Griveau, J.-C.; Morgenstern, A.; Rebizant, J.; Caciuffo, R.; Panak, P.J.; Rabung, T.; et al. Tris-{hydridotris(1-pyrazolyl)borato}actinide Complexes: Synthesis, Spectroscopy, Crystal Structure, Bonding Properties and Magnetic Behaviour. Chem. Eur. J. 2020, 26, 11293–11306. [Google Scholar] [CrossRef]
  15. Ziegler, T.; Rauk, A. On the calculation of bonding energies by the Hartree Fock Slater method. I. The transition state method. Theor. Chim. Acta 1977, 46, 1–10. [Google Scholar] [CrossRef]
  16. Bader, R.F.W. Atoms in Molecules. A Quantum Theory; Oxford University Press: Oxford, UK, 1990. [Google Scholar]
  17. Shannon, R.D.; Prewitt, C.T. Revised values of effective ionic radii. Acta Cryst. 1970, B26, 1046–1048. [Google Scholar] [CrossRef]
  18. Bickelhaupt, F.M.; Baerends, E.J. Kohn-Sham Density Functional Theory: Predicting and Understanding Chemistry. In Reviews in Computational Chemistry; Lipkowitz, K.B., Boyd, D.B., Eds.; Wiley-VCH: New York, NY, USA, 2000; Volume 15, pp. 1–86. [Google Scholar]
  19. Hopffgarten, M.V.; Frenking, G. Energy decomposition analysis. Wiley Interdiscip. Rev. Comput. Mol. Sci. 2012, 2, 43–62. [Google Scholar] [CrossRef]
  20. Hayton, T.W.; Kaltsoyannis, N. Organometallic Actinide Complexes with Novel Oxidation States and Ligand Types. In Experimental and Theoretical Approaches to Actinide Chemistry; Gibson, J.K., de Jong, W.A., Eds.; John Wiley & Sons, Inc.: Hoboken, NJ, USA, 2018; pp. 181–236. [Google Scholar]
  21. Kaltsoyannis, N. Transuranic Computational Chemistry. Chem. Eur. J. 2018, 24, 2815–2825. [Google Scholar] [CrossRef]
  22. Kerridge, A. Quantification of f-element covalency through analysis of the electron density: Insights from simulation. Chem. Commun. 2017, 53, 6685–6695. [Google Scholar] [CrossRef] [Green Version]
  23. Dognon, J.-P. Theoretical insights into the chemical bonding in actinide complexes. Coord. Chem. Rev. 2014, 266–267, 110–122. [Google Scholar] [CrossRef]
  24. Jones, M.B.; Gaunt, A.J.; Gordon, J.C.; Kaltsoyannis, N.; Neu, M.P.; Scott, B.L. Uncovering f-element bonding differences and electronic structure in a series of 1:3 and 1:4 complexes with a diselenophosphinate ligand. Chem. Sci. 2013, 4, 1189–1203. [Google Scholar] [CrossRef] [Green Version]
  25. Schnaars, D.D.; Gaunt, A.J.; Hayton, T.W.; Jones, M.B.; Kirker, I.; Kaltsoyannis, N.; May, I.; Reilly, S.D.; Scott, B.L.; Wu, G. Bonding trends traversing the tetravalent actinide series: Synthesis, structural, and computational analysis of AnIV(Aracnac)4 complexes (An = Th, U, Np, Pu; Aracnac = ArNC(Ph)CHC(Ph)O; Ar = 3,5-tBu2C6H3). Inorg. Chem. 2012, 51, 8557–8566. [Google Scholar] [CrossRef]
  26. Kerridge, A. Oxidation state and covalency in f-element metallocenes (M = Ce, Th, Pu): A combined CASSCF and topological study. Dalton Trans. 2013, 42, 16428–16436. [Google Scholar] [CrossRef] [Green Version]
  27. Kerridge, A. f-Orbital covalency in the actinocenes (An = Th – Cm): Multiconfigurational studies and topological analysis. RSC Adv. 2014, 4, 12078–12086. [Google Scholar] [CrossRef] [Green Version]
  28. Huang, Q.R.; Kingham, J.R.; Kaltsoyannis, N. The strength of actinide-element bonds from the quantum theory of atoms-in-molecules. Dalton Trans. 2015, 44, 2554–2566. [Google Scholar] [CrossRef] [PubMed] [Green Version]
  29. Kaltsoyannis, N. Covalency hinders AnO2(H2O)+ → AnO(OH)2+ isomerisation (An = Pa – Pu). Dalton Trans. 2016, 45, 3158–3162. [Google Scholar] [CrossRef] [PubMed]
  30. Gupta, T.; Velmurugan, G.; Rajeshkumar, T.; Rajaraman, G. Role of Lanthanide-Ligand bonding in the magnetization relaxation of mononuclear single-ion magnets: A case study on Pyrazole and Carbene ligated LnIII (Ln = Tb, Dy, Ho, Er) complexes. J. Chem. Sci. 2016, 128, 1615–1630. [Google Scholar] [CrossRef] [Green Version]
  31. Calhorda, M.J.; Costa, P.J. Structure, bonding and reactivity of seven-coordinate allylic Mo(II) and W(II) complexes. Coord. Chem. Rev. 2017, 344, 83–100. [Google Scholar] [CrossRef]
  32. Wu, Q.Y.; Cheng, Z.P.; Lan, J.H.; Wang, C.Z.; Chai, Z.F.; Gibson, J.K.; Shi, W.Q. Insight into the nature of M-C bonding in the lanthanide/actinide-biscarbene complexes: A theoretical perspective. Dalton Trans. 2018, 47, 12718–12725. [Google Scholar] [CrossRef]
  33. Carlotto, S.; Sambi, M.; Rancan, M.; Casarin, M. Theoretical Investigation of the Electronic Properties of Three Vanadium Phthalocyaninato (Pc) Based Complexes: PcV, PcVO, and PcVI. Inorg. Chem. 2018, 57, 1859–1869. [Google Scholar] [CrossRef]
  34. Kovács, A.; Apostolidis, C.; Walter, O. Comparative study of complexes of rare earths and actinides with 2,6-bis(1,2,4-triazin-3-yl)pyridine. Inorganics 2019, 7, 26. [Google Scholar] [CrossRef] [Green Version]
  35. Kovács, A.; Konings, R.J.M. Thermodynamic Properties of the Lanthanide(III) Halides. In Handbook on the Physics and Chemistry of Rare Earths; Gschneidner, K.A., Jr., Bünzli, J.-C., Pecharsky, V., Eds.; Elsevier: Amsterdam, The Netherlands, 2003; Volume 33. [Google Scholar]
  36. Konings, R.J.M.; Beneš, O.; Kovács, A.; Manara, D.; Sedmidubský, D.; Gorokhov, L.; Iorish, V.S.; Yungman, V.; Shenyavskaya, E.; Osina, E. The thermodynamic properties of the f-elements and their compounds. Part II. The Lanthanide and Actinide Oxides. J. Phys. Chem. Ref. Data 2014, 43, 013101. [Google Scholar] [CrossRef] [Green Version]
  37. Kovács, A.; Apostolidis, C.; Walter, O.; Lindqvist-Reis, P. ‘Lanthanide contraction’ in [Ln(BTP)3](CF3SO3)3 complexes. Struct. Chem. 2015, 26, 1287–1295. [Google Scholar] [CrossRef] [Green Version]
  38. Kovács, A. Structure and bonding of lanthanide dinitrogen complexes, Ln(N2)1-8. Int. J. Quantum. Chem. 2020, 120, e26051. [Google Scholar] [CrossRef]
  39. Reed, A.E.; Curtiss, L.A.; Weinhold, F. Intermolecular interactions from a natural bond orbital, donor-acceptor viewpoint. Chem. Rev. 1988, 88, 899–926. [Google Scholar] [CrossRef]
  40. Fryer-Kanssen, I.; Austin, J.; Kerridge, A. Topological Study of Bonding in Aquo and Bis(triazinyl)pyridine Complexes of Trivalent Lanthanides and Actinides: Does Covalency Imply Stability? Inorg. Chem. 2016, 55, 10034–10042. [Google Scholar] [CrossRef]
  41. Peters, J.A.; Djanashvili, K.; Geraldes, C.F.G.C.; Platas-Iglesias, C. The chemical consequences of the gradual decrease of the ionic radius along the Ln-series. Coord. Chem. Rev. 2020, 406. [Google Scholar] [CrossRef]
  42. SMART, SAINT, SADABS; Siemens, Analytical X-ray Instruments Inc.: Karlsruhe, Germany, 1997.
  43. APEX2, SAINT-Plus, SADABS, Programs for Data Collection, Integration and Absorption Correction; Bruker AXS Inc.: Madison, WI, USA, 2007.
  44. Sheldrick, G.M. A short history of SHELX. Acta Cryst. 2008, A64, 112–122. [Google Scholar] [CrossRef] [Green Version]
  45. Soltek, R.; Huttner, G. Winray-32; University of Heidelberg: Heidelberg, Germany, 1998. [Google Scholar]
  46. Enraf-Nonius SDP-Plus Structure Determination Package; Enraf-Nonius: Delft, The Netherlands, 1987.
  47. Amsterdam Density Functional Package; SCM Theoretical Chemistry, Vrije Universiteit: Amsterdam, The Netherlands, 2020.
  48. te Velde, G.; Bickelhaupt, F.M.; Baerends, E.J.; Fonseca Guerra, C.; van Gisbergen, S.J.A.; Snijders, J.G.; Ziegler, T. Chemistry with ADF. J. Comput. Chem. 2001, 22, 931–967. [Google Scholar] [CrossRef]
  49. Van Lenthe, E.; Baerends, E.J.; Snijders, J.G. Relativistic total energy using regular approximations. J. Chem. Phys. 1994, 101, 9783–9792. [Google Scholar] [CrossRef]
  50. Becke, A.D. Density-Functional Thermochemistry. III. The Role of Exact Exchange. J. Chem. Phys. 1993, 98, 5648–5652. [Google Scholar] [CrossRef] [Green Version]
  51. Lee, C.; Yang, W.; Parr, R.G. Development of the Colle-Salvetti Correlation-Energy Formula into a Functional of the Electron Density. Phys. Rev. B 1988, 37, 785–789. [Google Scholar] [CrossRef] [Green Version]
  52. Van Lenthe, E.; Baerends, E.J. Optimized Slater-type basis sets for the elements 1-118. J. Comput. Chem. 2003, 24, 1142–1156. [Google Scholar] [CrossRef]
  53. Grimme, S.; Antony, J.; Ehrlich, S.; Krieg, H. A consistent and accurate ab initio parameterization of density functional dispersion correction (DFT-D) for the 94 elements H-Pu. J. Chem. Phys. 2010, 132, 154104. [Google Scholar] [CrossRef] [PubMed] [Green Version]
  54. Rodríguez, J.J.; Köster, A.M.; Ayers, P.W.; Santos-Valle, A.; Vela, A.; Merino, G. An efficient grid-based scheme to compute QTAIM atomic properties without explicit calculation of zero-flux surfaces. J. Comput. Chem. 2009, 30, 1082–1092. [Google Scholar] [CrossRef] [PubMed]
  55. Rodríguez, J.J.; Bader, R.F.W.; Ayers, P.W.; Michel, C.; Götz, A.W.; Bo, C. A high performance grid-based algorithm for computing QTAIM properties. Chem. Phys. Lett. 2009, 472, 149–152. [Google Scholar] [CrossRef]
Figure 1. View of the tricapped trigonal prism as the coordination polyhedron with the Ln ion in the center of the nine N atoms of the three coordinated Tp-ligands. Apical Ln–N bonds in black, dashed lines to the capping equatorial N atoms. Trigonal prism in yellow. N atoms: green. B atoms: yellow. C atoms omitted for reasons of clarity. The N atoms forming the trigonal prism are closer to the central metal than the ones capping the rectangular faces. The full structures of the CN9 and CN8 isomers are depicted in the Supplementary Materials (Figure S1).
Inorganics 09 00044 g001
Figure 2. Computed and experimental Ln–N bond distances of the CN9 and CN8 structures and the Ln3+ ionic radii (Å) [17]. The error bars correspond to the reported experimental uncertainties.
Inorganics 09 00044 g002
Figure 3. Ln atomic charges and non-localized electron densities (e) around Ln of the CN9 complexes from QTAIM analysis.
Inorganics 09 00044 g003
Figure 4. Delocalization indices (e), for single apical and equatorial Ln–N bonds as well as the sum over all the nine coordination bonds from the QTAIM analysis.
Inorganics 09 00044 g004
Table 1. Crystallographic details for CeTp3, NdTp3, SmTp3, and TbTp3 a.
CompoundCeTp3NdTp3SmTp3TbTp3
FormulaC4.5H5B0.5N3M0.16
Formula weight129.87130.56131.58133.01
Temperature100(2) K100(2) K100(2) K200(2) K
Wavelength0.71073 Å
Crystal systemhexagonal
Space groupP63/m
Unit cell dimensionsa = 11.735(2) Å,
c = 13.595(3) Å
a = 11.7325(4) Å,
c = 13.5550(7) Å
a = 11.692(1) Å,
c = 13.569(2) Å
a = 11.699(1) Å,
c = 13.628(3) Å
Volume1621.5(6) Å31615.9(1) Å31606.3(4) Å31615.6(5) Å3
Z12
Density (calc.)1.596 Mg/m31.610 Mg/m31.632 Mg/m31.640 Mg/m3
Abs. coefficient1.456 mm−11.659 mm−11.880 mm−12.241 mm−1
F(000)782786790796
Crystal size (mm3)0.11 × 0.07 × 0.030.13 × 0.08 × 0.070.05 × 0.04 × 0.040.2 × 0.25 × 0.10
θ range2.004 to 28.650°2.004 to 28.493°2.011 to 28.364°2.010 to 28.341°
Index ranges−15 ≤ h ≤ 15,
−15 ≤ k ≤ 15,
−17 ≤ l ≤ 18
−14 ≤ h ≤ 15,
−15 ≤ k ≤ 15,
−17 ≤ l ≤ 17
−15 ≤ h ≤ 15,
−11 ≤ k ≤ 15,
−17 ≤ l ≤ 16
−15 ≤ h ≤ 15,
−15 ≤ k ≤ 15,
−17 ≤ l ≤ 17
Reflections
collected:
independent:
29,215
1424
[R(int) = 0.07021]
29,802
1392
[R(int) = 0.0395]
20,385
1365
[R(int) = 0.0633]
16,998
1392
[R(int) = 0.0486]
Observed [I > 2σ(I)]1323131312041249
Coverage (θ = 25°)100%100%100%100%
Data/restraints/parameters1424/0/1081392/0/1081365/0/1081392/0/108
Goof on F21.1191.0801.0681.080
R indices [I > 2σ(I)]R1 = 0.0209R1 = 0.0179R1 = 0.0232R1 = 0.0207
R indices (all data)wR2 = 0.448wR2 = 0.0428wR2 = 0.0488wR2 = 0.0387
Largest peak/hole0.412/−0.489 e.Å−30.766/−0.541 e.Å−30.566/−0.450 e.Å−30.329/−0.420 e.Å−3
a Standard deviations in parentheses.
Table 2. Experimental and computed Ln–N bond distances (Å) of CN9 complexes a.
LnM–NapicalM–Nequatorial
XRDDFTXRDDFT
La2.659(6) b2.6632.80(1) b2.807
Ce2.615(1)2.6372.777(2)2.789
Pr2.609(6) c2.6122.783(6) c2.784
Nd2.589(1), 2.599(7) c2.5942.763(2), 2.804(7) c2.778
Sm2.565(2), 2.540(6) d2.5622.754(2), 2.753(7) d2.773
Eu2.533(5) b2.5442.76(1) b2.784
Gd2.518(5)2.5352.750(7)2.770
Tb2.523(2)2.5202.757(2)2.764
a The literature XRD values from Refs. [6,7,8] and those of GdTp3 are RT data. Standard deviations in parentheses. The theoretical data were obtained by ZORA-B3LYP-D3/TZP calculations. b From Ref. [7]. c From Ref. [6]. d From Ref. [8].
Table 3. Energy decomposition of the Ln…Tp3 interaction in selected LnTp3 complexes a.
EnergyLa(CN9)Gd(CN9)Lu(CN9)Lu(CN8)
ΔVelst−4060.6−4175.6−4204.3−4205.1
ΔEoi−1723.4−1907.7−1994.2−2035.3
ΔEPauli702.2656.4609.3701.3
ΔEint−5081.7−5426.9−5589.0−5539.2
ΔVelst/(ΔVelst + ΔEoi) (%)70.268.667.867.4
a Energy contributions (kJ/mol) as defined in Equation (1). The coordination isomers are given in parentheses.
Publisher’s Note: MDPI stays neutral with regard to jurisdictional claims in published maps and institutional affiliations.

