Enhancing Content Discovery of Open Repositories: An Analytics-Based Evaluation of Repository Optimizations


1
Scholarly Publications and Research Data, IS Information Management, University of Strathclyde, Curran Building, 101 St James Road, Glasgow G4 0NS, UK
2
iSchool, Department of Computer and Information Sciences, University of Strathclyde, Glasgow G4 0NS, UK
Publications 2020, 8(1), 8; https://doi.org/10.3390/publications8010008
Submission received: 25 November 2019
/
Revised: 20 January 2020
/
Accepted: 22 January 2020
/
Published: 6 February 2020
(This article belongs to the Special Issue 14th International Conference on Open Repositories 2019 – All The User Needs)
Abstract
:Abstract
Ensuring open repositories fulfil the discovery needs of both human and machine users is of growing importance and essential to validate the continued relevance of open repositories to users, and as nodes within open scholarly communication infrastructure. Following positive preliminary results reported elsewhere, this submission analyses the longer-term impact of a series of discovery optimization approaches deployed on an open repository. These approaches were designed to enhance content discovery and user engagement, thereby improving content usage. Using Strathprints, the University of Strathclyde repository as a case study, this article will briefly review the techniques and technical changes implemented and evaluate the impact of these changes by studying analytics relating to web impact, COUNTER usage and web traffic over a 4-year period. The principal contribution of the article is to report on the insights this longitudinal dataset provides about repository visibility and discoverability, and to deliver robust conclusions which can inform similar strategies at other institutions. Analysis of the unique longitudinal dataset provides persuasive evidence that specific enhancements to the technical configuration of a repository can generate substantial improvements in its content discovery potential and ergo its content usage, especially over several years. In this case study, COUNTER usage grew by 62%. Increases in Google ‘impressions’ (266%) and ‘clicks’ (104%) were a notable finding too, with high levels of statistical significance found in the correlation between clicks and usage (). Web traffic to Strathprints from Google and Google Scholar (GS) was found to increase significantly with growth on some metrics exceeding 1300%. Although some of these results warrant further research, the article nevertheless demonstrates the link between repository optimization and the need for open repositories to assume a proactive development path, especially one that prioritises web impact and discovery.
Data Set
Data supporting this work are available under a Creative Commons Attribution (CC-BY) license at: https://doi.org/10.5281/zenodo.3146553.
1. Introduction
Institutional and subject-based repositories have become essential nodes within global open scholarly communications infrastructure [1]. Such repositories typically deliver a set of services to academic or disciplinary communities to ensure that digital content generated by community members is assured long-term management and dissemination [2]. The content dissemination potential of repositories is well noted and remains a core motivation of open science movement [3]. More than ever, users of repository content expect to discover open content easily, normally via search, and for their own content (typically scholarly content deposited in an open repository) to be equally discoverable. Repositories are, and have been, well placed to meet these needs but cannot remain static, isolated systems, removed from the changing technical expectations of discovery tools. This article contributes to the discussion surrounding user discovery needs and provides evidence that content discovery requires prioritization.
Better meeting user expectations is crucial to preserving the relevance of repositories as nodes within open science infrastructure. The emergence of proprietary scholarly communications platforms represents a significant future challenge for open repositories. Such platforms are increasingly demonstrating popularity within research institutions yet simultaneously often demonstrate poor support for open standards or prevalent open science technical protocols. Low levels of integration with existing open scholarly infrastructure is also recognised to be a frequent challenge [4,5,6]. Ensuring that repositories can continue to expose content as optimally as possible to search and discovery agents, and in a manner superior to alternative platforms, is therefore a key tenet of repositories and central to their relevance to users. Understanding the way in which this can be technically achieved is important too; COAR’s conceptions of Next Generation Repositories [7] has delivered an important development path for repositories to follow in coming years. This includes the promotion of repository ‘behaviours’ upon which functionality supporting better content discovery can be built, but also better support for social networking integrations and peer review or annotation within the global repository network. However, the need to gather evolving evidence on visibility and discovery remains a necessity to direct new or unexpected streams of technical work or to steer institutional decision making in instances where HEIs are confronted with choices about selecting or migrating scholarly communications platforms.
Using Strathprints, the University of Strathclyde repository as a case study, this article uses analytics on web impact, COUNTER usage, web traffic and other indicators over a 4-year time-frame. The principal contribution, described in Section 4 and Section 5, is to report on the insights this longitudinal dataset yields about repository visibility and discoverability, and to deliver robust conclusions which can then inform similar strategies at other institutions. The data presented were captured following the embedding of several technical adjustments and enhancements to Strathprints, which have been documented in more detail in previous work [8], and are especially relevant to both institutional and subject-based repositories. These adjustments and technical enhancements are reviewed in Section 3, within which the methodology is detailed. Data are described in Section 4 as is its collection and analysis. Related work is considered in the following section.
2. Repository Visibility and Discovery: Related Work
Previous work has noted the importance of repositories in promoting open scholarly communication and the discovery of open research content, e.g., [9,10,11,12]. The importance of repository visibility as a precursor to the discovery of this content has been addressed by the work of Aguillo [13], especially via the ‘Ranking Web of Repositories’ which attempts to monitor and rank repositories according to their visibility in Google Scholar indexes [14]. Such is the importance of visibility in generating repository discovery and eventual impact that the concept has been enshrined in the German DINI Certificate, which promotes best practice in standardization, interoperabity and service quality as a means of achieving superior repository visibility [15]. However, translating this visibility into content discovery remains a less understood area of research.
Arlitsch [16] provides a useful contribution on the role of search engine optimization (SEO), the importance of ‘white hat’ adjustments and its role in promoting repository indexing by common search engines, as well as academically focused discovery tools like Google Scholar. Related works by Askey and Arlitsch [17] have reported on the growing importance of white hat changes, such as a migration to HTTPS, as a contributory factor in ranking repository content within Google’s PageRank, with SEO toolkits also developed to support digital library service administrators in ’getting found’ [18]. It is noteworthy that the same group of researchers are responsible for the Repository Analytics and Metrics Portal (RAMP) which seeks to improve the quality of usage and traffic analytics [19].
Contributions have also emerged from individuals closer to the systems which refer much of the web traffic repositories seek, such as Google Scholar. Acharya [20], for example, delivers recommendations on repository optimization from a position of authority, noting how common technical failings inhibit satisfactory Google Scholar crawling and indexing. Acharya highlights various optimizations which can be performed on repositories in order to ensure improved Google Scholar crawling and indexing penetration. One of Acharya’s recommendations pertains to ‘coversheets’, the influence of which Tonkin et al. [21] explore in their survey of coversheet usage within the UK. Coversheets are additional pages which are typically prepended to the first page of any document served by a repository. A coversheet typically provides further information about the nature of the item downloaded, such as attribution information, full bibliographic reference details, copyright statement, and so forth. Acharaya [20] has noted that coversheets can disrupt the automated metadata extraction techniques used by Google Scholar as their technique is based on interpreting the first page of academic documents, most of which tend to follow a typical format and layout. Tonkin et al.’s analysis of the literature concluded that coversheets should be avoided as they can impede discovery but, lacking any supporting evaluative data, they acknowledge that local decision making on the part of repository administrators and developers is necessary. Suffice to state that the negative crawling issues arising from coversheet use in repositories is an issue highlighted more recently by Acharya [20], thereby supporting Tonkin et al.’s recommendations.
Despite these contributions to the literature, and despite the importance of repositories and their infrastructure in exposing open research content, wider understanding about repository visibility and discoverability remains embryonic. Few studies have sought to codify and then evaluate the impact of their approaches and many restrict their analyses to anecdotal observations surrounding the logical visibility benefits native to the majority of repository platforms. Recent related work by the present author has gone some way to addressing this by studying and codifying specific technical adjustments and improvements which can be made to an open repository, followed by the observation of longitudinal web analytics and usage data in order to assess the efficacy of these changes [8]. The emergence of COUNTER-compliant repository usage statistics has been an important development in this regard by providing a new, additional source of reliable usage statistics.
The COUNTER Code of Practice establishes open international standards and protocols for the provision of service-generated online usage statistics, specifically for digital resource usage [22]. This ensures consistent counting and processing of usage, including control for the interpretation of robot visits, unusual usage patterns, etc. By specifying what constitutes ‘usage’, COUNTER enables disparate services to supply data which are directly comparable. Interestingly, recent work by Wood-Doughty et al. [23] has identified anomalies in usage data reported by commercial publishers (a so-called ‘publisher effect’), suggesting a degree of divergence in the implementation of COUNTER where multiple agencies are responsible for reporting the statistics. However, the emergence of COUNTER-compliant usage data available from the UK national repository usage aggregation service, IRUS-UK, has provided new opportunities for understanding the nature of repository discoverability. By aggregating usage data for circa 200 repositories according to COUNTER, IRUS-UK provides a degree of authoritativeness in the figures it reports [24]. This provides repositories with comparable, authoritative, standards-based data and facilitates the profiling and benchmarking of repositories.
Preliminary experiments documented in [25] noted some encouraging evidence about the positive impact of certain repository enhancements, making use of IRUS-UK data, but the small nature of the study and dataset provided only indicative results. Results from a subsequent and more detailed study from the same stream of work [8] concluded that web traffic, search traffic and COUNTER usage could be improved on the most important search and discovery tools by deploying the specified technical changes. Strong correlations between Google search visibility and repository COUNTER usage were demonstrated, as were significant increases in web traffic, Google ‘impressions’ and ‘clicks’ and COUNTER usage.
3. Methodology
This article seeks to continue the aforementioned line of enquiry by validating the results reported in [8] through examination of a larger web impact and COUNTER usage dataset. This larger dataset encompasses a longer temporal period thereby compensating for the limited number of data points used in the aforementioned work. The dataset for this current article, described in detail within Section 4, captures data over a four-year period instead of three or two years, as in the less exhaustive studies. Analyses performed on such a large dataset better delivers reliable and actionable conclusions which can then inform repository discovery strategies elsewhere. The case study repository for this article, Strathprints1, the University of Strathclyde institutional repository, is powered by EPrints (version 3.3.13). Though EPrints is the focus here, it is thought that most of the adopted technical changes are equally applicable to other repository platforms.
3.1. Implemented Repository Changes
Prominent repository platforms (e.g., EPrints, DSpace, Digital Commons, OJS, etc.) continue to demonstrate out-of-the-box support for discovery and interoperability with key academic tools, e.g., Google Scholar (GS), scholarly aggregators like CORE and BASE, etc. However, there nevertheless remains wide variation in the relative visibility and discoverability of repository content, even across similar or the same repository platforms, such that it is necessary to take steps towards repository optimization. To effect change in web visibility and user engagement, thereby improving usage, a series of technical ‘improvements’ and ‘adjustments’ were implemented on Strathprints in March 2016.
‘Improvements’ were changes that resulted in substantive modifications to repository functionality, while ‘adjustments’ included actions that sought to refine existing aspects of the repository. As this article is largely concerned with the effect of the technical changes and the resulting data, the nature of the adjustments and improvements are only summarised in Table 1 to provide context. Full details, including the motivation behind these changes, are instead available from [8]. Suffice to state that few of either the improvements or adjustments were onerous to implement and most are feasible to action by repository development managers. This is largely because the most significant pertain to the repository front-end thus making any serious software re-engineering unnecessary. For example, adherence to site speed best practice, such as asynchronous loading of resources, CSS and Javascript minification, GZIP compression, etc., all of which have become important signals for Google [26]. Similarly, ensuring a positive mobile experience for users has become a signal in PageRank, with a heavier weighting assigned in recent search engine updates [27,28].
3.2. Data Collection
A variety of metrics were monitored in order to measure the influence of the technical ‘adjustments’ and ‘improvements’ to Strathprints, including search traffic data from Google Search Console2, COUNTER compliant usage data from IRUS-UK3, Google Analytics4 (GA) tracking data and routine statistical data from Strathprints itself.
Search metrics offer an appropriate measure of repository content discoverability. Google Search Console was therefore used to capture search data during the reporting period, thereby enabling the effect of the technical adjustments and improvements to be explored on Google search queries. The distinction between ‘impressions’ and ‘clicks’ is recognised by Search Console and is reflected in its search data. Impressions are stated as arising when “A link to a URL record ... appears in a search result for a user“, while a click is “any click that sends the user to a page outside of Google Search” [29]. Data pertaining to clicks and impressions were extracted from Search Console and compiled in a .csv file.
Reporting from Google Analytics can provide rich data on web traffic and its sources. Site content behaviour reports were generated for the relevant periods within Google Analytics, with ‘acquisition’ used as a secondary dimension to capture ‘source’, thereby providing data on traffic referral sources as well as typical data on number of page views, unique page views, page path and so forth. Data were exported to .csv for further analysis.
COUNTER compliant usage data from IRUS-UK was generated via an ‘item report 1’. The item report 1 provides details of the number of successful item download requests by month and by repository identifier. Data relating to item URL, title, author(s), item type and total downloads by month and in total for the period selected are included in this report and were also exported to a .csv file.
All data were captured for the year up to March 2016, representing Year 1 (Y1 = 2015/2016). This ensured a data baseline for repository web impact prior to the implementation of the technical changes. Data were then monitored for the same periods during Year 2 (Y2 = 2016/2017), Year 3 (Y2 = 2017/2018) and Year 4 (Y4 = 2018/2019), with data collection ending on 31 March 2019.
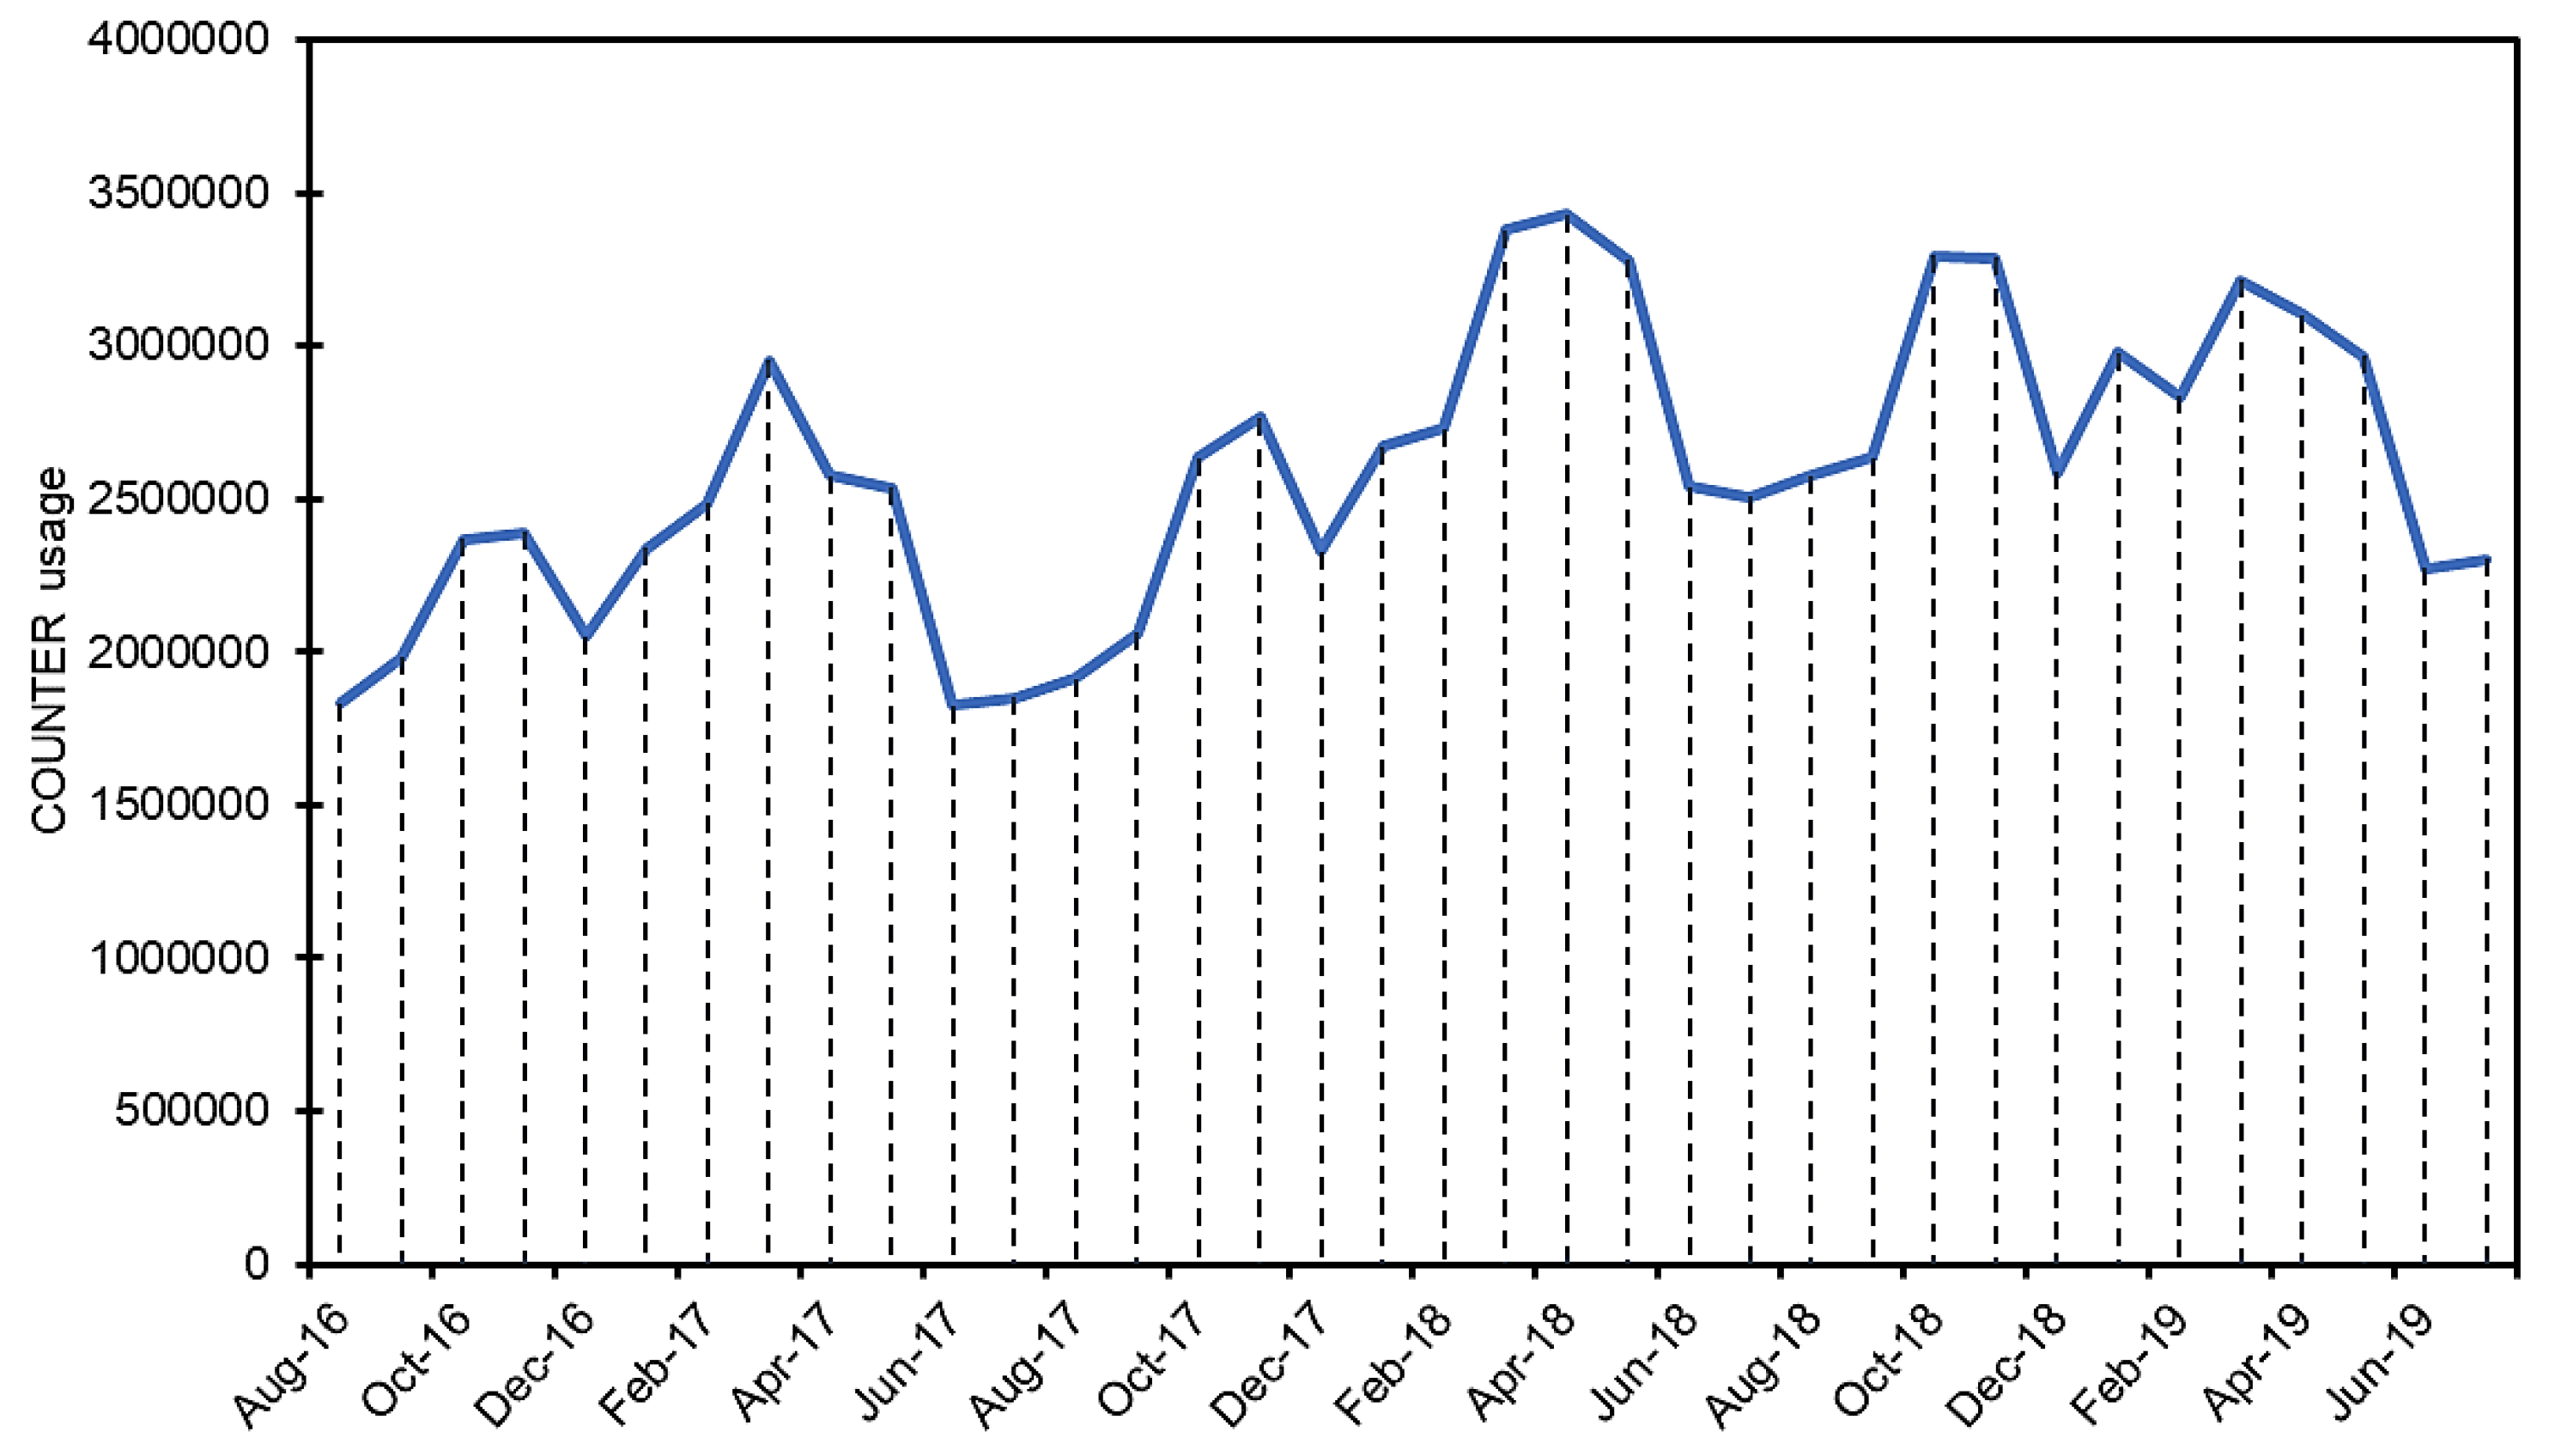
The usage of repositories can be cyclical in nature, with usage reflecting the periods when researchers and students tend to be busiest. It is therefore typical to observe increases in usage during academic semesters and declines during summer, spring and winter vacation periods. Data from the present author’s prior work used data that followed these cyclical patterns. Increases in usage, followed immediately by near commensurate declines, can be observed from the chart in Figure 1, which displays the total usage of 88 IRUS-UK member repositories between August 2016 and July 2019. For this reason the analysis in this current article employs an alternative temporal segmentation thereby controlling for any data variation potentially arising from these established usage patterns. Altering the segmentation controls for any confirmation bias emerging from prior analyses and better tests whether observations in these prior analyses hold true when usage periods are modified. For example, in this instance the year up to March 2016 is examined, and the same period in each subsequent year. Related prior work instead analysed data based on a typical academic calendar year (years up to end July) [8] and years up to end June [25]. Examining an alternative temporal segmentation may limit direct comparisons with specific data points within prior analyses but is a justifiable compromise to ensure effects are observable where data are segmented differently.
4. Results
4.1. Analytics
Measurement of web traffic and unique web traffic was performed using Google Analytics (GA). Data are set out in Table 2.
Traffic in Y2 increased by 68,824 to 365,024, equating to a 23% improvement when compared to Y1. A 22% improvement in unique traffic was also observed ( = 276,042). Y3 also yielded a 23% increase in traffic on Y2 ( = 450,520), with percentage growth in unique traffic equivalent to 26% ( = 346,851). The increase in traffic and unique traffic for Y4 was lower than Y3 at 9% and 10% respectively.
These increases in traffic initially appear to be lower than those reported previously [8] which, for example, reported a Y2 traffic increase of 54%, from 150,408 to 428,407, considerably higher than the 23% improvement reported here. Similar disparities can be observed for Y3 data too. However, it should be noted that the alternative segmentation of annual web impact data have altered the spread of traffic data across years, making direct comparisons to previous results problematic. Indeed, while [8] reported a plateauing of traffic (6%) and unique traffic (8%) in Y3, this article instead reports a considerable percentage increase at 23% and 26% for Y3, with plateauing of traffic (9%) and unique traffic (11%) observed in Y4. This means that total percentage growth during the entire reporting period of this present study was more significant, at 65% and 69% for traffic and unique traffic respectively. This actually exceeds previously reported results but highlights the difficulties which can arise from studying different ‘annual segments’ of data.
Google was again found to be the single largest referral source during the reporting period, accounting for 56% of all repository traffic in Y4. Over the entire reporting period this referral traffic (including unique traffic) increased by circa 1500% (Table 2). The most significant referral source thereafter was found to be Google Scholar (GS), equivalent to 26% of all web traffic by Y4 and growing by 1920% during the entire reporting period (Table 2). Much of this massive percentage growth can be observed in Y2, owing to a low baseline in GS traffic during Y1 but with significant increases observed in Y3 and Y4 also.
To verify the influence of outlying data points it is worthwhile briefly reviewing the extent of data variability using some common measures of central tendency. Table 3 sets out measures5 for the total traffic data detailed above in Table 2 (‘Current data—A’) alongside the same measures for data reported in previous work [8], labelled in Table 3 as ‘Prior data—B’. Data used for ‘Prior data—B’ are publicly available [30].
A higher mean and lower standard deviation for total ( = 400,221; = 86,594. = 386,908; = 95,203) and unique traffic ( = 308,200; = 70,162. = 296,311; = 73,251) can initially be observed within ‘Current data (A). When Google and GS are considered separately, however, we notice the opposite, with lower mean traffic and higher levels of variability around the mean, highlighting the low baselines in Y1 for both Google and GS.
By excluding Y1’s outlying data from these measures, as we have done in the bottom row of Table 3, we can note a higher mean, and less variability around the mean, for total ( = 434,895; = 63,516) and unique traffic ( = 335,337; = 54,458). Similarly, higher means and lower deviations for Strathprints traffic and unique traffic from Google Scholar can be observed. Interestingly, while higher means are observable for traffic and unique traffic from Google, a slightly higher standard deviation is found when compared to ‘Prior data—B’.
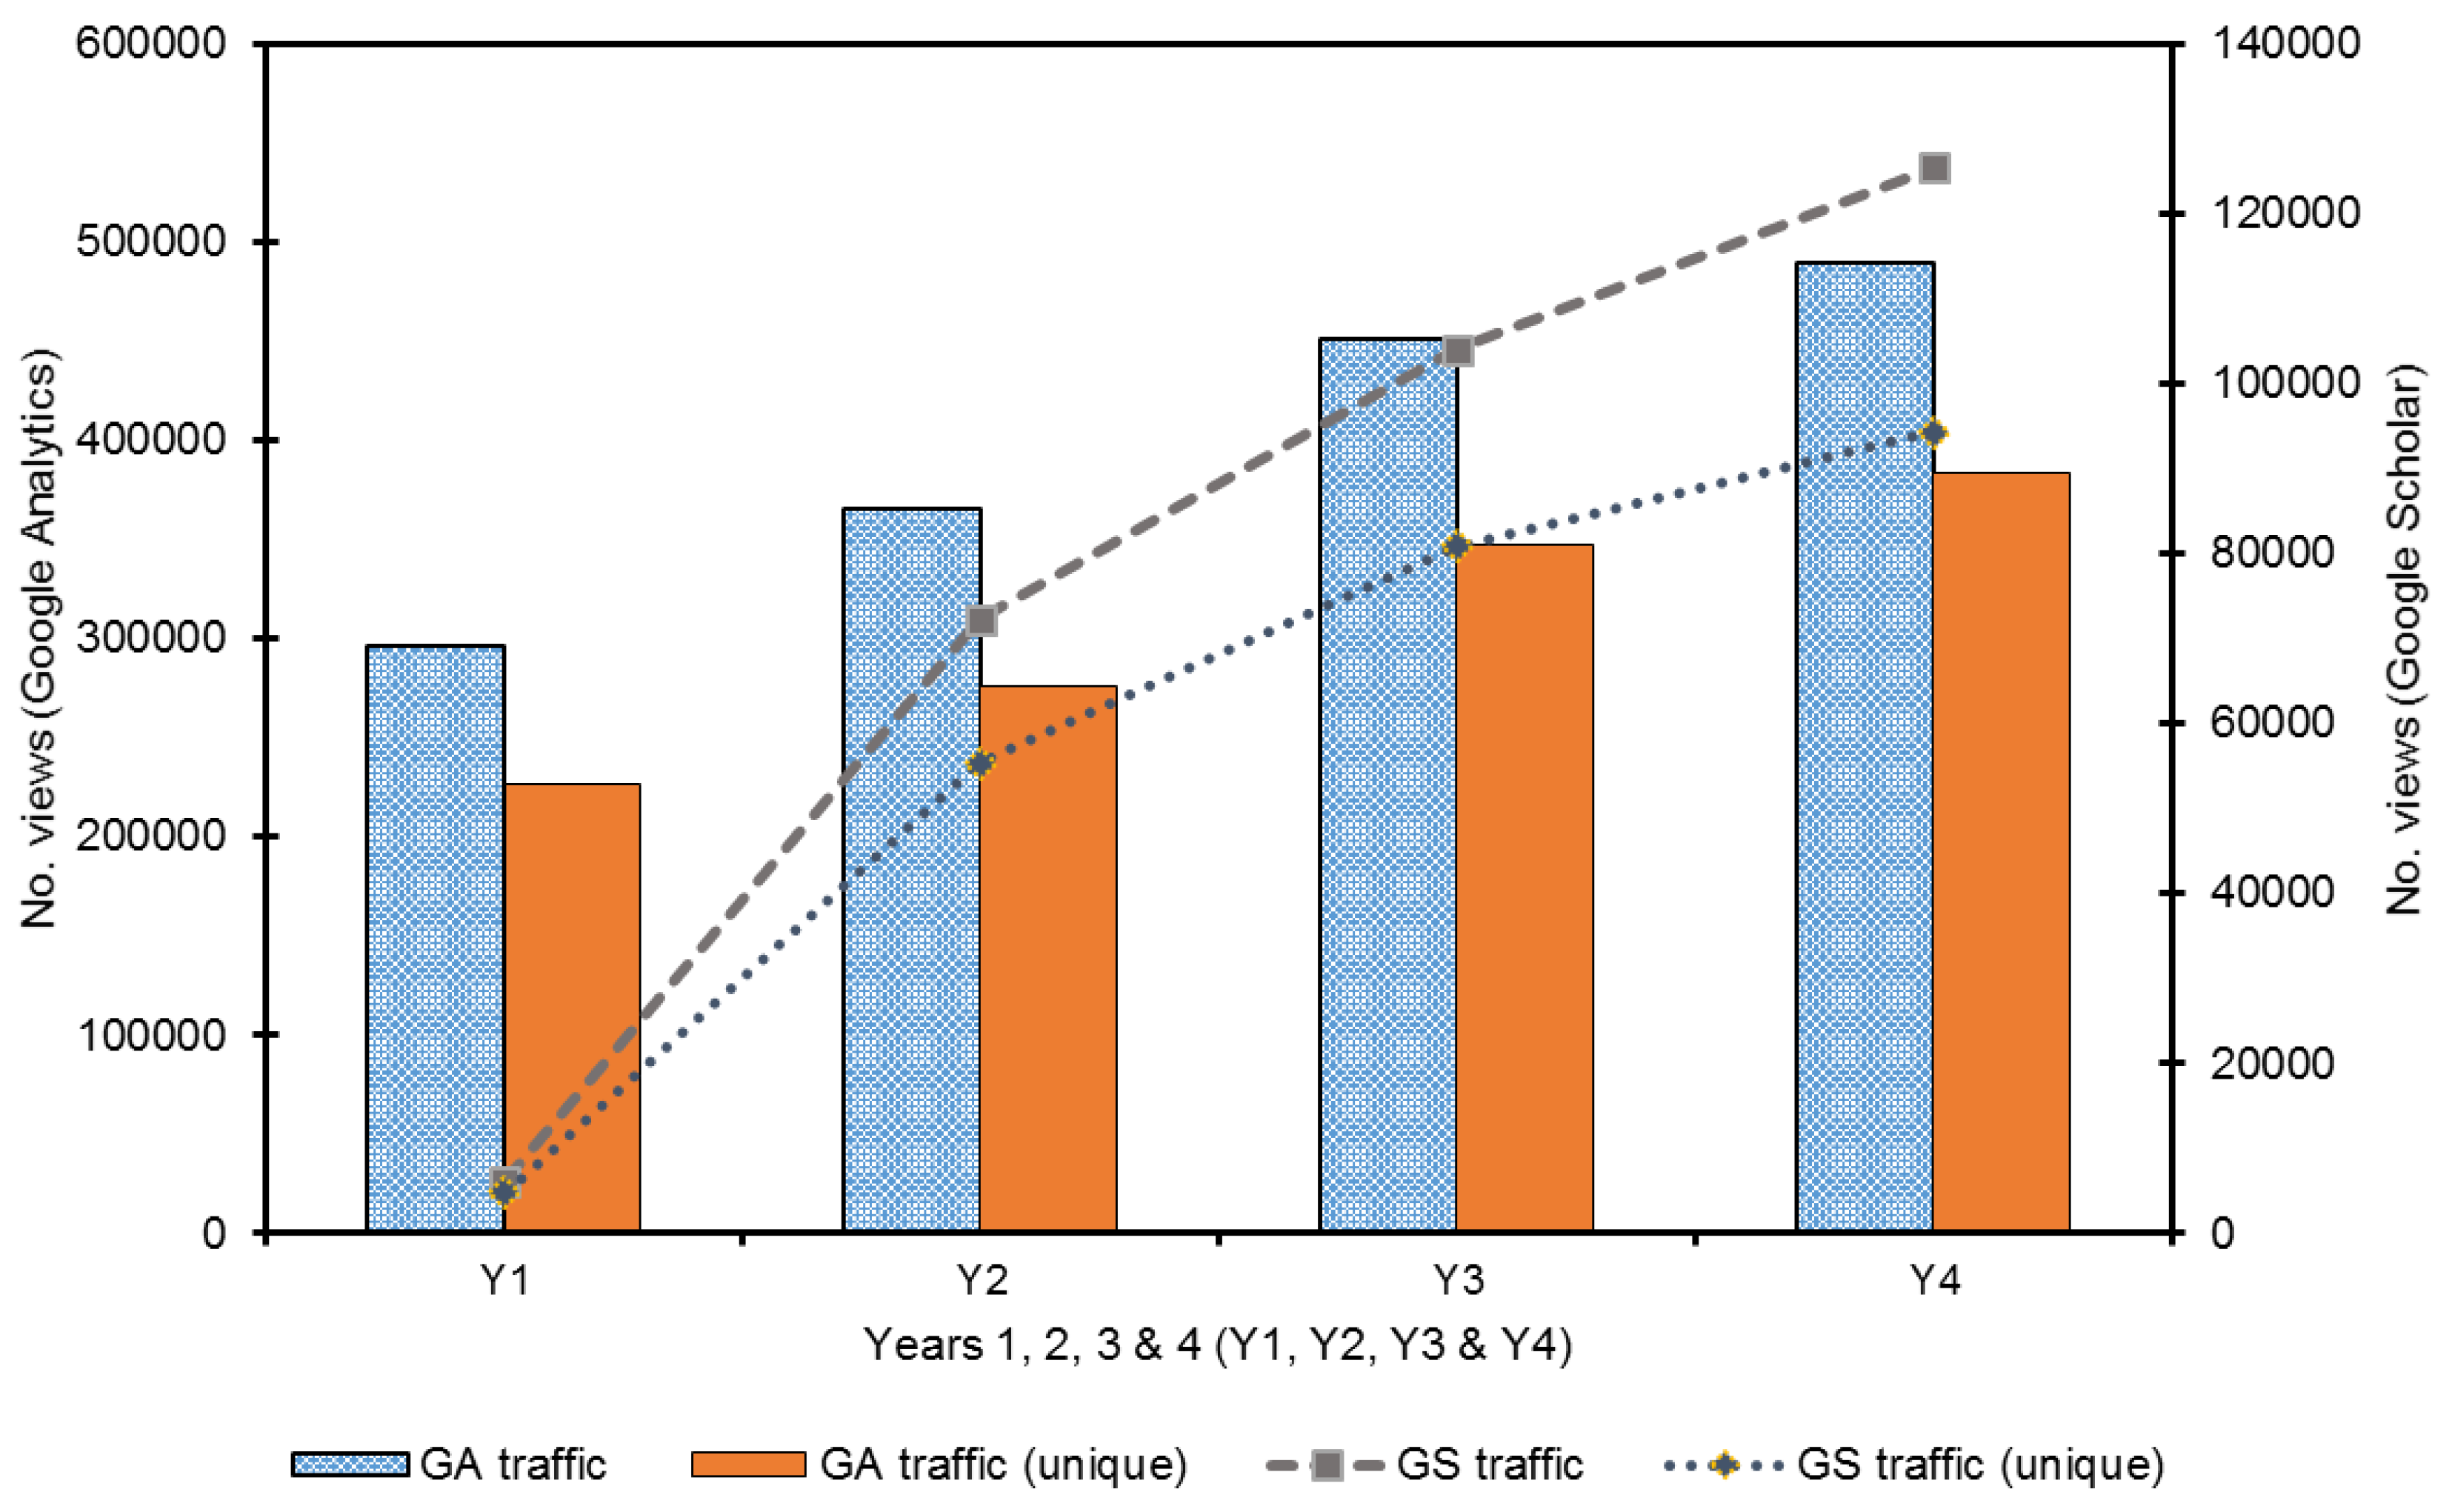
It is significant to note from Table 2 that the traffic gains to Strathprints from GS during the reporting period experienced a more rapid rate of growth when compared to the general population of other web traffic sources. Even if we were to consider the large growth observed in Y1–Y2 as anomalous and were to exclude it from data as an outlier, a 74% and 70% increase in GS referral traffic and unique traffic respectively can still be observed between Y2 and Y4. This exceeds the growth rates in total (34%) and unique total traffic (39%) by some margin. Rapid growth in referral traffic from Google itself can also be found to have increased by 67% and 69% for traffic and unique traffic respectively. This is clearly lower than the figures for GS but nevertheless exceeds the growth rates observed in the wider pool of referral sources and may explain the higher standard deviation noted in ‘Current data—A*’. The especially steep increase in GS traffic and unique traffic can perhaps best be observed by the profile of the chart presented in Figure 2.
4.2. Repository Content Discovery and Usage
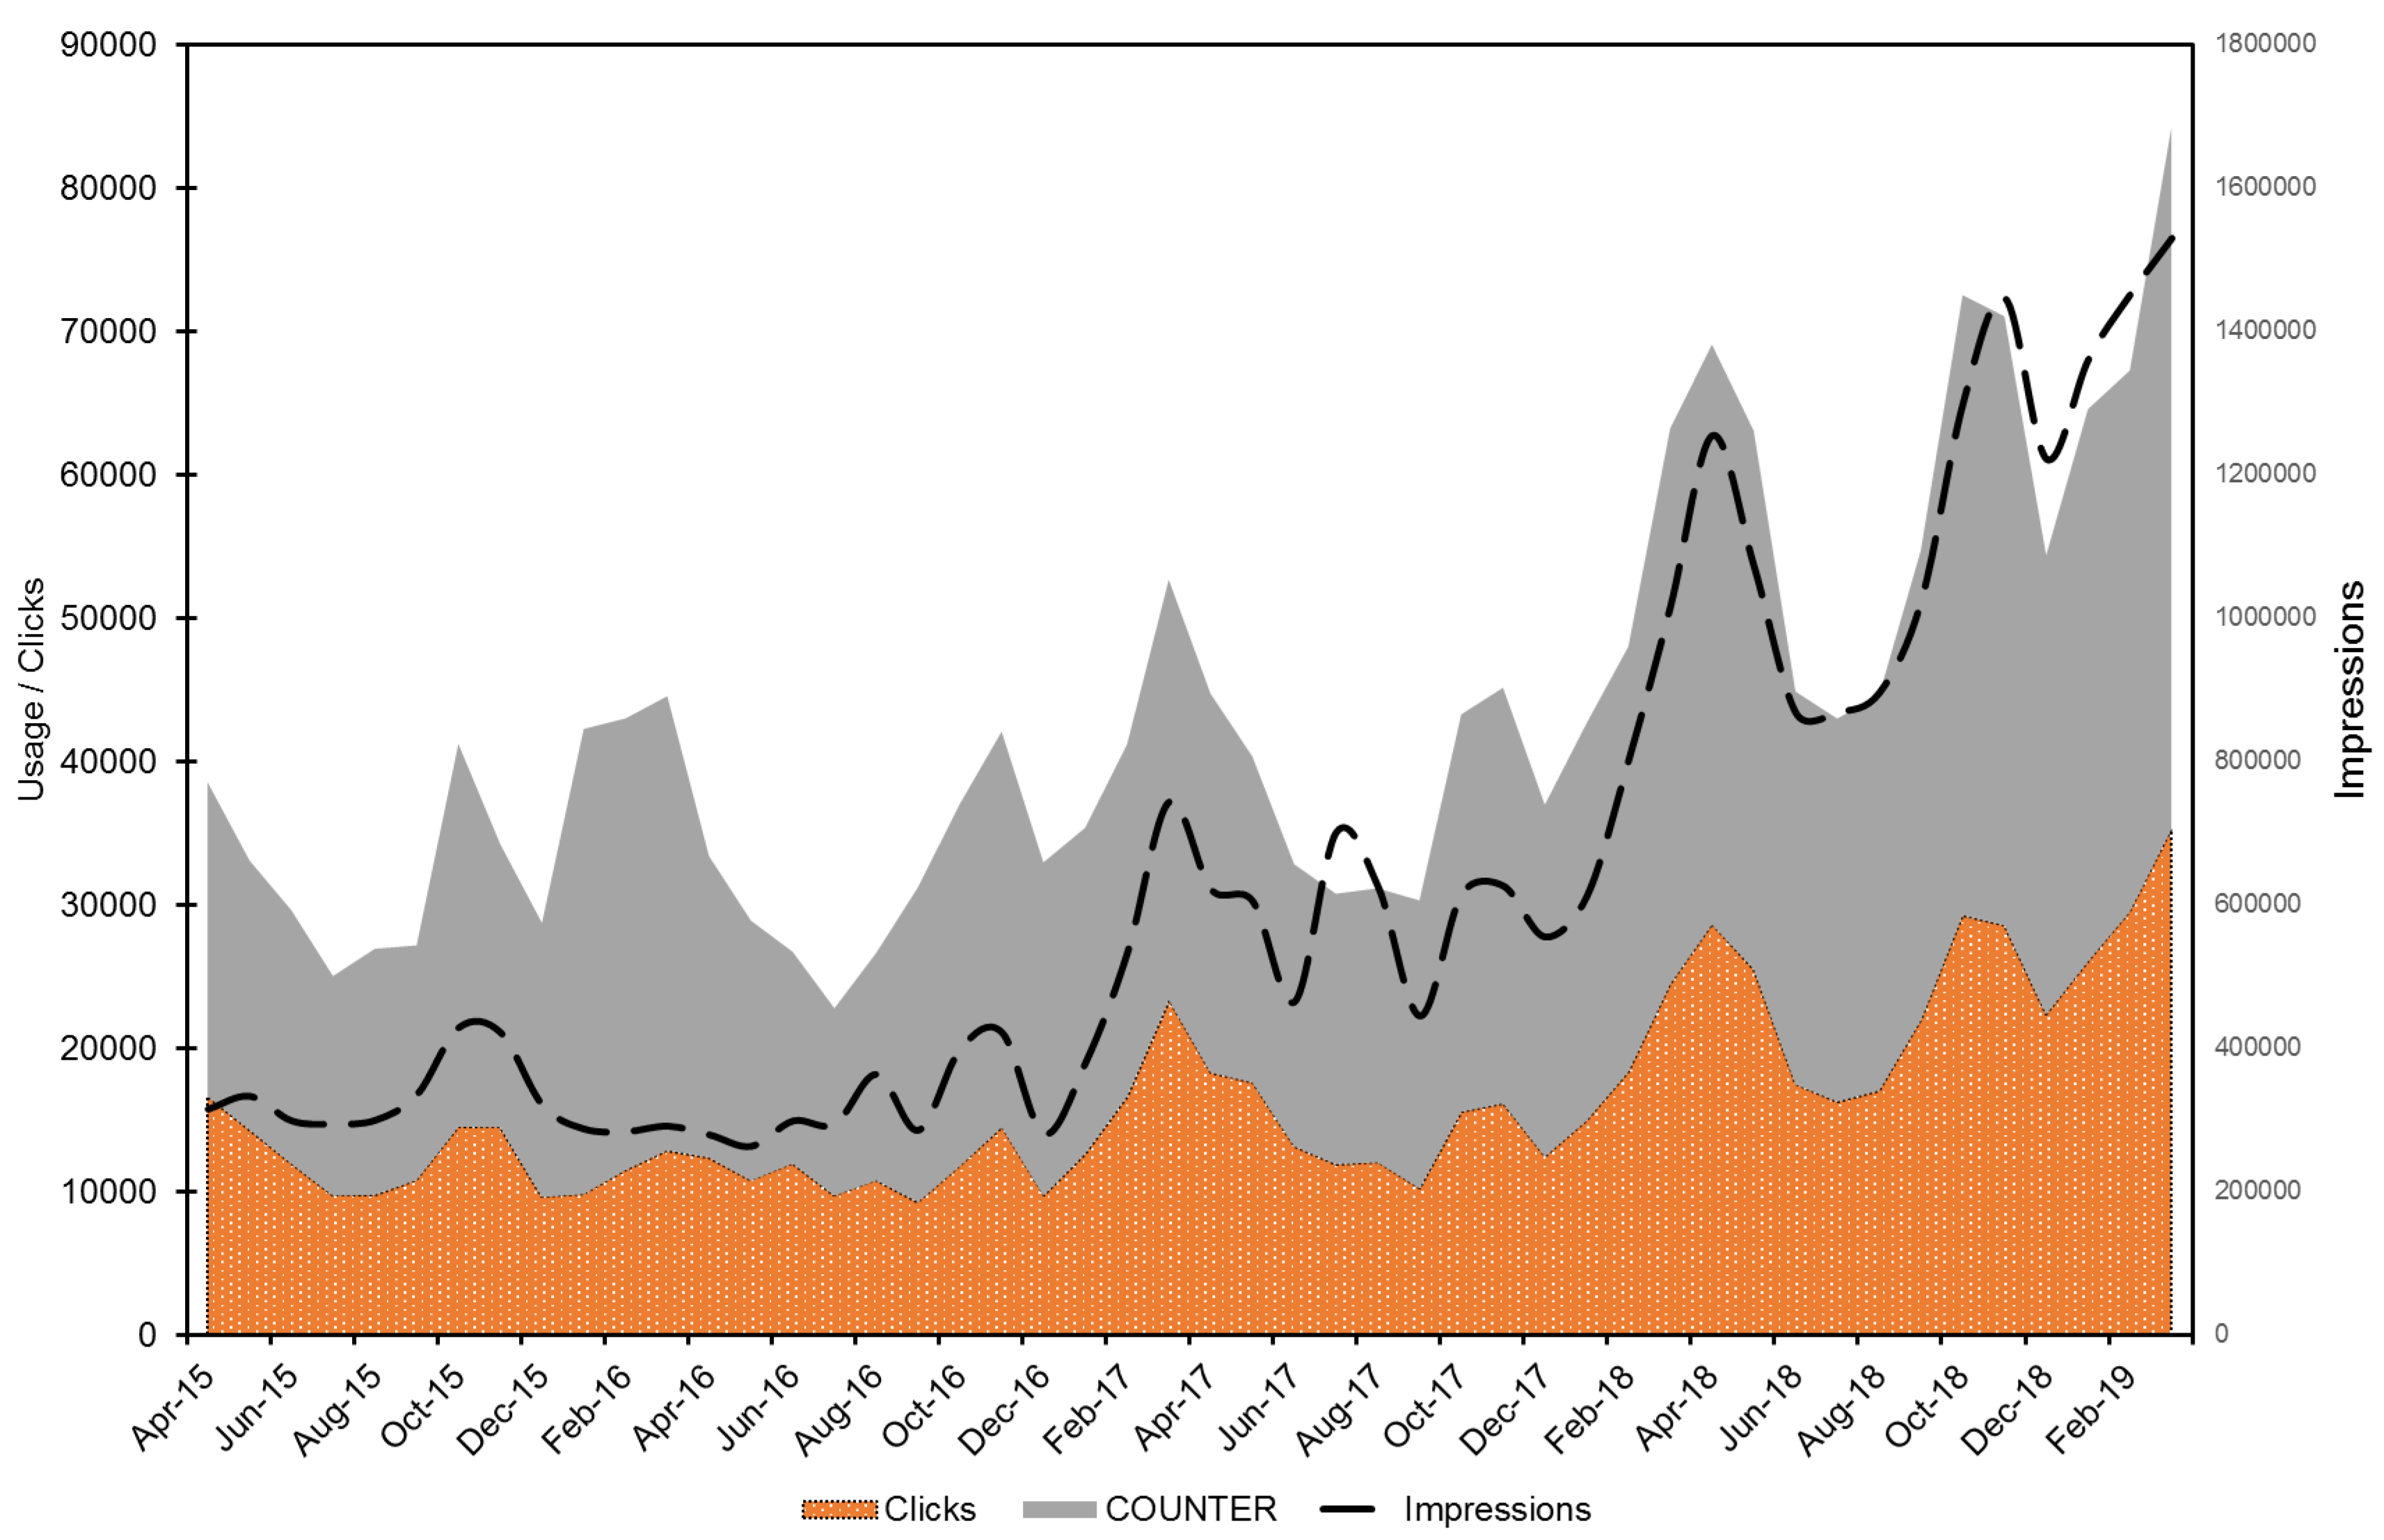
Improvements in impressions and clicks were observed in Y2 at 16% ( = 4,537,744) and 23% ( = 153,539) respectively when compared to the Y1 period. This upwards trend accelerated in subsequent reporting years. In Y3 a 69% ( = 7,687,550) and 21% ( = 185,232) increase in impressions and clicks respectively can be observed, followed by an 86% ( = 14,290,059) and 61% ( = 298,020) increase in Y4. This general upwards trend in impressions and clicks, including the aforementioned acceleration in Y3 and Y4, can be observed in Figure 3.
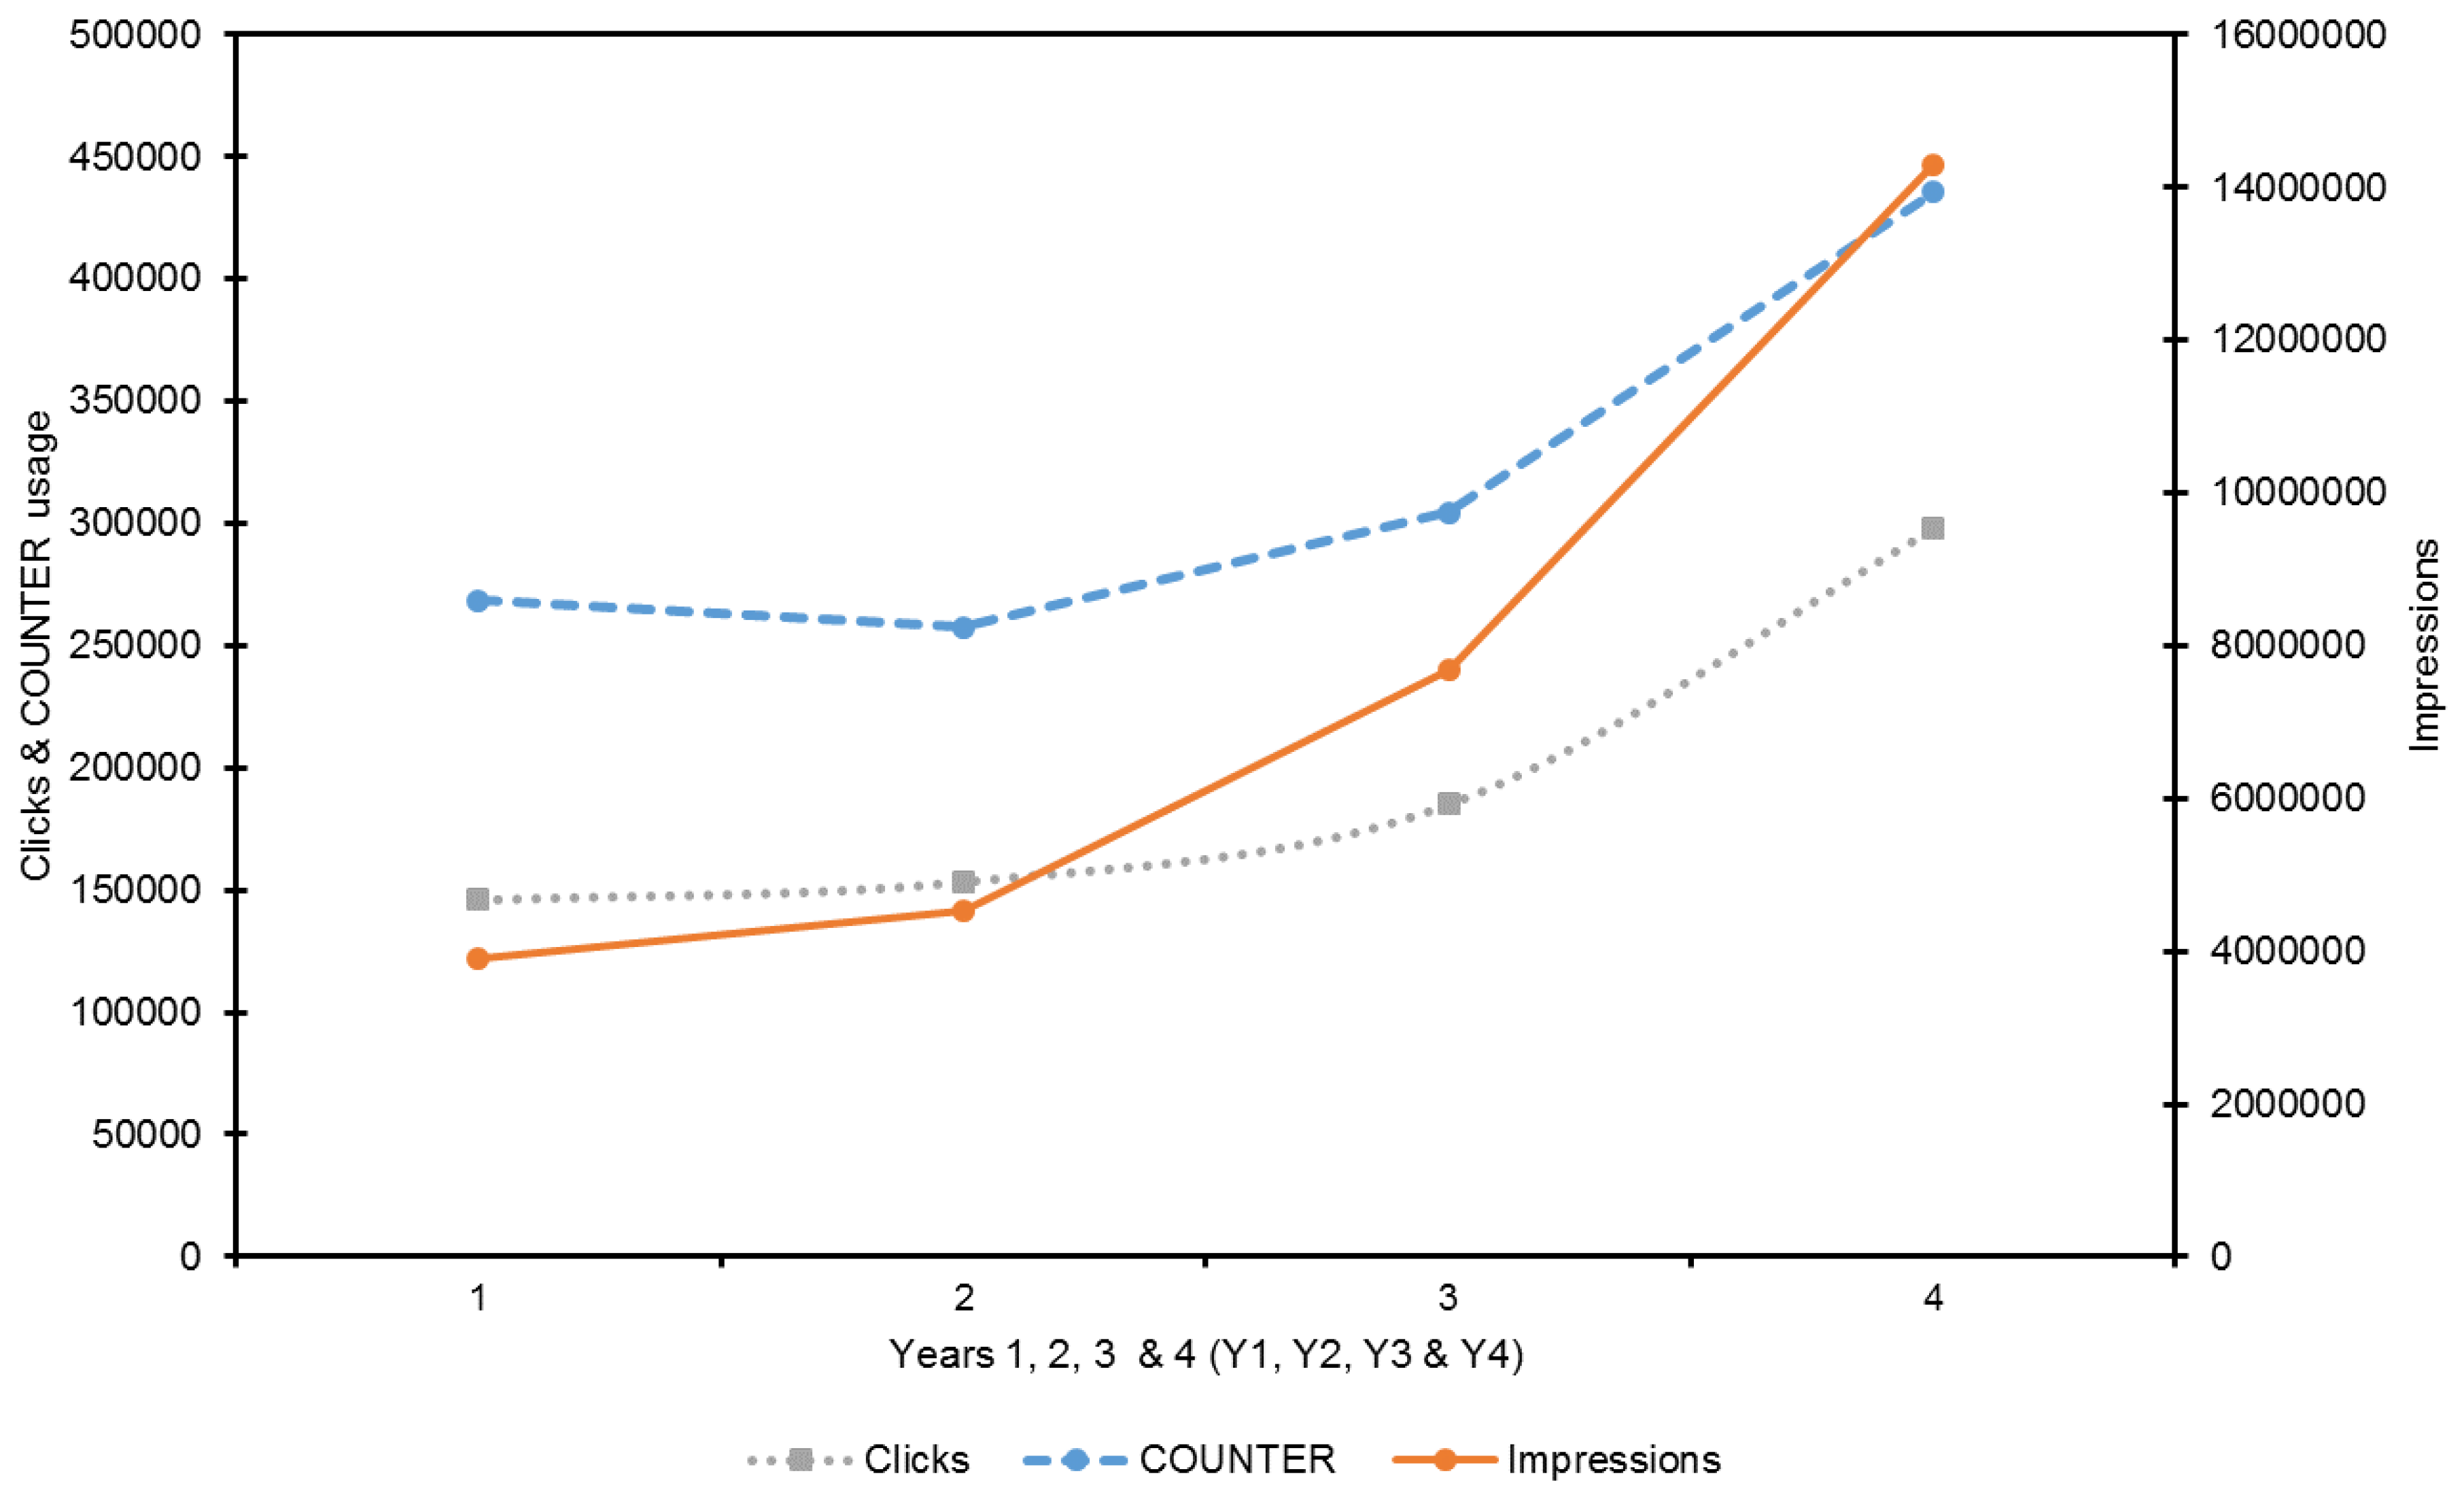
Data are contained in Table 4. The total percentage growth in impressions and clicks during the entire reporting period was 266% and 104% respectively. Figure 4 summarises the increase in clicks, impressions and COUNTER usage; sharper increases in impressions and clicks can be noted between Y2 and Y4.
Strathprints demonstrated a 62% growth in COUNTER compliant usage during the full period examined (i.e., Y1–Y4). It is noteworthy that this growth was observed despite only a 23% growth in full-text deposits during the same period. Even where embargoed content is factored into total full-text deposits, growth remained lower (54%) than the overall increase in usage. As noted in previous work [8], usage appears to demonstrate a more nuanced pattern when it is examined on a year by year basis. Usage in Y1–Y2 is particularly notable since it deviates considerably from the results reported previously and indicates that in the first year of observation Strathprints actually demonstrated negative growth, albeit minor. Conversely, Y4 yielded a 43% increase in COUNTER usage with only a 20% increase in full-text deposits recorded. Similarly, Y3 yielded an 18% increase in usage but experienced negative growth in full-text deposits (−22%).
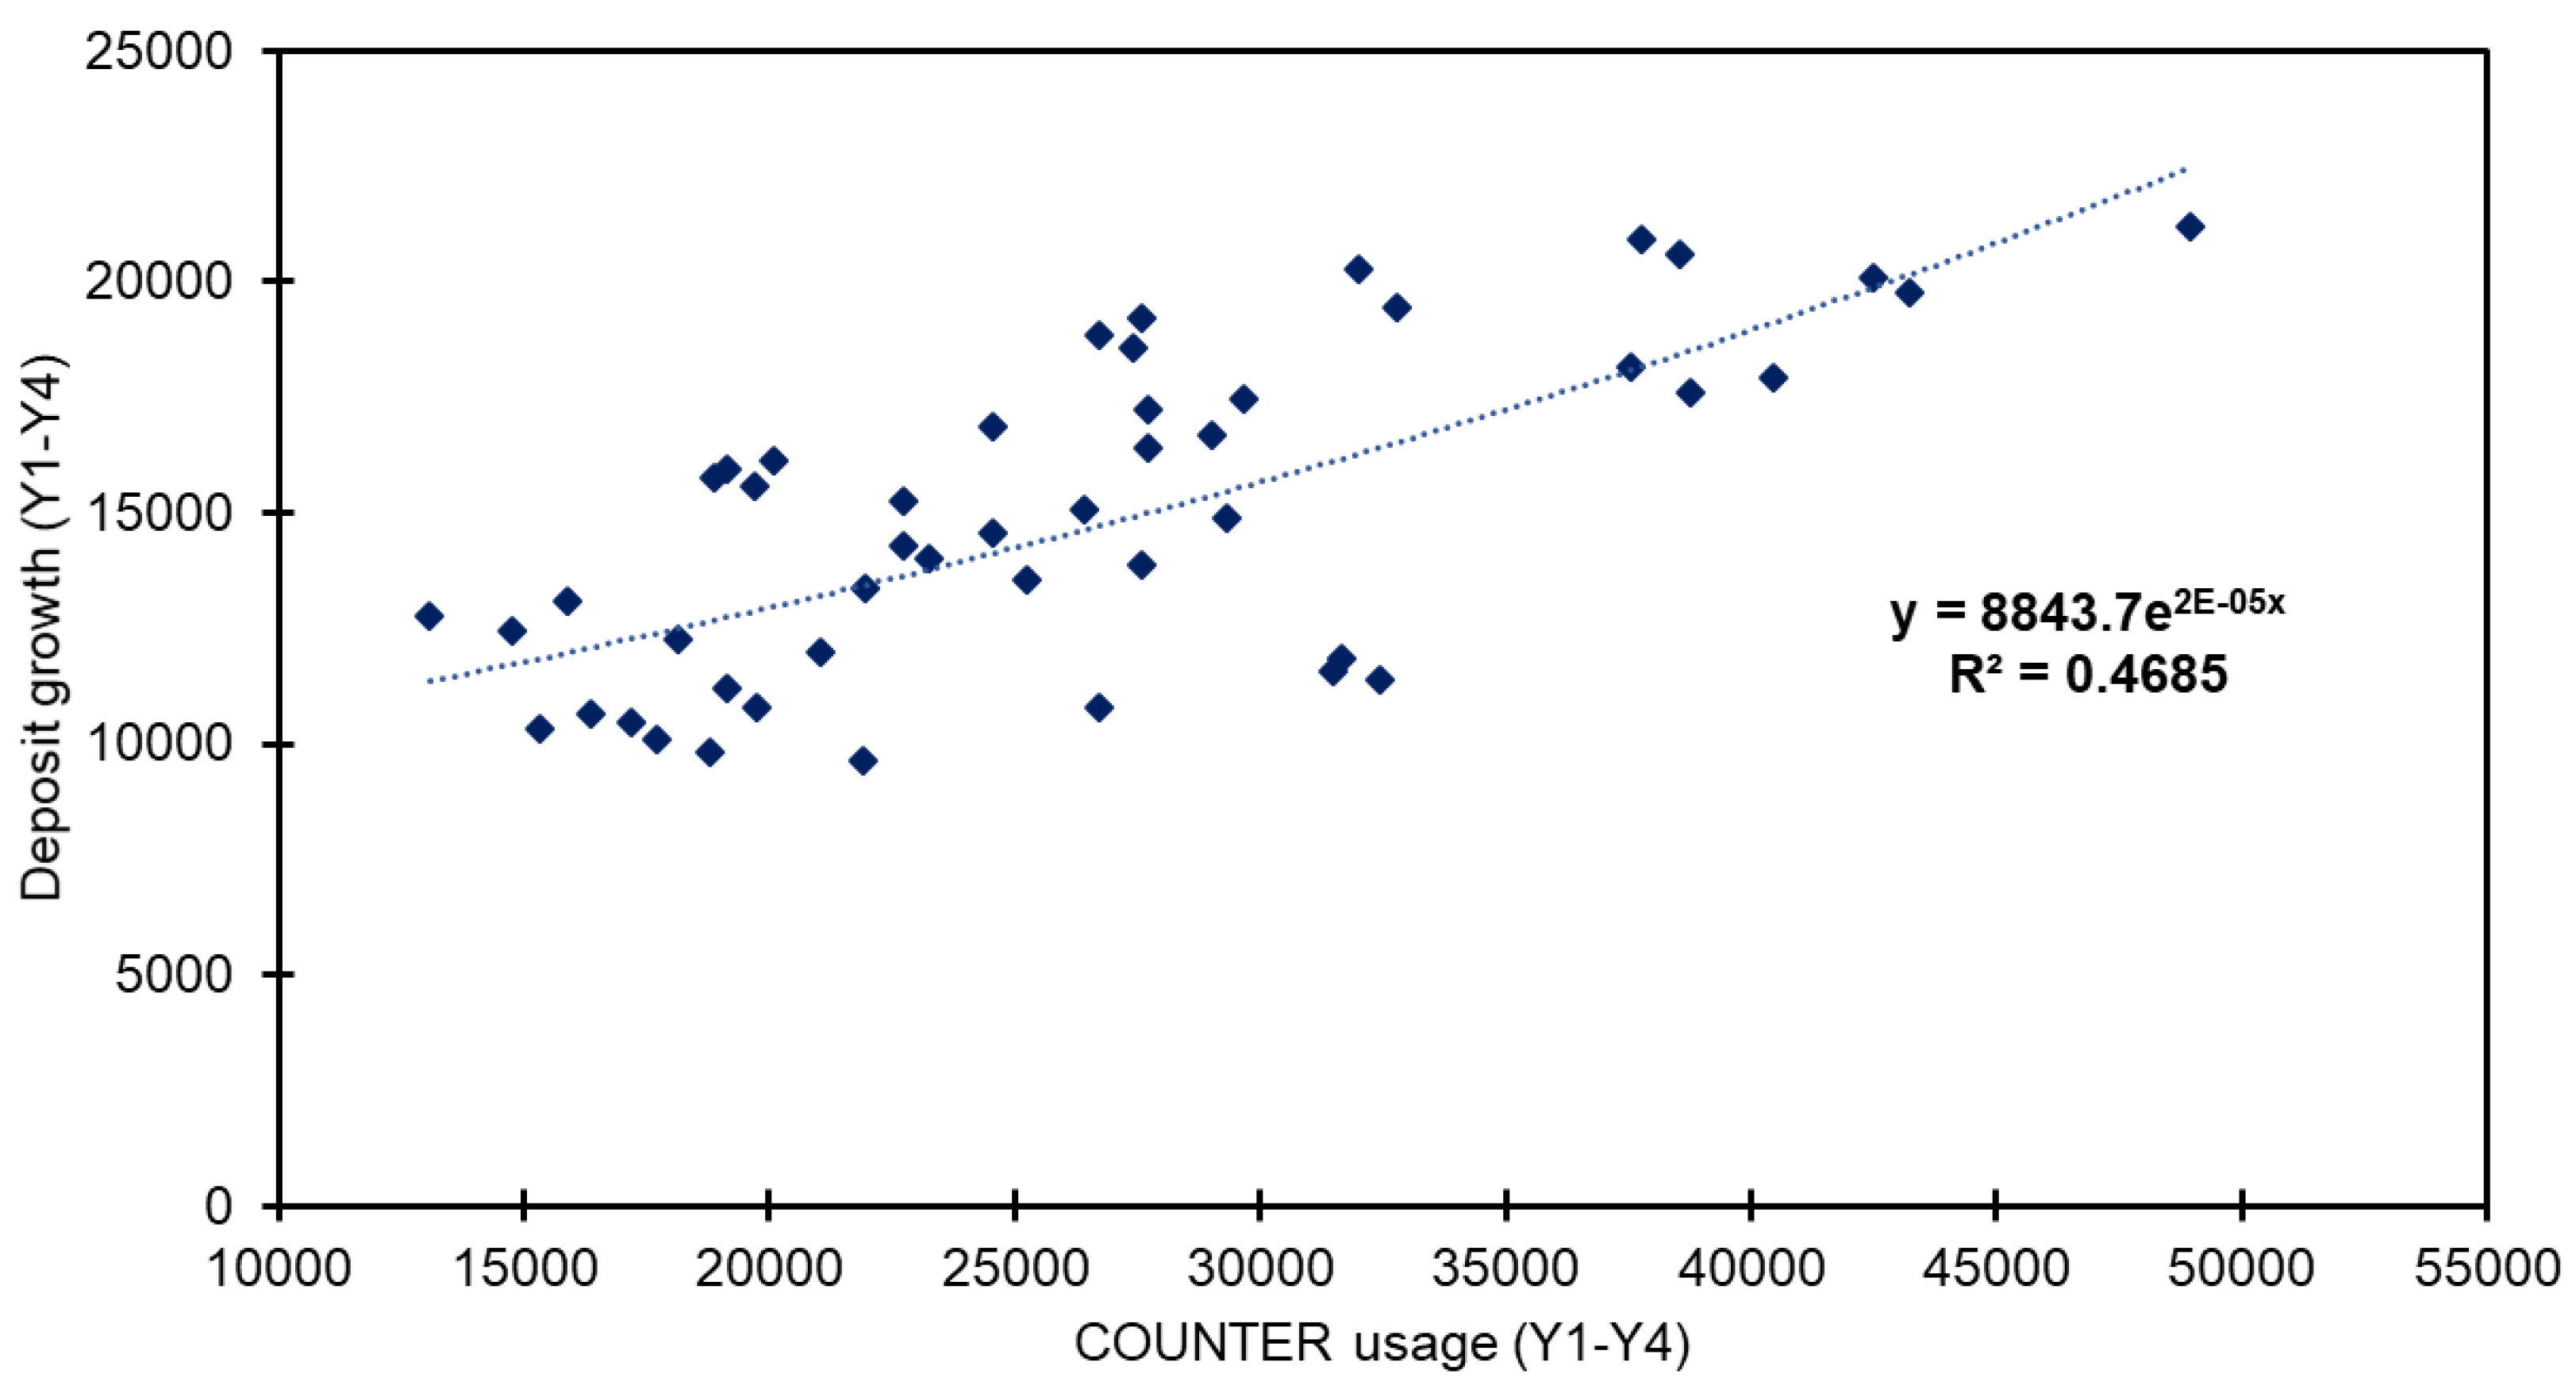
It might be assumed that patterns in usage follow an exponential growth model, based on the volume of content deposited over time. In other words, that any increase in usage is directly proportional to increases in the volume of content deposited. This may indeed be true in some examples–and further research is encouraged in this respect; however, in this particular study, a weak exponential relationship was observed via exponential regression () with poor curve fitting notable (Figure 5), indicating the limited influence content deposit growth has on overall usage. Fitting with other common models such as linear, power or logarithmic was similarly weak.
It is apposite to highlight data from the previous section that Google search referrals and GS traffic increased well in excess of the full-text deposit rate, at 266% and 104% respectively; ergo the percentage of users being referred increased at a higher rate than the rate of full-text deposit during the reporting period. This is relevant because, based on these observations, it suggests that the rapid growth in search referrals from Google and GS has been a key factor influencing the increase in COUNTER usage.
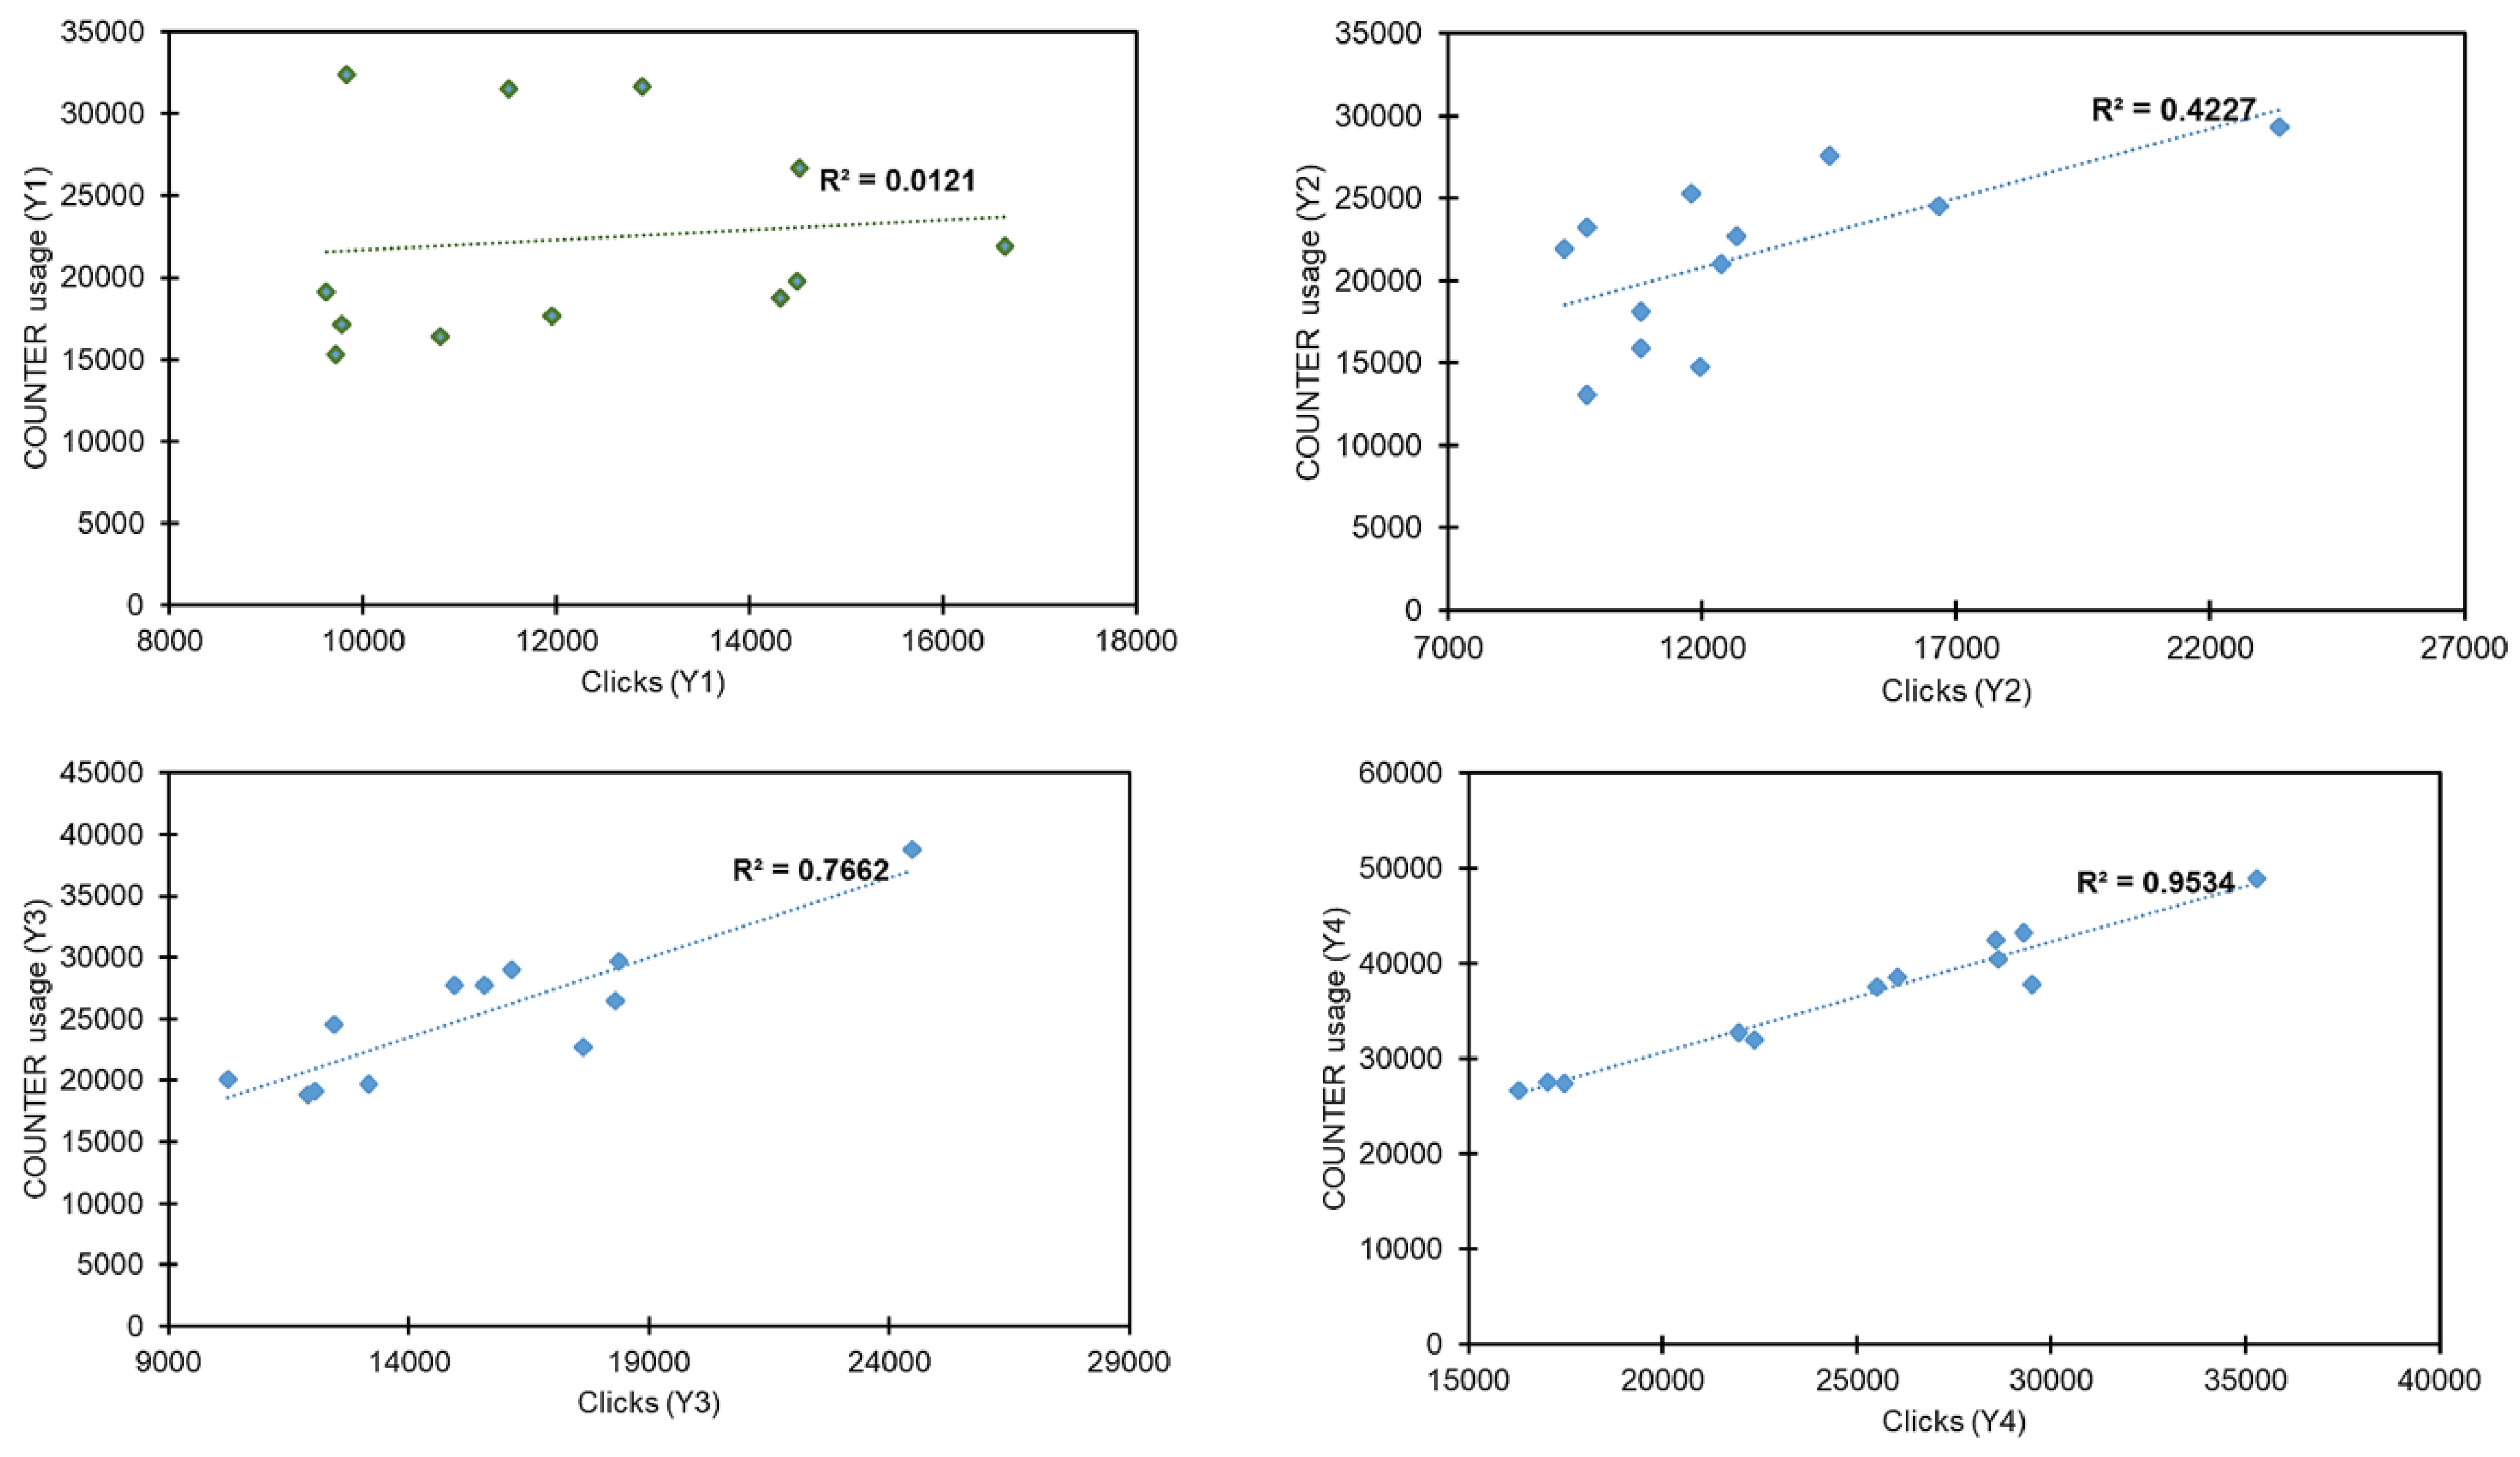
To determine whether a correlation between Google clicks and COUNTER usage was present, Pearson’s correlation coefficient was calculated for each year in the reporting period. A correlation was detected, ranging from a weak relationship in Y1 () to a moderate positive correlation in Y2 (). Y1 and Y2 were followed by a strengthening of the relationship in Y3 () and Y4 (). This strengthening of the positive correlation was confirmed via the statistic for both Y3 () and Y4, at a far higher level of statistical significance ().
Computing the coefficient of determination () allows for better appreciation of the proportion of variance observed in the dependent variable (i.e., COUNTER usage) which is then predictable from the independent variable (i.e., Google clicks resulting from the changes implemented). In computing the coefficient of determination it was found that was significantly stronger in Y2 () than Y1 (), but at such a low level that only 42% of variance in usage could be attributed to clicks. Variance narrowed considerably for Y3 () with a strong linear relationship between variables noted. This variance then narrowed again in Y4 (), whereupon 95% of usage could be attributed to Google clicks. The incremental narrowing in variation between Y1 and Y4 can easily be observed from Figure 5, in which data points in Y3, and particularly Y4, are grouped more closely to the regression line.
An area that evades sufficient understanding in the data analysed thus far is the extent to which specific repository optimizations can also influence discovery on web search platforms that are not either Google or GS. This is largely because these discovery platforms lack any commensurate analytics. Acknowledging that the majority of repository traffic appears to originate from Google and GS, it is nevertheless possible to summarise the most common web traffic referral sources over the reporting period, as measured by GA and using the existing dataset, to establish whether changes could be observed in other platforms. Such data may lack the specificity typical of analyses earlier in this section but nevertheless enable a degree of inference about whether the optimizations have had an influence beyond Google and GS.
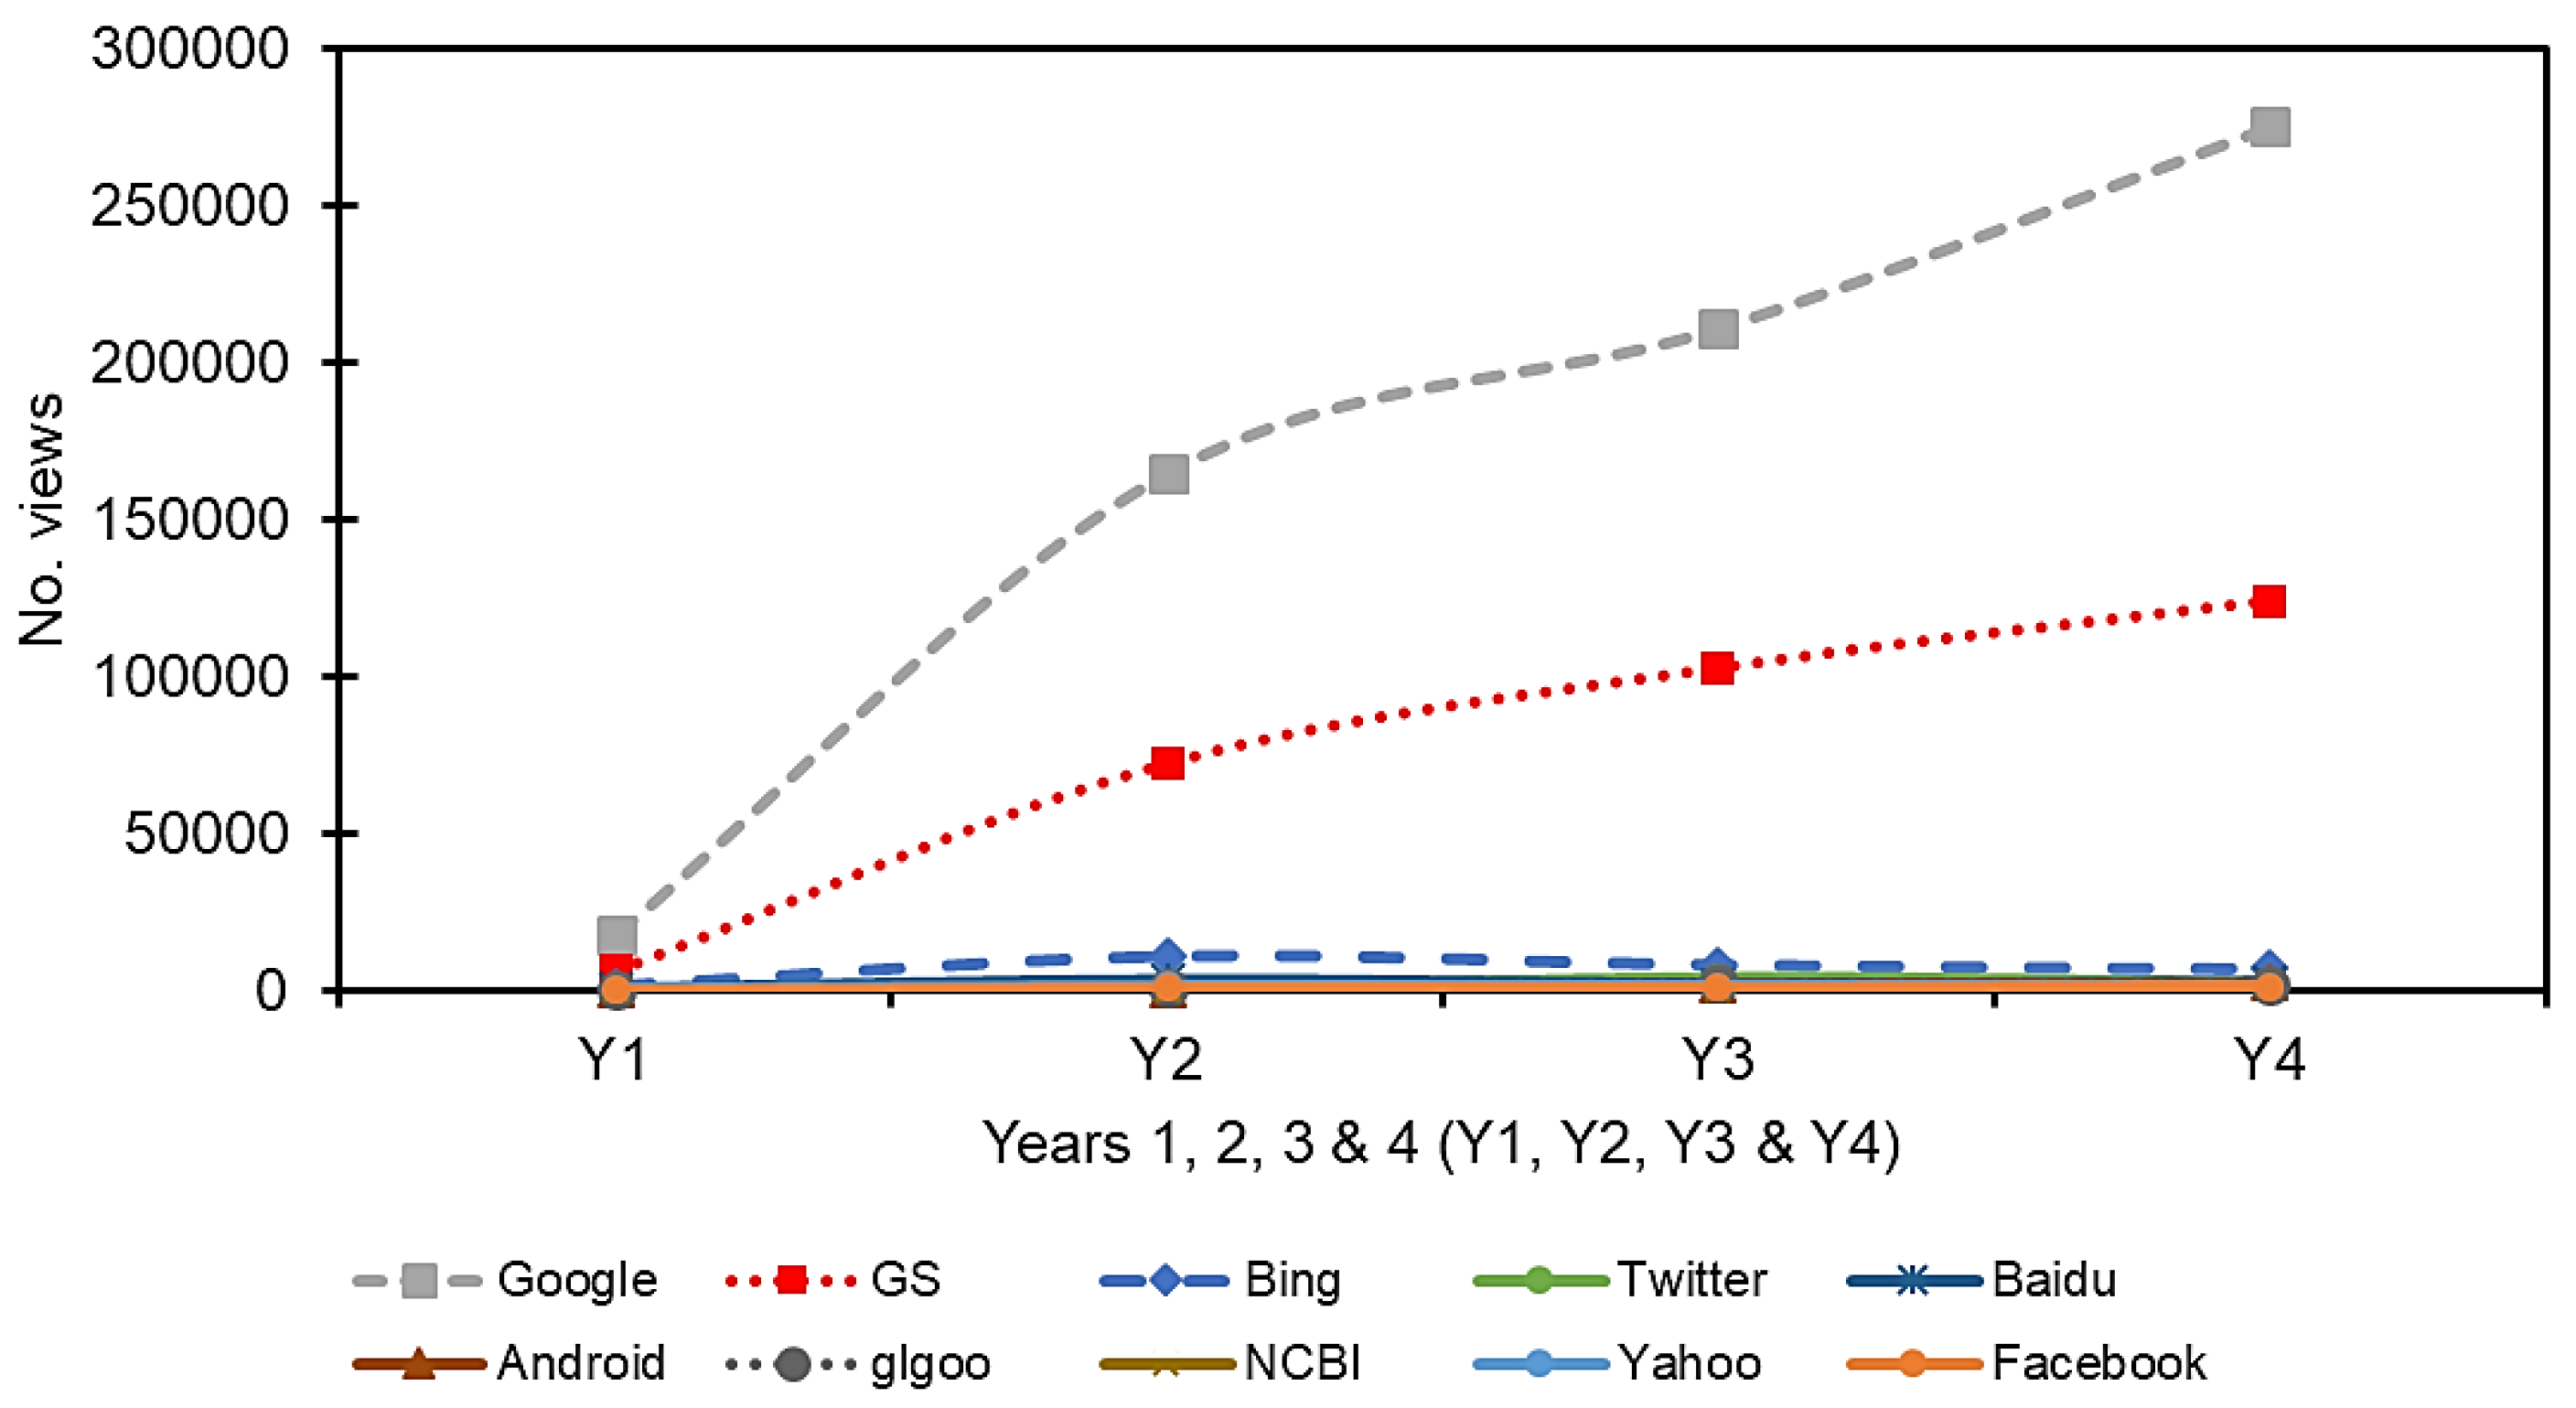
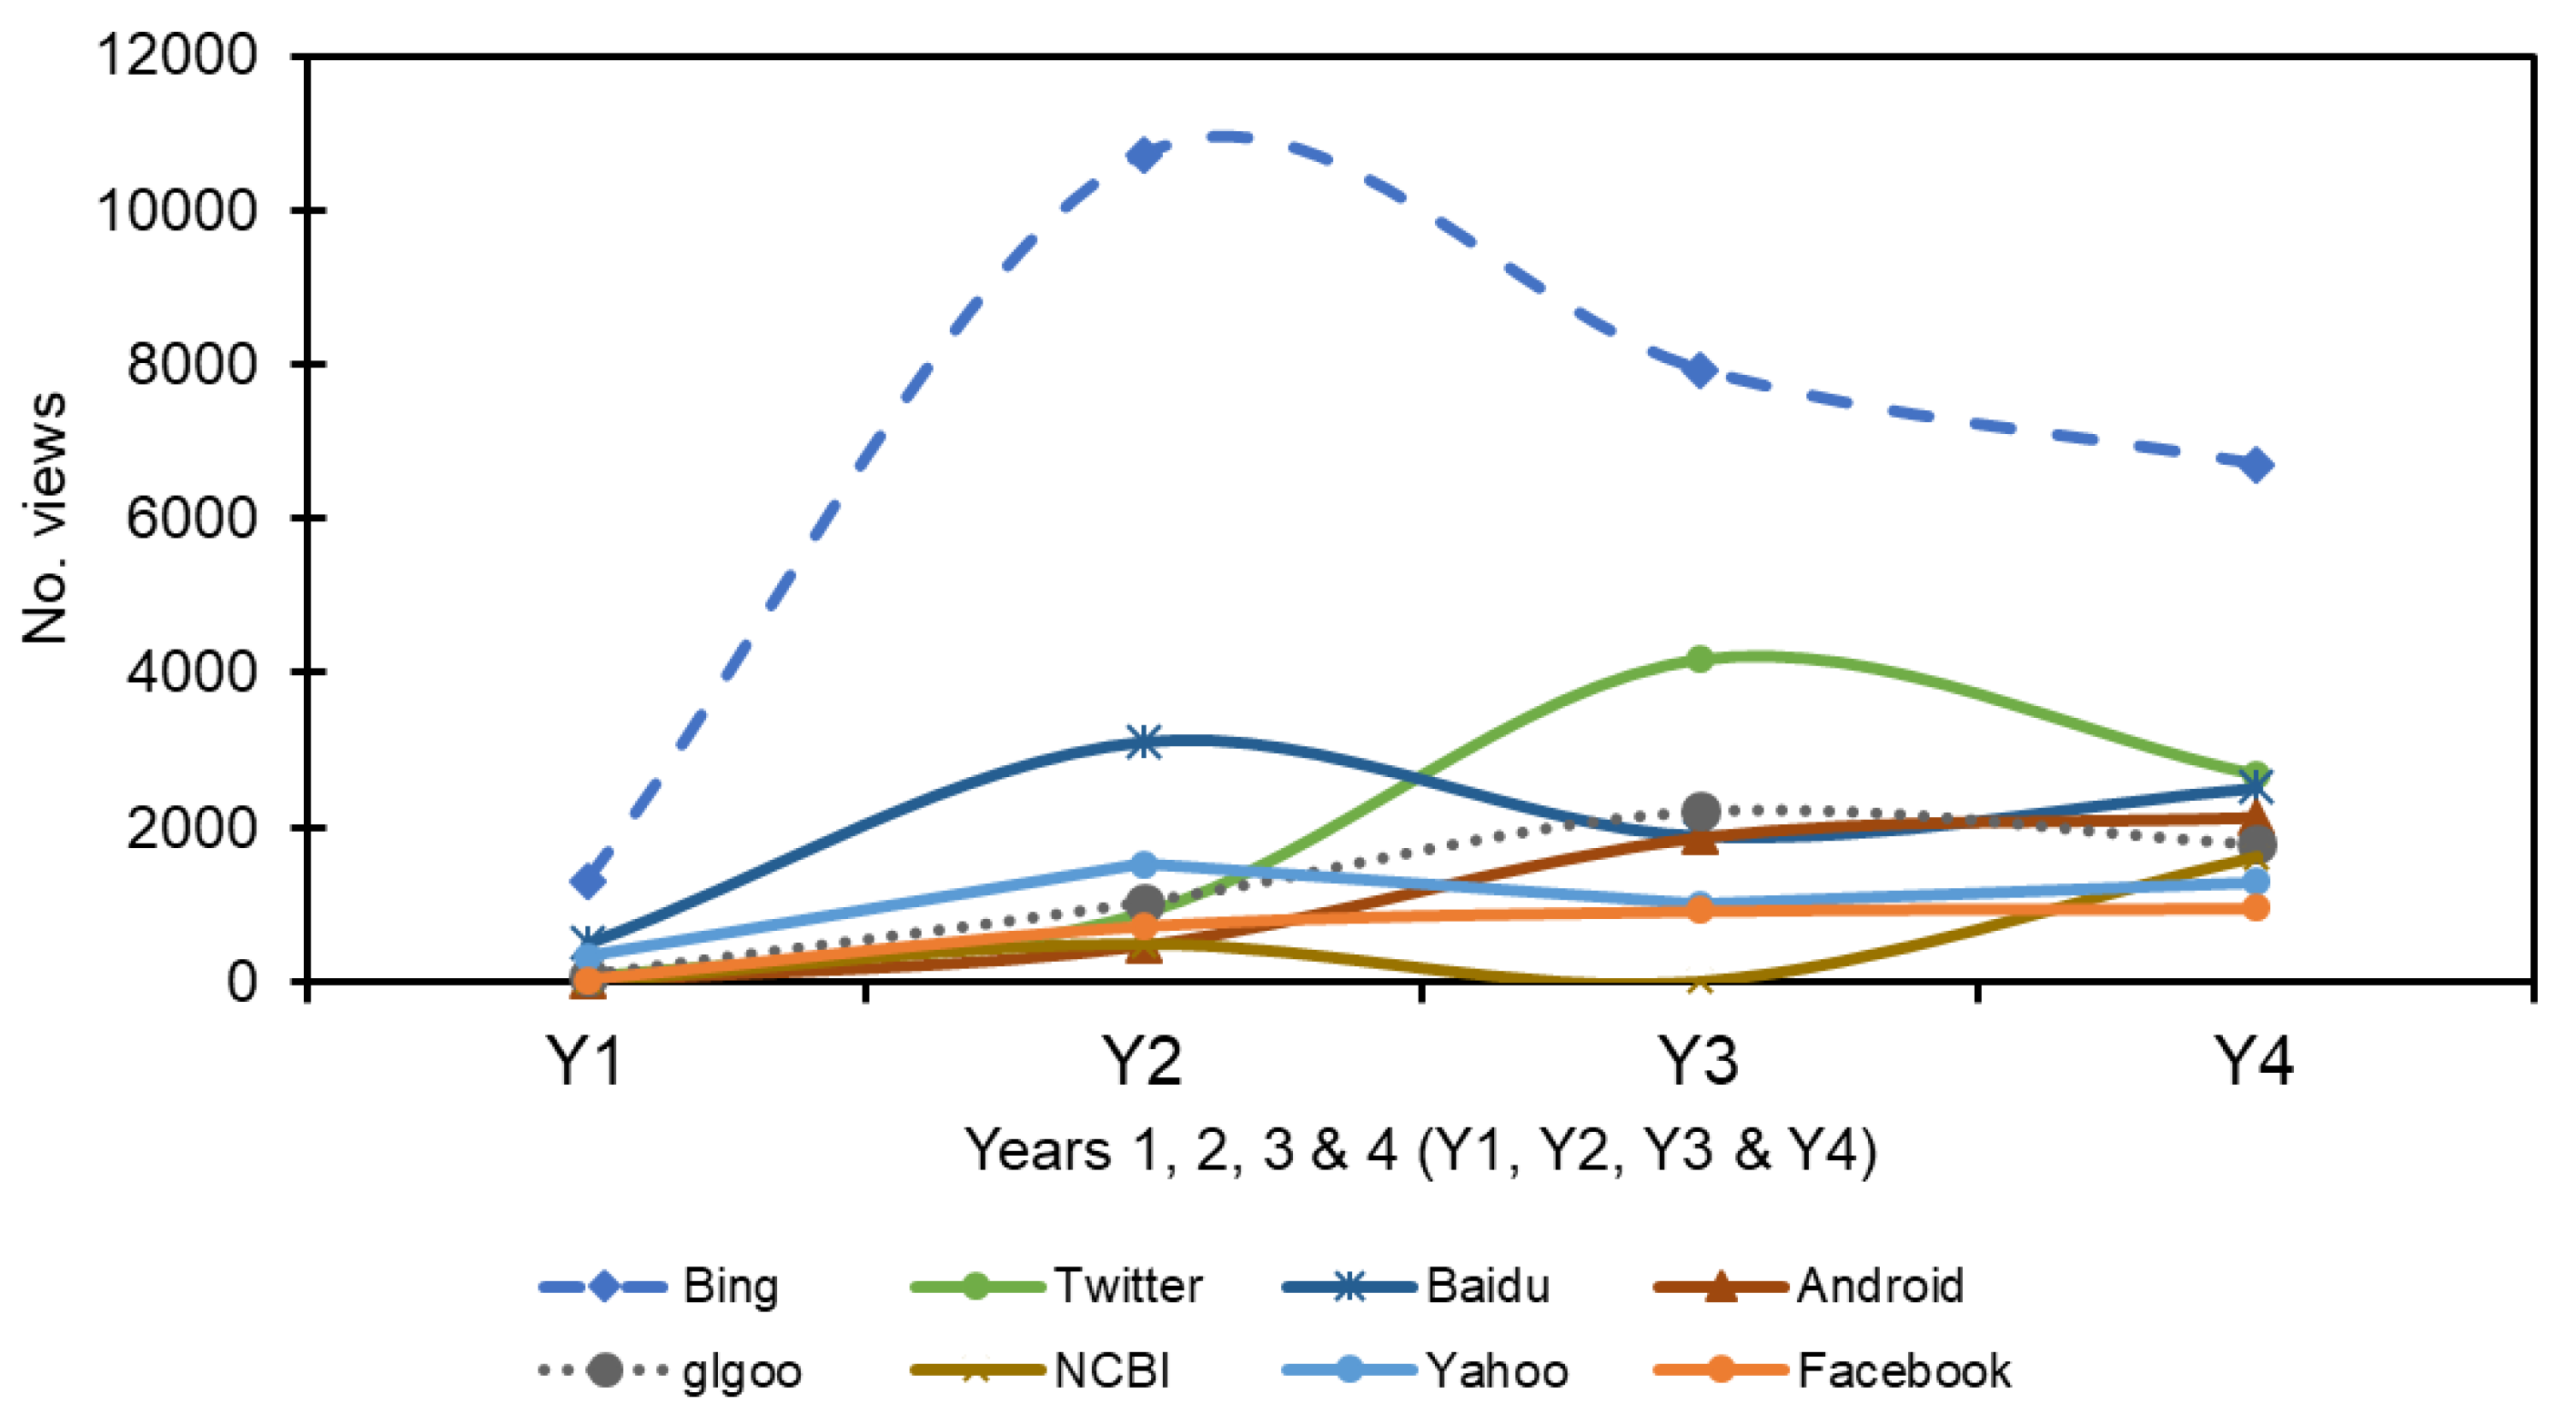
Figure 6 and Figure 7 chart the top ten web traffic referral sources during the reporting period, with local sources excluded (e.g., local university website searches, native searches on Strathprints, etc.). From Figure 6 it is possible to observe significant traffic growth from Google and GS. This is to be expected based on analyses earlier in this section, but little change can be observed in the other sources, such as Bing or Baidu, which display limited or zero growth. To better appreciate any modest change in traffic from these other sources, Figure 8 charts the same data but with data on Google and GS excluded. From this it is clear that variation in traffic can be observed across reporting years but no single profile suggests any sustained or significant growth. This would tend to infer that the technical improvements and adjustments implemented in this study demonstrate a Google-specific effect only. Traffic from other sources remained at such low volumes as to have a negligible impact on the overall volume of traffic received by Strathprints.
5. Discussion
This article provides further analysis of the influence repository optimization approaches can have on the relative visibility, discovery and usage of an open repository. The nature of the longitudinal dataset used to track web traffic, usage and search metrics can be said to add additional weight to our findings and analysis. It corroborates previous evaluative studies [8] and reinforces prior evidence that specific technical enhancements to a repository can yield significant gains in web impact and usage.
Its dominance in search is such that Google is frequently found to be at the centre of many users’ information seeking strategies [31]. The results from this study do not appear to challenge this continuing assertion, nor previously reported results [8], with 56% of all repository traffic referred by Google. Total web traffic was found to have increased by 65% during the period examined, with unique traffic growing 69%. Within this total, unique traffic from Google increased in excess of 70% during the reporting period, even where outlying data in Y1 were removed. Again, with Y1 excluded, 67% increases in total and unique traffic were noted for Google Scholar (GS). All of this was noted despite far lower rates of full-text deposit during the reporting period. The notion that usage was growing in line or exponentially as a result of deposit growth was also excluded in this instance. Temporal variations in time of data collection were nevertheless noted as influencing some of the results which suggests that future work, or replicative studies, should attempt analyses over different annual reporting lifecycles.
Y1 data were excluded from some of the web traffic analyses in Section 4.1 owing to their assumed anomalous appearance within subsequent data and underlying trending. It is worth revisiting this assumption here as the low baseline traffic detailed in Table 2 may have been outlying but not anomalous. Given the issues some repositories experience in achieving deep indexing by GS (e.g., [9,20]), and the low indexing recorded by some repositories in the recent Ranking Web of Repositories of July 2019 [32], it appears quite conceivable that the low traffic baseline for Strathprints was an accurate reflection of the GS indexing penetration of Strathprints prior to the technical changes in 2016. If this were the case then percentage increases of 1920% and 1854% in total and unique traffic respectively on GS were achieved during the reporting period, attributable to the technical improvements deployed, and reflect the rapid deep indexing of Strathprints by GS. It is relevant to highlight this since it also suggests that significant growth in traffic from GS is possible if steps are taken to optimize accordingly. Such high levels of indexing appear to be corroborated by recently published data in which Strathprints was placed in the top 5% of UK repositories and the top 10% of world repositories for number of records indexed by GS [32].
But while traffic originating from GS grew considerably–and GS indexing penetration also appears to be high–it is evident that the proportion of traffic originating from GS may actually be lower than those reported elsewhere. For example, [33], who previously examined the web traffic received by four repositories, found 48%–66% of traffic to be referred by GS, which is far greater than the 26% reported in this current study. Possible explanations for this GS traffic disparity could be positive rather than negative. For instance, it is conceivable that the technical strategies deployed on Strathprints were unusually successful in promoting traffic from competing search and discovery tools such that the proportion of GS traffic appears smaller than it otherwise might. In other words, it is less that traffic from GS is less than it should be and more that the changes implemented have yielded a far greater improvement in search tools relative to GS. This would correspond with prior observations [25]. Web traffic from Google certainly increased at a faster rate than GS; however, it should be noted that it also started from a higher baseline in Y1.
Another possible cause could be latency in detecting traffic resulting from the improved indexing of Strathprints by GS. This explanation posits that GS traffic will increase in forthcoming months and years as improvements in indexing depth and coverage translate into greater numbers of GS users being referred to Strathprints content over time. This hypothesis is something that can be easily verified by the present author and is a metric which will be monitored in future work, including any replicative studies.
A 62% increase in COUNTER compliant usage was reported despite far lower rates of full-text deposit, and even a decline in deposits during Y3. The rapid growth in search referrals from Google and GS was noted as a key driver in the overall increase in COUNTER usage during the reporting period as was their share of the total traffic Strathprints receives. This too was reflected in Google specific search metrics in which increases of 266% and 104% were observed in Google impressions and clicks respectively. The influence of Google clicks on COUNTER usage was verified via Pearson’s correlation coefficient. This noted a strengthening of the relationship in every year, with high levels of statistical significance noted in years 3 and 4 (e.g., ) and demonstrating a strong linear relationship by Y4.
Accepting that correlation does not always equate to causation, the finding from this analysis that circa 95% of usage could be attributed to Google clicks warrants further scrutiny since it appears to demonstrate a potential disconnect with web traffic figures. Certainly a strong correlation exists—and this alone should provide a strong steer in how repositories are developed technically over coming years. The reported growth of Google and GS traffic clearly exceeded other traffic sources, and the increase in impressions and clicks was also significant. 56% of all web traffic may have arrived via Google but the predictive potential of this analysis seems slightly incongruous (), suggesting that further data gathering or replication, preferably using different repositories, could be beneficial in verifying this finding. Indeed, a post hoc fallacy remains a risk since interference from possible extraneous variables remains difficult to discount given the research context. For example, overall global growth in web traffic during the reporting period was not explicitly controlled. The Cisco VNI global IP traffic forecast [34] predicts a compound annual growth rate of 26% between 2017 and 2022, which the traffic figures in this study appear to exceed; but without adequate experimental controls for such variables it is impossible to be definitive.
It is also necessary to state that the cumulative effect of a mounting corpus of full-text content (with full-text deposits accumulating year upon year) is not necessarily observable in a single year of observation. It is highly probable that content deposited in Y2 benefited usage metrics in subsequent years since factors critical in discovery and usage (e.g., search engine indexing, content aggregation, etc.) can take many months. Total percentage growth across all years (i.e., 62%) is therefore a more reliable indicator of the underlying pattern. Nevertheless, we should also note the limited influence content deposit growth appeared to have on overall usage, as corroborated by the weak exponential relationship between content that was noted between deposited and usage.
Recall that Acharya [20] and Tonkin et al. [21] reported the potentially negative consequences of coversheets on repository deposits. In this case study, automatically generated coversheets were enabled on Strathprints throughout the period of data collection. Given the enhancements to visibility and discovery which have been observed in this evaluation, it appears unsafe to conclude that the application of coversheets will always apply a negative drag on repository indexing. As this study has demonstrated, there are many variables which can potentially influence content discovery, coversheets are but one. Coversheets on Strathprints have since been disabled for local monitoring purposes but it seems necessary for future experimental work to verify the nature of their relationship to content discovery. Such work should seek to evaluate beyond Google Scholar since understanding surrounding coversheet usage currently appears to be influenced by a single academic discovery tool.
Limitations
Although it has been noted that Google accounted for the largest proportion of search traffic, the use of Google Search Console as a source of search metric data presents a data compromise by excluding metrics from other discovery tools. This decision was necessary owing to the lack of data available from other discovery tools and could therefore be described as a necessary limitation. The finding that there was little change in traffic volume from services other than Google and GS tends to infer that the repository optimizations deployed deliver a Google-specific benefit to repositories and may not provide the desired universal web impact or discovery improvements across other services. A satisfactory explanation for this particular observation deserves further research since only one optimization (i.e., Google Data Highlighter) could be described as platform specific. All others were platform agnostic and reflected known ’white hat’ best practice from the literature and platform inclusion guidelines.
There are of course limitations in the way this evaluation was approached and in the data collected. As we have noted already, experiments seeking to effect change on third party systems are immediately problematic since it becomes impossible to control for all variables hypothesised to influence web visibility. It is therefore not claimed that every known variable has been controlled in the work for this article; however, through exhaustive prior work [8], efforts have been taken to control as much as possible for all known variables. It is perhaps worth noting too that the brief nature of article precludes any additional data analysis; additional analyses were conducted but are not presented here owing to space limitations. Interested readers are nevertheless encouraged to download the raw data for analysis and potential new insights.
6. Conclusions
Section 5 highlighted several interesting discussion points but also raised several areas worthy of attention in future or replicative studies. These include the monitoring of traffic latency as a factor on improved GS indexing and better measuring the influence, if any, of coversheets on repository indexing more generally. However, any replication of this study should seek to improve the study design in certain key respects, especially improving the control of extraneous variables to avoid the possibility of correlation fallacy. A more productive design could include a collaborative study involving several repositories, whereby extant usage and web analytics are benchmarked across a number of disparate search agents and specific repositories used as a control. This would go some way to eliminating the potential influence of extraneous variables by confirming or refuting the observations noted in this article. Aspects of such an analysis could be performed using open data currently made available by IRUS-UK about active UK repositories, although collection of the necessary analytics on web traffic and search metrics requires invasive repository modifications.
The increasing importance of open repositories in fulfilling the discovery needs of both human and machine users is beyond doubt and it therefore remains essential to validate the continued relevance of repositories to users and their role as nodes within global scholarly communications infrastructure. Despite the limitations and some of the questions surrounding the findings, this article provides some persuasive evidence that open repositories should be managed in such a way as to enable routine technical enhancements to be deployed frequently and in response to intelligence and analytics pertaining to search, usage and web impact data. As noted in Section 1, repositories cannot remain static nodes in open scholarly communications infrastructure but instead active and responsive, driving content discovery, and usage and thereby better satisfying users’ needs, while simultaneously addressing the challenges presented by proprietary systems. Analysis of the unique dataset presented in this article suggests that specific enhancements to the technical configuration of a repository can generate substantial improvements in its content discovery potential and ergo its content usage, especially when relevant metrics are monitored over several years. In this case study large increases were reported in COUNTER-compliant usage, key measures of web analytics and impact. Web traffic to Strathprints from Google and Google Scholar was also found to increase significantly with growth. Despite the noted limitations, the article demonstrates the link between repository optimization and the need for open repositories to assume a proactive development path, especially one that prioritises web impact and discovery.
Funding
This research received no external funding.
Acknowledgments
Thanks are extended to Martin Brändle (University of Zürich) for his helpful comments and suggestions in earlier drafts of this paper.
Conflicts of Interest
The author declares no conflict of interest.
References
- Pinfield, S.; Salter, J.; Bath, P.A.; Hubbard, B.; Millington, P.; Anders, J.H.S.; Hussain, A. Open-access repositories worldwide, 2005–2012: Past growth, current characteristics, and future possibilities. J. Assoc. Inf. Sci. Technol. 2014, 65, 2404–2421. [Google Scholar] [CrossRef]
- Lynch, C.A. Institutional Repositories: Essential Infrastructure For Scholarship In The Digital Age. Portal: Libr. Acad. 2003, 3, 327–336. [Google Scholar] [CrossRef]
- McKiernan, E.C.; Bourne, P.E.; Brown, C.T.; Buck, S.; Kenall, A.; Lin, J.; McDougall, D.; Nosek, B.A.; Ram, K.; Soderberg, C.K.; et al. How open science helps researchers succeed. eLife 2016, 5, e16800. [Google Scholar] [CrossRef] [PubMed]
- De Castro, P. 7 Things You Should Know about Institutional Repositories, CRIS Systems, and Their Interoperability. 2017. Available online: https://perma.cc/69A4-TSL8 (accessed on 21 May 2019).
- Moore, S.; Gray, J.; Lämmerhirt, D.; Swan, A. PASTEUR4OA Briefing Paper: Infrastructures for Open Scholarly Communication; Technical Report; National Documentation Centre: Athens, Greece, 2016; Available online: http://pasteur4oa.eu/resources/229 (accessed on 20 December 2019).
- Macgregor, G. Repository and CRIS interoperability issues within a ’connector lite’ environment. In Proceedings of the 14th International Conference on Open Repositories (OR2019), Universität Hamburg, Hamburg, Germany, 10–13 June 2019; Available online: https://strathprints.strath.ac.uk/68240/ (accessed on 27 December 2019).
- COAR. Next Generation Repositories: Behaviours and Technical Recommendations of the COAR Next Generation Repositories Working Group; Technical Report; COAR: Göttingen, Germany, 2017; Available online: https://www.coar-repositories.org/files/NGR-Final-Formatted-Report-cc.pdf (accessed on 21 May 2019).
- Macgregor, G. Improving the discoverability and web impact of open repositories: Techniques and evaluation. Code4lib J. 2019. Available online: https://journal.code4lib.org/articles/14180 (accessed on 13 May 2019).
- Arlitsch, K.; OBrien, P. Invisible institutional repositories: Addressing the low indexing ratios of IRs in Google Scholar. Libr. Tech. 2012, 30, 60–81. [Google Scholar] [CrossRef] [Green Version]
- Ferreras-Fernández, T.; Merlo-Vega, J.A.; García-Peñalvo, F.J. Impact of Scientific Content in Open Access Institutional Repositories: A Case Study of the Repository Gredos. In Proceedings of the First International Conference on Technological Ecosystem for Enhancing Multiculturality, TEEM ’13, Salamanca, Spain, 14–15 November 2013; ACM: New York, NY, USA, 2013; pp. 357–363. [Google Scholar] [CrossRef]
- Kelly, B.; Nixon, W. SEO Analysis of Institutional Repositories: What’s the Back Story? Open Repositories 2013. Available online: http://opus.bath.ac.uk/35871/ (accessed on 19 July 2019).
- Pekala, S. Microdata in the IR: A Low-Barrier Approach to Enhancing Discovery of Institutional Repository Materials in Google. Code4lib J. 2018. Available online: https://journal.code4lib.org/articles/13191 (accessed on 13 August 2018).
- Aguillo, I. Altmetrics of the Open Access Institutional Repositories: A Webometrics Approach. In Proceedings of the 23rd International Conference on Science and Technology Indicators (STI 2018), Leiden, The Netherlands, 12–14 September 2018; pp. 159–169. [Google Scholar]
- Aguillo, I.F. TRANSPARENT RANKING: Institutional Repositories by Google Scholar. 2019. Available online: http://repositories.webometrics.info/en/institutional (accessed on 26 December 2019).
- Müller, U.; Scholze, F.; Arning, U.; Bange, D.; Beucke, D.; Hartmann, T.; Korb, N.; Meinecke, I.; Pampel, H.; Schirrwagen, J.; et al. DINI Certificate for Open Access Repositories and Publication Services 2016; Humboldt-Universität zu Berlin: Berlin, Germany, 2017. [Google Scholar] [CrossRef]
- Arlitsch, K. Driving Traffic to Institutional Repositories: How Search Engine Optimization can Increase the Number of Downloads from IR. Zenodo 2017. [Google Scholar] [CrossRef]
- Askey, D.; Arlitsch, K. Heeding the Signals: Applying Web best Practices when Google recommends. J. Libr. Adm. 2015, 55, 49–59. [Google Scholar] [CrossRef] [Green Version]
- Arlitsch, K.; OBrien, P. Introducing the “Getting Found” Web Analytics Cookbook for Monitoring Search Engine Optimization of Digital Repositories. Qual. Quant. Methods Libr. (QQML) 2015, 4, 947–953. Available online: https://scholarworks.montana.edu/xmlui/handle/1/9668 (accessed on 22 May 2019).
- OBrien, P.; Arlitsch, K.; Mixter, J.; Wheeler, J.; Sterman, L.B. RAMP—The Repository Analytics and Metrics Portal. Libr. Tech. 2017, 35, 144–158. [Google Scholar] [CrossRef]
- Acharya, A. Indexing Repositories: Pitfalls and Best Practices; Indiana University: Bloomington, IN, USA, 2015; Available online: https://media.dlib.indiana.edu/media_objects/9z903008w (accessed on 5 September 2018).
- Tonkin, E.L.; Taylor, S.; Tourte, G.J.L. Cover sheets considered harmful. Inf. Serv. Use 2013, 33, 129–137. [Google Scholar] [CrossRef] [Green Version]
- Bull, S.; Beh, E. Release 5 of the COUNTER Code of Practice. Ser. Libr. 2018, 74, 179–186. [Google Scholar] [CrossRef]
- Wood-Doughty, A.; Bergstrom, T.; Steigerwald, D.G. Do Download Reports Reliably Measure Journal Usage? Trusting the Fox to Count Your Hens? Coll. Res. Libr. (C andRl) 2019, 80. [Google Scholar] [CrossRef]
- MacIntyre, R.; Needham, P.; Lambert, J.; Alcock, J. Measuring the Usage of Repositories via a National Standards-based Aggregation Service: IRUS-UK. In New Avenues for Electronic Publishing in the Age of Infinite Collections and Citizen Science: Scale, Openness and Trust: Proceedings of the 19th International Conference on Electronic Publishing; IOS Press: Amsterdam, The Netherlands, 2015; pp. 83–92. [Google Scholar] [CrossRef]
- Macgregor, G. Reviewing Repository Discoverability: Approaches to Improving Repository Visibility and Web Impact. 2017. Available online: https://strathprints.strath.ac.uk/61333/ (accessed on 3 August 2018).
- Wang, Z.; Phan, D. Using Page Speed in Mobile Search Ranking. 2018. Available online: https://perma.cc/8QKP-NE5S (accessed on 3 August 2018).
- Zhang, F. Rolling Out Mobile-First Indexing. 2018. Available online: https://docs.lib.purdue.edu/libf (accessed on 22 January 2020).
- Jayasankar, S. Our Approach to Mobile-Friendly Search. 2015. Available online: https://perma.cc/5EQQFCGC (accessed on 22 January 2020).
- Google. Google Search Console. 2019. Available online: https://www.google.com/webmasters/tools/home (accessed on 13 May 2019).
- Macgregor, G. Supporting dataset for: Repository optimisation and techniques to improve discoverability and web impact: An evaluation. Dataset 2018. [Google Scholar] [CrossRef]
- Rowlands, I.; Nicholas, D.; Williams, P.; Huntington, P.; Fieldhouse, M.; Gunter, B.; Withey, R.; Jamali, H.R.; Dobrowolski, T.; Tenopir, C. The Google generation: the information behaviour of the researcher of the future. Aslib Proc. 2008, 60, 290–310. [Google Scholar] [CrossRef] [Green Version]
- CSIC. Transparent Ranking: Institutional Repositories by Google Scholar (May 2019)|Ranking Web of Repositories. 2019. Available online: https://repositories.webometrics.info/en/institutional (accessed on 10 August 2018).
- OBrien, P.; Arlitsch, K.; Sterman, L.B.; Mixter, J.; Wheeler, J.; Borda, S. Undercounting File Downloads from Institutional Repositories. J. Libr. Adm. 2016, 56, 1–24. Available online: https://scholarworks.montana.edu/xmlui/handle/1/9943 (accessed on 13 August 2018). [CrossRef] [Green Version]
- Cisco Systems, I. Cisco Visual Networking Index: Forecast and Trends, 2017–2022; White Paper; Cisco Systems, Inc.: San Jose, CA, USA, 2019; Available online: https://perma.cc/9D9X-Y7MZ (accessed on 26 December 2019).
| 1. | Strathprints: https//:strathprints.strath.ac.uk/ |
| 2. | Google Search Console: https://www.google.com/webmasters/tools/home |
| 3. | IRUS-UK: https://irus.jisc.ac.uk/ |
| 4. | Google Analytics: https://analytics.google.com/ |
| 5. | Interquartile range has been omitted owing to the small number of cases. |
Figure 1.
COUNTER-compliant usage data for 88 IRUS-UK member repositories 08/2016–07/2019.

Figure 2.
Volume of Google and Google Scholar referral traffic , including unique traffic in Y1, Y2, Y3 and Y4.
Figure 2.
Volume of Google and Google Scholar referral traffic , including unique traffic in Y1, Y2, Y3 and Y4.

Figure 3.
Strathprints COUNTER usage during Y1–Y4 alongside Google clicks and impressions during the same period.
Figure 3.
Strathprints COUNTER usage during Y1–Y4 alongside Google clicks and impressions during the same period.

Figure 4.
Charted data on observed clicks, impressions and COUNTER usage during Y1, Y2, Y3 and Y4.

Figure 5.
Exponential regression (r squared) for deposit growth and COUNTER usage (Y1–Y4).

Figure 6.
Coefficient of determination (r squared) for Y1, Y2, Y3 and Y4 between clicks and COUNTER usage.
Figure 6.
Coefficient of determination (r squared) for Y1, Y2, Y3 and Y4 between clicks and COUNTER usage.

Figure 7.
Top ten web traffic referral sources during Y1, Y2, Y3 and Y4. Local sources excluded.

Figure 8.
Top ten web traffic referral sources during Y1, Y2, Y3 and Y4, excluding Google, Google Scholar and local sources excluded.
Figure 8.
Top ten web traffic referral sources during Y1, Y2, Y3 and Y4, excluding Google, Google Scholar and local sources excluded.


Table 1.
Summary of technical ‘adjustments’ and ‘improvements’ implemented on Strathprints. Full details in [8].
Table 1.
Summary of technical ‘adjustments’ and ‘improvements’ implemented on Strathprints. Full details in [8].
| Key Technical ‘Adjustments’ |
| Modification of file-naming conventions |
| ‘Minification’ of all relevant repository source files |
| Rationalisation of all CSS and JavaScript (JS) files in order to remove unused rules and variables |
| Asynchronous loading of JS resources |
| Deployment of GZIP compression |
| Image optimization, e.g., compression, use of .webp, etc. |
| Migration to InnoDB as the MySQL storage engine |
| Deployment of Google Data Highlighter |
| Key Technical ‘Improvements’ |
| Repository user interface (UI) improvements |
| ‘Mobile first’, responsive re-engineering of repository to align with new weighting in PageRank, etc. |
| ‘White hat’ improvements, e.g., navigation, hyperlink labels, content improvements promoting user interaction |
| ‘Connector-lite’ ecosystem implemented within repository-CRIS interactions |
Table 2.
Data table of total and unique web traffic to Strathprints during Y1–Y4, alongside total and unique traffic referred via Google and Google Scholar (GS).
Table 2.
Data table of total and unique web traffic to Strathprints during Y1–Y4, alongside total and unique traffic referred via Google and Google Scholar (GS).
| Total | Unique | Unique Google | GS | Unique GS | ||
|---|---|---|---|---|---|---|
| Y1 | 296,200 | 226,791 | 17,436 | 13,274 | 6208 | 4827 |
| Y2 | 365,024 | 276,042 | 164,550 | 130,565 | 72,179 | 55,294 |
| Y3 | 450,520 | 346,851 | 230,953 | 182,227 | 104,051 | 80,786 |
| Y4 | 489,140 | 383,117 | 274,983 | 217,826 | 125,405 | 94,305 |
| Total Y1–Y4 | 1,600,884 | 1,232,801 | 687,922 | 543,892 | 307,843 | 235,212 |
| % growth (Y2) | 23.24 | 21.72 | 843.74 | 883.61 | 1062.68 | 1045.51 |
| % growth (Y3) | 23.42 | 25.65 | 40.35 | 39.57 | 44.16 | 46.1 |
| % growth (Y4) | 8.57 | 10.46 | 19.06 | 19.54 | 20.52 | 16.73 |
| % growth (Exc. Y1) | 34 | 38.79 | 73.74 | 70.55 | 67.11 | 66.83 |
| Total % growth (Y1–Y4) | 65.14 | 68.93 | 1477.1 | 1541 | 1920.05 | 1853.7 |
Table 3.
Measures of central tendency for total and unique web traffic to Strathprints during Y1–Y4 (‘Current data—A’), alongside total and unique traffic referred via Google and Google Scholar (GS). Data also include measures for ‘Prior data—B’ using data reported in [8] for comparison. Bottom row, ‘Current data—A*’, are ‘Current data—A’ data excluding outlying Y1 data.
| Current Data—A | Total | Unique | GS | Unique GS | Unique Google | |
|---|---|---|---|---|---|---|
| Mean () | 400,221 | 308,200.3 | 76,960.75 | 58,803 | 171,980.5 | 135,973 |
| Standard deviation () | 86,594.41 | 70,161.76 | 51,992.13 | 39,451.94 | 112,585.5 | 89,300.31 |
| Prior Data—B | Total | Unique | GS | Unique GS | Unique Google | |
| Mean () | 386,908 | 296,311 | 83,569.33 | 63,691.33 | 196,783.67 | 154,834.67 |
| Standard deviation () | 95,203.59 | 73,250.7 | 27,735.22 | 22,046.71 | 50,429.38 | 38,672.46 |
| Current Data—A* | Total | Unique | GS | Unique GS | Unique Google | |
| Mean () | 434,894.67 | 335,336.67 | 100,545 | 76,795 | 223,495.33 | 176,872.67 |
| Standard deviation () | 63,516.21 | 54,458.23 | 26,785.65 | 19,809.36 | 55,592.94 | 43,876.21 |
Table 4.
Data table of Strathprints COUNTER usage during and Google clicks and impressions during Y1–Y4. Volume of full-text OA deposits and volume of combined full-text and embargoed deposits.
Table 4.
Data table of Strathprints COUNTER usage during and Google clicks and impressions during Y1–Y4. Volume of full-text OA deposits and volume of combined full-text and embargoed deposits.
| Impressions | Clicks | Usage | Deposits (OA) | Deposits (OA and Emb.) | |
|---|---|---|---|---|---|
| Sub-total (Y1) | 3,903,830 | 146,064 | 268,453 | 2326 | 2346 |
| Sub-total (Y2) | 4,537,744 | 153,539 | 257,560 | 2978 | 3074 |
| Sub-total (Y3) | 7,687,550 | 185,232 | 304,327 | 2314 | 3010 |
| Sub-total (Y4) | 14,290,059 | 298,020 | 435,467 | 2861 | 3620 |
| Total (Y1–Y4) | 30,419,183 | 782,855 | 1,265,807 | 10,479 | 12,050 |
| % growth (Y2) | 16.24 | 5.12 | −4.06 | 28.03 | 31.03 |
| % growth (Y3) | 69.41 | 20.64 | 18.16 | −22.3 | −2.08 |
| % growth (Y4) | 85.89 | 60.89 | 43.09 | 23.64 | 20.27 |
| Total % (Y1–Y4) | 266.05 | 104.03 | 62.21 | 23 | 54.31 |
© 2020 by the author. Licensee MDPI, Basel, Switzerland. This article is an open access article distributed under the terms and conditions of the Creative Commons Attribution (CC BY) license (http://creativecommons.org/licenses/by/4.0/).
Share and Cite
MDPI and ACS Style
Macgregor, G. Enhancing Content Discovery of Open Repositories: An Analytics-Based Evaluation of Repository Optimizations. Publications 2020, 8, 8. https://doi.org/10.3390/publications8010008
AMA Style
Macgregor G. Enhancing Content Discovery of Open Repositories: An Analytics-Based Evaluation of Repository Optimizations. Publications. 2020; 8(1):8. https://doi.org/10.3390/publications8010008
Chicago/Turabian StyleMacgregor, George. 2020. "Enhancing Content Discovery of Open Repositories: An Analytics-Based Evaluation of Repository Optimizations" Publications 8, no. 1: 8. https://doi.org/10.3390/publications8010008
Note that from the first issue of 2016, this journal uses article numbers instead of page numbers. See further details here.