Use of Data Analysis Methods in Dental Publications: Is There Evidence of a Methodological Change?


1
Medical Informatics and Data Analysis Research Group, University of Oulu, 90014 Oulu, Finland
2
Infrastructure of Population Studies, Faculty of Medicine, University of Oulu, 90014 Oulu, Finland
*
Author to whom correspondence should be addressed.
Publications 2020, 8(1), 9; https://doi.org/10.3390/publications8010009
Submission received: 15 December 2019
/
Revised: 26 January 2020
/
Accepted: 5 February 2020
/
Published: 6 February 2020
Abstract
:Objectives: To evaluate how data analysis methods in dental studies have changed in recent years. Methods: A total of 400 articles published in 2010 and 2017 in five dental journals, Journal of Dental Research, Caries Research, Community Dentistry and Oral Epidemiology, Journal of Dentistry, and Acta Odontologica Scandinavica, were analyzed. The study characteristics and the reporting of data analysis techniques were systematically identified. Results: The statistical intensity of the dental journals did not change from 2010 to 2017. Dental researchers did not adopt the data mining, machine learning, or Bayesian approaches advocated in the computer-oriented methodological literature. The determination of statistical significance was the most generally used method for conducting research in both 2010 and 2017. Observational study designs were more common in 2017. Insufficient and incomplete descriptions of statistical methods were still a serious problem. Conclusion: The stabilization of statistical intensity in the literature suggests that papers applying highly computationally complex data analysis methods have not meaningfully contributed to dental research or clinical care. Greater rigor is required in reporting the methods in dental research articles, given the current pervasiveness of failure to describe the basic techniques used.
1. Introduction
Statistics play essential roles in evidence-based dentistry (EBD) practice and research. EBD research ranges widely from formulating questions, designing studies, collecting and analyzing data to interpreting, reporting, and presenting study findings [1]. The reader should understand the methods described, especially when the article closely follows the traditional scientific methods with careful observations, accurate measurements, and statistical inference to critically appraise a scientific publication. Mastering statistical concepts appears to be an unreachable goal for many dental researchers, which is, in part, due to statisticians’ limitations in explaining statistical principles to health researchers without elaborating complex data analytical concepts.
Dental professionals clearly recognize the importance of data analysis concepts, but they often possess little awareness of these issues [2,3,4]. There are only a few comprehensive studies concerning dental journals and their use of data analysis methods. Yang et al. [5] conducted a bibliometric study on dental journals and estimated the availability of statistical information within paediatric dentistry. Lesaffre et al. [6] concluded in their study that the split-mouth study design and analysis would benefit from improvements in the use of statistical methods. The prevalence of statistical adjustment for confounding factors in orthodontic journals has also been assessed [7]. Vähänikkilä et al. [8,9,10] published systematic assessments of the data analysis methods in dental articles. They showed that the use of multivariable regression methods in dental journals from 1996 to 2006 did not increase. In addition, they showed how articles that are published in certain dental journals applied and reported statistical methods differently from articles in visible medical journals (New England Journal of Medicine and Lancet) [11]. However, Choi et al. [12] have identified a recent, but growing, trend towards the application of statistical, especially non-parametric, methods in periodontal research. There have also been also reviews of dental literature that have estimated the prevalence of misused statistics or statistical errors [13] or evaluated the quality of statistical reporting [10,14].
Table 1 lists the commonly used methods for assessing statistical significance in dental studies [15,16,17,18,19]. However, this table does not in any way include all of the statistical techniques that readers encounter in dental research reports. Oral health practice-based research often includes multiple patients from the same dental practice and multiple teeth or restorations within the same patient, which results in clusters of correlated observations [20,21]. Therefore, natural clustering is evident; for instance, teeth within an individual are expected to be correlated with each other. Consequently, the clustering needs to be taken into account properly in the analysis to avoid statistical errors, possibly leading into incorrect results and misleading conclusions, which has been a common deficiency in the relevant areas of dental research [1]. Several multilevel data analysis methods have been proposed for analyzing clustered data that do not ignore the clustering structure of surface and teeth [22,23]. In addition, various analysis methods of agreement and reliability have been implemented in dentistry to measure the extent of agreement among raters, or to validate the questionnaires or diagnostic tests [24,25].
The broad introduction of new data analysis methods that are compatible with the rapid expansion in computing capability has reached also medical publications [26,27,28]. Bayesian methods, artificial neural networks (ANN), and machine learning (ML) are some examples of these highly computational approaches [29]. The use of big data and computer-intensive methods can be expected to make further significant contributions to the use of statistics in medical publications [30]. It is still unclear how widely dental researchers will adopt these new technologies.
The aim of the present study is to assess the use and complexity of analytical statistical methods in dental journals in 2010 and 2017. Articles on five dental journals are analyzed and compared, focusing attention on the following research questions:
- How the authorship has changed over this specific time span?
- Has the characteristics of the study design changed?
- What is the information that authors give on statistical data analysis procedures?
- How widespread is statistical significance testing?
- Has the statistical intensity of published articles changed in the 2010s?
- What is the frequency of use of new complex computational approaches?
2. Materials and Methods
2.1. Article Set
A total of 400 articles that were published in 2010 and in 2017 were analyzed and covered five dental journals: Journal of Dental Research (JDR), Caries Research (CR), Community Dentistry and Oral Epidemiology (CDOE), Journal of Dentistry (JD), and Acta Odontologica Scandinavica (AOS). We chose these dental journals to validate inferences about the wide range of statistical reporting in visible and established dental journals. JDR has constantly been a highly visible and cited journal in dentistry with a Clarivate Analytics (previously by Thomson Reuters) impact factor (IF) of 3.773 in 2010 and 5.383 in 2017; CR had the highest impact factor of the cariological journals in 2010 (IF 2.920), but the journal’s visibility decreased in 2017 (IF 2.188); JD is an example of a journal that increased its visibility during the evaluation period (IF increased from 2.115 to 3.770); CDOE takes the epidemiological approach to dentistry and it had a slightly decrease visibility (IF was 2.328 in 2010 and 1.992 in 2017); and, AOS is a European journal with an emphasis on the use of preventive methods in dentistry with an IF of 1.017 in 2010 and 1.522 in 2017. Medline, Web of Science, and Scopus indexed all of the selected journals, which are the three most comprehensive indices of medical scientific journal articles.
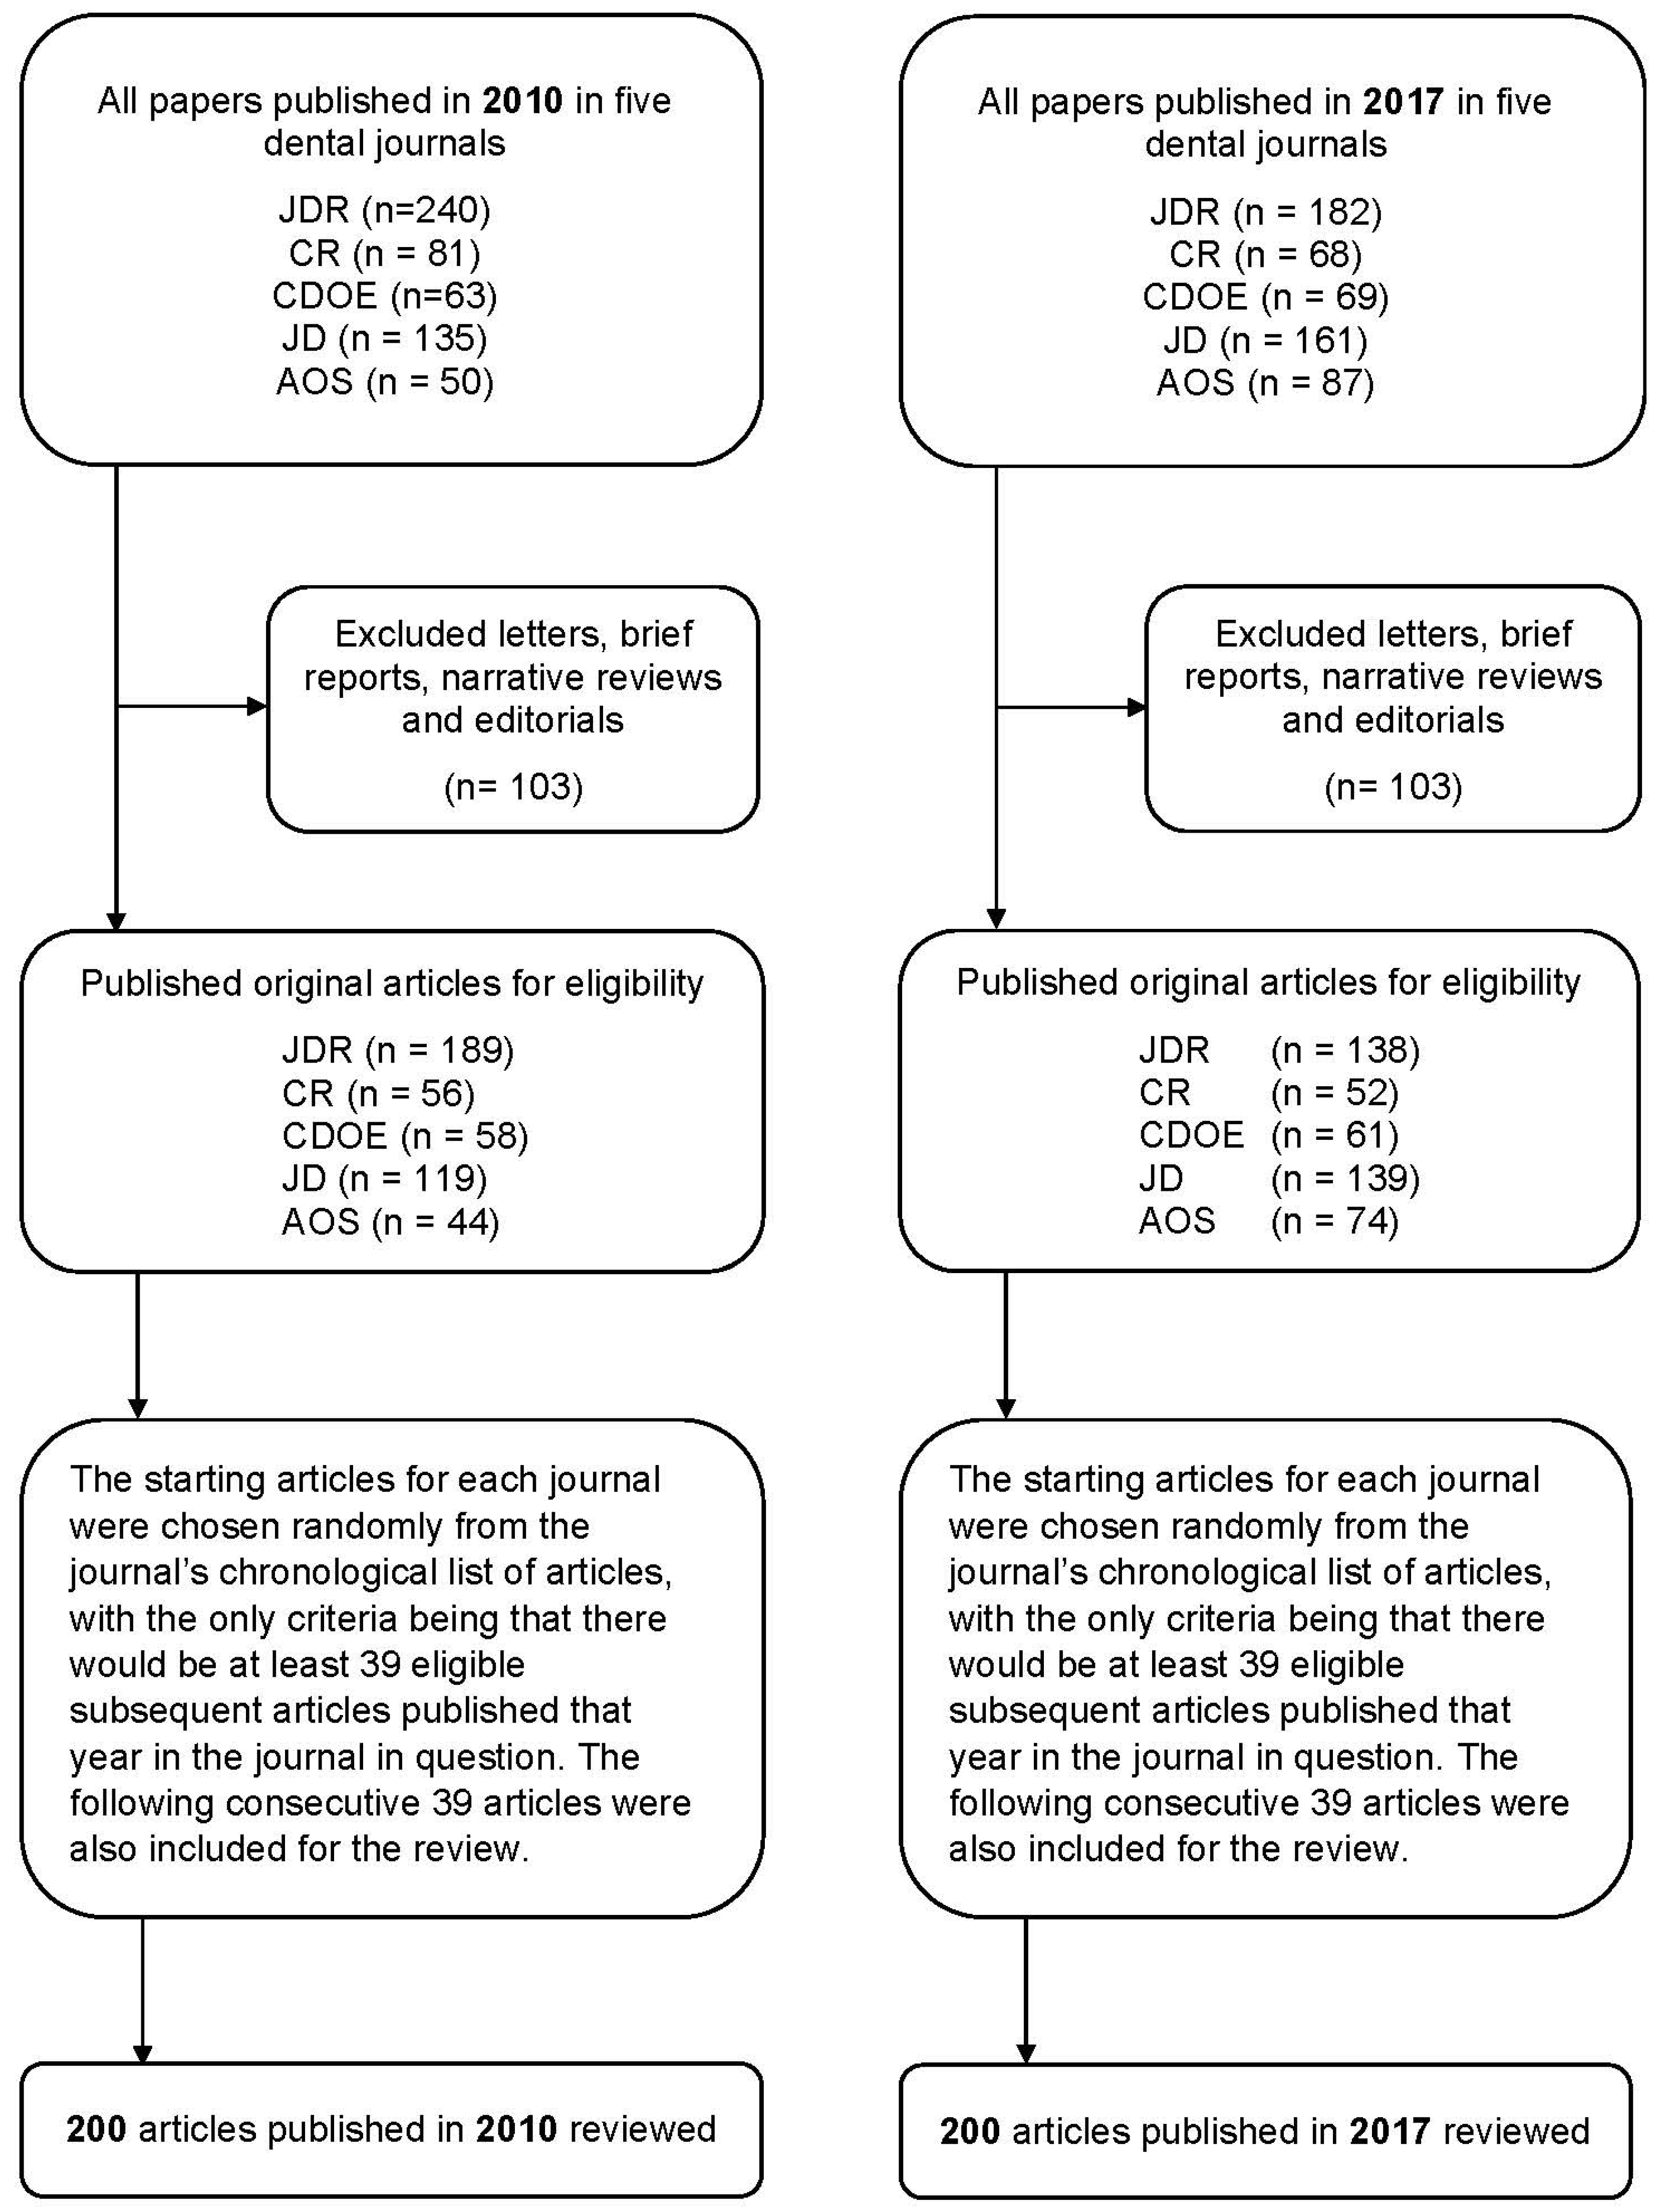
Several articles have reviewed medical papers and reported that the proportion of articles adequately using statistical methods lies in the range of 50–70% [31]. While assuming a 60% rate in dental papers, a sample size of 100 dental articles was calculated to be the minimum number of articles required for the present purpose, allowing for a maximum difference of 10% units between the sample rate and the true population rate at a 95% significance level. However, we anticipated that 20 articles per journal would be insufficient to make comparisons between the journals and, therefore, we decided to increase the number to 40 articles per journal and year. Figure 1 shows the flow chart of how the articles in the journals were selected.
The journals were scrutinized for original research articles that were published in 2010 and 2017. These years were chosen to review the use of new statistical modelling techniques in dental research. We have previously studied the development of data analysis methods and statistical reporting in papers that were published in four of these dental journals in 1996, 2001, and 2006 with bibliometric methods [8]. The total number of articles reviewed was 400 and each paper underwent careful scrutiny for the use of statistical methods and reporting. The second author (HV) manually reviewed all 200 papers that were published in 2010. The two authors jointly evaluated articles published in 2017 (n = 200) (PN and HV). All of the differences were reconciled by consensus.
2.2. Variables
We have measured, with slight modifications, the same variables as in our previous study from psychiatric articles [25]. First, the number of authors and international collaboration was recorded. International collaboration was defined as co-authorship involving informed author institutions from different countries.
In this study, each of the selected articles was classified to one of five study design groups: observational studies (cross-sectional surveys, cohort studies, and case-control studies), experimental studies (randomized controlled clinical trials (RCTs) and non-randomized interventions), validation and reliability studies, laboratory works, and other designs. We then divided the studies into four groups based on sample size: under 30, 30–99, 100–300, and over 300. We reviewed whether the data analysis procedures were described in the report’s methods section to evaluate the quality of reporting. The measured variables also included whether the authors used formal statistical inference analysis, and if so whether they reported a statistically significant result.
The statistical intensity formed the main outcome variable in this study. We used the Statistical Intensity of Medical Articles (SIMA) tool [31] to obtain information regarding the applied statistical methods. The SIMA instrument contains 68 items assessing data analysis procedures and the reporting of findings. These items are further reduced into 16 groups of items. Each group represents the use of specific statistical analysis methods or reporting styles. The sum of all 68 items, the statistical intensity score, measures the intensity of the applied statistical methods in an evaluated article. A published research article with very high number of tables and figures, several response variables and covariates, reporting of various multivariable models, abundant use of significance tests and confidence intervals can score a high SIMA value (over 20). However, these studies might be unreachable for dental readers. In turn, an article with a low statistical intensity score hardly applied any statistical methods. The reliability of the statistical intensity score has previously been shown to be high [31].
2.3. Data Analysis
Cross-tabulation was used to report the differences in the study characteristics and application of the data analysis procedures between the publication years. The chi-square test was applied to evaluate the statistical significance of the observed differences between the distributions. For the statistical intensity score, we used the mean value with standard deviation and box plots to describe the distribution by publication year and journal. An independent samples t-test was applied to evaluate the statistical significance of the difference in the SIMA score between 2010 and 2017. Analysis of variance was used to reveal the statistically significant differences for the statistical intensity between the journal groups. The SIMA score was approximately normally distributed and the normality assumption of the t-test and analysis of variance test were met by the data. All of the statistical analyses were executed while using IBM SPSS Statistics (version 25) software.
3. Results
3.1. Authors
In the total article set, the median number of authors was five in both 2010 and 2017, while the maximum number of authors increased from 10 in 2010 to 30 in 2017. However, the list of authors in only one journal (JDR) included a very abundant number of co-authors: 25% of the articles that were published in JDR in 2017 listed at least 10 co-authors with a maximum number of 30 co-authors. The level of international collaboration did not change in the evaluated journals from 2010 to 2017. The evaluated studies were internationally co-authored in 33.0% of the articles that were published in 2010, and in 29% of the articles published in 2017.
3.2. Characteristics of the Study Design
The general characteristics of the analyzed articles in different journals showed that the proportion of experimental studies (randomized clinical trials, non-randomized intervention studies or laboratory works) decreased from 23.5% in 2010 to 11.5% in 2017 (Table 2). Our article set included 38 studies (9.5% of all reviewed articles) that strictly followed the basic principles of randomized controlled clinical trials (21 published in 2010 and 17 in 2017). In more recently published dental studies, the authors applied an observational study design in 54% of the articles (Table 2). The observational study designs that were applied in 2010 were as follows: 68 cross-sectional studies (34%), 29 longitudinal (14.5%), and 11 case-control (5.5%). The journals did not differ from each other in this respect: JD had an increased proportion of observational articles from 12.5% to 32.5%, JDR from 22.5% to 32.5%, CR from 37.5% to 55.0%, AOS from 55.0% to 65.0%, and even CDOE from 72.5% to 85.0%.
Table 2 also presents the sample sizes of the reviewed studies. The sample sizes did not significantly change in the five evaluated journals. Only in JD was there a clear change from small studies to studies with larger sample sizes. In 2010, almost half of the articles (43%) that were published in this journal had a sample size under 30, but, in 2017, this proportion decreased to 25%. In addition, 10 (25%) of the published articles presented data on 300 or more subjects in 2017, but only in one evaluated article (2.5%) in 2010.
3.3. Reporting of Data Analysis Methods
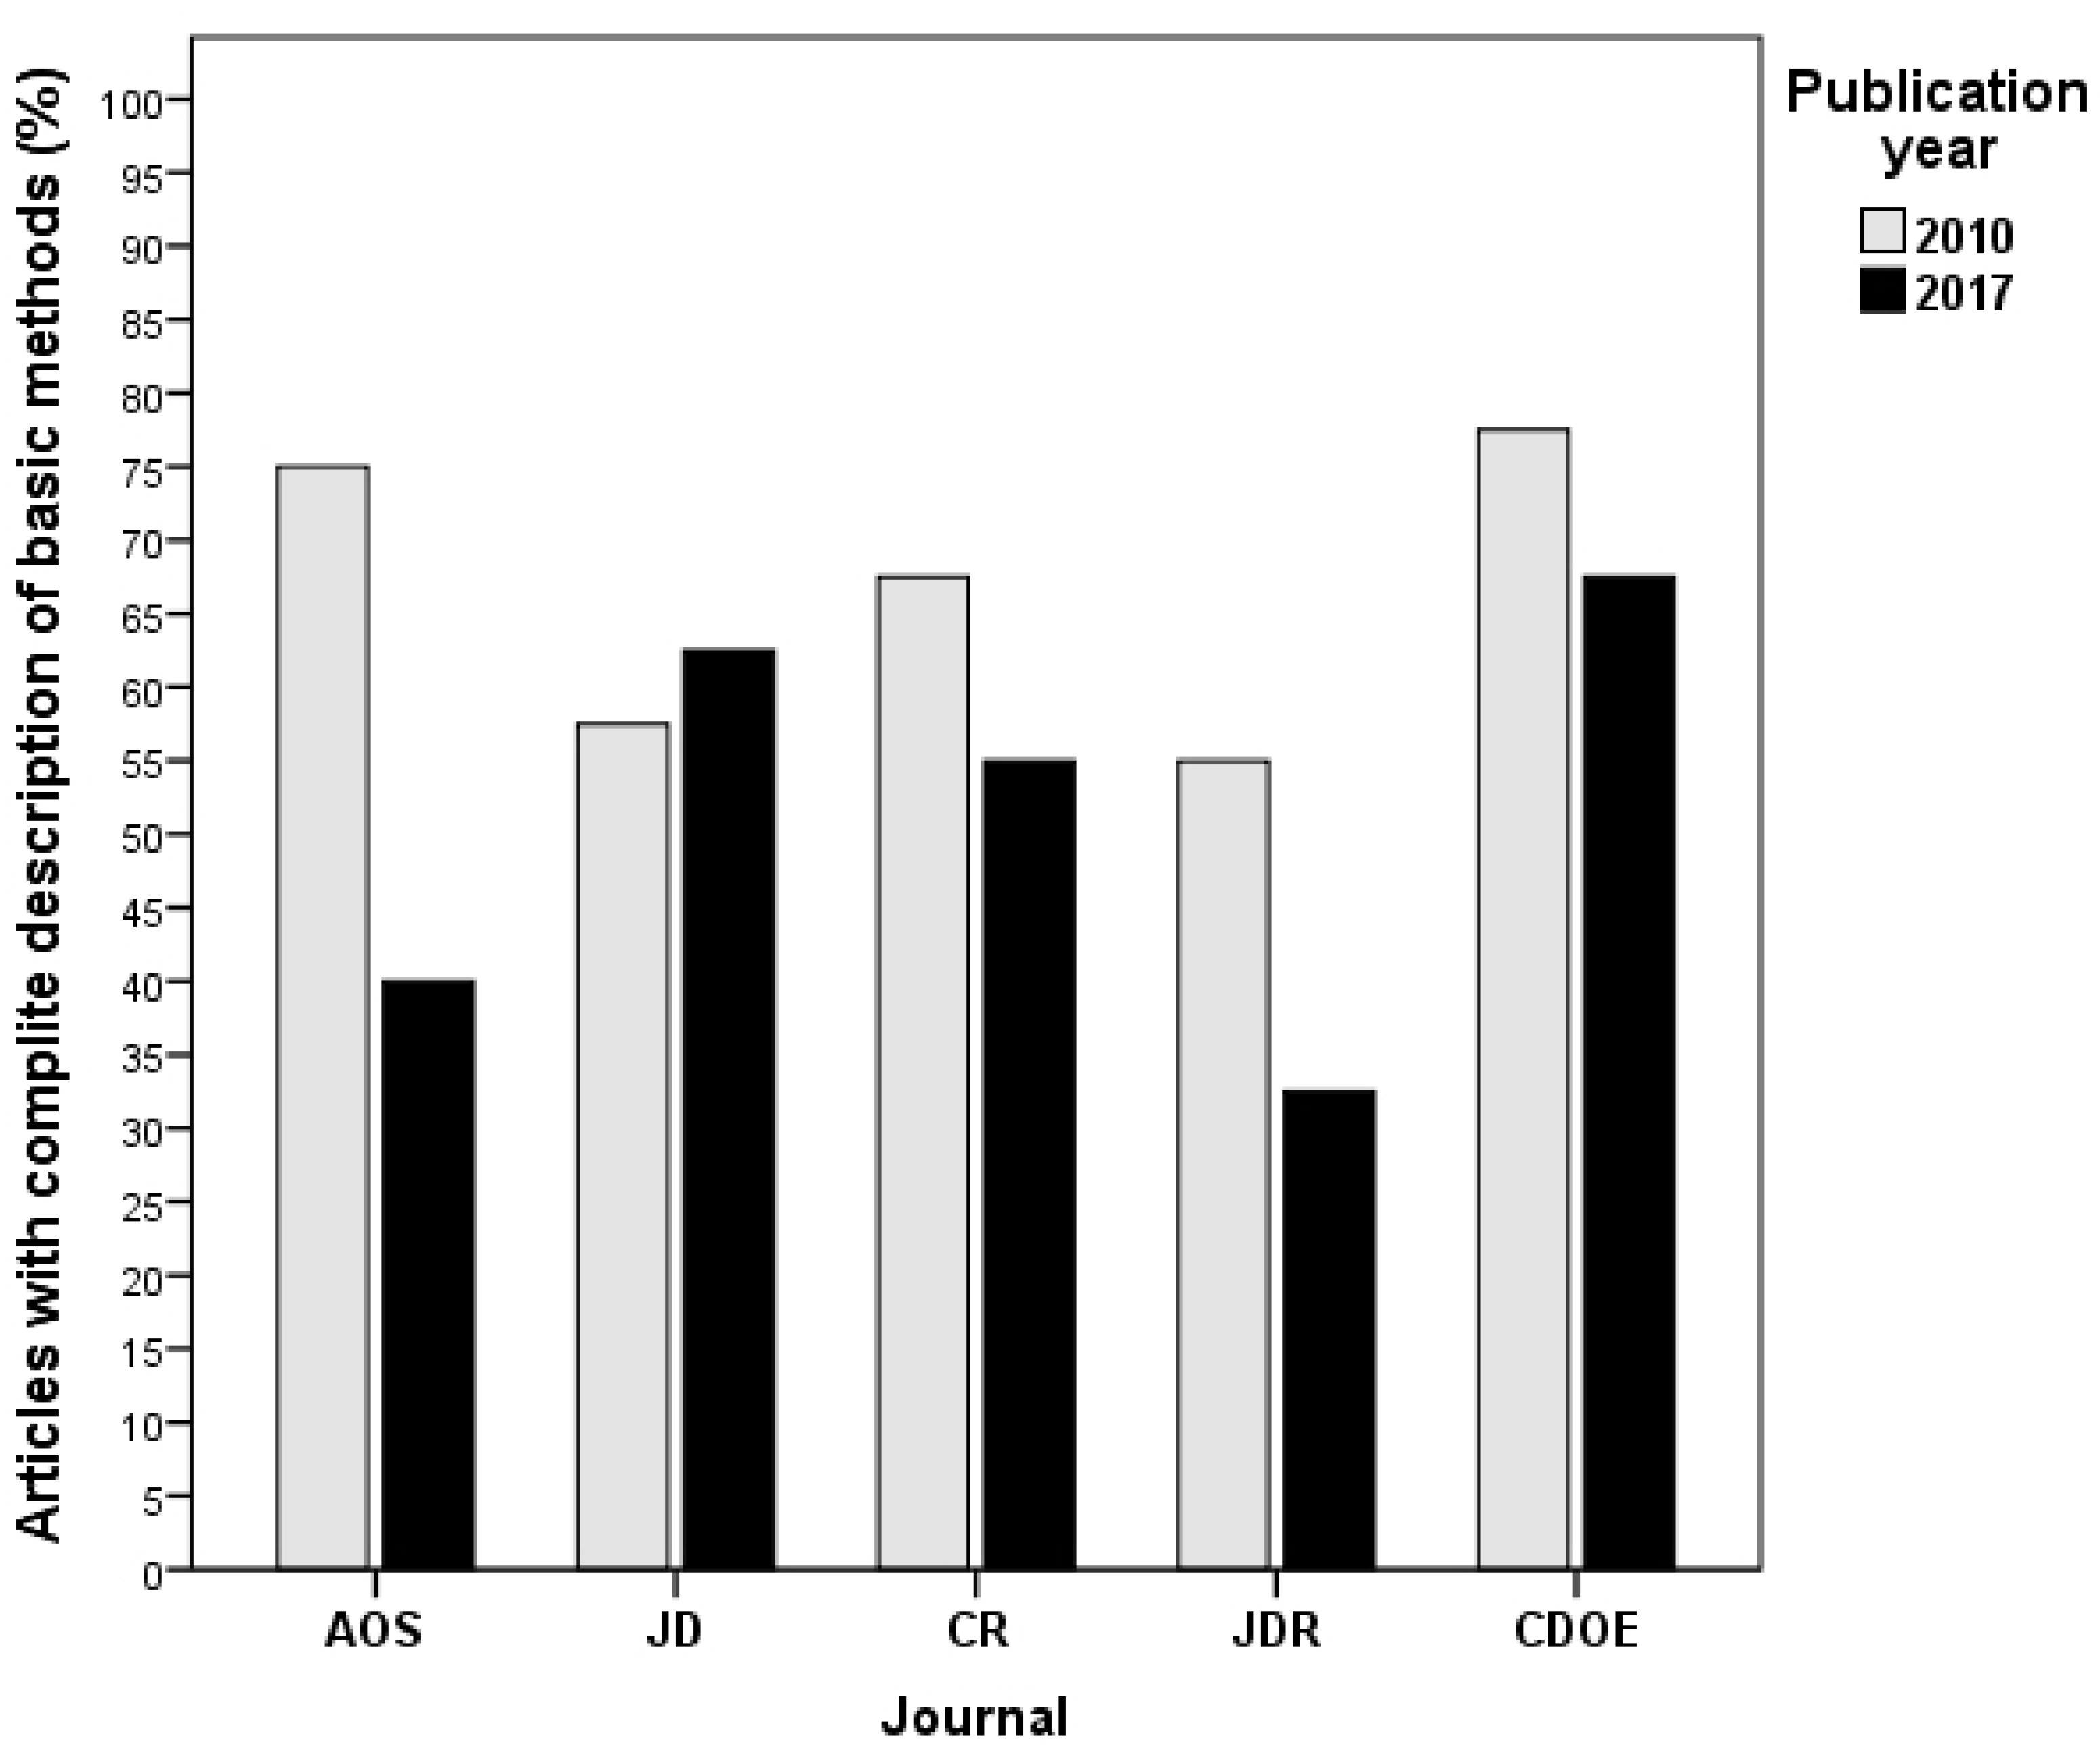
The failure to clearly describe the statistical (data analysis) methods in the Materials and Methods section statistically and significantly increased from 33.5% to 48.5% during the seven-year period (p-value of chi-square test was 0.003). This serious reporting problem seems to be more prevalent in 2017. Figure 2 shows how the description of statistical methods varied by journal and publication year.
3.4. Use of Statistical Significance Testing
Of the 200 evaluated articles published in 2010, we found that 159 (79.5%) articles reported use of statistical significance testing. Of these studies, 123 (77.4%) reported a statistically significant result for the primary outcome. This proportion did not change in 2017, with 125/157 (79.6%) articles being published in the evaluated journals reporting p-values of less than 0.05.
3.5. Statistical Intensity of Dental Articles
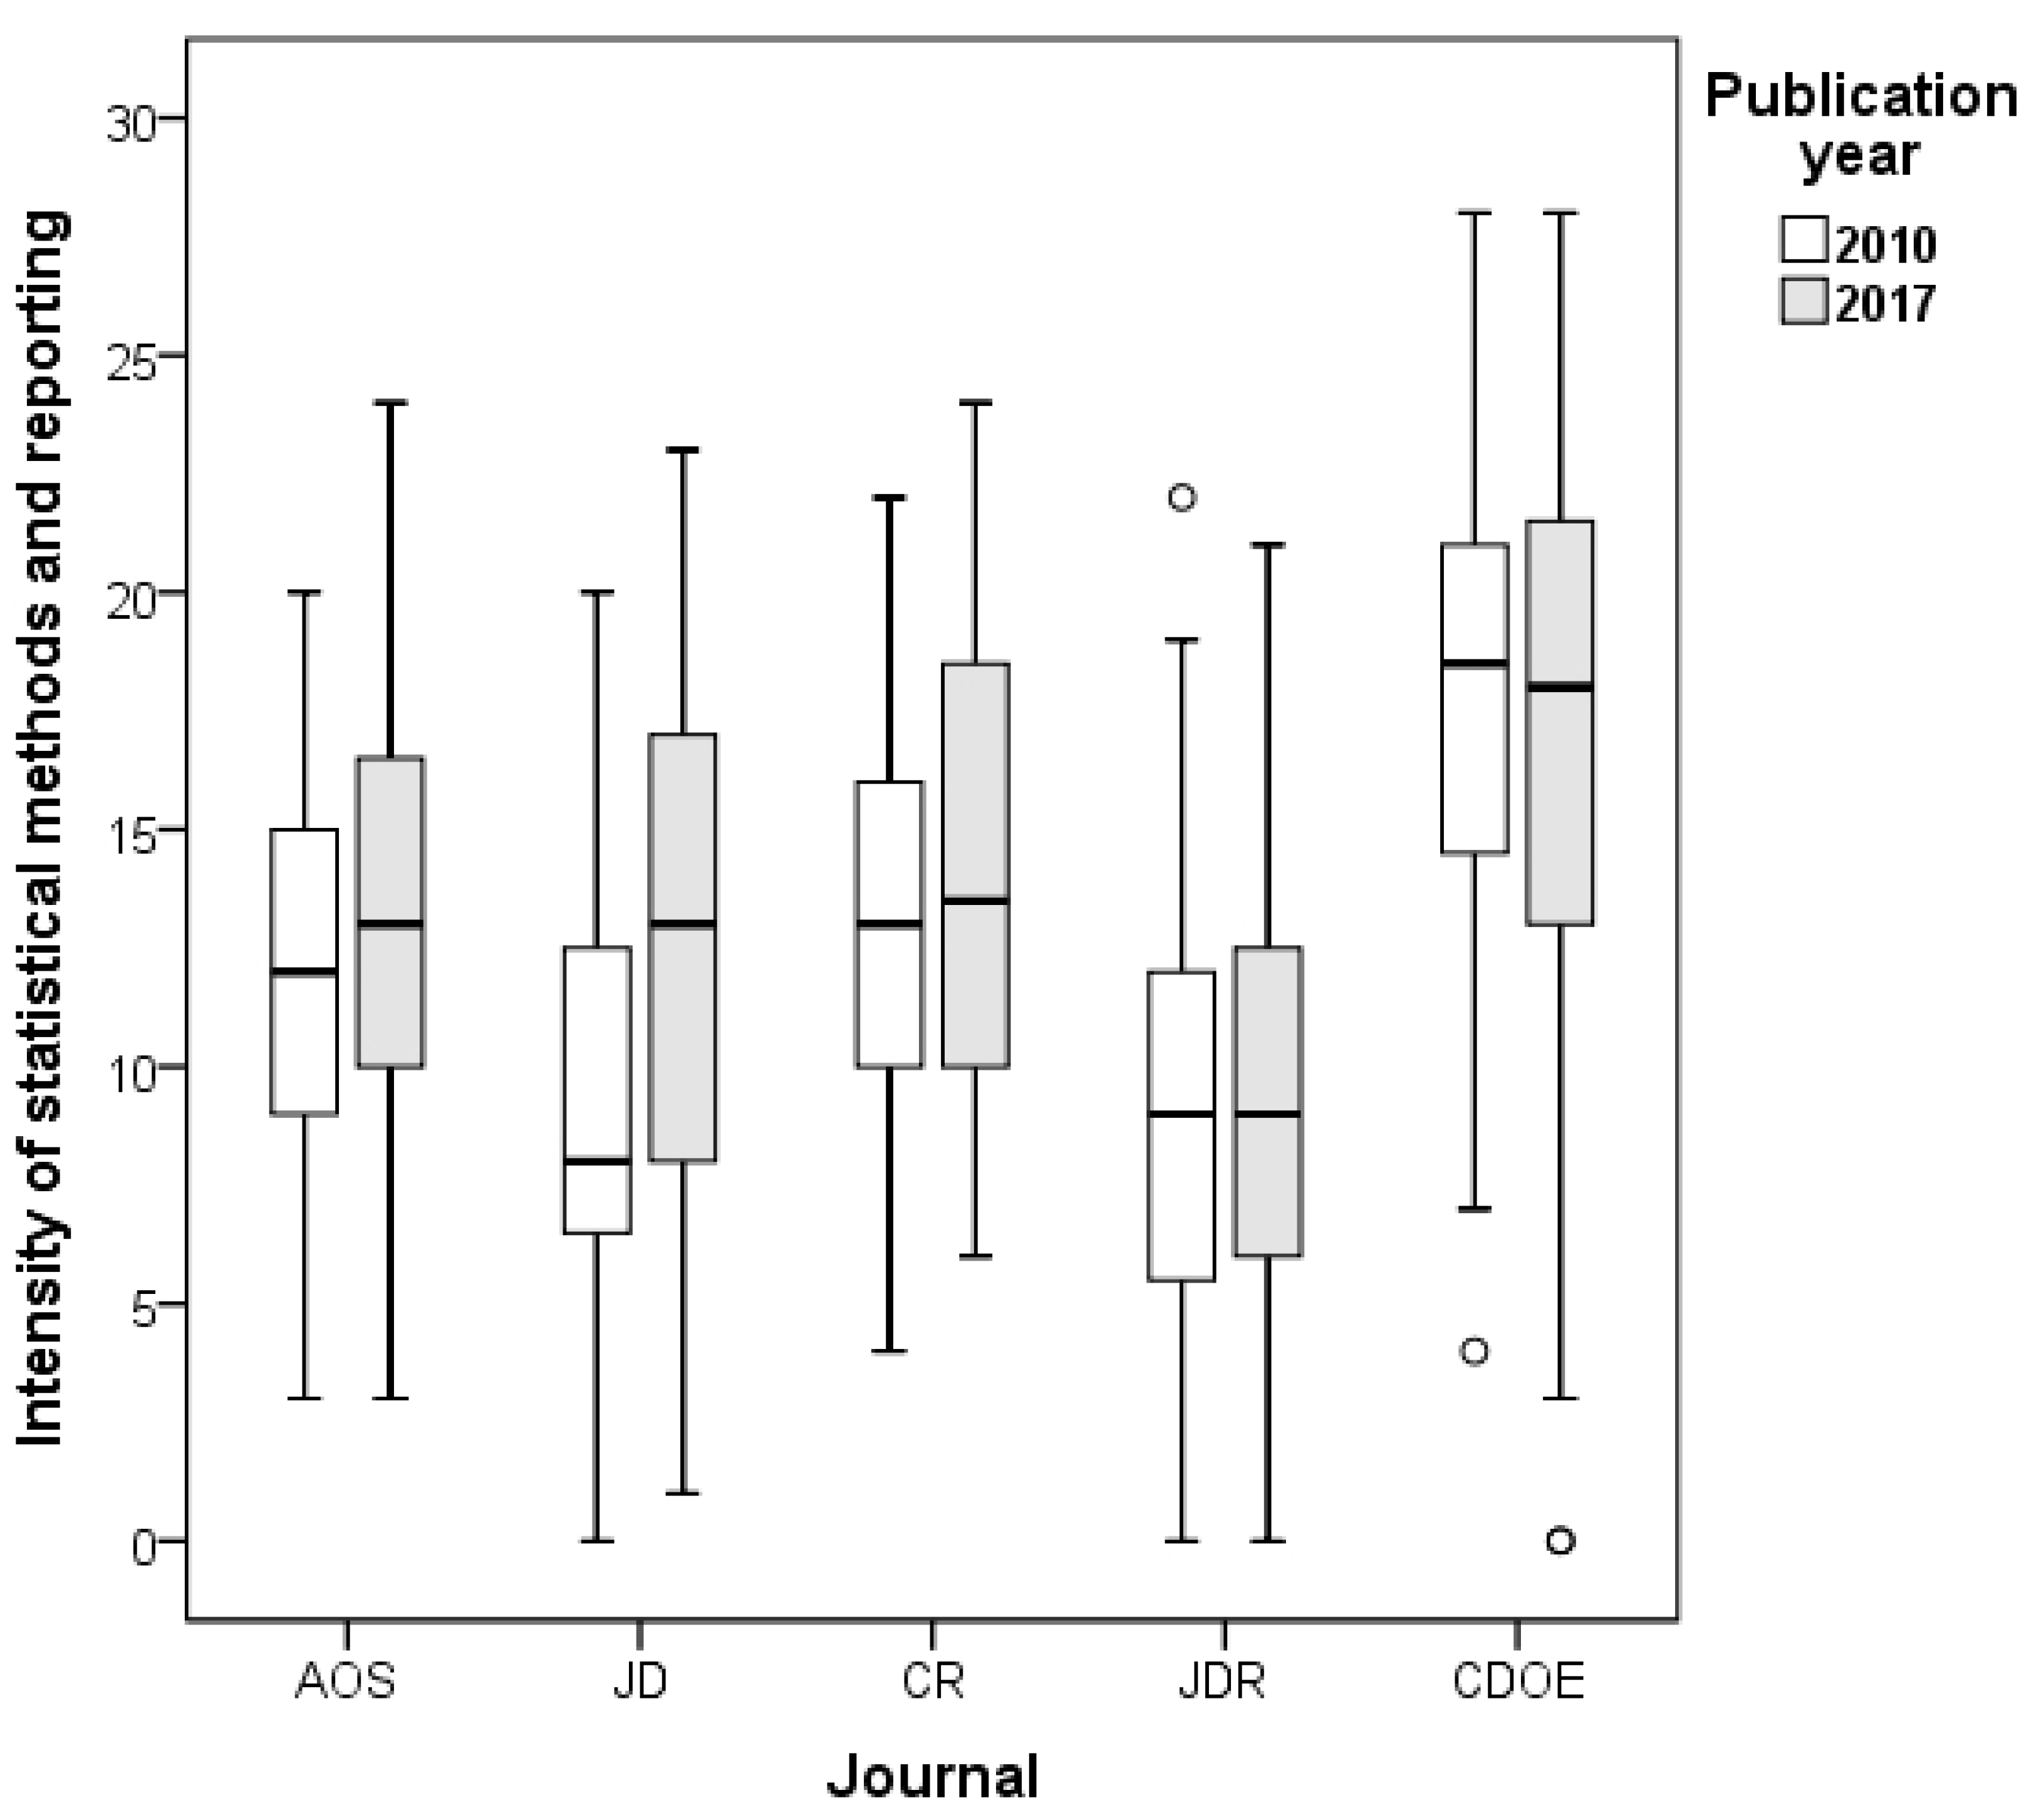
Figure 3 presents the distribution of the statistical intensity score in the articles that were published in 2010 and 2017. The mean (SD) of statistical intensity score in all 200 dental reports published in 2010 was 12.2 (5.8) and this number increased to 13.0 (6.0) in 2017. The change was not statistically significant (p-value of independent samples t-test was 0.155). The statistical intensity only increased significantly from 2010 to 2017 in JD, where the SIMA score increased from 9.2 to 12.6. In this journal, the quality of statistical reporting and the information that the authors gave on data analysis procedures improved considerably. The use of more computer-dependent statistical modeling methods had not replaced the traditional significance tests or basic regression models in data analyses in any of the evaluated dental journals.
In 2017, the mean (SD) of statistical intensity score varied, as follows: AOS 13.1 (4.9), JD 12.6 (5.6), CR 13.7 (5.0), JDR 9.5 (5.6), and CDOE 16.3 (7.0), i.e., the statistical intensities of these prominent dental journals were not at the same level (p-value = 0.015). In particular, CDOE published studies with high statistical intensity in both 2010 and 2017.
The SIMA score discriminated the dental articles according to their study design (Figure 4). Observational studies had high mean value in both 2010 (15.1) and in 2017 (14.8), especially more complex longitudinal cohort studies reported a wide use of statistical analysis techniques. Intervention studies (mean 13.4) and reliability studies (13.6) had values that were close to the average values (13.0) in 2017. Laboratory works had hardly applied any data analysis methods and had very low intensity of statistical methods and reporting in 2010 and 2017. In 2017, the other study designs included seven meta-analyses. These reports had the highest mean value (16.3) in 2017. The statistical demands seemed to be higher in meta-analyses.
We also analyzed the association between the number of authors and SIMA score. The SIMA score did not correlate with the number of co-authors (Spearman’s correlation coefficient ρ = −0.08 in 2010 and ρ = −0.06 in 2017).
3.6. Statistical Procedures
Table 3 shows the frequencies of the various statistical methods in the journals. Close to two-thirds of the dental papers reported the use of basic methods to compare independent groups. Multivariable regression models were used in 31% of the articles. Agreement between different measures was reported in 20% of the evaluated articles. There were no statistically significant differences in the period between 2010 and 2017 in relation to the use of basic statistical methods or multivariable regression models. The readers of dental articles still encountered traditional methods that compared repeated measurements (t-test and ANOVA for repeated measurements, Wilcoxon test, or McNemar’s test) in 2017. However, the various approaches for estimating intra-cluster correlations as further expansions of basic regression models have not widely expanded for the analysis of longitudinal or intra-clustered dental data. In 2017, we found ten meta-analyses, while in 2010 there were none.
New more complex methods that were attributable to the rapid expansion in computing capability, including Bayesian methods, artificial neural networks, and machine learning, were applied on rare occasions. Of the 400 articles, only three articles had utilized these methods (Table 3).
4. Discussion
Research reports that were published in five dental journals in 2017 were compared to studies published in the same journals in 2010. This study yielded three main results: (1) the average number of authors and the level of international collaboration did not change in the evaluated journals from 2010 to 2017, (2) observational study designs became more common, (3) despite widespread criticism, insufficient and incomplete descriptions of statistical methods were still prominent, (4) the proportion of articles reporting p-values remained high, (5) there was no increase in the frequency and intensity of statistical reporting in the literature over the seven-year period, and (6) Authors have not adopted new highly computational complex data analysis methods.
It is necessary to revisit the issue of statistical reporting to see whether findings from the 2000s to the 2010s are still supported today because dental education and the standards for research reports are continuously evolving. In this way, our study adds to the literature, as it indicates the continuing use of basic traditional statistical methods. Previous evidence from the visible medical journals [32] shows that moving beyond basic statistical concepts to reporting multivariable regression, time to event models and intra-cluster correlation methods (multilevel modelling, generalized estimation equation analysis, or mixed models), is increasing in general clinical journals. However, the results of this study indicate that the reporting of these methods did not increase much in the evaluated dental journals. In addition, the use of multivariable or specific methods was still in the same level as in papers that were published between 1996 to 2006 [8]. The reasons are not evident, but we believe that the authors or reviewers and editors of dental journals have not recognized the importance of utilizing these analysis methods in dental studies. In addition, Baker and Gibson [33] have noted that very few dental journals have skilled statistical reviewers who could help the authors to use more appropriate data analysis methods. Thus, our findings provide information that could be considered by dental schools and post-graduate training programs to review and revise their statistical training components.
Our results show that observational studies (cross-sectional surveys, longitudinal and case-control studies) were performed at a higher frequency in 2017 than in 2010, and there was a corresponding decrease in the frequency of experimental study designs and reliability evaluations. In particular, the number of traditional cross-sectional or survey study designs increased, and the readers of these journals did not encounter non-randomized and uncontrolled experiments (or interventional studies) as often. This finding suggests that studies with more epidemiological and public health objectives were published in the evaluated dental journals in 2017.
Textbooks of medical statistics require that the sample size should be large enough (or as large as possible) [17,19]. The number of articles that presented data on a large number of subjects increased slightly in all reviewed journals. Over 33% of the evaluated articles analyzed data that included at least 300 study subjects in 2017. This proportion is still low when compared to articles published in visible psychiatric (63%) or respiratory (50%) journals [25,34]. The previously reported alarming phenomenon of decreasing sample sizes in dentistry has hopefully changed to a trend of greater precision and power [8].
We observed changes between the articles published in 2010 or 2017 regarding the quality of statistical reporting. Failure to describe the statistical methods was even more common in 2017 than in 2010 in four of the five journals. Most of the shortcomings in reporting of data analysis methods in the journal articles that are reviewed here are related to topics included in most of the guidelines for statistical reporting [35,36]. For example, the authors did not mention the variables and methods used for each analysis conducted in the study, or they just listed the names of the different significance tests. However, the guidelines advise describing statistical methods with enough detail to enable a knowledgeable reader to judge their appropriateness for the study and verify the reported results. It seems strange that these widespread reporting problems continue for such an important issue. Focusing on clearly stated data analysis methods helps both the investigators to write an understandable and compact report and the readers to evaluate the findings [34]. Nevertheless, considerable research is published without co-authors with adequate training in data analysis methods, and the papers just copy the insufficient descriptions from previous studies. In addition, the peer review of the statistical methods is not common or sufficiently valued by editors [37,38].
Our results provide up-to-date evidence for the widespread use of significance testing in the dental literature. Up to 80% of the reviewed dental papers displayed some kind of analytical character, applying diverse statistical inferential methods. In addition, there was no change in the use of significance testing. The reporting of traditional statistical significance testing and p-values was at the same level as that reported in a previous study that reviewed four of these five journals from 1996 and 2006 [8]. Dental researchers were still likely to perform several tests to obtain statistically significant results, and this phenomenon can lead to multiple testing problems and possible publication bias. Statistically significant outcomes are more likely to be published than papers with non-significant results [39]. Our findings reinforce the growing concern regarding the misuse of p-values in medical literature [40,41].
The statistical intensity that was measured by the SIMA score did not change much during the evaluation period; there was only an increase in the scores in JD. The statistical intensity of a published article has several dimensions, and it is not a simple measure of the mathematical complexity or computer dependency of an applied method [31]. The proposed score measures the intensity from a reader’s point of view. The instrument integrates the description of the methods, ancillary analysis, report of findings using p-values, confidence intervals, tables or figures, and model-building strategies with the use of specific statistical analysis techniques. A paper with several outcomes and explanatory variables, the application of multivariable methods, overuse of p-values and confidence intervals, and a very high number of tables and figures is given a high SIMA score, but dental readers might find these papers difficult to read. Our findings show that the complexity of dental articles did not increase, although there is a need to apply more appropriate multivariable methods and improve the description of data analysis methods.
The Journal of Dentistry increased its visibility and ranking among dental journals based on the impact factors listed by Clarivate Analytics. JD was ranked 18 in the dental category in 2010, but advanced to eight in 2018. In parallel with the considerable improvements in the statistical intensity of the published articles, JD also increased its rank among dental researchers. The fact that statistical analysis is essential in clinical studies today indicates that the correct and readable reporting of statistical analysis is also important when a journal aims to increase its visibility. However, this does not necessarily hold true for journals in the biomedical fields, which stick with basic statistical inferential methods, such as t-tests or analysis of variance [42]. In our study, JDR represents these higher impact factor journals that have a high proportion of laboratory works and very low statistical intensity.
The availability of statistical software packages has greatly facilitated extensive data analysis and increased the quantity and complexity of using statistical methods. Our findings are in line with previous findings from other medical sub-fields, where clinical researchers have not approved data mining and computationally intensive machine learning methods [25,34,43]. So far, machine learning algorithms that have been developed for prediction purposes have not been useful tools in clinical medicine when the purpose is to understand factors that affect developing diseases or estimate the effectiveness of new treatment methods [44]. If conclusions are drawn on the basis of computationally complex algorithms not visible in the data (tables or graphs) presented, then the clinicians may not be convinced of the results. Simpler classical approaches can often provide elegant and sufficient answers to important questions. Unsustainable promises and unfulfillable expectations should be avoided in the context of big data and machine learning [30]. The broader introduction and expansion of a new analysis method to medical publication seems to require that the method helps to solve a data analysis problem, where basic statistical methods have not been useful or applicable.
The selection of journals was the major limitation of this study. There are 90 journals in dental journals category of Journal Citation Reports provided by Clarivate Analytics. In addition, there are several other dental journals that are not indexed by Clarivate Analytics. We chose our journals with the aim of making externally valid inferences about current data analysis methods in the visible dental literature. The five journals were chosen to represent these established journals, but also encompassing different dental specialties. Accordingly, we think that our choice of journals enables us to make externally valid statements regarding the current statistical methods and reporting in dental publications.
5. Conclusions
Scientific reports are the key to a dentist’s lifelong learning process. There was no veritable explosion in the frequency and intensity of data analysis methods in the dental literature over the seven-year period. The use of basic significance testing was still widespread. Dental doctors who are familiar with basic data analysis methods can critically evaluate most of the published research reports. This skill will positively affect their ability to use the information for better patient care. Educators in dentistry could apply our results in designing training on research skills.
Statistical methods should convey and disseminate the news of the research. Failing to state essential information on data analysis procedures was prominent. Most of the shortcomings in the reporting of data analysis information were related to topics that were included in most author guidelines. It seems strange that a problem seemingly so important, so widespread, and so long-standing should continue [37]. Possible explanations are that (1) much research is done without the benefit of anyone with adequate training in quantitative research methods, (2) copying of poor reporting practices is usual, or (3) the statistical component of the peer review process is not common or sufficiently valued by editors. Our study suggests that, while dental researchers currently publish studies with understandable and compact analyses, they should improve the quality of statistical reporting. Thus, they help other researchers to utilize those results in their own further studies.
Author Contributions
Conceptualization, P.N. and H.V.; methodology, P.N. and H.V.; formal analysis, P.N.; data analysis, P.N.; writing—original draft preparation, P.N.; writing—review and editing, H.V.; project administration, P.N. All authors have read and agreed to the published version of the manuscript.
Funding
This research received no external funding.
Conflicts of Interest
The authors declare no conflict of interest.
References
- Shintani, A. Primer of statistics in dental research: Part II. J. Prosthodont. Res. 2014, 58, 85–91. [Google Scholar] [CrossRef]
- Shetty, A.C.; Al Rasheed, N.M.; Albwardi, S.A. Dental professionals’ attitude towards biostatistics. J. Dent. Oral Hyg. 2015, 7, 113–118. [Google Scholar]
- Hannigan, A.; Hegarty, A.C.; McGrath, D. Attitudes towards statistics of graduate entry medical students: The role of prior learning experiences. BMC Med. Educ. 2014, 14, 70. [Google Scholar] [CrossRef] [PubMed] [Green Version]
- Batra, M.; Gupta, M.; Dany, S.S.; Rajput, P. Perception of Dental Professionals towards Biostatistics. Int. Sch. Res. Not. 2014, 2014, 1–6. [Google Scholar] [CrossRef] [PubMed] [Green Version]
- Yang, S.; Needleman, H.; Niederman, R. A bibliometric analysis of the pediatric dental literature in MEDLINE. Pediatr. Dent. 2001, 23, 415–418. [Google Scholar] [PubMed]
- Lesaffre, E.; Garcia Zattera, M.; Redmond, C.; Huber, H.; Needleman, I. Reported methodological quality of split-mouth studies. J. Clin. Periodontol. 2007, 34, 756–761. [Google Scholar] [CrossRef] [PubMed]
- Spanou, A.; Koletsi, D.; Fleming, P.S.; Polychronopoulou, A.; Pandis, N. Statistical analysis in orthodontic journals: Are we ignoring confounding? Eur. J. Orthod. 2016, 38, 32–38. [Google Scholar] [CrossRef] [PubMed] [Green Version]
- Vähänikkilä, H.; Nieminen, P.; Miettunen, J.; Larmas, M. Use of statistical methods in dental research: Comparison of four dental journals during a 10-year period. Acta Odontol. Scand. 2009, 67, 206–211. [Google Scholar] [CrossRef] [PubMed]
- Vähänikkilä, H.; Miettunen, J.; Tjäderhane, L.; Larmas, M.; Nieminen, P. The use of time-to-event methods in dental research: A comparison based on five dental journals over a 11-year period. Community Dent. Oral Epidemiol. 2012, 40, 36–42. [Google Scholar] [CrossRef]
- Vähänikkilä, H.; Tjäderhane, L.; Nieminen, P. The statistical reporting quality of articles published in 2010 in five dental journals. Acta Odontol. Scand. 2015, 73, 76–80. [Google Scholar] [CrossRef]
- Vahanikkila, H.; Virtanen, J.I.; Nieminen, P. How do statistics in dental articles differ from those articles published in highly visible medical journals? Scientometrics 2016, 108, 1417–1424. [Google Scholar] [CrossRef]
- Choi, E.; Lyu, J.; Park, J.; Kim, H.-Y. Statistical methods used in articles published by the Journal of Periodontal and Implant Science. J. Periodontal Implant Sci. 2014, 44, 288–292. [Google Scholar] [CrossRef] [PubMed] [Green Version]
- Kim, J.S.J.; Kim, D.-K.; Hong, S.J. Assessment of errors and misused statistics in dental research. Int. Dent. J. 2011, 61, 163–167. [Google Scholar] [CrossRef] [PubMed]
- Layton, D.M.; Clarke, M. Quality of reporting of dental survival analyses. J. Oral Rehabil. 2014, 41, 928–940. [Google Scholar] [CrossRef]
- Nieminen, P.; Miettunen, J.; Koponen, H.; Isohanni, M. Statistical methodologies in psychopharmacology: A review. Hum. Psychopharmacol. Exp. 2006, 21, 195–203. [Google Scholar] [CrossRef]
- Motulsky, H. Intuitive Biostatistics, 3rd ed.; Oxford University Press: New York, NY, USA, 2014; ISBN 9780199946648. [Google Scholar]
- Campbell, M.J.; Machin, D. Medical Statistics, A Commonsense Approach, 3rd ed.; Wiley: Chichester, UK, 2003; ISBN 0471987212. [Google Scholar]
- Indrayan, A.; Malhotra, R.K. Medical Biostatistics, 4th ed.; CRC Press: Milton, GA, USA, 2018; ISBN 1498799531. [Google Scholar]
- Bland, M. An Introduction to Medical Statistics; Oxford University Press: New York, NY, USA, 2015; ISBN 0199589925. [Google Scholar]
- Litaker, M.S.; Gordan, V.V.; Rindal, D.B.; Fellows, J.L.; Gilbert, G.H.; National Dental PBRN Collaborative Group, T.N.D.P.C. Cluster Effects in a National Dental PBRN restorative study. J. Dent. Res. 2013, 92, 782–787. [Google Scholar] [CrossRef] [Green Version]
- Masood, M.; Masood, Y.; Newton, J.T. The clustering effects of surfaces within the tooth and teeth within individuals. J. Dent. Res. 2015, 94, 281–288. [Google Scholar] [CrossRef] [Green Version]
- Diez, R. A glossary for multilevel analysis. J. Epidemiol. Community Health 2002, 56, 588–594. [Google Scholar] [CrossRef]
- Goldstein, H. Multilevel Statistical Models, 4th ed.; Wiley: Chichester, UK, 2011; ISBN 0470973390. [Google Scholar]
- Pretty, I.A.; Maupomé, G. A closer look at diagnosis in clinical dental practice: Part 6. Emerging technologies for detection and diagnosis of noncaries dental problems. J. Can. Dent. Assoc. 2004, 70, 621–626. [Google Scholar]
- Nieminen, P.; Kaur, J. Reporting of data analysis methods in psychiatric journals: Trends from 1996 to 2018. Int. J. Methods Psychiatr. Res. 2019, 28, e1784. [Google Scholar] [CrossRef] [Green Version]
- Veierod, M.B.; Lydersen, S.; Laake, P. Medical Statistics in Clinical and Epidemiological Research; Gyldendal Norsk Forlag: Oslo, Norway, 2012; ISBN 978-82-05-39959-4. [Google Scholar]
- Rashidi, H.H.; Tran, N.K.; Betts, E.V.; Howell, L.P.; Green, R. Artificial Intelligence and Machine Learning in Pathology: The Present Landscape of Supervised Methods. Acad. Pathol. 2019, 6, 2374289519873088. [Google Scholar] [CrossRef] [PubMed]
- Alabi, R.O.; Elmusrati, M.; Sawazaki-Calone, I.; Kowalski, L.P.; Haglund, C.; Coletta, R.D.; Mäkitie, A.A.; Salo, T.; Leivo, I.; Almangush, A. Machine learning application for prediction of locoregional recurrences in early oral tongue cancer: A Web-based prognostic tool. Virchows Arch. 2019, 475, 489–497. [Google Scholar] [CrossRef] [PubMed] [Green Version]
- Ertel, W. Introduction to Artificial Intelligence; Springer: London, UK, 2011; ISBN 0857292994. [Google Scholar]
- Caliebe, A.; Leverkus, F.; Antes, G.; Krawczak, M. Does big data require a methodological change in medical research? BMC Med. Res. Methodol. 2019, 19, 125. [Google Scholar] [CrossRef] [PubMed]
- Nieminen, P.; Virtanen, J.I.; Vahanikkila, H. An instrument to assess the statistical intensity of medical research papers. PLoS ONE 2017, 12. [Google Scholar] [CrossRef]
- Arnold, L.D.; Braganza, M.; Salih, R.; Colditz, G.A. Statistical Trends in the Journal of the American Medical Association and Implications for Training across the Continuum of Medical Education. PLoS ONE 2013, 8, e77301. [Google Scholar] [CrossRef]
- Baker, S.R.; Gibson, B.G. Social oral epidemi(olog)(2) y where next: One small step or one giant leap? Community Dent. Oral Epidemiol. 2014, 42, 481–494. [Google Scholar] [CrossRef] [Green Version]
- Nieminen, P.; Toljamo, T.; Vähänikkilä, H. Reporting data analysis methods in high-impact respiratory journals. ERJ Open Res. 2018, 4, 00140–02017. [Google Scholar] [CrossRef] [Green Version]
- Lang, T.A.; Altman, D.G. Statistical Analyses and Methods in the Published Literature: The SAMPL Guidelines. In Guidelines for Reporting Health Research: A User’s Manual; John Wiley & Sons, Ltd.: Oxford, UK, 2014; pp. 264–274. ISBN 9780470670446. [Google Scholar]
- ECMJE Recommendations for He Conduct, Reporting, Editing, and Publication of Scolarly Work in Medical Journals. Available online: http://www.icmje.org/recommendations/ (accessed on 1 January 2020).
- Nieminen, P.; Carpenter, J.; Rucker, G.; Schumacher, M. The relationship between quality of research and citation frequency. BMC Med. Res. Methodol. 2006, 6, 42. [Google Scholar] [CrossRef] [Green Version]
- Karadeniz, P.K.; Uzabaci, E.; Kuyuk, S.A.; Kesin, F.K.; Can, F.E.; Secil, M.; Ercan, I. Statistical errors in articles published in radiology journals. Diagn. Interv. Radiol. 2019, 25, 102–108. [Google Scholar] [CrossRef]
- Song, F.; Parekh-Bhurke, S.; Hooper, L.; Loke, Y.K.; Ryder, J.J.; Sutton, A.J.; Hing, C.B.; Harvey, I. Extent of publication bias in different categories of research cohorts: A meta-analysis of empirical studies. BMC Med. Res. Methodol. 2009, 9, 79. [Google Scholar] [CrossRef] [Green Version]
- Mlinarić, A.; Horvat, M.; Šupak Smolčić, V. Dealing with the positive publication bias: Why you should really publish your negative results. Biochem. Med. 2017, 27, 30201. [Google Scholar] [CrossRef] [PubMed] [Green Version]
- Wasserstein, R.L.; Schirm, A.L.; Lazar, N.A. Moving to a World Beyond “p < 0.05”. Am. Stat. 2019, 73, 1–19. [Google Scholar]
- Strasak, A.M.; Zaman, Q.; Marinell, G.; Pfeiffer, K.P.; Ulmer, H. The Use of Statistics in Medical Research: A Comparison of “The New England Journal of Medicine” and “Nature Medicine”. Am. Stat. 2007, 61, 47–55. [Google Scholar] [CrossRef]
- Deo, R.C. Machine Learning in Medicine HHS Public Access. Circulation 2015, 132, 1920–1930. [Google Scholar] [CrossRef] [PubMed] [Green Version]
- DeRouen, T.A. Promises and Pitfalls in the Use of “Big Data” for Clinical Research. J. Dent. Res. 2015, 94, 107S–109S. [Google Scholar] [CrossRef] [PubMed]
Figure 1.
Flow chart of the article selection process. JDR = Journal of Dental Research, CR = Caries Research, CDOE = Community Dentistry and Oral Epidemiology, JD = Journal of Dentistry and AOS = Acta Odontologica Scandinavica.
Figure 1.
Flow chart of the article selection process. JDR = Journal of Dental Research, CR = Caries Research, CDOE = Community Dentistry and Oral Epidemiology, JD = Journal of Dentistry and AOS = Acta Odontologica Scandinavica.

Figure 2.
Percentage of articles with complete description of statistical procedures in dental articles published in 2010 (n = 200) and 2017 (n = 200) by the journals. AOS = Acta Odontologica Scandinavica, JD = Journal of Dentistry, CR = Caries Research, JDR = Journal of Dental Research and CDOE = Community Dentistry and Oral Epidemiology.

Figure 3.
Box plot graph of the statistical intensity in dental articles published in 2010 (n = 200) and 2017 (n = 200) subdivided by the journals.
Figure 3.
Box plot graph of the statistical intensity in dental articles published in 2010 (n = 200) and 2017 (n = 200) subdivided by the journals.

Figure 4.
Box plot graph of the statistical intensity in dental articles published in 2010 (n = 200) and 2017 (n = 200) subdivided by the study designs.
Figure 4.
Box plot graph of the statistical intensity in dental articles published in 2010 (n = 200) and 2017 (n = 200) subdivided by the study designs.


Table 1.
Basic statistical methods used in dental research by research goal and type of outcome variable.
Table 1.
Basic statistical methods used in dental research by research goal and type of outcome variable.
| Procedure | Purpose |
|---|---|
| Statistical tables | To report categorical distributions, cross-tabulations, statistics measuring central tendencies, dispersion and correlation |
| Statistical illustrations | To illustrate distributions, includes bar diagrams, histograms, 100% bars, graphs showing means (and standard deviations) in bars or line charts, scatter plots, charts showing time series data, survival curves, box plots, flow charts |
| Comparison of frequencies | To analyse categorical response variables |
| - Chi-square test | To compare a response variable between independent groups |
| - McNemar’s test | To compare a response variable in before/after study designs |
| Comparison of means | To analyse an outcome or response variable with normal distribution |
| - two-sample t-test | To compare responses between two independent groups |
| - analysis of variance | To compare responses between more than two groups |
| - repeated measures t-test | To compare responses in before/after study designs |
| - analysis of variance with repeated measures | To compare responses and analyse changes in repeated measurements |
| Non-parametric tests | To analyse a quantitative response variable with skewed distribution or several outliers and extreme values |
| - Mann-Whitney test | To compare responses between two independent groups |
| - Kruskal-Wallis test | To compare responses between more than two groups |
| - Wilcoxon signed-rank test | To compare responses in before/after study designs |
| Quantifying association between two variables | Statistics for measuring correlations between two or more quantitative variables, includes Pearson product-moment correlation and non-parametric Spearman’s correlation, and cross-tabulation with chi-square test, risk ratio or odds ratio statistics for categorical variables |
| Regression models | Explaining variation with several explanatory variables |
| - Linear regression | To analyse variation of a continuous quantitative outcome with symmetric distribution |
| - Negative binomial regression | To analyse variation of an outcome variable with counts |
| - Logistic regression | To analyse variation of a categorical outcome |
| - Cox proportional hazard regression | To analyse variation of a time-to event outcome variable |
Table 2.
Distribution of study design and sample size of the evaluated dental articles by the publication year.
Table 2.
Distribution of study design and sample size of the evaluated dental articles by the publication year.
| 2010 n (%) | 2017 n (%) | All n (%) | |
|---|---|---|---|
| Study design | |||
| Observational studies | 77 (38.5) | 108 (54.0) | 185 (46.3) |
| Experimental studies | 48 (23.5) | 23 (11.5) | 71 (17.7) |
| Reliability | 18 (9.0) | 9 (4.5) | 27 (6.8) |
| Laboratory works | 52 (26.0) | 53 (26.5) | 105 (26.2) |
| Other | 5 (2.5) | 7 (3.5) | 12 (3.0) |
| Sample size | |||
| <30 | 50 (25.0) | 41 (20.5) | 91 (22.8) |
| 30–99 | 48(24.0) | 47 (23.5) | 95 (23.8) |
| 100–300 | 36 (18.0) | 30 (15.0) | 66 (16.5) |
| >300 | 49 (24.5) | 66 (33.0) | 115 (28.7) |
| Missing | 17 (8.5) | 16 (8.0) | 33 (8.3) |
| Total number of articles | 200 | 200 | 400 |
p-value p = 0.001 for study design and p = 0.412 for sample size by the chi-square test.
Table 3.
Frequency of statistical procedures in five dental journals published in 2010 (n = 200) and 2017 (n = 200).
Table 3.
Frequency of statistical procedures in five dental journals published in 2010 (n = 200) and 2017 (n = 200).
| Methods Group | 2010 n (%) | 2017 n (%) | All n (%) | p-Value of Chi-Square Test |
|---|---|---|---|---|
| Comparing groups | 135 (67.5) | 128 (64.0) | 263 (65.7) | 0.527 |
| Repeated measurements | 34 (17.0) | 34 (17.0) | 68 (17.0) | >0.999 |
| Correlation coefficient methods | 50 (25.0) | 35 (17.5) | 85 (21.3) | 0.087 |
| Regression models | 63 (31.5) | 60 (30.0) | 123 (30.8) | 0.828 |
| Other multivariable methods | 11 (5.5) | 8 (4.0) | 19 (4.8) | 0.639 |
| Intra-cluster correlation methods | 21 (10.5) | 25 (12.5) | 46 (11.5) | 0.639 |
| Measures of agreement | 44 (22.0) | 34 (17.0) | 78 (19.5) | 0.256 |
| Meta-analysis | 0 | 10 (5.0) | 10 (2.5) | 0.002 |
| Statistical genetics | 4 (2.0) | 10 (5.0) | 14 (3.5) | 0.172 |
| GAM or spline functions | 2 (1.0) | 3 (1.5) | 5 (1.3) | >0.999 |
| Bayesian methods | 0 | 3 (1.5) | 3 (0.8) | 0.248 |
| ANN or machine learning | 0 | 0 | 0 | na |
Data are presented as n (%), GAM = Generalized additive models, ANN = Artificial neural networks, na = not applicable.
© 2020 by the authors. Licensee MDPI, Basel, Switzerland. This article is an open access article distributed under the terms and conditions of the Creative Commons Attribution (CC BY) license (http://creativecommons.org/licenses/by/4.0/).
Share and Cite
MDPI and ACS Style
Nieminen, P.; Vähänikkilä, H. Use of Data Analysis Methods in Dental Publications: Is There Evidence of a Methodological Change? Publications 2020, 8, 9. https://doi.org/10.3390/publications8010009
AMA Style
Nieminen P, Vähänikkilä H. Use of Data Analysis Methods in Dental Publications: Is There Evidence of a Methodological Change? Publications. 2020; 8(1):9. https://doi.org/10.3390/publications8010009
Chicago/Turabian StyleNieminen, Pentti, and Hannu Vähänikkilä. 2020. "Use of Data Analysis Methods in Dental Publications: Is There Evidence of a Methodological Change?" Publications 8, no. 1: 9. https://doi.org/10.3390/publications8010009
Note that from the first issue of 2016, this journal uses article numbers instead of page numbers. See further details here.