
Identification and Characterization of Malolactic Bacteria Isolated from the Eastern Foothills of Helan Mountain in China


1
School of Agriculture, Ningxia University, Yinchuan 750021, China
2
School of Food and Wine, Ningxia University, Yinchuan 750021, China
3
Engineering Research Center of Grape and Wine, Ministry of Education, Yinchuan 750021, China
*
Author to whom correspondence should be addressed.
Foods 2022, 11(16), 2455; https://doi.org/10.3390/foods11162455
Submission received: 21 June 2022
/
Revised: 11 August 2022
/
Accepted: 12 August 2022
/
Published: 15 August 2022
(This article belongs to the Special Issue Advances in Wine Flavor Chemistry and Its Metabolic Mechanism)
Abstract
:Malolactic fermentation (MLF) converts malic acid into lactic acid by lactic acid bacteria (LAB). MLF may affect potential wine quality impact as global warming intensifies, and the alcohol in the wine increases, which threatens MLF. Lactiplantibacillus plantarum is considered a new generation of MLF starter because of the ability of high ethanol tolerance and good enological characteristics. In this research, 132 LAB strains were isolated from the eastern foothills of Helan Mountain in Ningxia, China. Twenty-one higher ethanol tolerance isolates were obtained by 15% (v/v) ethanol preliminary screening. They were identified by 16S rRNA sequencing and differentiated by randomly amplified polymorphic DNA (RAPD). Stress factors include ethanol, pH, and SO2, and the combination of stresses was used to screen stress-tolerance strains. β-D-glucosidase activity, MLF performance, and biogenic amine content were tested to evaluate the enological characteristics. GC-MS detected the volatile components of the wine after MLF. The results showed that twenty strains were identified as L. plantarum, and one strain was Lentilactobacillus hilgardii. Especially, the strains of A7, A18, A23, A50, and B28 showed strong resistance to high ethanol, low pH, and high SO2. A7, A50, and B28 showed better β-D-glucosidase activity and thus were inoculated into cabernet sauvignon wines whose ethanol content was 14.75% (v/v) to proceed MLF. A7 finished MLF in 36 d, while the control strains Oenococcus oeni 31-DH and L. plantarum BV-S2 finished MLF in 24 d and 28 d, respectively. Nevertheless, A50 and B28 did not finish MLF in 36 d. The data showed that A7 brought a more volatile aroma than control. Notably, the esters and terpenes in the wine increased. These results demonstrated the potential applicability of L. plantarum A7 as a new MLF starter culture, especially for high-ethanol wines.
1. Introduction
Malolactic fermentation (MLF) plays a vital role in winemaking [1,2,3]. It is completed by a kind of malolactic bacteria (MLB) that can metabolize L-malic acid to L-lactic acid. MLF can be started by MLB, which, from the surface of the grape, it is not always successful [4]. This is due to wine’s poor and complex habitat conditions (high ethanol, low pH, high SO2). It results in the inhibition or even inactivation of wild LAB, thus affecting the progress of MLF. Based on the highly genetic polymorphisms and mutants of Oenococcus oeni, the starter of commercial MLB is mostly O. oeni [5]. Usually, O. oeni is the dominant flora in wine at the beginning of spontaneous MLF. However, due to the influence of climate change, the ethanol of wines is getting higher and higher. O. oeni strains cannot survive well in high-ethanol wines, which make the start and finish of MLF become more and more difficult. More and more research found that Lactiplantibacillus plantarum can strongly tolerate high ethanol [6,7,8]. Therefore, isolating and screening some potential L. plantarum strains have great significance for the wine industry.
L.plantarum is a common MLB in wines. For its good fermentation and safety characteristics, L. plantarum is widely used in food fermentation [5,9,10,11]. L. plantarum has good resistance to environment stress, such as salt, acid, and ethanol stress [12]. L. plantarum may survive in wine environments with up to 17% (v/v) ethanol, and it has numerous benefits to MLF and wines compared with O. oeni, including fewer nutritional needs and faster growth rate and bacteriocin metabolism [6,7,13,14,15]. It helps improve wine color and is an anti-browning agent for wine [16,17]. L. plantarum is rich in various enzymes, including esterase, citrate lyase, β-glucosidase, proline aminopeptidase, and phenolic acid decarboxylase (PAD), and due to the enzyme activity, some strains alter the chemical composition of wine by metabolizing synthetic aroma precursors [18]. This brings more possibilities for MLF. Esterases can help synthesize or hydrolyze esters and can contribute to wine aroma [19]. β-Glucosidase promotes glycoside hydrolysis and enriches wine aroma substances. PAD is associated with phenolic acid formation. The presence of β-glucosidase and phenolic acid decarboxylase could allow this species to be used in the future to alter the aroma profile of wine [20]. Tannase can hydrolyze substrates to produce caffeic acid and quinic acid. It also has substances for chemical stabilization [21]. At the same time, numerous research results show that L. plantarum has certain antibacterial activities. Some organic acids and proteins produced by metabolism can act as antibacterial molecules to antagonize other harmful microorganisms [22,23,24,25]. Therefore, as a new type of MLF starter, L. plantarum has important value for MLF in winemaking.
In this research, high-ethanol-tolerant L. plantarum strains were isolated and identified. Stress tolerance, β-D glycosidase activity, enological characteristics, and the biogenic amines produce of the isolates were tested to screen potential MLF starters for high-ethanol wines.
2. Materials and Methods
2.1. Strains, Medium, and Growth Condition
LAB Strains isolated from petit verdot wines during spontaneous MLF were grown in MRS-AJ medium (20% (v/v) apple juice was added) and incubated at 28 °C for two days in a CO2 incubator.
2.2. Isolation of MLB from Wine
Next, 100 μL of wine was serially diluted and then plated to solidify. Then 132 colonies were selected and re-streaked for purification. For screening high-ethanol-tolerant strains, 107 CFU/mL of the isolates were inoculated in an MRS-AJ medium containing 15% (v/v) ethanol. The viable cell counts of twenty-one strains were higher than 107 CFU/mL and will be used for further experiments.
2.3. Identification of MLB by 16S rRNA
DNA of isolates was extracted by bacterial DNA kit (General Biotech, Shanghai, China). The amplification of 16S rRNA was followed and adjusted from the experimental design of Jin et al. [26]. The reaction was performed in a final volume of 25 µL using the following amplification mixture: 1 µL DNA template, 2 µL 10× Taq buffer, 0.8 µL of each primer, 1.6 µL dNTPs (2.5 mM), 1.6 µL Mg2+ (25 mM), and 0.1 µL DNA polymerase (5 U/µL) (TransGen Biotech, Beijing, China). Samples underwent an initial 2 min denaturation at 94 °C, followed by 30 cycles of 45 s at 94 °C, 2 min at 66 °C, and 2 min at 72 °C, with the final extension of 10 min at 72 °C. The sequencing results were compared with the known sequences in the NCBI database using the nucleotide local alignment BLAST tool (BLAST, http://www.ncbi.nlm.nih.gov/BLAST (accessed on 15 June 2022)).
2.4. RAPD Analysis
The identified L. plantarum and control strains (O. oeni 31-DH and Bactoferm ®Vege-Start 2.0 CN Commercial L. plantarum, short for BV-S2) were differentiated by randomly amplified polymorphic DNA (RAPD). The primers M13 (5′-GAGGGTGGCGGTTCT-3′) and M14 (5′-GAGGGTGGGGCCGTT-3′) were used to amplify the RAPD. The reaction was performed in a final volume of 25 µL using the following amplification mixture: 5 µL DNA template, 2.5 µL 10× Taq buffer, 1.5 µL primer, 0.5 µL dNTPs (2.5 mM), 3 µL Mg2+ (25 mM), and 0.3 µL DNA polymerase (5 U/µL) (TransGen Biotech, Beijing, China). Samples underwent an initial 3 min denaturation at 94 °C, followed by 35 cycles of 1 min at 94 °C, 1 min at 48 °C, and 2 min at 72 °C, with the final extension of 10 min at 72 °C. PCR products were resolved by electrophoresis in 1.0% (v/v) agarose gels. The bands of isolated strains were analyzed and compared. Data were reported in a binary format with “1” for the presence of a band and “0” for its absence. For clustering, fragments were analyzed with NTSYS 2.10e software using the Dice similarity coefficient based on the presence/absence of the bands and clustered by the unweighted pair group method with arithmetic mean (UPGMA).
2.5. Stress Tolerance of L. plantarum
The isolates were inoculated at 107 CFU/mL in MRS-AJ medium separately supplemented with 13% (v/v), 15% (v/v), and 17% (v/v) ethanol. Anaerobic incubation was carried out at 28 °C for two days. Cell viability was studied by plate counting on MRS agar plates.
The isolates were inoculated at 107 CFU/mL in MRS-AJ medium separately supplemented with pH 3.0, 3.2, and 3.4. Anaerobic incubation was carried out at 28 °C for two days. Cell viability was studied by plate counting on MRS agar plates.
The isolates were inoculated about 107 CFU/mL in MRS-AJ medium separately supplemented with 20 (mg/L), 40 (mg/L), and 60 (mg/L) SO2. Anaerobic incubation was carried out at 28 °C for two days. Cell viability was studied by plate counting on MRS agar plates.
The isolates were screened by a combination of factors (ethanol × SO2 × pH). A total of nine treatments that include ethanol (11%, 13%, 15% (v/v)), pH (3.2, 3.4, 3.6), and SO2 (20 mg/L, 30 mg/L, 40 mg/L) were set to test the comprehensive tolerance of the isolates. The orthogonal experiment is shown in Table 1, following the computing method of Xia et al. [27].
δXm represents the difference between average value under the X factor and average value of all experimental results. KXm stands for the average value of the results that contain the factor X with m level. stands for the average value of all the factor X test results.
R stands for the range.
2.6. Determination of the β-D-Glucosidase Activity of L. plantarum
The experimental design of this study was followed Chen et al. [28]. The isolates were inoculated at 107 CFU/mL in an MRS-AJ medium. Anaerobic incubation was carried out at 28 °C for two days. Then, 1 mL of bacteria solution at the logarithmic phase was taken and centrifuged at 10,000× rpm for 10 min. The cells were washed twice in 0.85% NaCl solution and suspended in 0.5 mL of 0.85% NaCl solution.
Then 0.5 mL of citric acid phosphate buffer—p-NPG mixture (pH 5.0, p NPG concentration 5 mmol/L)—was added and mixed in the 0.5 mL suspension cells for reaction. Moreover, the reaction was performed at 37 °C for 1 h, and 2 mL 1000 mmol/L Na2CO3 solution was immediately added to terminate the reaction. The supernatant was centrifuged at 10,000× rpm for 15 min and transferred to another tube. The absorbance value was detected at Abs400 by the microplate reader. The standard curve was obtained by measuring Abs400 nm of p-NP solution with different concentrations (0–60 μmol/L).
2.6168 is a fixed value.
β-glucosidase activity was defined as the amounts of p-NP-producing substances per gram of thallus (dry mass) per minute/(μmol/(g·min)).
2.7. MLF Assay and Basic Chemical Parameters
Cabernet sauvignon wines without MLF were used to perform an MLF assay. After filtering by 0.22 μm filter membrane, 107 CFU/mL bacteria were inoculated in wine. The wine without MLF was used as the control. The samples were collected every four days to determine the changes of L-malic acid content.
Ethanol, pH, total sugar, hue, and chromaticity of wines before and after MLF were determined by the Chinese national standard test methods (GB/T 15038-2006, the analytical methods of wine and fruit wine). Volatile acid, titratable acid, L-malic acid, and glycerol were measured enzymatically with Analyzer Y15 (Biosystems, Food Quality, Barcelona, Spain).
2.8. Biogenic Amine
Biogenic amines were determined by the Chinese national standard test methods (GB/T 5009. 208-2016, the determination of biogenic amine in foods).
2.9. Analysis of Volatile Compounds
The volatile compounds of wines were identified using gas chromatography–mass spectrometry (HS-SPME-GC-MS) (Agilent 7890B gas chromatography in tandem with an Agilent 7000D mass spectrometer) (Agilent Technologies, Santa Clara, CA, USA) with an autosampler system (PALRSI 85) (CTC Analytics AG, Zwingen, Switzerland). The separation was performed on a DB-WAX capillary column (30 m × 0.25 mm × 0.25 μm, Agilent, USA). Next, 5 mL of wine, 1.5 g NaCl, and 10 μL 4-methyl-2-pentanol (2.01 mg/L) were taken into 20 mL headspace vial, and the headspace vial was placed in the autosampler. The fiber assembly (23 Ga, 1 cm, 50/30 μm DVB/CAR/PDMS coated) (Supelco, Sigma-Aldrich, Bellefonte, PA, USA) was aged for 10 min at 250 °C. The sample were equilibrated for 5 min at 40 °C and 400 r/min. The fiber assembly was inserted into the headspace bottle to absorb for 30 min at 40 °C and 400 r/min. Then, the fiber assembly was inserted into the GC-MS injection portal and desorbed for 10 min at 240 °C. The injection mode was splitless injection. The GC-MS temperature program was carried out according to Bai et al. [29] as follows: An initial temperature of 45 °C was maintained for 5 min and increased by 3 °C/min to 130 °C/min, followed to 144 °C at a rate of 2 °C/min, then at 5 °C/min speed to 240 °C, and held for 10 min. The MSD transfer line heater was set to 240 °C. The temperature of the ion source was 230 °C, respectively. The mass detector was operated in full scan mode (m/z 40–300) with electron ionization (EI) mode at 70 eV. Each analysis was performed in duplicate. All compounds were analyzed using the NIST 17 standard mass spectral library. 4-methyl-2-pentanol was used as an internal standard to calculate the relative content of compounds.
2.10. Statistical Analysis
All data were expressed as means ± standard deviation. Every sample being analyze three times. Statistical analyses were performed by using the software Origin 2018 (Northampton, MA, USA) and R statistical programming language (Vienna, Austria). The data of volatile compounds were extracted in the Agilent Masshunter Quantitative Analysis software.
3. Results
3.1. Isolation and Identification of Strains
Overall, 132 LAB strains were isolated from the eastern foothills of Helan Mountain in Ningxia, China. Twenty-one strains were obtained by 15% ethanol screening. Twenty-one strains were preliminarily identified as LAB based on Gram stain positivity, catalase negativity, and cultural and cellular morphology. The 16s rRNA sequences analyzed that twenty strains were L. plantarum, and one strain was Lentilactobacillus hilgardii (Table 2).
UPGMA cluster and dendrogram were obtained from the RAPD analysis of twenty-one isolates and two control strains (Figure 1). All the strains were divided into six different principal clusters. The main clusters included most of the L. plantarum strains. The L. plantarum strains were clustered in four different principal clusters at a similarity level of 0.76, while O. oeni 31-DH and A8 were clustered into a branch, respectively. Overall, the genetic diversity is rich among these L. plantarum. O. oeni 31-DH and L. hilgardii A8 reflected the reliability of the experimental method.
3.2. Stress Tolerance of L. plantarum
3.2.1. Tolerance of L. plantarum to Ethanol
Ethanol can strongly inhibit the growth of MLB and influence MLF. In this research, L. plantarum could grow well in MRS-AJ broth with 13% (v/v) and 15% (v/v) ethanol. A7, A50, B28, B44, and B51 showed good resistance to ethanol stress. When the ethanol reached 17% (v/v), the resistance of different strains to ethanol was more different. Most L. plantarum could not maintain normal growth after stress. Their tolerance to high ethanol was weak. However, A7 and B28 could still proliferate normally. The viable cell count could reach 1 × 10⁸ CFU/mL, which was different from control strains and other strains (p < 0.05). A7 and B28 had strong tolerance to high ethanol stress (Figure 2).
3.2.2. Tolerance of L. plantarum to pH
In the process of MLF, pH is an important factor affecting the MLB. pH had a significant effect on the normal growth and metabolism of the strains. Moreover, the growth of the strains decreased with the decrease in pH. There were significant differences in the viable cell counts among different strains at the same pH (p < 0.05).
When L. plantarum were cultured at pH 3.4, they could grow normally, and the cell viable count reached 6 × 10⁹ CFU/mL. When the pH decreased to 3.2, the growths of the strains were inhibited. Among them, the viable cell counts of A3, A6, A7, A45, B43, and B51 were higher than the control strains, showing better tolerance to acidity. When the pH decreased to 3.0, the viable cell counts of most strains decreased by order of magnitude. Nevertheless, it could be maintained at 1 × 10⁷ CFU/mL. They could still maintain their activity under the environment of pH 3.0 except that viable cell counts of A7 and B51 were significantly higher than those of the control strains. The performance of the other strains was similar to or worse than that of the control strains. The overall analysis showed that the strains could grow normally at pH 3.4 and 3.2. A7 and B51 could maintain their growth under the pH of 3.0. They had a better tolerance for acidity (Figure 3).
3.2.3. Tolerance of L. plantarum to SO2
Comparing the tolerance of the strains to ethanol, pH, and SO2, the growth inhibition of SO2 on strains was weaker than that of ethanol and pH. With the 20 mg/L total SO2, the viable cell counts of all strains reached 2 × 10¹⁰ CFU/mL. With the continuous increase of SO2, most strains decreased by more than 60%. When SO2 increased to 60 mg/L, A7, A50, and B28 showed strong stress tolerance, which was better than or close to the control strains (Figure 4).
3.2.4. Tolerance of L. plantarum to Recombinational Factor
MLF is usually carried out in the complex environment of wine, which contains ethanol, organic acids, SO2, amino acids, and others. These factors determine the growth and metabolism of LAB in wine. Therefore, investigating the stress tolerance of strains to the compound conditions of ethanol, pH, and SO2 is essential for screening good MLB. With the increasing stress intensity of combination of factors, the growth of strains decreased continuously. Furthermore, the growth of A7, A50, B28, and B51 with good resistance to a single factor decreased significantly. The first group of orthogonal treatment had the lowest stress, and the ninth group had the most potent stress. In the ninth group, the viable cell counts of A7, A50, B28, and B51 reached 1.0 × 10⁶ CFU/mL. They showed strong tolerance for the stress (Figure 5).
The viable cell counts of nine groups were compared by analysis of variance. There was a significant difference in the growth of the isolated strains under combination of stresses (p < 0.05) (Figure 6). Among them, the viable cell count of B28 was the highest. The average value was 3.7 × 10⁸ CFU/mL, which was significantly better than the control strains (p < 0.05). A7, A18, A23, and A50 were relatively better. The growth of other strains was slightly weaker. The primary and secondary stresses affecting the growth of A7 were ethanol > pH > SO2, and the primary and secondary stresses affecting the growth of A18, A23, A50, and B28 were ethanol > SO2 > pH (Table 3 and Table 4).
3.3. Determination of β-D-Glucosidase Activity
A7, A18, A23, A50, and B28 performed strong stress tolerance and were selected to determine the activity of β-D-glucosidase (Figure 7). The unit of enzyme activity was expressed as μmol/(g·min). All five strains had good β-D-glucosidase activity. A7 had the highest enzyme activity: 5.33 ± 0.05 μmol/(g·min). It was significantly higher than that of the control.
3.4. MLF Assay and Basic Chemical Parameters
3.4.1. MLF Assay of Cabernet Sauvignon Wines
Malic acid conversion rate is an important index to evaluate the MLF ability of MLB. L-malic acid was monitored during MLF in cabernet sauvignon wines (Figure 8a). During the MLF process, the L-malic acid concentration fell dramatically with time. Following eight days of inoculation, the L-malic acid concentration in wines fermented by five strains reduced to around 1.4–1.5 g/L. On the 12th day, the L-malic acid concentration in wines fermented with A7, A50, and B28 fell to around 0.6 g/L. Simultaneously, the L-malic acid concentration in wines fermented by O. oeni 31-DH and L. plantarum BV-S2 fell to around 0.3–0.47 g/L. After 24 days, O. oeni 31-DH L-malic acid decreased to less than 0.1 g/L. O. oeni 31-DH finished the MLF first. Secondly, on the 28th day, L. plantarum BV-S2 finished fermentation. The L-malic acid of A7, A50, and B28 also decreased continuously, and the L-malic acid of A7 decreased to 0.15 g/L on the 32nd day, which showed good fermentation ability. The L-malic acid of A50 and B28 decreased to about 0.4 g/L on the 28th day and remained unchanged, indicating that the strains also had a specific acid-reducing ability.
A7, A50, B28, and the controls were inoculated at about 107 CFU/mL. The cell in the wines during MLF was detected (Figure 8b). After the inoculation, the cell of the strains showed a downward trend. Moreover, the downward trend was the same. Perhaps the wine environment inhibited the growth of strains. When strains adapted to the environment, the number of strains gradually stabilized. On the eighth day, the viable cell counts began to increase. After the 12th day, the viable cell counts of A7, A50, and B28 began to decline gradually. After 20 days of inoculation, the viable cell counts of O. oeni 31-DH and L. plantarum BV-S2 began to increase. Then the viable cell counts began to decrease from the 28th day. Finally, A7, A50, and B28 remained stable at 104 CFU/mL. L. plantarum BV-S2 and O. oeni 31-DH were maintained at 105 CFU/mL and 106 CFU/mL, respectively.
3.4.2. Analysis of Basic Chemical Parameters of Wine
Glycerol content did not change significantly before and after MLF. Ethanol contents were between 14.71% (v/v) and 14.81% (v/v). After the MLF, the titratable acid of the wines decreased. The lowest titratable acid of O. oeni 31-DH was 6.19 g/L. The pH of the wine increased with the decrease of the titratable acid. The pH of A7 (pH = 3.68), A50 (pH = 3.66) and B28 (pH = 3.67) were significantly different from those before MLF. Although volatile acid content increased after MLF, it was lower than the international limit standard. At the same time, MLF affects the color and hue of the wine and can improve its quality. The L-lactic acid in the wine without MLF was 0.08 g/L. After MLF, the L-lactic acid of A7, A50, and B28 was 1.38 g/L, 1.14 g/L, and 1.20 g/L, respectively. Thus, it can be seen that all the strains can metabolize L-malic acid to L-lactic acid. In addition, the total sugar decreased by 0.1–0.5 g/L, respectively, after fermentation. The strains consumed the total sugar in the wine to provide energy for its growth and metabolism (Table 5).
3.4.3. Biogenic Amine Analysis
The formation of biogenic amines is closely related to the metabolism of LAB. Hence, the biogenic amines were evaluated (Table 6). The content is lower than the international limit standard. There was no significant difference in tryptamine and β-phenethylamine tyramine between A7, A50, B28, and control strains after MLF (p < 0.05). The productions of A7 of tryptamine, cadaverine, tyramine, and histamine were higher than that in the control strains, and the other two strains were lower than that in the control strains. This may be because the cell counts were always lower than the control strains after inoculation, and amino acid decarboxylase activity was strongly inhibited. Alternatively, the strains lack amino acid decarboxylase-related genes.
3.4.4. Aroma Components Analysis before and after MLF
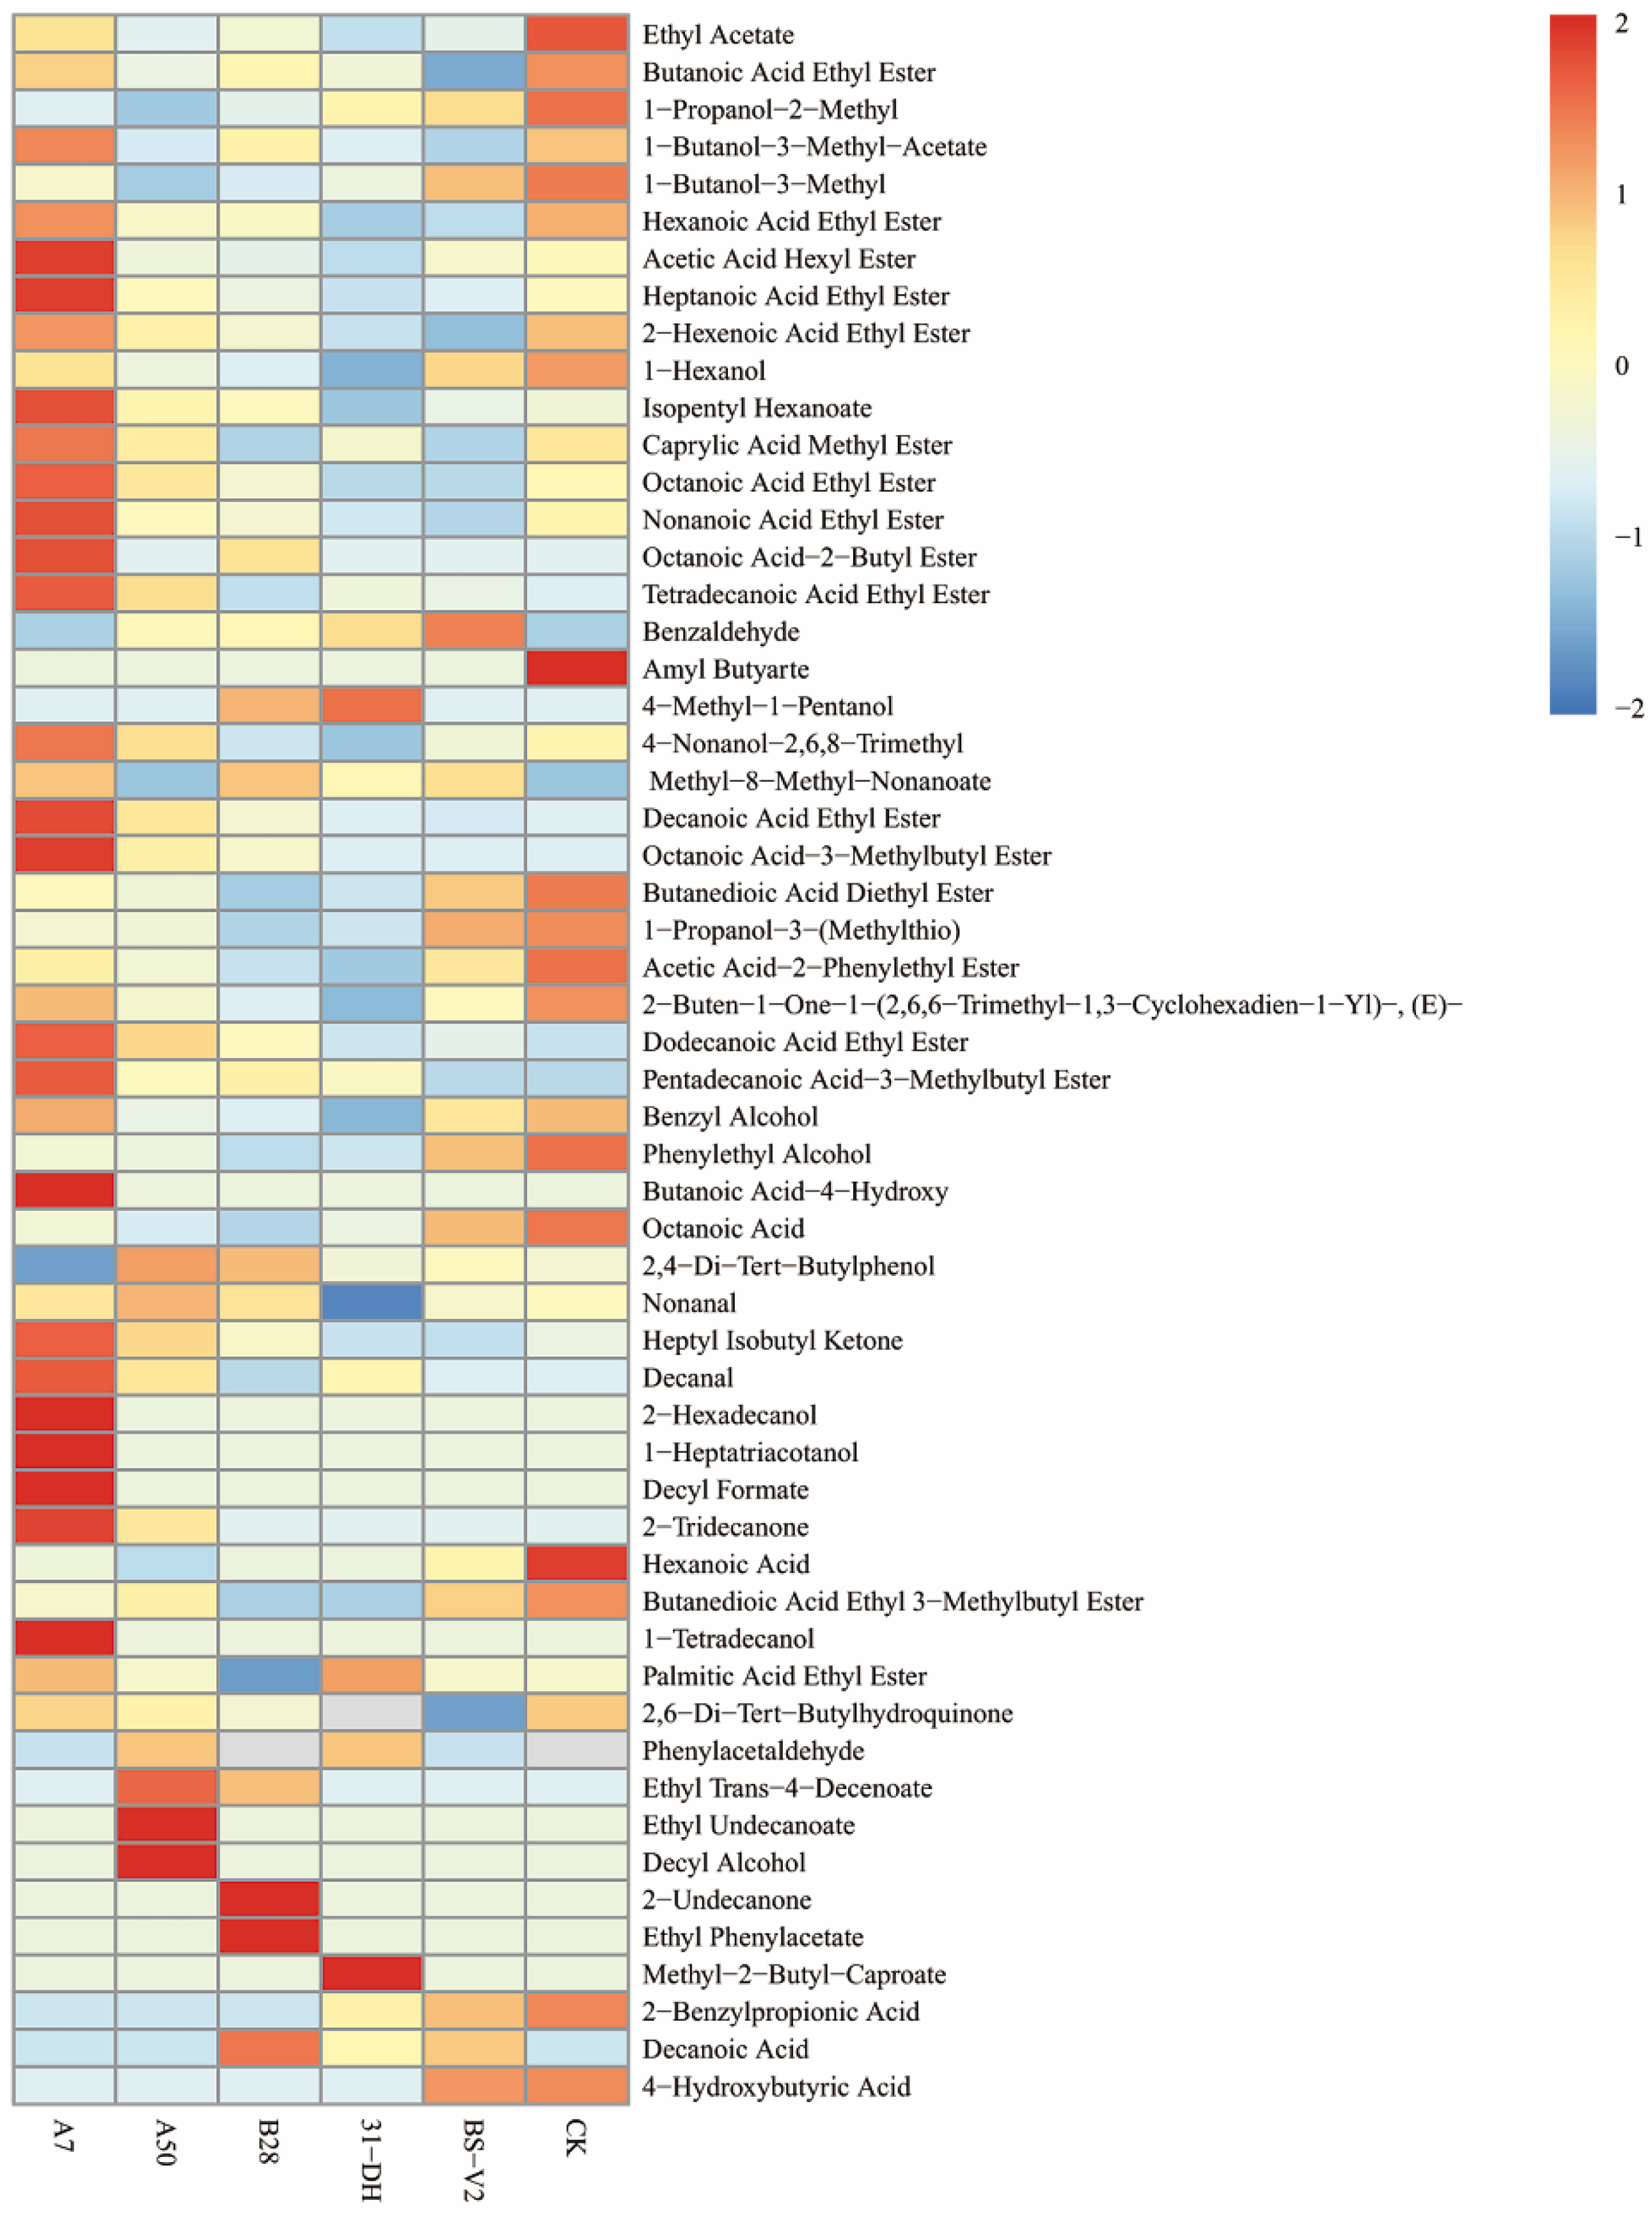
A total of 27 volatile aroma compounds were detected in non-MLF control wine, and the total amount of volatile aroma compounds was 200 mg/L (Table S1). After MLF, 47 different volatile aroma compounds were detected in different fermented wines, including 29 esters, 8 alcohols, 4 organic acids, 1 terpene, 5 aldehydes, and ketones. The types and contents of volatile aroma compounds in wines increased significantly after MLF.
Compared with O. oeni 31-DH, A7, A50, and B28 added nine, eight, and seven kinds of volatile aroma compounds, respectively. Compared with L. plantarum BV-S2, A7, A50, and B28 added ten, nine, and seven kinds of volatile aroma compounds, respectively. These volatile aroma compounds were mainly esters. A7 had the most volatile aroma compounds, and the total amount could reach 314.07 mg/L. The volatile aroma compounds of A50 and B28 can reach 244.39 mg/L and 244.12 mg/L (Table S1). A7 increased the content of esters and terpenes. These volatile aroma compounds together constitute the complex aroma of wine (Figure 9).
4. Discussion
Twenty strains of L. plantarum isolated from petit verdot wines were analyzed by RAPD. It was found that the genomic DNA of the isolated strains was polymorphic. The L. plantarum was divided into four clusters, and each category had a different number of branches. The diversity of L. plantarum in the same producing area brings more possibilities for MLF. After combination of factors stress on twenty strains of L. plantarum, it was found that there were significant differences in stress tolerance among L. plantarum isolated from the same producing area. Among them, A7, A18, A23, A50, and B28 grew better and could survive under low acid and high ethanol. Some studies have suggested that the growth limit of L. plantarum is pH 3.5, and the ethanol is 8% (v/v) [30,31]. However, some studies hold other views, saying that L. plantarum cannot only survive in the 13% ethanol but also at pH between 3.2 and 3.5 [8,11]. However, it was found that the growth of some L. plantarum isolated from the Yinchuan region could be maintained at 106 CFU/mL under pH 3.4 and 15% ethanol, which was different from the above results. However, it can be proved that L. plantarum has good ethanol tolerance. The strains showed strong tolerance to high ethanol and good tolerance to pH, SO2, and combination of stresses.
Volatile compounds perceptible to the human senses are not detectable in the glycosides that form in wine. Therefore, glycosidase has a major influence on the sensory characteristics of wine [32]. L. plantarum is considered to be a new generation of new starter because of its richer enzymatic properties and is gradually used in MLF [33]. Brizuela et al. [2] and Lerm et al. [19] used PCR to amplify genes to prove that β-glucosidase exists in most of L. plantarum. Although the existence of this gene does not guarantee the expression in the process of MLF, it can be used as a standard for screening strains and a basis for aroma changes. The environment in wine is complex, while ethanol, acid, and temperature will all affect the enzyme activity [13]. Spano et al. [34] analyzed gene expression under several abiotic stresses, indicating that enzyme activity was significantly regulated by stress. At the same time, the enzyme activity of β-glucosidase is strain-dependent. Not all strains contain this enzyme, and there are differences in enzyme activity [35]. Therefore, screening strains with higher enzymatic activity for MLF has an important impact on aroma characteristics.
All the strains could start MLF typically after being inoculated into the wine. Compared with the wine without MLF, it showed that the MLF of each strain played a role in reducing acid. According to the degradation of malic acid and the change of viable bacteria, it was found that the time of O. oeni 31-DH and L. plantarum BV-S2 were shorter, and the viable cell counts were higher during MLF. Although the fermentation rate of A7 is slow, it can be finished eventually. However, the MLF could not be finished for A50 and B28. Bravo-Ferrada et al. [36] inoculated L. plantarum preadapted in MLO medium into the simulated wine containing 4.5 g/L malic acid. Malic acid consumption increased by 21%~43%. Malolactic enzyme (mle) is a key enzyme in MLF process. Miller et al. [37] proposed that mle expression was also affected by malic acid content, pH, and ethanol. Different strains show different enzyme profiles. In different environments, the expression levels of mle for each strain are also different. Therefore, the rate of acid reduction is affected by many factors. Preconditioning culture and enzyme activity are the key factors affecting malic acid consumption.
In part, the time required for MLF is determined by the recovery time of the viable cell counts. Diez-Ozaeta et al. [38] found that all strains showed a significant decrease in activity or death in the first few days after starting MLF. Nevertheless, it will return to the original count after the first week. In this study, the viable cell counts of all strains dropped throughout eight days. After 12 days, the viable cell counts of A7, A50, and B28 declined to vary degrees. O. oeni 31-DH and L. plantarum BV-S2 are relatively stable. A7, A50, and B28 decrease and then increase, but MLF can be continued. Genetic differences can explain the differences in acid reduction among strains isolated from the same region. Being able to survive in 17% ethanol does not necessarily help finish MLF. When changing from the nutrient-rich environment to the nutrient-poor environment, and with too many factors affecting growth, the strains will face many difficulties that threaten their growth.
The inhibitory effects of polyphenols in wine on the growth of LAB and the existence of yeast secondary metabolites lead to the incompatibility between yeast and LAB [2]. In comparison, A7 has the potential to become an excellent MLB. López et al. [39] isolated 204 strains from red wine in the Rioja region, of which 98.5% were O. oeni. Ruiz et al. [40,41] isolated strains from wines of different years and fermentation stages in different wineries in Spain. Moreover, it identified that O. oeni was the dominant strain. The proportion of other strains was between 2% and 10%. Beneduce et al. [42] isolated and identified 150 strains from wines from the Apulia region, most of which were L. plantarum. Due to grape variety, wine pH, ethanol, and other factors, the selection of MLB strains becomes more diverse. O. oeni is no longer the single choice in the process of MLF. The tolerance of L. plantarum to ethanol and its more enzymatic properties make it dominant in the future enology process.
Compared with the aroma composition and content of non-MLF wine, it was found that the composition and content of esters in all wines increased after MLF. Compared with the control strains, the number and content of esters produced by A7, A50, and B28 were relatively higher. Especially A7 had high content in ethyl acetate, isoamyl acetate, ethyl caproate, hexyl acetate, ethyl heptanoate, ethyl trans-2-hexenoate, isoamyl caproate, methyl octanoate, ethyl octanoate, ethyl nonanoate, and isobutyl octanoate. Giving the wine some pleasant aroma, such as fruit, flower, and honey, is essential. Although the total amount of wine alcohols decreased to 78.17 mg/L, 71.31 mg/L, and 73.70 mg/L (Table S1) after MLF, the difference was insignificant compared to control strains. The differences were mainly concentrated in less harmful aromas such as isoamyl alcohol (almond taste, astringent taste) and 3-methylthiopropanol (garlic flavor, raw potato flavor).
Moreover, increase the variety of flower aroma composition. Together with esters and other volatile aroma substances, it enriches wine and reduces undesirable aroma. Compared with control strains, A7 contains benzaldehyde, nonanal, phenylacetaldehyde, 2,4-di-tert-butylphenol and other substances closely related to wine fermentation metabolism was the highest. These substances contribute to the balance of wine taste and the improvement of sensory quality. The variation in aroma content and variety is partly due to β-D glucosidase. Some studies have found that L. plantarum is one of the primary sources of β-D glucosidase in oenology [32]. An essential role of β-glucosidase in oenology process is to promote the production of aromatic compounds in wine, thus affecting the aroma and taste of wine [43].
Furthermore, β-glucosidase also changes the composition of phenols in wine by hydrolyzing compounds [44]. A7, A50, and B28 had specific β-D glycosidase activity. It could be seen from the phylogenetic clustering tree that they were all in different branches, which made it possible for MLF to produce more diverse aroma components. In addition to β-glucosidase, it also includes esterase, phenolic acid decarboxylase, citrate lyase, and other enzymes that may affect the flavor of wine and participate in the color improvement of wine [10,11,12,13,14,32,45].
5. Conclusions
In this research, 132 strains were identified by molecular identification and tolerance analysis. Three potential strains were selected for enological characteristics analysis. The results showed that the L-malic acid of strain A7 decreased to about 0.1 g/L after 36 days of start-up fermentation. Compared with the control strains, it showed good MLF ability. Compared with the control strains, the variety and content of volatile aroma compounds of strain A7 were richer. Especially the contents of esters and terpenes in wines were significantly increased, which endowed the wines with unique aroma characteristics such as fruit and floral aroma. Therefore, A7 could perform well in wine habitat and potentially be the new MLF starter.
Supplementary Materials
The following supporting information can be downloaded at: https://www.mdpi.com/article/10.3390/foods11162455/s1, Table S1: Types and contents of volatile compounds in wine samples.
Author Contributions
Conceptualization, G.J. and W.M.; methodology and software, J.S. and Y.G.; validation, X.G. and R.L.; formal analysis, J.S. and Y.G.; investigation, resources and data curation, J.S. and Y.G.; writing—original draft preparation, J.S.; writing—review and editing, G.J. and W.M.; visualization, J.S.; supervision G.J. and W.M.; project administration, G.J.; funding acquisition, G.J. All authors have read and agreed to the published version of the manuscript.
Funding
This research was funded by the National Natural Science Foundation of China (No. 32160578) and Ningxia Hui Autonomous Region Key Research and Development Program (No. 2022BDE03011).
Institutional Review Board Statement
Not applicable.
Informed Consent Statement
Not applicable.
Data Availability Statement
Data are contained within the article or supplementary material.
Acknowledgments
The authors gratefully acknowledge the financial supports by the National Natural Science Foundation of China (No. 32160578) and Ningxia Hui Autonomous Region Key Research and Development Program (No. 2022BDE03011).
Conflicts of Interest
The authors declare no conflict of interest.
References
- Brizuela, N.; Bravo-Ferrada, B.R.; Pozo-Bayón, A.; Maria; Semorile, L.; Tymczyszyn, E. Changes in the volatile profile of Pinot noir wines caused by Patagonian Lactobacillus plantarum and Oenococcus oeni strains. Food Res. Int. 2018, 106, 22–28. [Google Scholar] [CrossRef] [PubMed]
- Brizuela, N.; Bravo-Ferrada, B.R.; Hens, D.; Hollmann, A.; Delfederico, L.; Caballero, A.; Tymczyszyn, E.; Semorile, L. Comparative vinification assays with selected Patagonian strains of Oenococcus oeni and Lactobacillus plantarum. LWT 2016, 77, 348–355. [Google Scholar] [CrossRef]
- Cappello, M.S.; Zapparoli, G.; Logrieco, A.; Bartowsky, E.J. Linking wine lactic acid bacteria diversity with wine aroma and flavour. Int. J. Food Microbiol. 2017, 243, 16–27. [Google Scholar] [CrossRef]
- Genisheva, Z.; Mussatto, S.I.; Oliveira, J.M.; Teixeira, J.A. Malolactic fermentation of wines with immobilised lactic acid bacteria—Influence of concentration, type of support material and storage conditions. Food Chem. 2013, 138, 1510–1514. [Google Scholar] [CrossRef]
- Ribéreau-Gayon, P.; Dubourdieu, D.; Doneche, B.; Lonvaud-Funel, A. Handbook of Enology: The Microbiology of Wine and Vinifications, 2nd ed.; Wiley and Sons: Chichester, UK; New York, NY, USA, 2006; p. 325. [Google Scholar]
- Bravo-Ferrada, B.R.; Hollmann, A.; Delfederico, L.; Valdés La Hens, D.; Caballero, A.; Semorile, L. Patagonian red wines: Selection of Lactobacillus plantarum isolates as potential starter cultures for malolactic fermentation. World J. Microbiol. Biotechnol. 2013, 29, 1537–1549. [Google Scholar] [CrossRef]
- Liu, S.Q. Malolactic fermentation in wine—Beyond deacidification. J. Appl. Microbiol. 2010, 92, 589–601. [Google Scholar] [CrossRef]
- Iorizzo, M.; Testa, B.; Lombardi, S.J.; García-Ruiz, A.; Muñoz-González, C.; Bartolomé, B.; Moreno-Arribas, M.V.; Silvia Jane Lombardi, S.G. Selection and technological potential of Lactobacillus plantarum bacteria suitable for wine malolactic fermentation and grape aroma release. LWT 2016, 73, 557–566. [Google Scholar] [CrossRef]
- Behera, S.S.; Ray, R.C.; Nevijo, Z. Lactobacillus plantarum with Functional Properties: An Approach to Increase Safety and Shelf-Life of Fermented Foods. Biomed Res. Int. 2018, 2018, 9361614. [Google Scholar] [CrossRef]
- Felis, G.E.; Dellaglio, F. Taxonomy of Lactobacilli and Bifidobacteria. Curr. Issues Intest. Microbiol. 2007, 8, 44–61. [Google Scholar]
- Dicks, L.; Endo, A. Taxonomic Status of Lactic Acid Bacteria in Wine and Key Characteristics to Differentiate Species. S. Afr. J. Enol. Vitic. 2008, 30, 72–90. [Google Scholar] [CrossRef]
- Kumara, M.; Dhillonb, S.; Singhala, A.; Sooda, A.; Ghosh, D.M.; Ganguli, A. Cell surface and stress tolerance properties of a newly isolated Lactobacillus plantarum Ch1. Acta Mater. 2011, 40, 38–44. [Google Scholar] [CrossRef]
- Toit, M.; Engelbrecht, L.; Lerm, E.; Krieger-Weber, S. Lactobacillus: The Next Generation of Malolactic Fermentation Starter Cultures-an Overview. Food Bioproc. Tech. 2011, 4, 876–906. [Google Scholar] [CrossRef]
- Grimaldi, A.; Bartowsky, E.J.; Jiranek, V. Screening of Lactobacillus spp. and Pediococcus spp. for glycosidase activities that are important in oenology. J. Appl. Microbiol. 2010, 99, 1061–1069. [Google Scholar] [CrossRef] [PubMed]
- Grimaldi, A.; Bartowsky, E.; Jiranek, V. A survey of glycosidase activities of commercial wine strains of Oenococcus oeni. Int. J. Food Microbiol. 2005, 105, 233–244. [Google Scholar] [CrossRef] [PubMed]
- Wang, S.; Li, S.; Zhao, H.; Gu, P.; Chen, Y.; Zhang, B.; Zhu, B. Acetaldehyde released by Lactobacillus plantarum enhances accumulation of pyranoanthocyanins in wine during malolactic fermentation. Food Res. Int. 2018, 108, 254–263. [Google Scholar] [CrossRef]
- Curiel, J.A.; Muñoz, R.; de Felipe, F.L. Delaying Effect of a Wine Lactobacillus plantarum Strain on the Coloration and Xanthylium Pigment Formation Occurring in (+)-Catechin and (−)-Epicatechin Wine Model Solutions. J. Agric. Food Chem. 2010, 58, 11318–11324. [Google Scholar] [CrossRef] [PubMed]
- Mtshali, P.S.; Divol, B.; Van Rensburg, P.; Du Toit, M. Genetic screening of wine-related enzymes in Lactobacillus species isolated from South African wines. J. Appl. Microbiol. 2010, 108, 1389–1397. [Google Scholar] [CrossRef] [PubMed]
- Costello, P.J.; Siebert, T.E.; Solomon, M.R.; Bartowsky, E.J. Synthesis of fruity ethyl esters by acyl coenzyme A: Alcohol acyltransferase and reverse esterase activities in Oenococcus oeni and Lactobacillus plantarum. J. Appl. Microbiol. 2013, 114, 797–806. [Google Scholar] [CrossRef] [PubMed]
- Lerm, E.; Engelbrecht, L.; Du Toit, M. Selection and Characterisation of Oenococcus oeni and Lactobacillus plantarum South African Wine Isolates for Use as Malolactic Fermentation Starter Cultures. S. Afr. J. Enol. Vitic. 2011, 32, 280–295. [Google Scholar] [CrossRef]
- Vaquero, I.; Marcobal, Á.; Muñoz, R. Tannase activity by lactic acid bacteria isolated from grape must and wine. Int. J. Food Microbiol. 2004, 96, 199–204. [Google Scholar] [CrossRef] [PubMed]
- Vataščinová, T.; Pipová, M.; Fraqueza, M.J.R.; Mala, P.; Dudriková, E.; Drážovská, M.; Lauková, A. Short communication: Antimicrobial potential of Lactobacillus plantarum strains isolated from Slovak raw sheep milk cheeses. J. Dairy Sci. 2020, 103, 6900–6903. [Google Scholar] [CrossRef]
- Seddik, H.A.; Bendali, F.; Gancel, F.; Fliss, I.; Spano, G.; Drider, D. Lactobacillus plantarum and Its Probiotic and Food Potentialities. Probiotics Antimicrob. Proteins 2017, 9, 111–122. [Google Scholar] [CrossRef] [PubMed]
- Chen, O.; Hong, Y.; Ma, J.; Deng, L.; Yi, L.; Zeng, K. Screening lactic acid bacteria from pickle and cured meat as biocontrol agents of Penicillium digitatum on citrus fruit. Biol. Control 2021, 158, 104606. [Google Scholar] [CrossRef]
- Fayol-Messaoudi, D.; Coconnier-Polter, M.-H.; Moal, V.L.-L.; Atassi, F.; Berger, C.N.; Servin, A.L. The Lactobacillus plantarum strain ACA-DC287 isolated from a Greek cheese demonstrates antagonistic activity in vitro and in vivo against Salmonella enterica serovar Typhimurium. J. Appl. Microbiol. 2007, 103, 657–665. [Google Scholar] [CrossRef]
- Jin, G.; Jiranek, V.; Hayes, A.M.; Grbin, P.R. Isolation and Characterization of High-Ethanol-Tolerance Lactic Acid Bacteria from Australian Wine. Foods 2022, 11, 1231. [Google Scholar] [CrossRef]
- Xia, S.; Lin, R.; Cui, X.; Shan, J. The application of orthogonal test method in the parameters optimization of PEMFC under steady working condition. Int. J. Hydrog. Energy 2016, 41, 11380–11390. [Google Scholar] [CrossRef]
- Chen, Q.; Ren, X.; Wang, L.; Tian, Y.; Zhao, M.; Song, Z.; Liu, S. Correlation between β-Glycosidase Activity and Acid Stress Tolerance in Oenococcus oeni. Food Sci. 2017, 38, 115–120. (In Chinese) [Google Scholar]
- Bai, X.; Jin, G.; Liu, S.; Ma, W.; Zhang, Z.; Wang, H.; Zang, J. Malolactic Fermentation Characteristics of Lactobacillus hilgardii Q19 at Low Temperature and Its Effect on Aroma Components in Wine. Food Sci. 2020, 41, 146–152. (In Chinese) [Google Scholar]
- Berbegal, C.; Peña, N.; Russo, P.; Grieco, F.; Pardo, I.; Ferrer, S.; Spano, G.; Capozzi, V. Technological properties of Lactobacillus plantarum strains isolated from grape must fermentation. Food Microbiol. 2016, 57, 187–194. [Google Scholar] [CrossRef] [PubMed]
- Succi, M.; Pannella, G.; Tremonte, P.; Tipaldi, L.; Coppola, R.; Iorizzo, M.; Lombardi, S.J.; Sorrentino, E. Sub-optimal pH Preadaptation Improves the Survival of Lactobacillus plantarum Strains and the Malic Acid Consumption in Wine-Like Medium. Food Microbiol. 2017, 8, 470. [Google Scholar] [CrossRef] [PubMed]
- Matthews, A.; Grimaldi, A.; Walker, M.; Bartowsky, E.; Grbin, P.; Jiranek, V. Lactic Acid Bacteria as a Potential Source of Enzymes for Use in Vinification. Appl. Environ. Microbiol. 2004, 70, 5715–5731. [Google Scholar] [CrossRef] [PubMed]
- Bartowsky, E.J.; Costello, P.J.; Chambers, P.J. Emerging trends in the application of malolactic fermentation. Aust. J. Grape Wine Res. 2015, 21, 663–669. [Google Scholar] [CrossRef]
- Spano, G.; Rinaldi, A.; Ugliano, M.; Moio, L.; Beneduce, L.; Massa, S. A β-glucosidase gene isolated from wine Lactobacillus plantarum is regulated by abiotic stresses. J. Appl. Microbiol. 2005, 98, 855–861. [Google Scholar] [CrossRef]
- Renchinkhand, G.; Park, Y.W.; Cho, S.-H.; Song, G.-Y.; Bae, H.C.; Choi, S.-J.; Nam, M.S. Identification of β-Glucosidase Activity of Lactobacillus plantarum CRNB22 in Kimchi and Its Potential to Convert Ginsenoside Rb1 from Panax Ginseng. J. Food Biochem. 2015, 39, 155–163. [Google Scholar] [CrossRef]
- Bravo-Ferrada, B.M.; Hollmann, A.; Brizuela, N.; La Hens, D.V.; Tymczyszyn, E.; Semorile, L. Growth and consumption of l-malic acid in wine-like medium by acclimated and non-acclimated cultures of Patagonian Oenococcus oeni strains. Folia Microbiol. 2016, 61, 365–373. [Google Scholar] [CrossRef] [PubMed]
- Miller, B.J.; Franz, C.M.A.P.; Cho, G.S.; Du Toit, M. Expression of the Malolactic Enzyme Gene (mle) from Lactobacillus plantarum Under Winemaking Conditions. Curr. Microbiol. 2011, 62, 1682–1688. [Google Scholar] [CrossRef]
- Diez-Ozaeta, I.; Lavilla, M.; Amárita, F. Wine aroma profile modification by Oenococcus oeni strains from Rioja Alavesa region: Selection of potential malolactic starters—ScienceDirect. Int. J. Food Microbiol. 2021, 356, 109324. [Google Scholar] [CrossRef]
- López, I.; Tenorio, C.; Zarazaga, M.; Dizy, M.; Torres, C.; Ruiz-Larrea, F. Evidence of mixed wild populations of Oenococcus oeni strains during wine spontaneous malolactic fermentations. Eur. Food Res. Technol. 2007, 226, 215–223. [Google Scholar] [CrossRef]
- Ruiz, P.; Izquierdo, P.M.; Seseña, S.; Palop, M.L. Intraspecific genetic diversity of lactic acid bacteria from malolactic fermentation of Cencibel wines as derived from combined analysis of RAPD-PCR and PFGE patterns. Food Microbiol. 2008, 25, 942–948. [Google Scholar] [CrossRef]
- Ruiz, P.; Izquierdo, P.M.; Seseña, S.; Palop, M.L. Analysis of lactic acid bacteria populations during spontaneous malolactic fermentation of Tempranillo wines at five wineries during two consecutive vintages. Food Control 2010, 21, 70–75. [Google Scholar] [CrossRef]
- Beneduce, L.; Spano, G.; Vernile, A.; Tarantino, D.; Massa, S. Molecular characterization of lactic acid populations associated with wine spoilage. J. Basic Microbiol. 2004, 44, 10–16. [Google Scholar] [CrossRef] [PubMed]
- Liang, Z.; Fang, Z.; Pai, A.; Luo, J.; Gan, R.; Gao, Y.; Lu, J.; Zhang, P. Glycosidically bound aroma precursors in fruits: A comprehensive review. Crit. Rev. Food Sci. Nutr. 2020, 62, 215–243. [Google Scholar] [CrossRef] [PubMed]
- Todaro, A.; Palmeri, R.; Barbagallo, R.N.; Pifferi, P.G.; Spagna, G. Increase of trans-resveratrol in typical Sicilian wine using β-Glucosidase from various sources. Food Chem. 2008, 107, 1570–1575. [Google Scholar] [CrossRef]
- Pozo-Bayón, M.A.; G-Alegría, E.; Polo, M.C.; Tenorio, C.; Martín-Alvarez, P.J.; Calvo de la Banda, M.T.; Ruiz-Larrea, F.; Moreno-Arribas, M.V. Wine Volatile and Amino Acid Composition after Malolactic Fermentation: Effect of Oenococcus oeni and Lactobacillus plantarum Starter Cultures. J. Agric. Food Chem. 2005, 53, 8729–8735. [Google Scholar] [CrossRef]
Figure 1.
UPGMA dendrogram of twenty-one strains constructed by using RAPD.
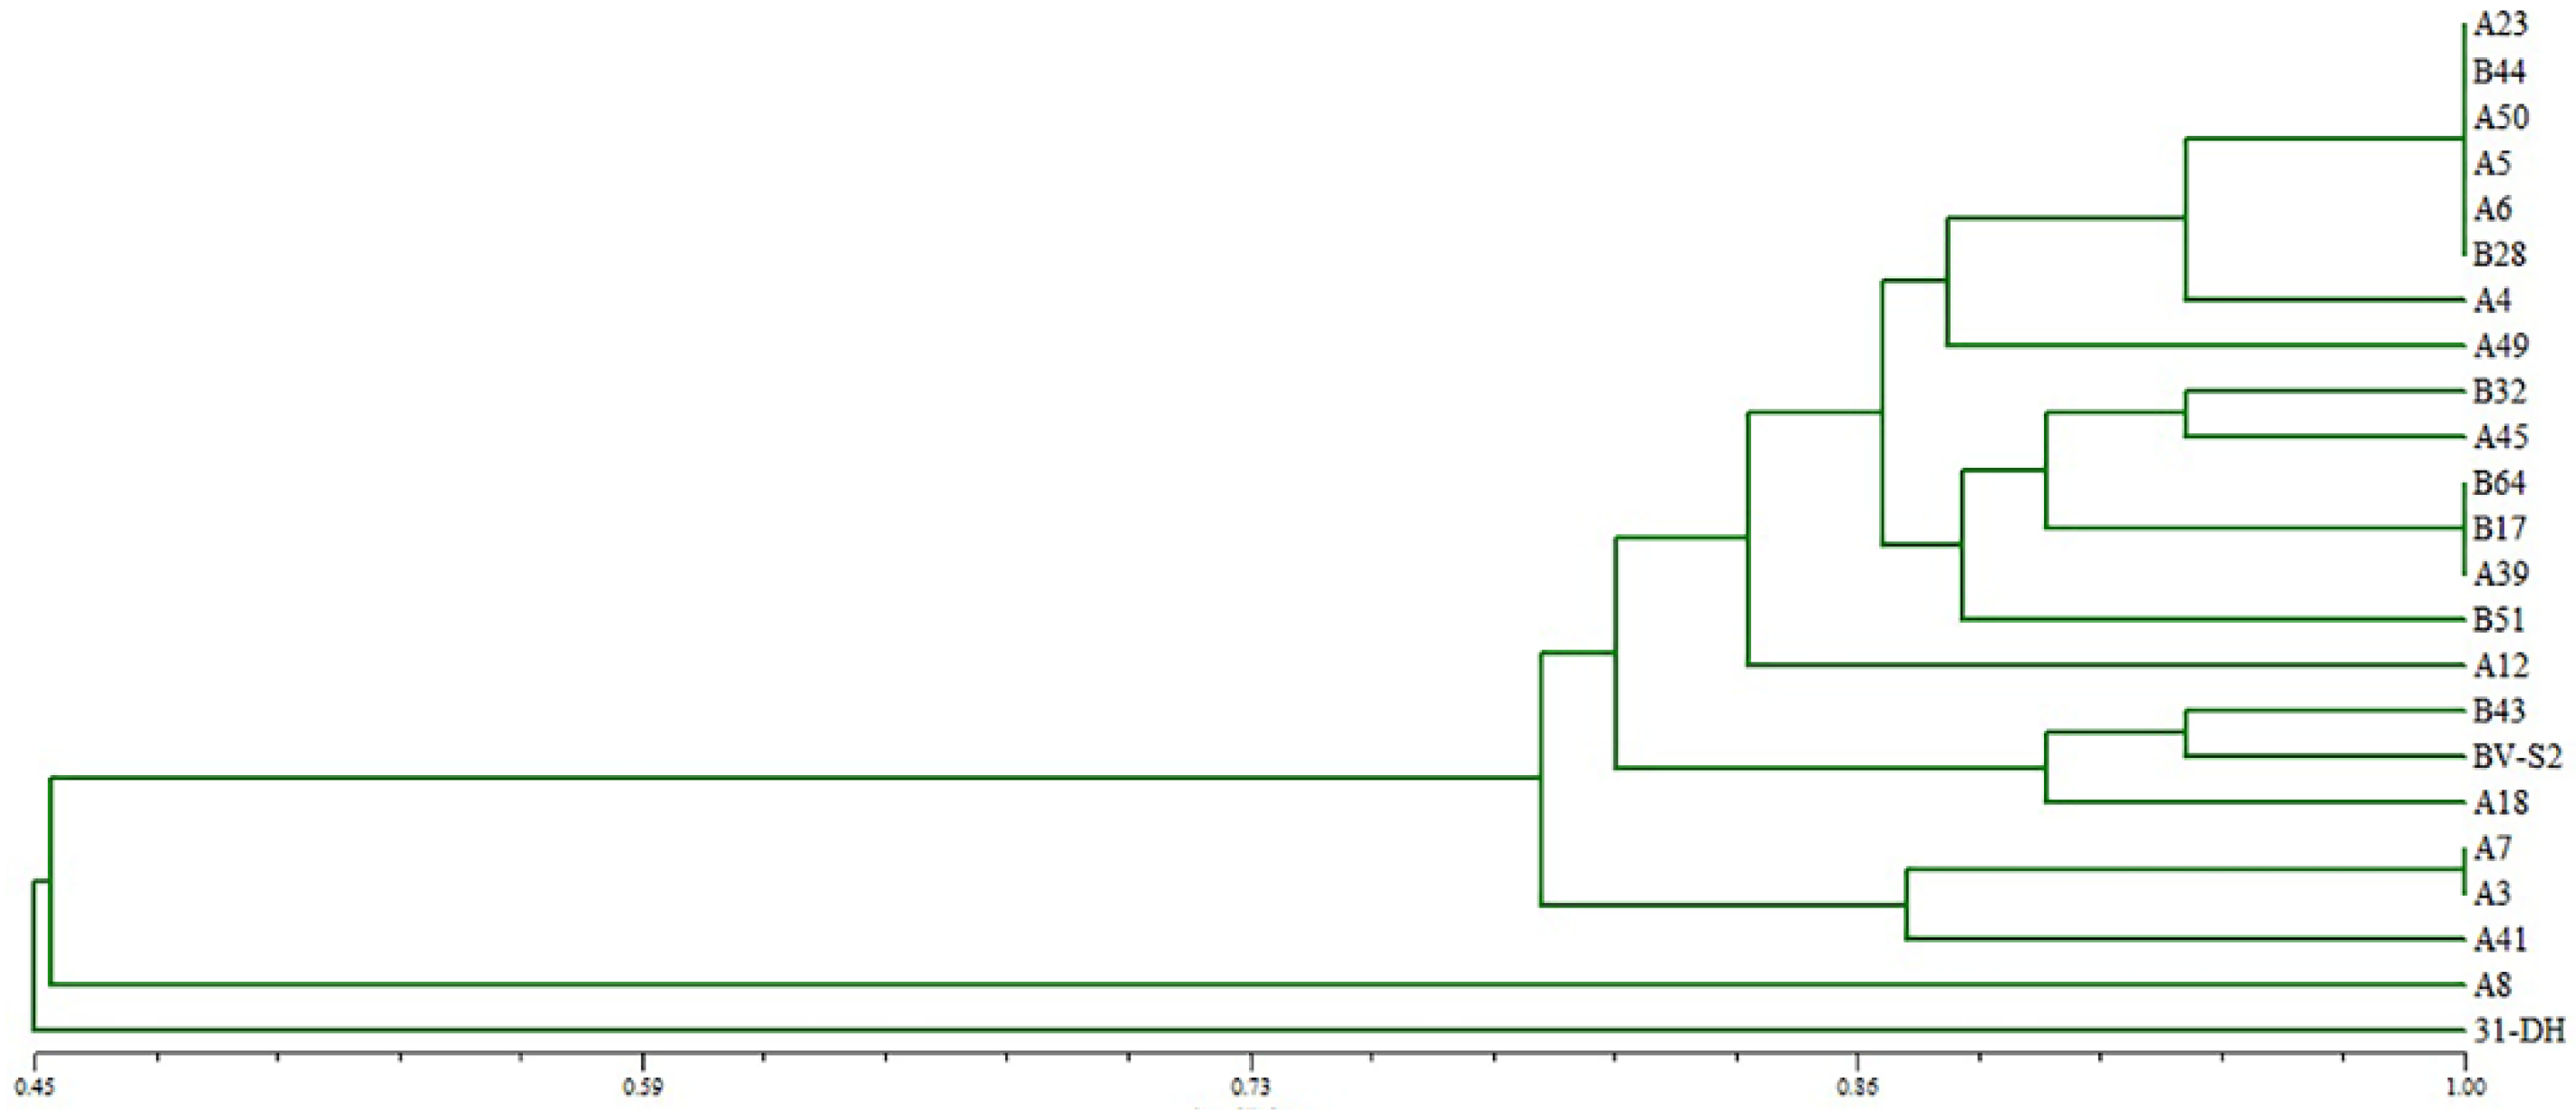
Figure 2.
Growth of twenty L. plantarum and control strains in MRS-AJ, which contained 13, 15, and 17% (v/v) ethanol, respectively. Different small letters indicate significant differences according to the LSD Fisher test (p < 0.05).
Figure 2.
Growth of twenty L. plantarum and control strains in MRS-AJ, which contained 13, 15, and 17% (v/v) ethanol, respectively. Different small letters indicate significant differences according to the LSD Fisher test (p < 0.05).
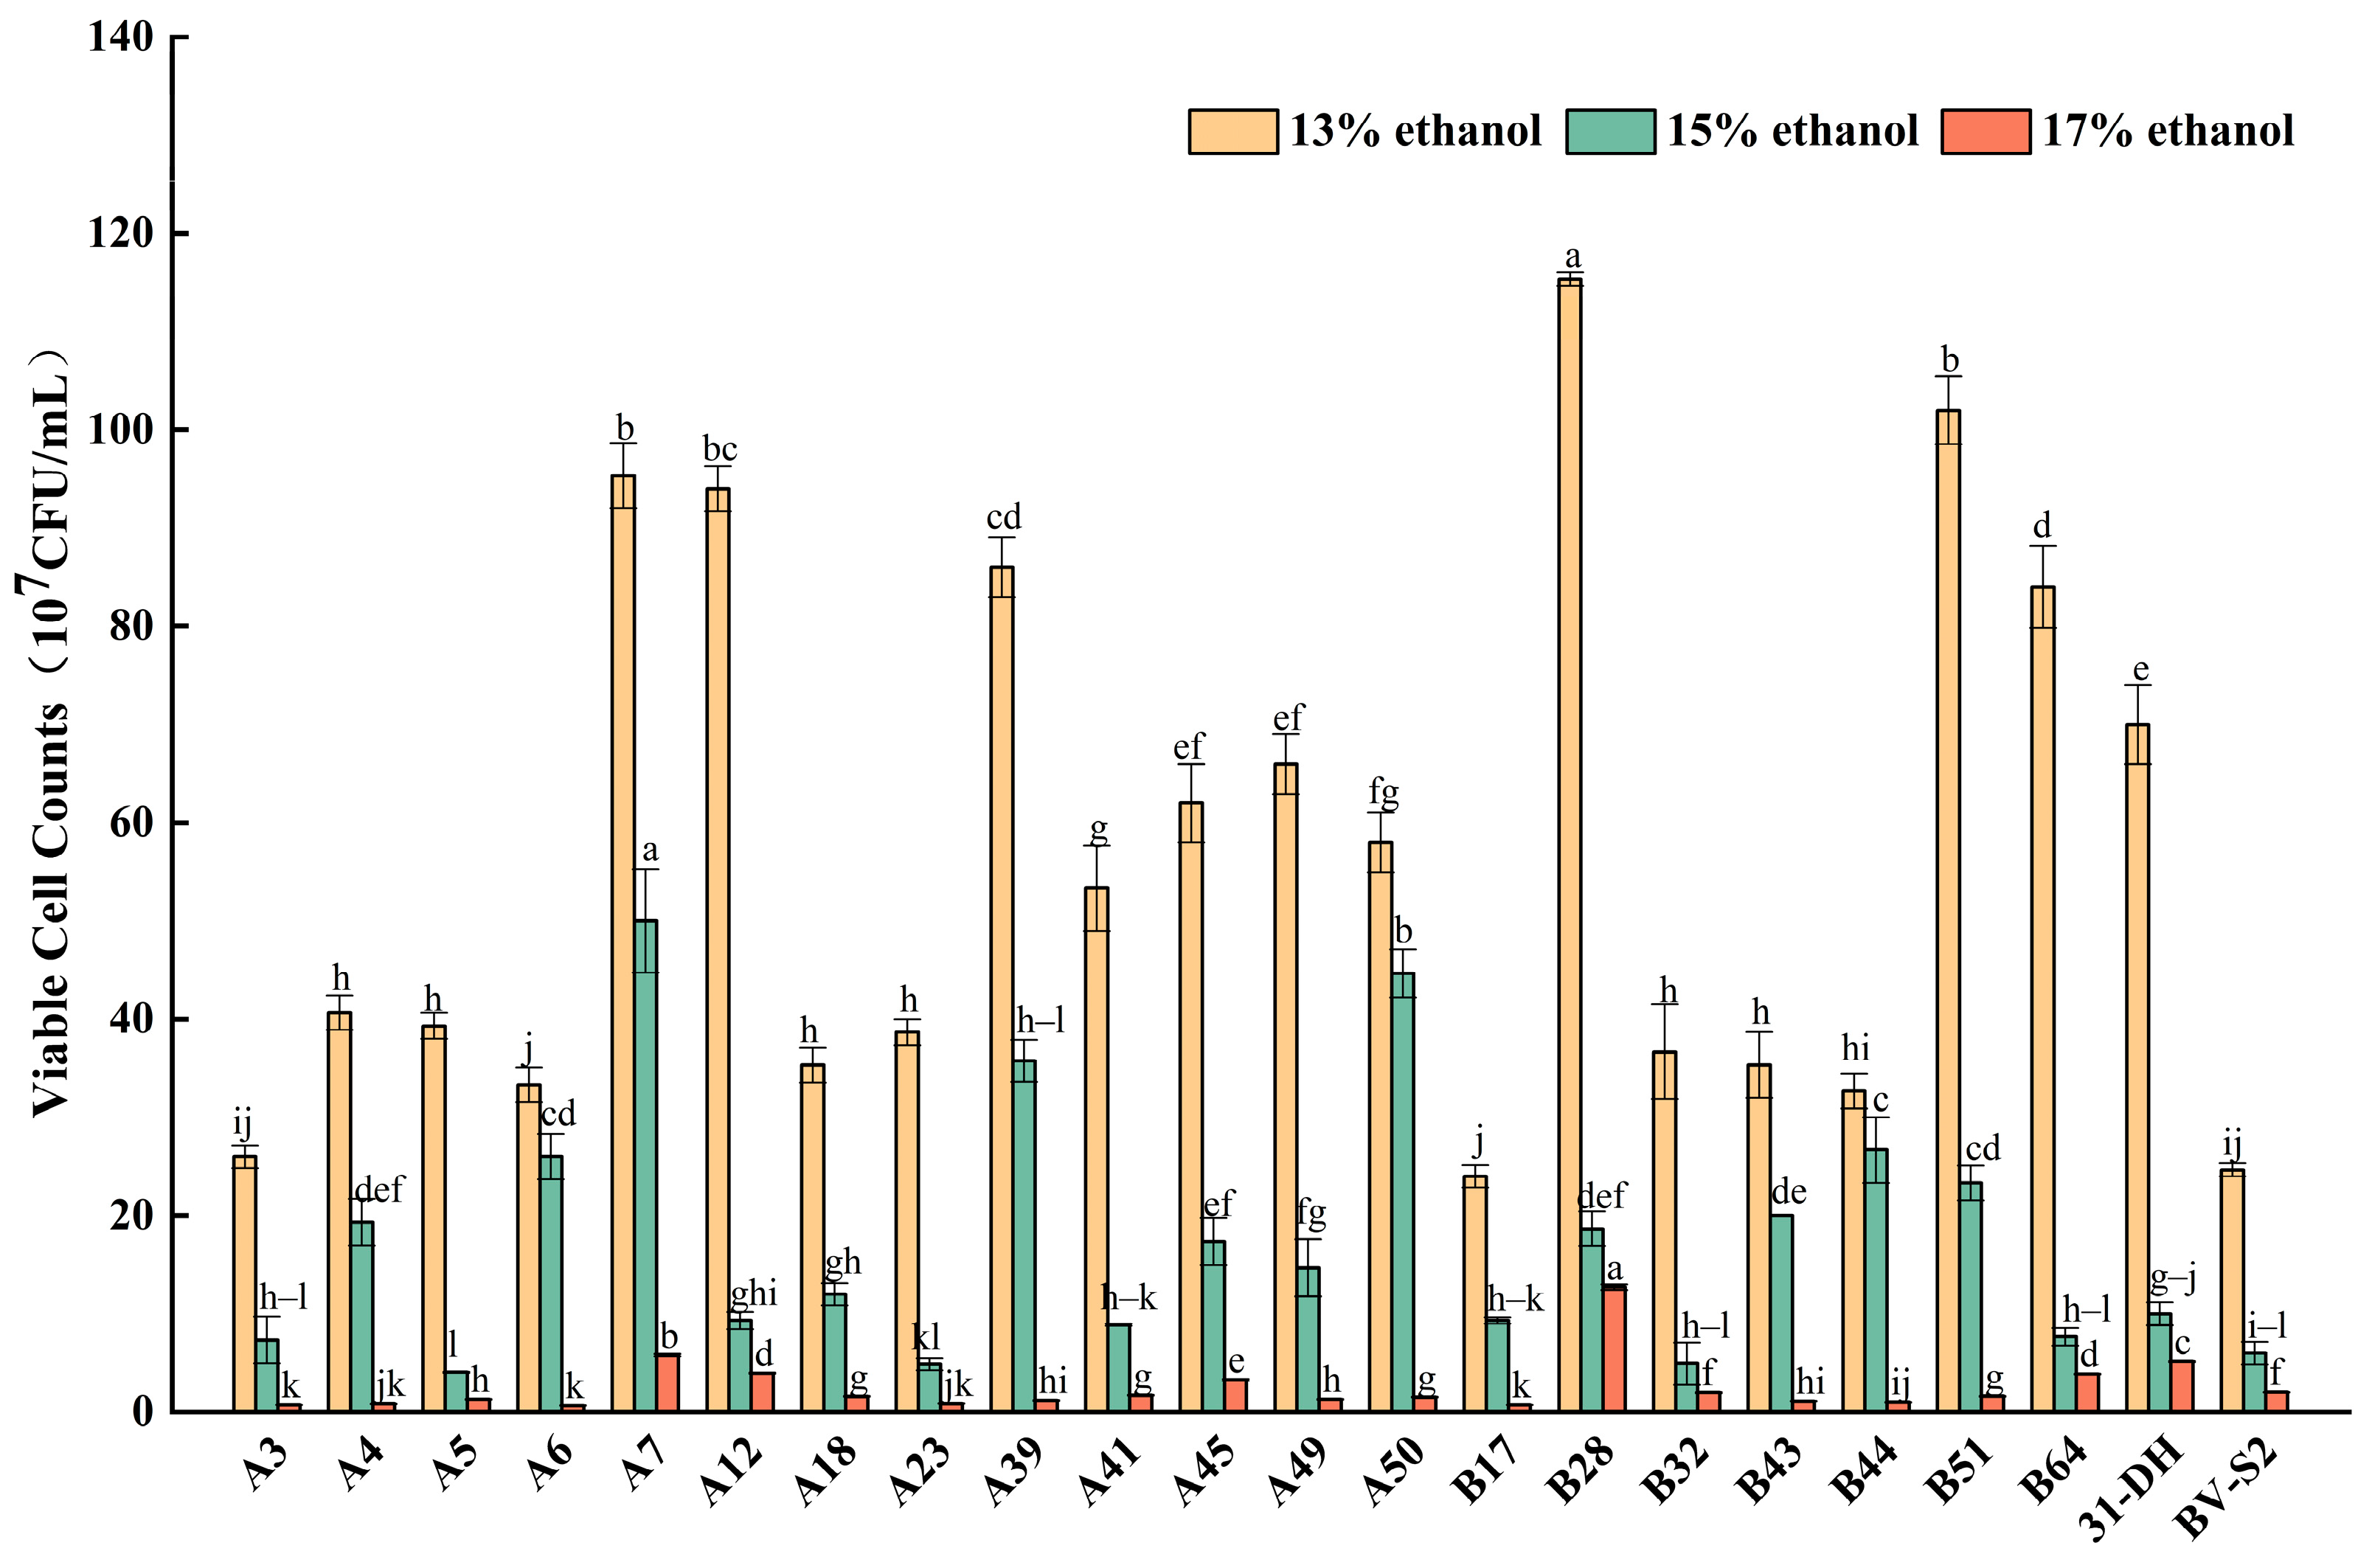
Figure 3.
Growth of twenty L. plantarum and control strains in MRS-AJ, which contained pH3.4, 3.2, and 3.0, respectively. Different small letters indicate significant differences according to the LSD Fisher test (p < 0.05).
Figure 3.
Growth of twenty L. plantarum and control strains in MRS-AJ, which contained pH3.4, 3.2, and 3.0, respectively. Different small letters indicate significant differences according to the LSD Fisher test (p < 0.05).
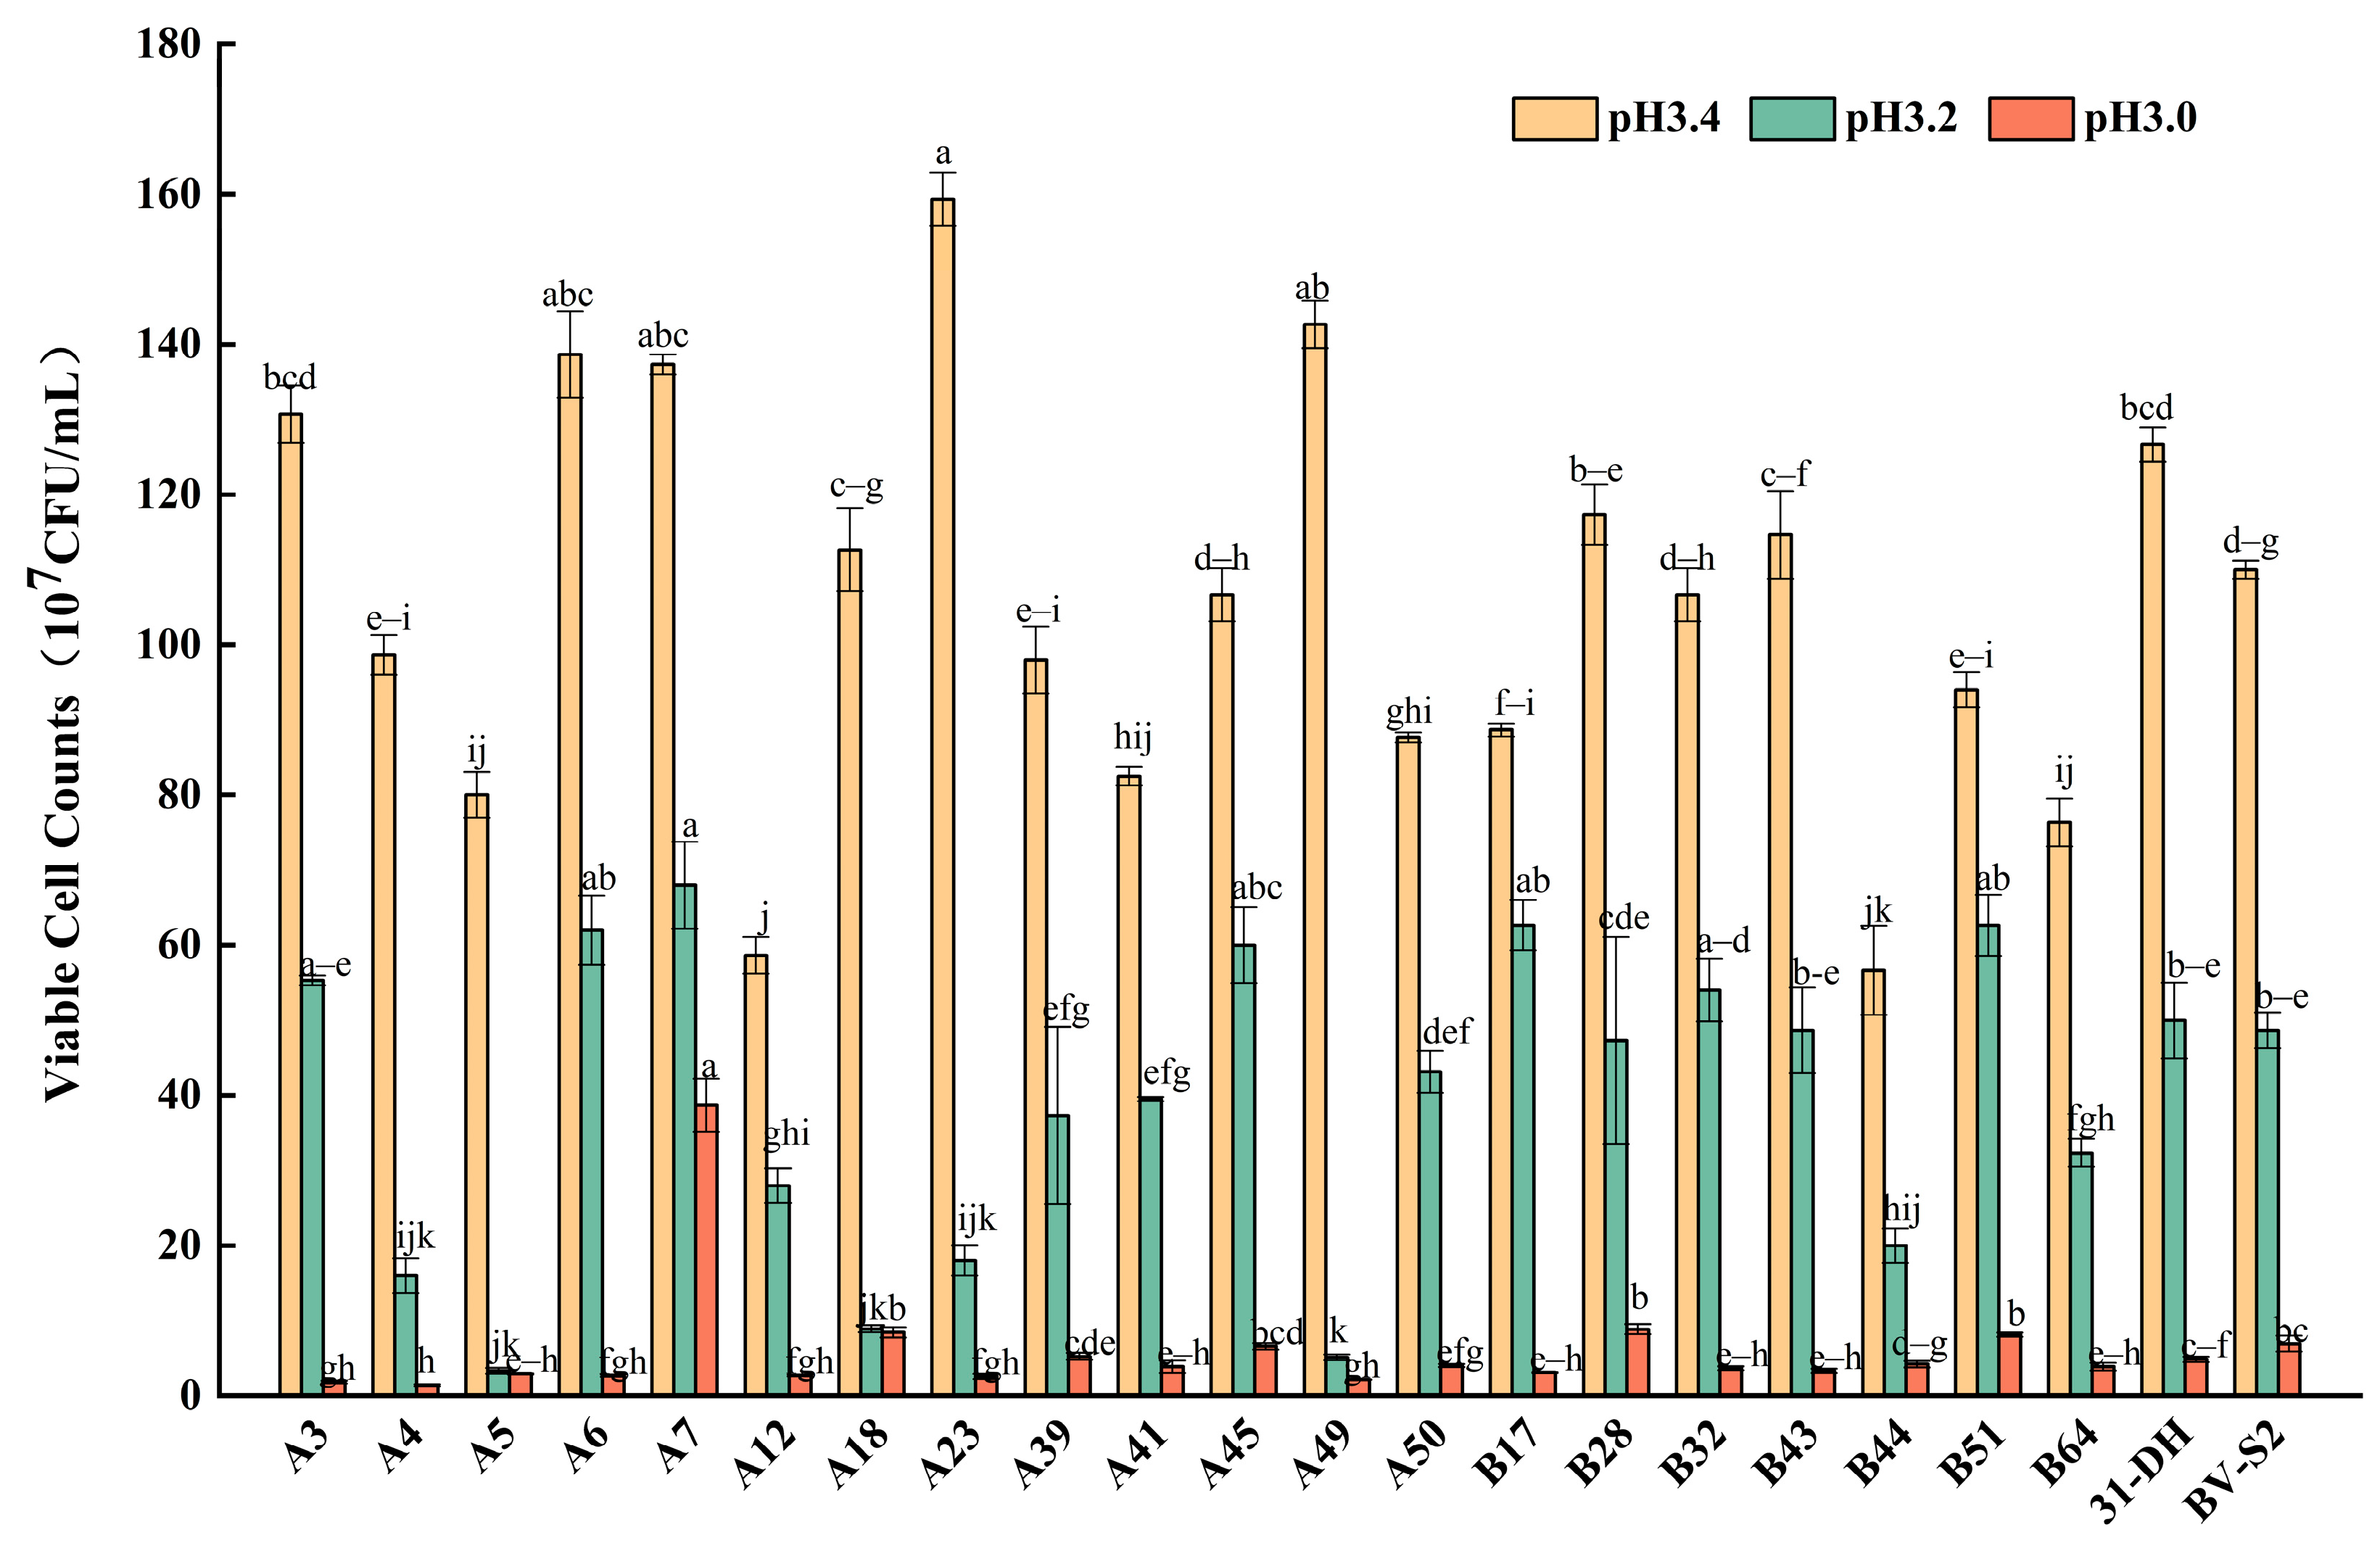
Figure 4.
Growth of twenty L. plantarum and control strains in MRS-AJ, which contained 20, 40, and 60 mg/L SO2, respectively. Different small letters indicate significant differences according to the LSD Fisher test (p < 0.05).
Figure 4.
Growth of twenty L. plantarum and control strains in MRS-AJ, which contained 20, 40, and 60 mg/L SO2, respectively. Different small letters indicate significant differences according to the LSD Fisher test (p < 0.05).
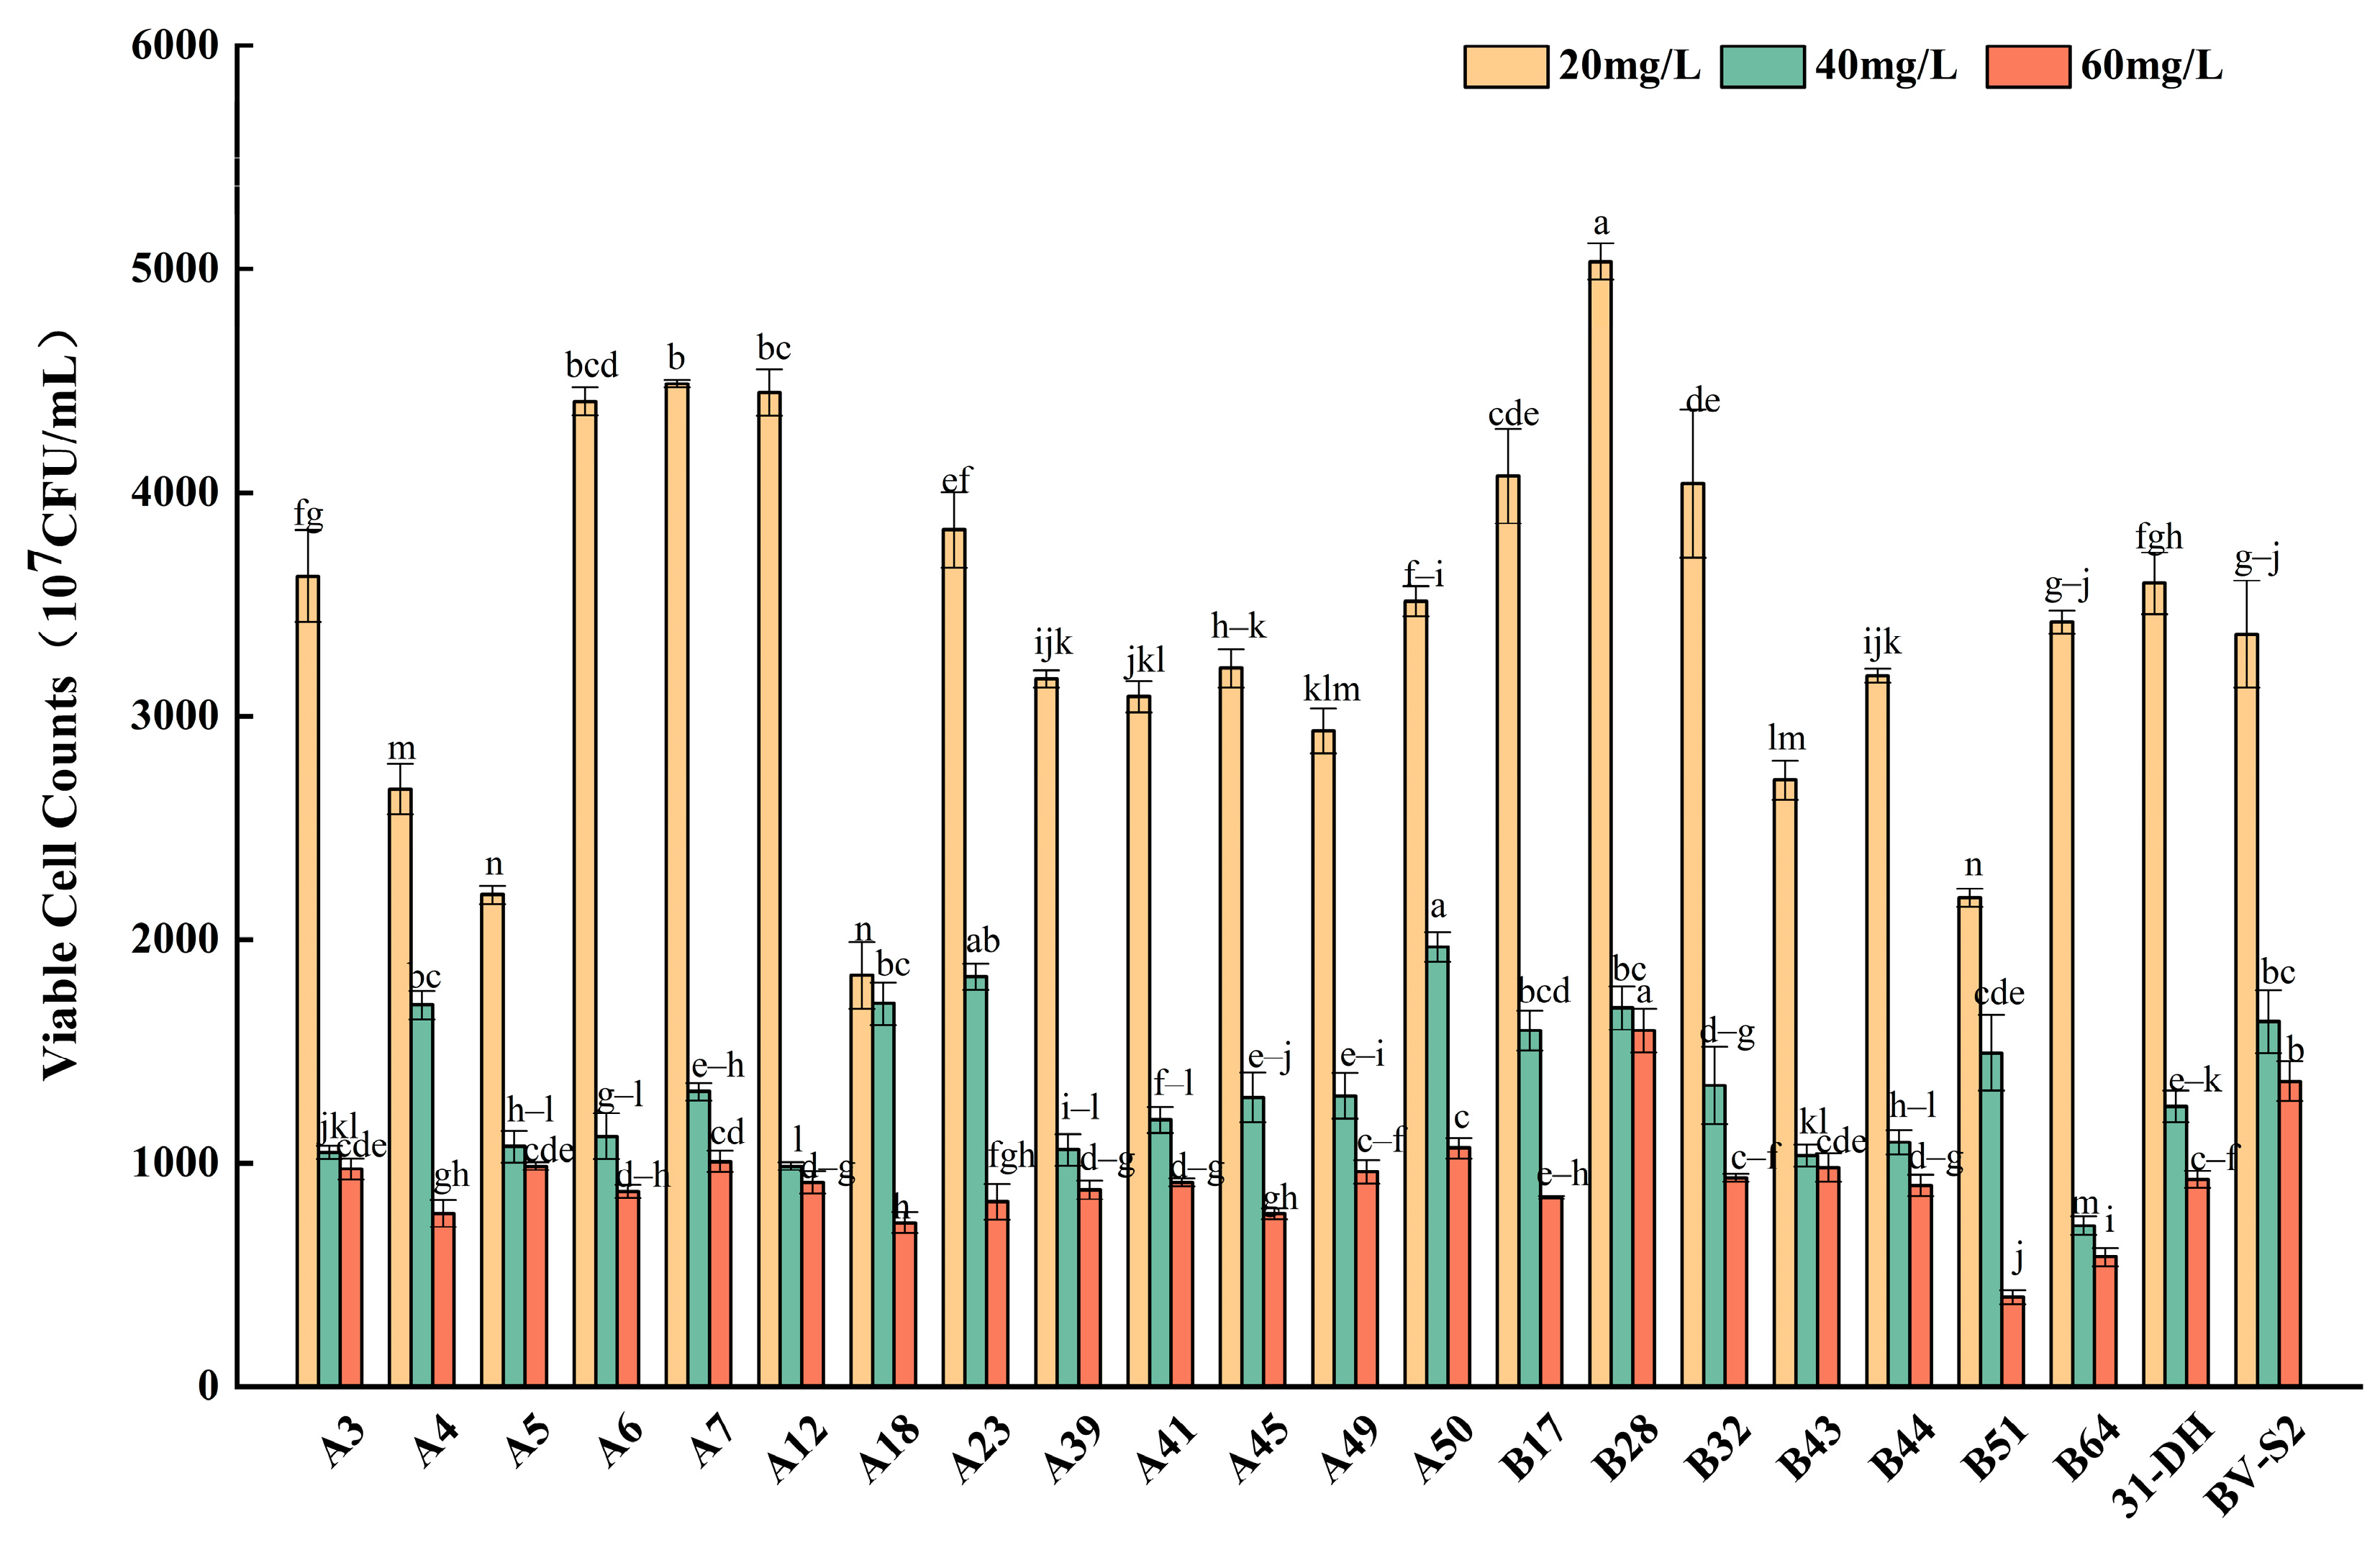
Figure 5.
Growth of twenty L. plantarum and control strains in MRS-AJ, which contained pH, ethanol, and SO2.
Figure 5.
Growth of twenty L. plantarum and control strains in MRS-AJ, which contained pH, ethanol, and SO2.
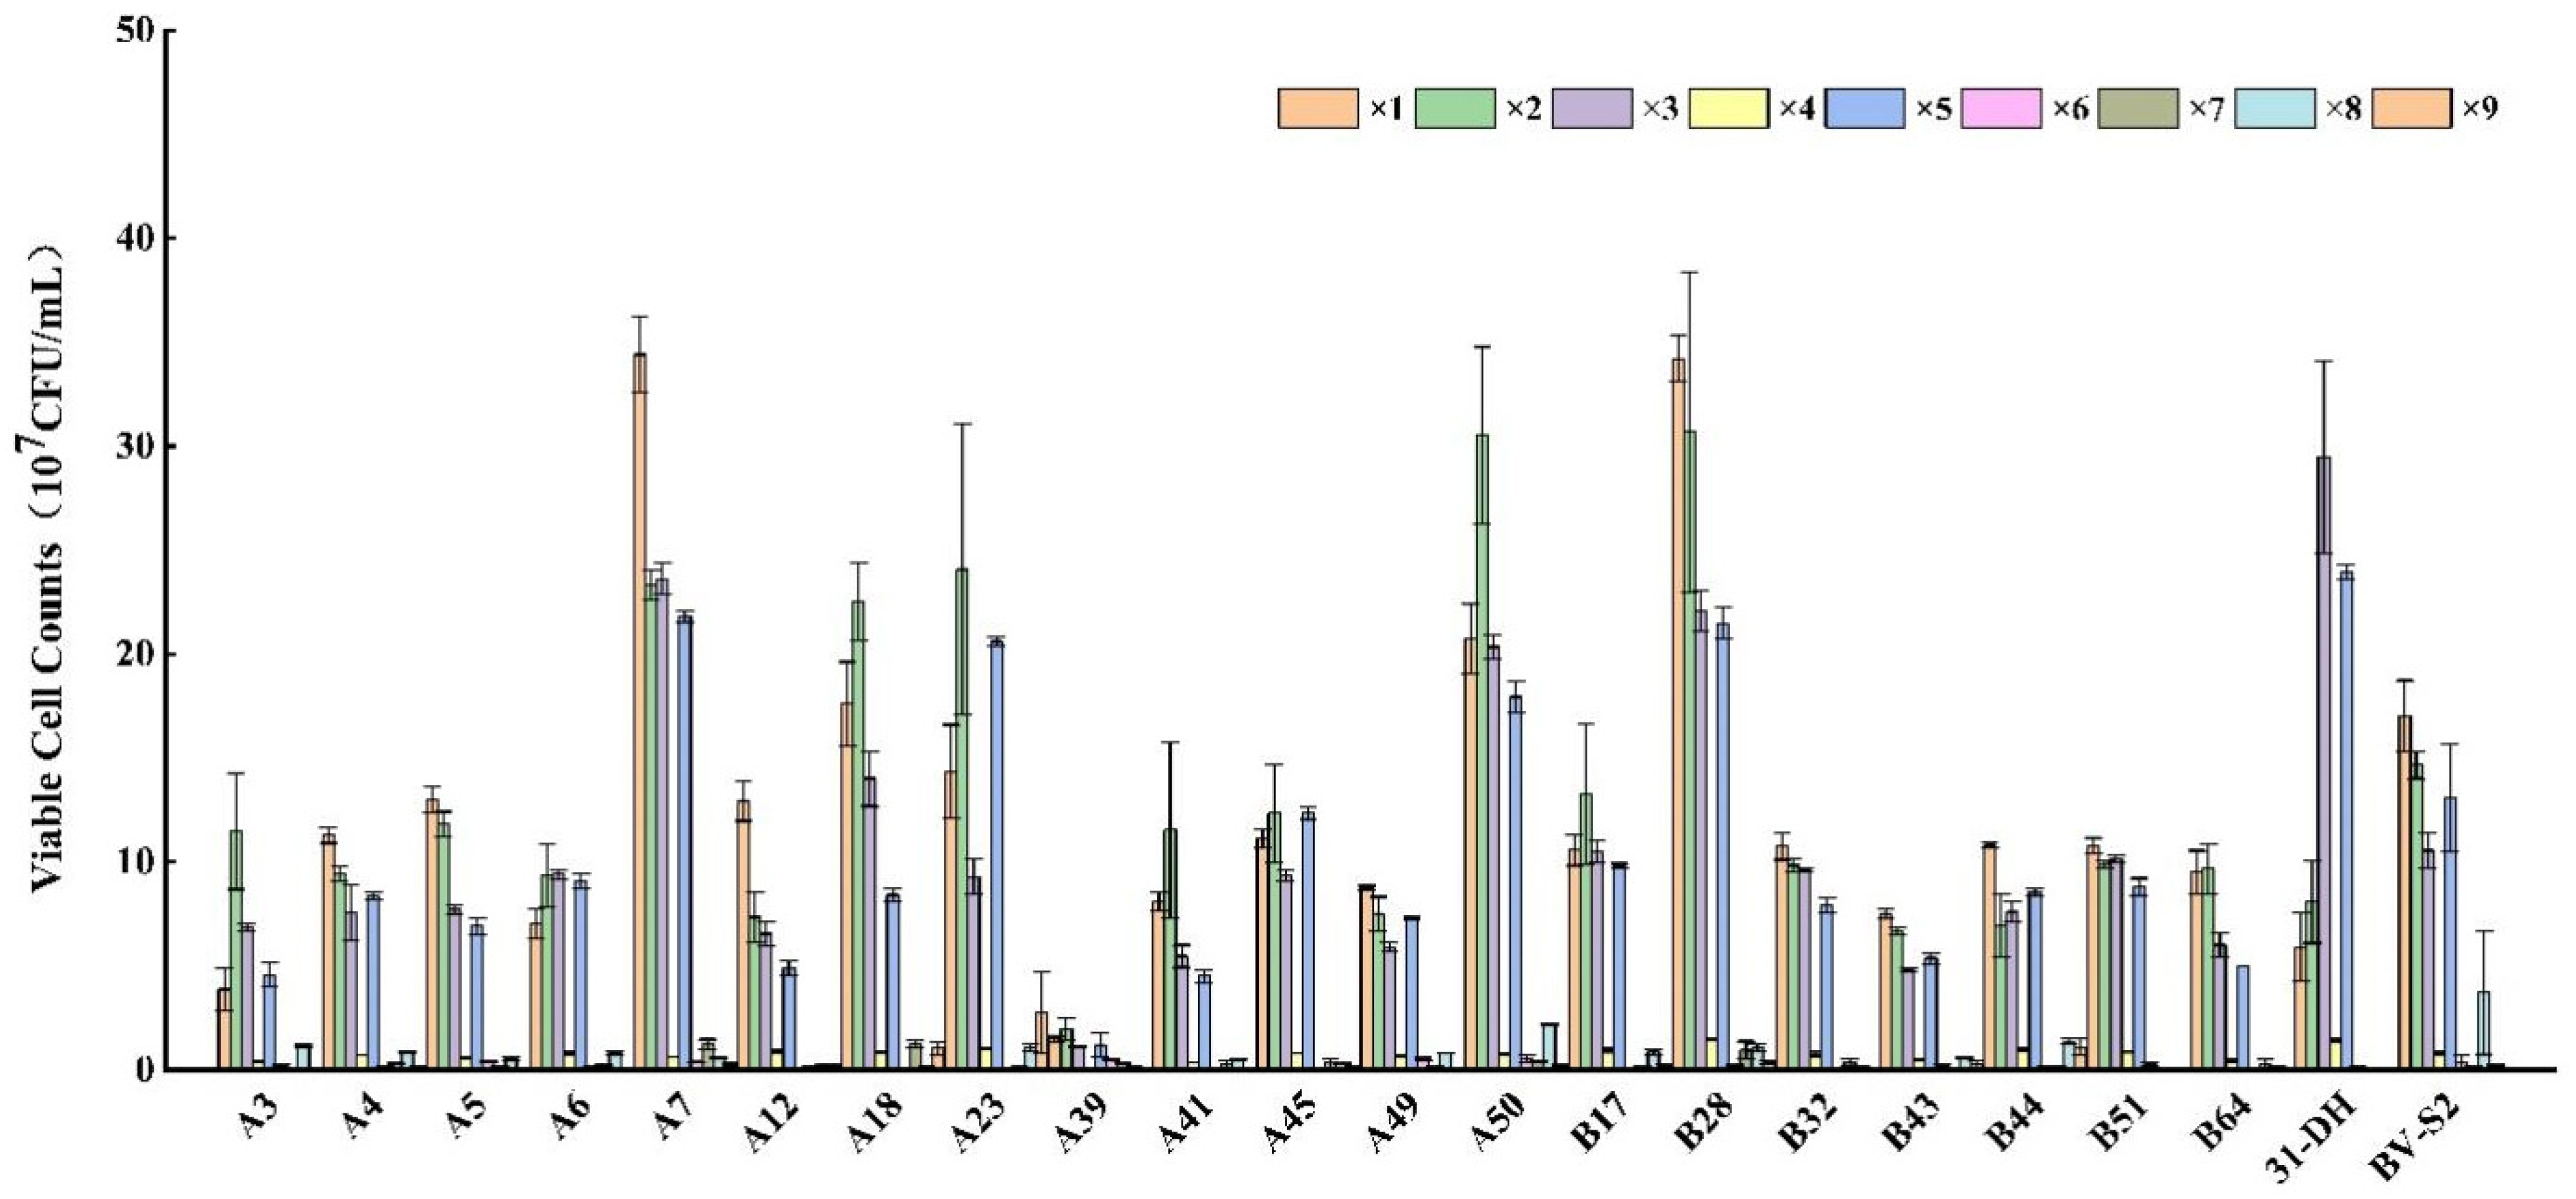
Figure 6.
The average value of twenty L. plantarum and control strains under nine groups combination of stresses. Different small letters indicate significant differences according to the LSD Fisher test (p < 0.05).
Figure 6.
The average value of twenty L. plantarum and control strains under nine groups combination of stresses. Different small letters indicate significant differences according to the LSD Fisher test (p < 0.05).
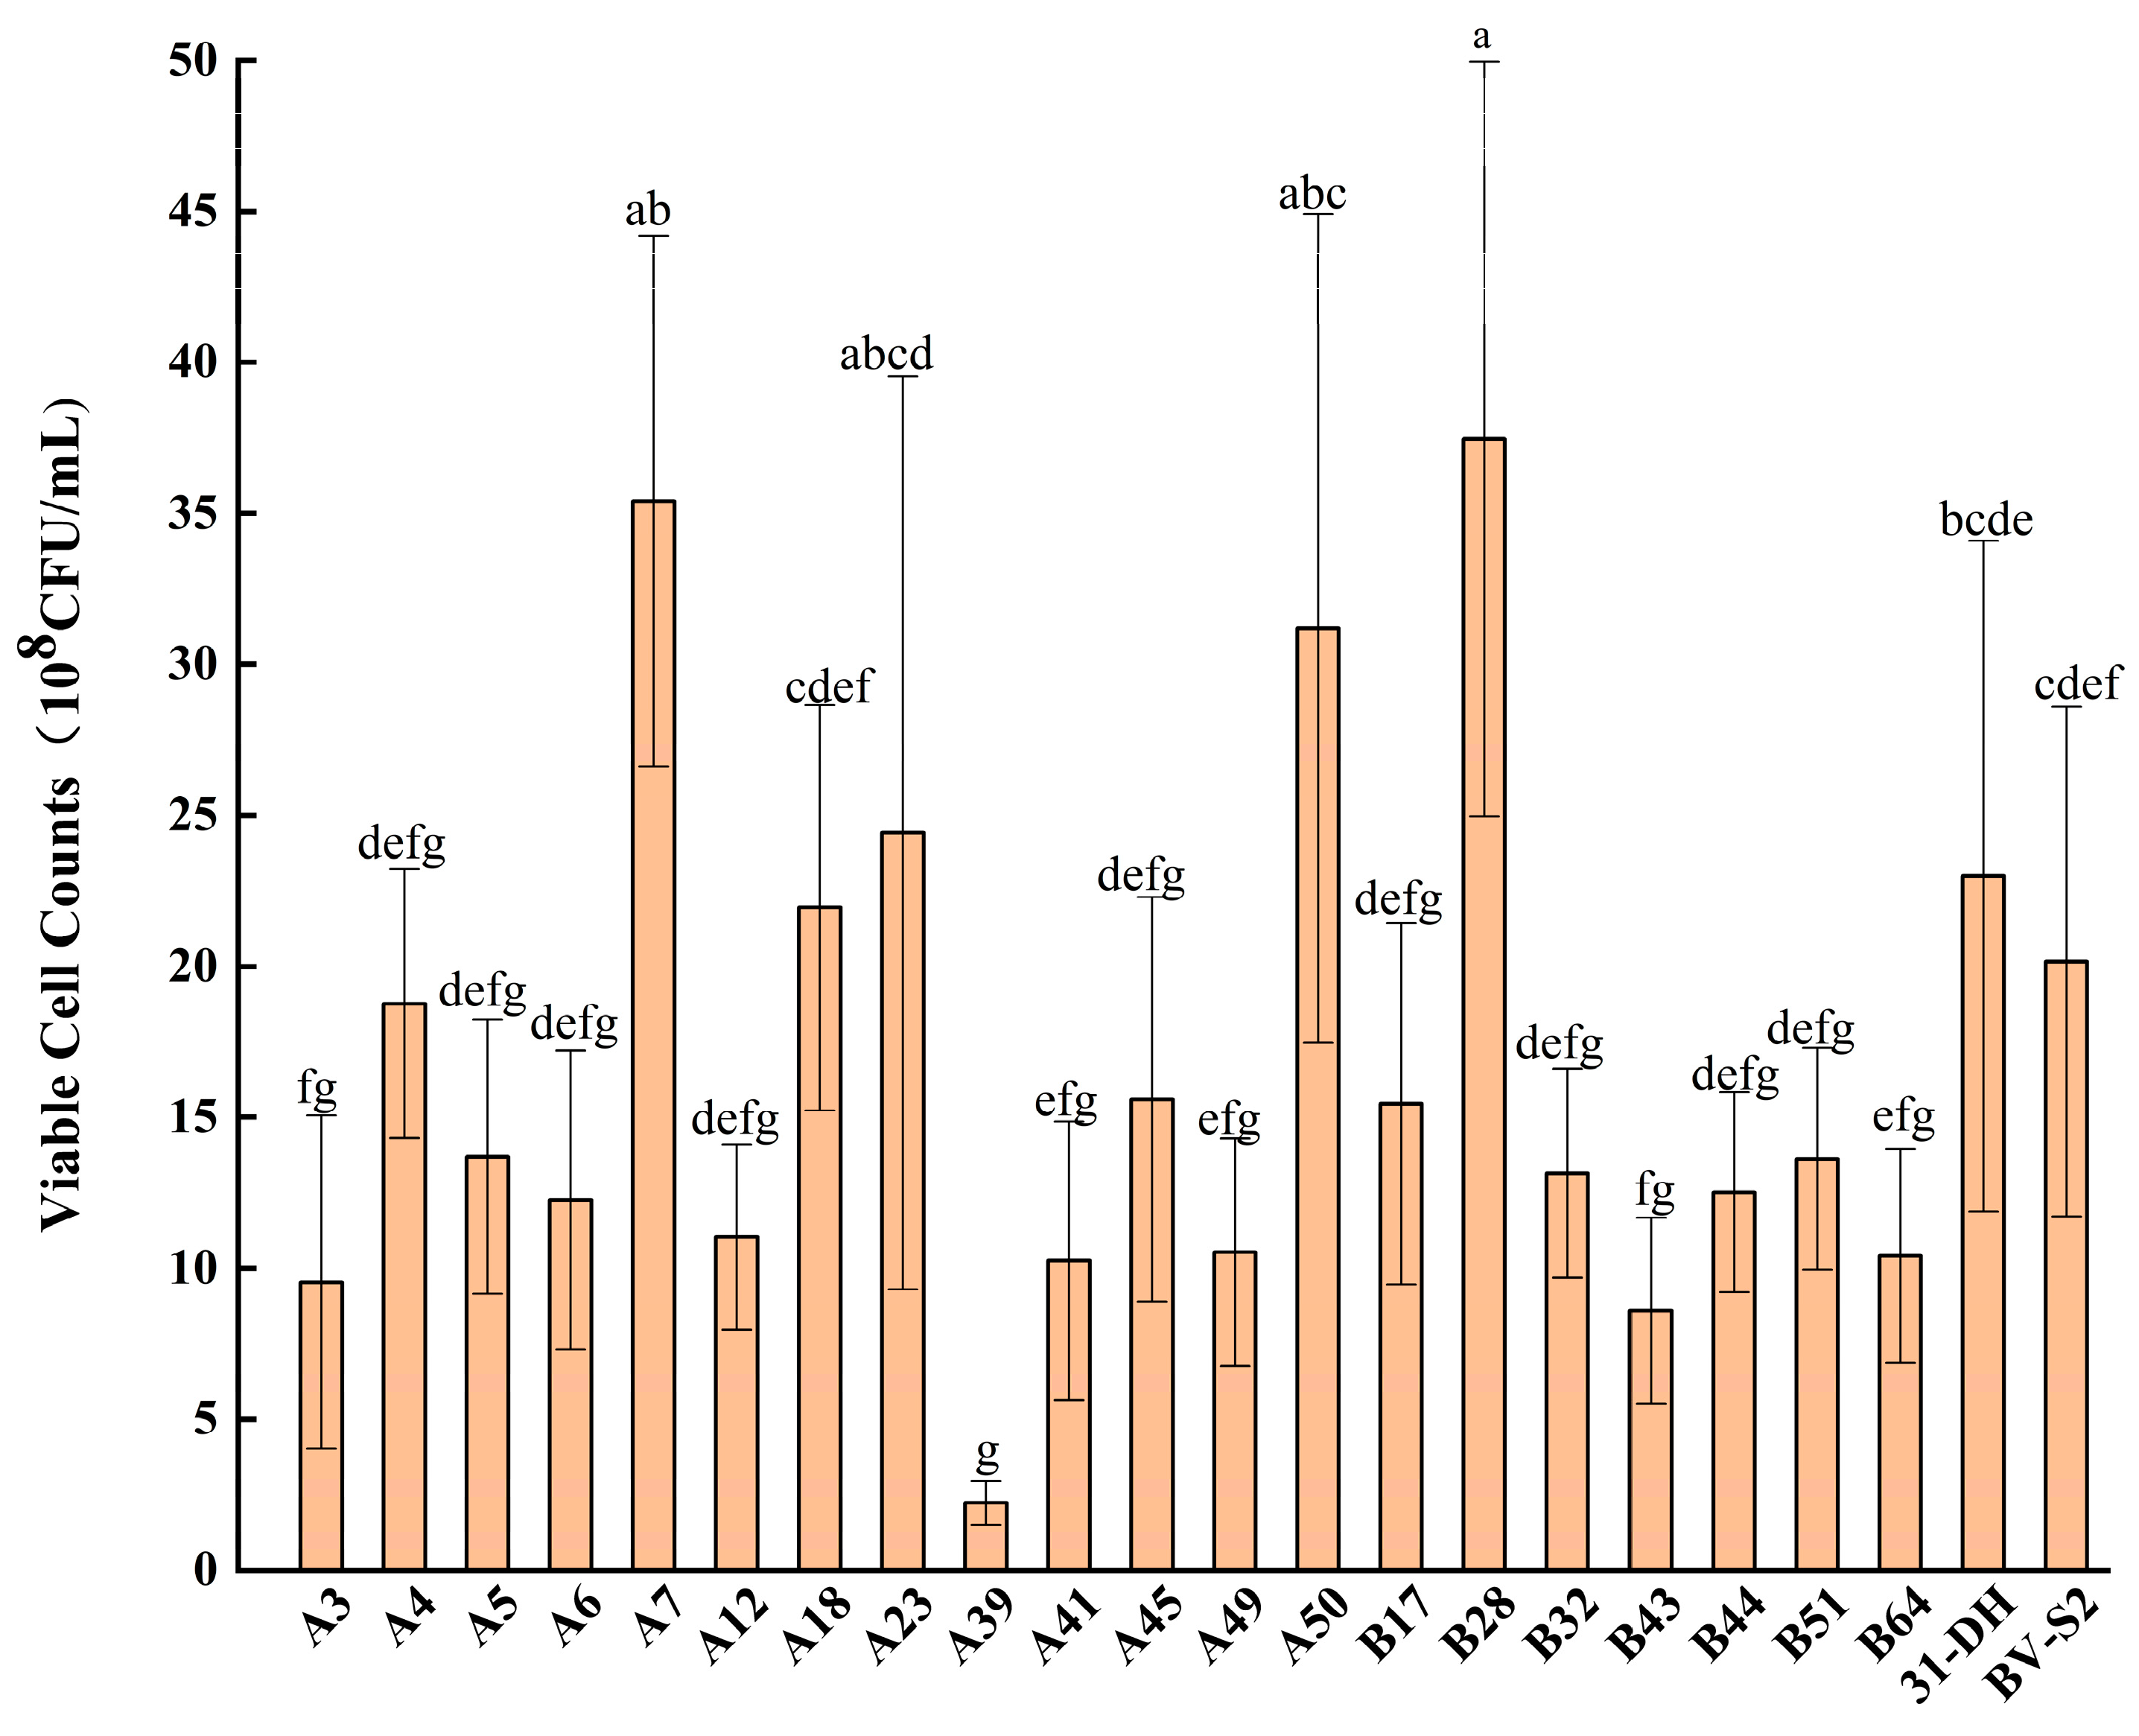
Figure 7.
β-D-glucosidase activity of A7, A18, A23, A50, B28, and control strains. Different small letters indicate significant differences according to the LSD Fisher test (p < 0.05).
Figure 7.
β-D-glucosidase activity of A7, A18, A23, A50, B28, and control strains. Different small letters indicate significant differences according to the LSD Fisher test (p < 0.05).
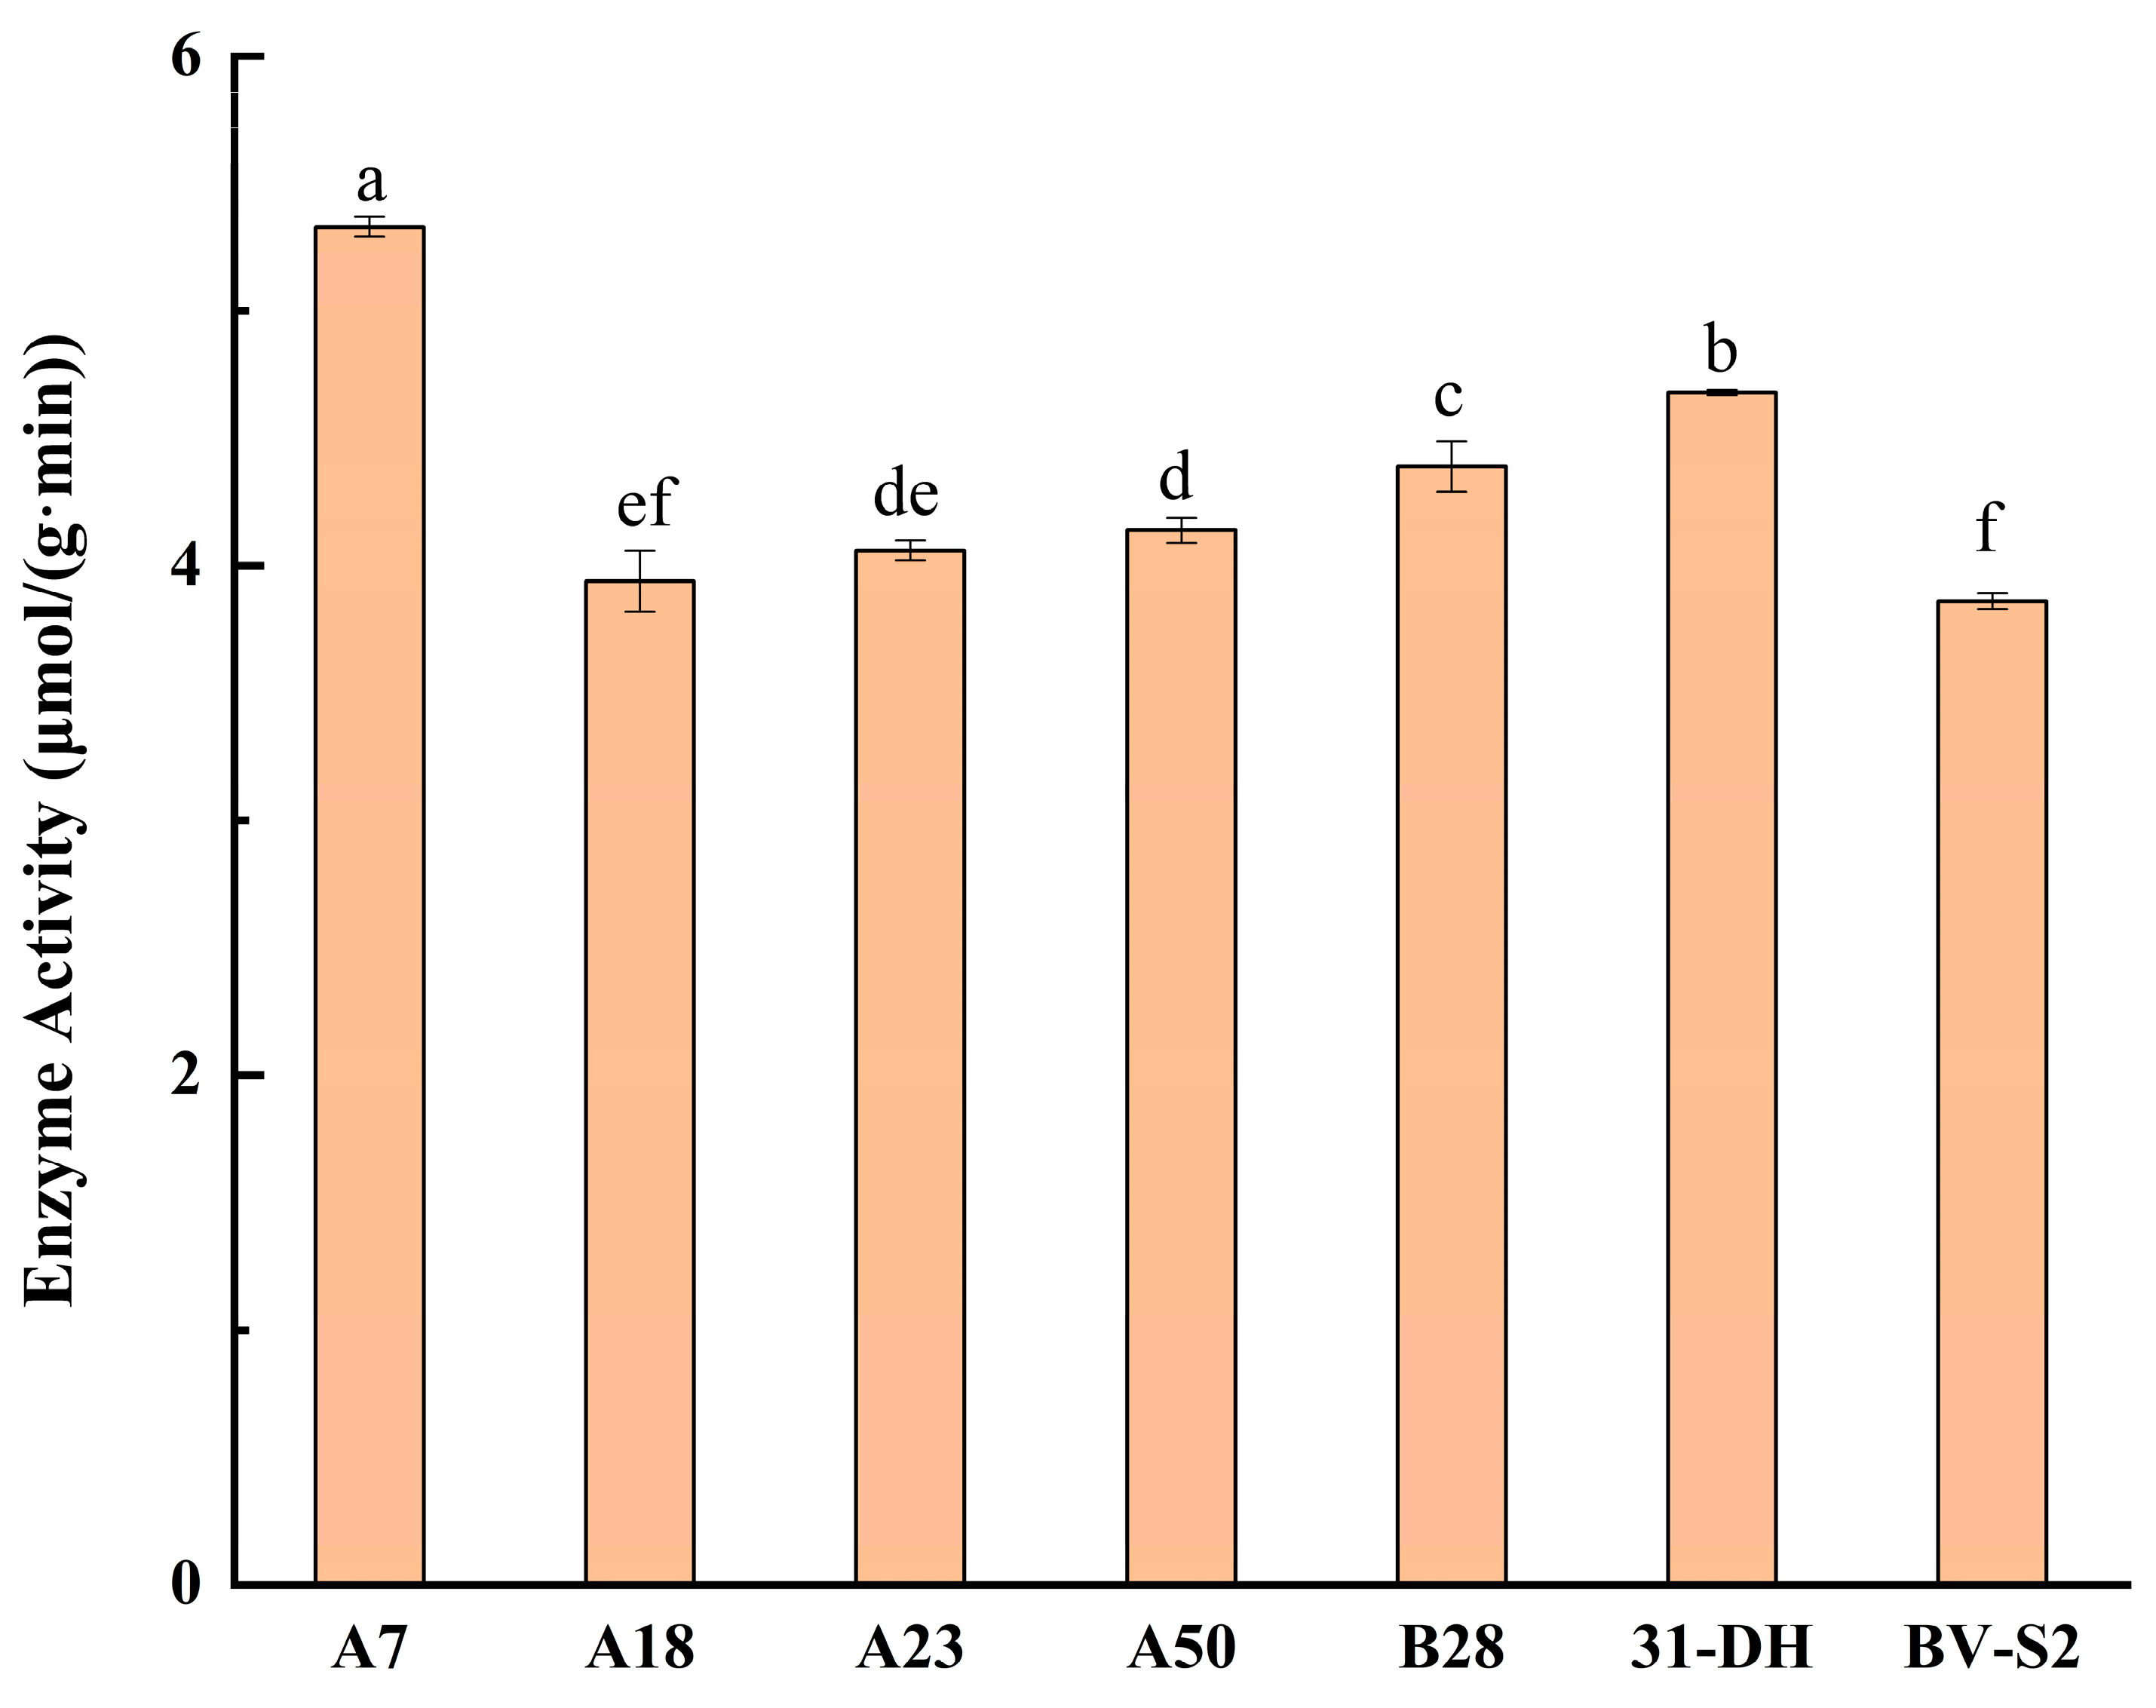
Figure 8.
Enological characteristics of L. plantarum: (a) L-malic acid consumption rate during MLF; (b) the viable cell counts during MLF.
Figure 8.
Enological characteristics of L. plantarum: (a) L-malic acid consumption rate during MLF; (b) the viable cell counts during MLF.
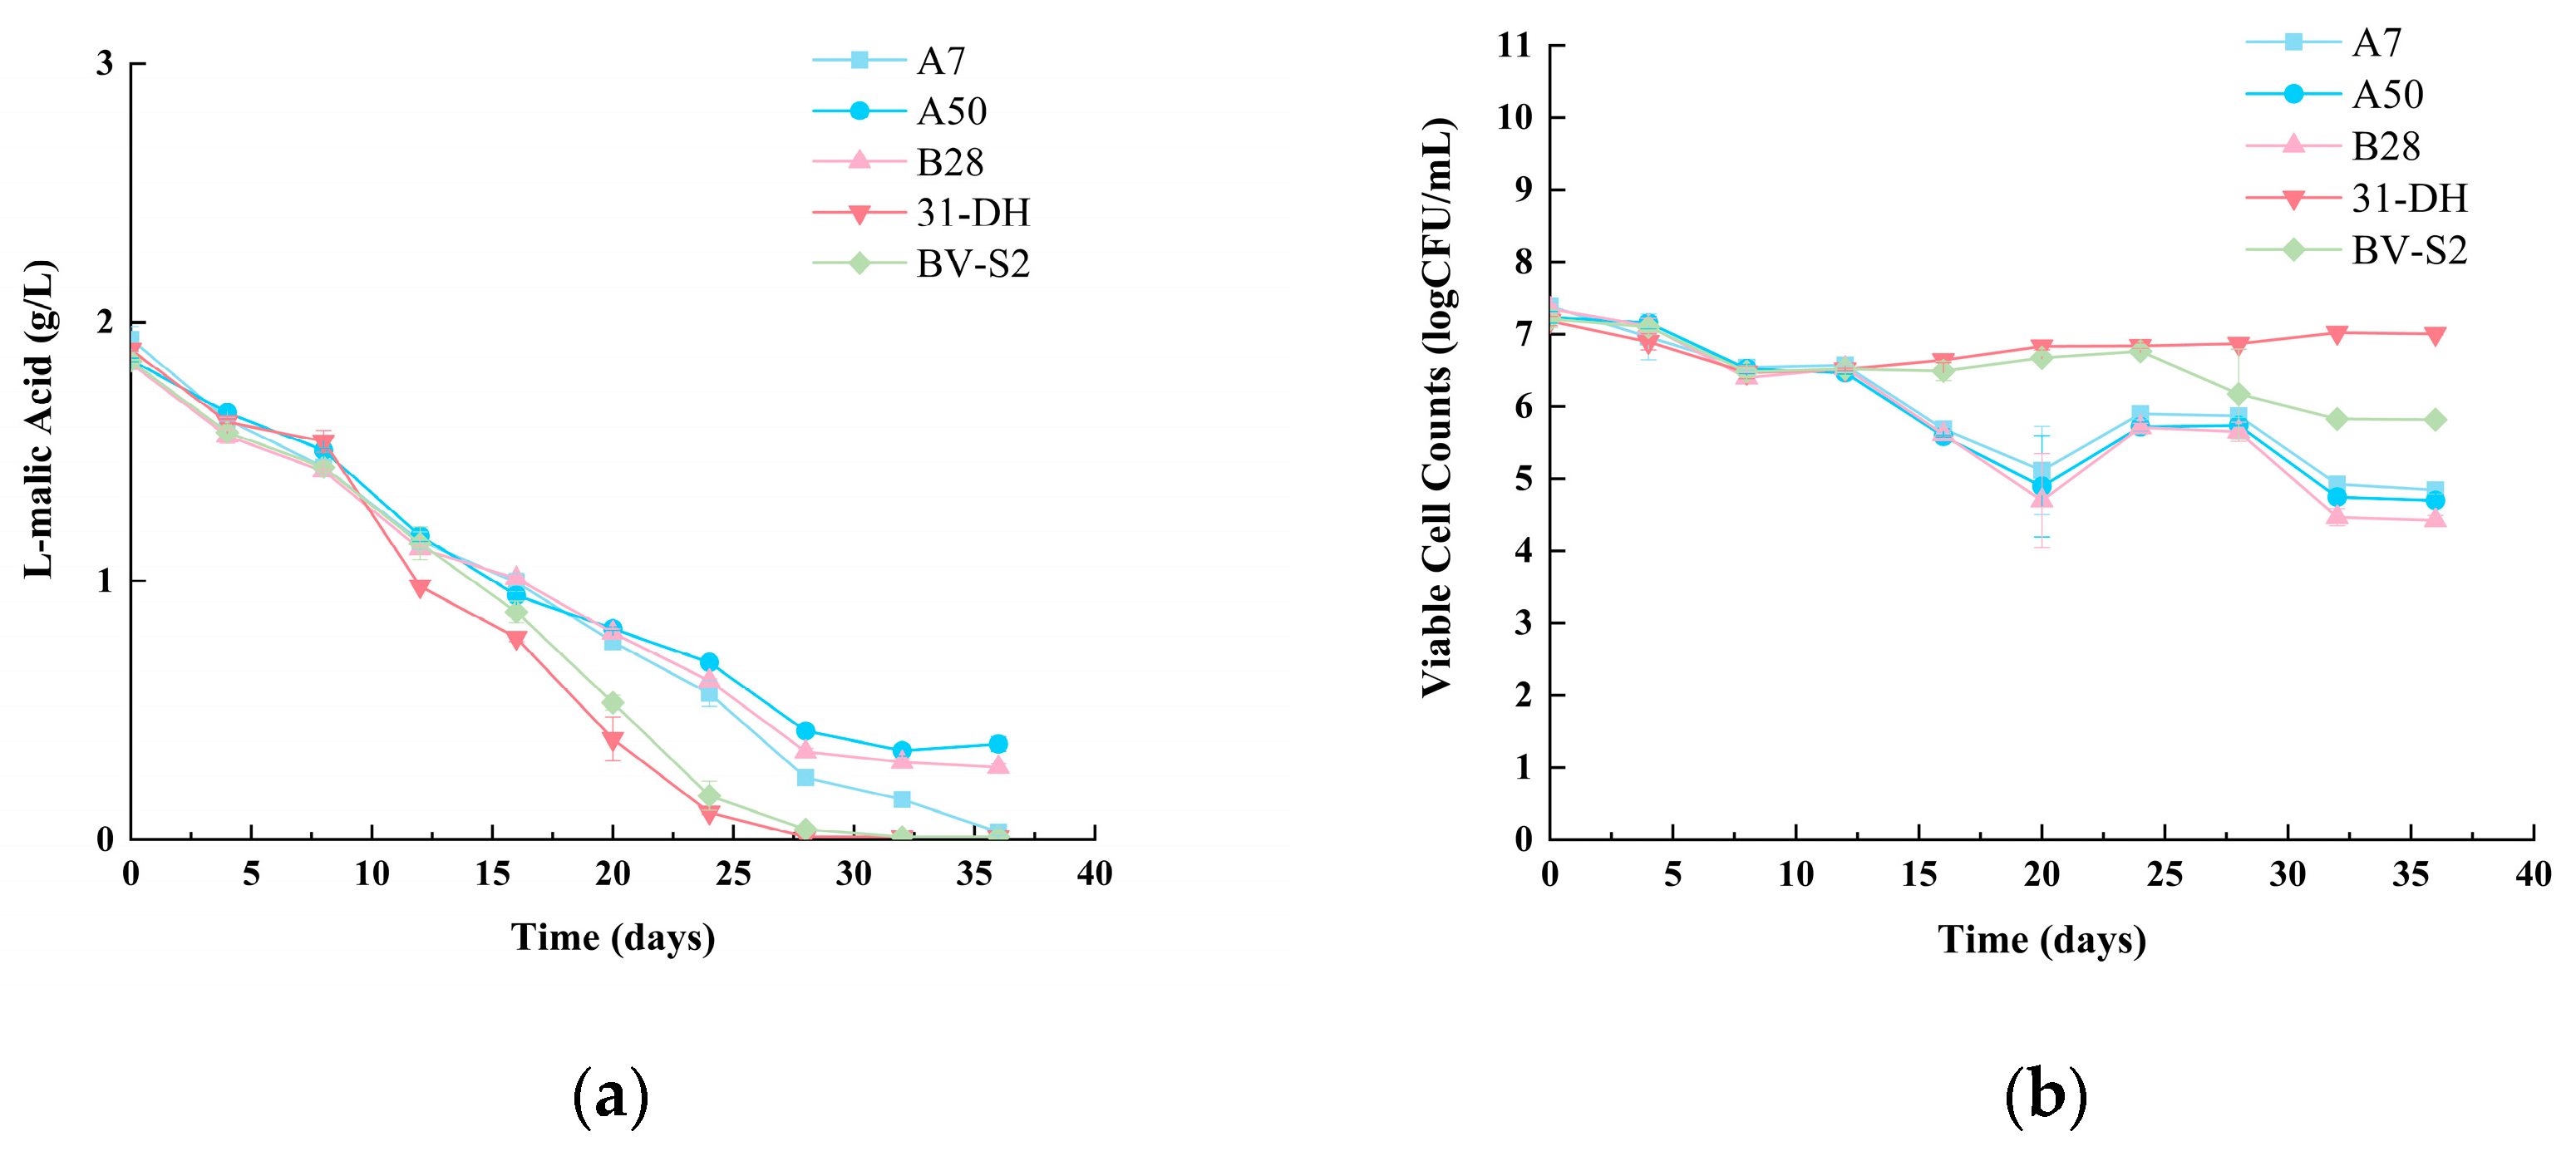
Figure 9.
Cluster diagram of volatile compounds for cabernet sauvignon wines.

Table 1.
The orthogonal experimental design.
| Levels | Stress | ||
|---|---|---|---|
| Ethanol (%(v/v)) | pH | SO2 (mg/L) | |
| 1 | 11 | 3.2 | 20 |
| 2 | 13 | 3.4 | 30 |
| 3 | 15 | 3.6 | 40 |
Table 2.
Identification of twenty-one isolated strains by 16S rRNA sequencing.
| The Isolated Strains | Identification | 16S rRNA Sequencing Similarity (%) |
|---|---|---|
| A3, A4, A6, A7, A12, A18, A23, A39, A41, A45, A49, A50, A52, B17, B28, B32, B43, B44, B51, B64 | Lactiplantibacillus plantarum | 99.93–100 |
| A8 | Lentilactobacillus hilgardii | 99.93 |
Table 3.
The viable cell counts of orthogonal experiment.
| Experimental Number | Ethanol (% (v/v)) | pH | SO2 (mg/L) | The Viable Cell Counts (107 CFU/mL) | ||||
|---|---|---|---|---|---|---|---|---|
| A7 | A18 | A23 | A50 | B28 | ||||
| 1 | 1 | 1 | 1 | 24.07 | 17.60 | 14.33 | 16.00 | 28.53 |
| 2 | 1 | 2 | 2 | 13.33 | 22.53 | 24.07 | 19.13 | 24.00 |
| 3 | 1 | 3 | 3 | 13.60 | 14.00 | 9.27 | 9.13 | 15.73 |
| 4 | 2 | 2 | 1 | 0.51 | 0.82 | 0.99 | 0.68 | 0.86 |
| 5 | 2 | 3 | 2 | 11.47 | 8.40 | 20.60 | 7.60 | 15.47 |
| 6 | 2 | 1 | 3 | 0.23 | 0.08 | 0.09 | 0.40 | 0.17 |
| 7 | 3 | 3 | 1 | 0.93 | 1.22 | 0.11 | 0.11 | 0.69 |
| 8 | 3 | 1 | 2 | 0.49 | 0.14 | 1.05 | 1.18 | 0.61 |
| 9 | 3 | 2 | 3 | 0.19 | 1.04 | 2.77 | 0.03 | 0.26 |
Table 4.
The orthogonal experiment results.
| Strains | Stresses | Levels | R | ||
|---|---|---|---|---|---|
| 1 | 2 | 3 | |||
| A7 | Ethanol | δA1 = 9.80 | δA2 = −3.13 | δA3 = −6.67 | 16.47 |
| pH | δB1 = 1.06 | δB2 = −2.52 | δB3 = 1.47 | 3.99 | |
| SO2 | δC1 = 1.30 | δC2 = 1.23 | δC3 = −2.53 | 3.83 | |
| A18 | Ethanol | δA1 = 10.73 | δA2 = −4.21 | δA3 = −6.51 | 17.24 |
| pH | δB1 = −1.37 | δB2 = 0.82 | δB3 = 0.56 | 2.19 | |
| SO2 | δC1 = −0.76 | δC2 = 3.06 | δC3 = −2.27 | 5.33 | |
| A23 | Ethanol | δA1 = 7.75 | δA2 = −0.91 | δA3 = −6.83 | 14.58 |
| pH | δB1 = −2.98 | δB2 = 1.14 | δB3 = 1.85 | 4.83 | |
| SO2 | δC1 = −3.00 | δC2 = 7.10 | δC3 = −4.10 | 11.20 | |
| A50 | Ethanol | δA1 = 8.72 | δA2 = −3.14 | δA3 = −5.59 | 14.31 |
| pH | δB1 = −0.17 | δB2 = 0.58 | δB3 = −0.42 | 1.00 | |
| SO2 | δC1 = −0.43 | δC2 = 3.27 | δC3 = −2.84 | 6.11 | |
| B28 | Ethanol | δA1 = 13.16 | δA2 = −4.09 | δA3 = −9.07 | 22.23 |
| pH | δB1 = 0.18 | δB2 = −1.22 | δB3 = 1.04 | 2.26 | |
| SO2 | δC1 = 0.44 | δC2 = 3.77 | δC3 = −4.20 | 7.97 | |
Table 5.
Basic chemical parameters of cabernet sauvignon wines.
| Strains | Ethanol (%) | pH | Total Sugar (g/L) | Titratable Acid (g/L) | Volatile Acid (g/L) | L-Lactic Acid (g/L) | Chromaticity | Hue | Glycerol (g/L) |
|---|---|---|---|---|---|---|---|---|---|
| Before MLF | 14.75 ± 0.03 abc | 3.52 ± 0.01 d | 3.63 ± 0.05 a | 8.19 ± 0.25 a | 0.28 ± 0.08 b | 0.08 ± 0.01 f | 17.89 ± 2.07 a | 0.81 ± 0.54 a | 1.03 ± 0.03 a |
| A7 | 14.81 ± 0.01 c | 3.68 ± 0.01 a | 3.53 ± 0.18 ab | 7.13 ± 0.15 ab | 0.58 ± 0.05 a | 1.38 ± 0.01 b | 20.50 ± 0.87 a | 0.68 ± 0.68 bc | 1.10 ± 0.05 a |
| A50 | 14.76 ± 0.01 b | 3.66 ± 0.01 ab | 3.45 ± 0.03 ab | 7.13 ± 0.01 ab | 0.59 ± 0.11 a | 1.14 ± 0.02 e | 20.92 ± 2.25 a | 0.67 ± 0.02 bc | 1.31 ± 0.02 a |
| B28 | 14.72 ± 0.01 bc | 3.67 ± 0.01 ab | 3.22 ± 0.07 ab | 7.31 ± 0.05 ab | 0.54 ± 0.03 a | 1.20 ± 0.01 d | 22.14 ± 2.14 a | 0.69 ± 0.03 b | 1.06 ± 0.24 a |
| 31-DH | 14.81 ± 0.01 a | 3.65 ± 0.01 bc | 3.25 ± 0.29 ab | 6.19 ± 0.05 b | 0.36 ± 0.01 b | 1.45 ± 0.01 a | 21.09 ± 1.83 a | 0.65 ± 0.07 bc | 1.21 ± 0.03 a |
| BV-S2 | 14.71 ± 0.00 c | 3.62 ± 0.01 c | 3.13 ± 0.05 b | 7.31 ± 0.01 ab | 0.34 ± 0.02 b | 1.34 ± 0.02 c | 21.62 ± 0.81 a | 0.59 ± 0.02 c | 1.08 ± 0.01 a |
Note: a, b, c, d, e and f indicate significance analysis.
Table 6.
Biogenic amine in cabernet sauvignon wines.
| Strains | Tryptamine (mg/L) | β-Phenylethylamine (mg/L) | 1,4-Butanediamine (mg/L) | Cadaverine (mg/L) | Tyramine (mg/L) | Histamine (mg/L) |
|---|---|---|---|---|---|---|
| Before MLF | 0.64 ± 0.01 ab | 1.04 ± 0.08 a | 1.46 ± 0.22 a | 0.36 ± 0.02 a | 0.30 ± 0.02 ab | 0.35 ± 0.02 a |
| A7 | 0.58 ± 0.04 ab | 0.46 ± 0.00 bcd | 0.12 ± 0.00 c | 1.11 ± 0.09 a | 0.58 ± 0.08 a | 0.79 ± 0.055 c |
| A50 | 0.42 ± 0.01 b | 0.18 ± 0.18 d | 0.76 ± 0.05 b | 0.39 ± 0.17 b | 0.14 ± 0.02 b | 0.68 ± 0.004 b |
| B28 | 0.48 ± 0.04 ab | 0.34 ± 0.07 cd | 0.86 ± 0.04 b | 0.49 ± 0.08 ab | 0.11 ± 0.01 b | 0.38 ± 0.053 b |
| 31-DH | 0.72 ± 0.18 a | 0.61 ± 0.04 abc | 1.22 ± 0.28 ab | 0.62 ± 0.14 ab | 0.11 ± 0.00 b | 0.38 ± 0.08 ab |
| BV-S2 | 0.56 ± 0.02 ab | 0.86 ± 0.10 ab | 1.26 ± 0.02 ab | 0.31 ± 0.00 b | 0.11 ± 0.00 b | 0.27 ± 0.00 ab |
Note: a, b, c, and d indicate significance analysis.
Publisher’s Note: MDPI stays neutral with regard to jurisdictional claims in published maps and institutional affiliations. |
© 2022 by the authors. Licensee MDPI, Basel, Switzerland. This article is an open access article distributed under the terms and conditions of the Creative Commons Attribution (CC BY) license (https://creativecommons.org/licenses/by/4.0/).
Share and Cite
MDPI and ACS Style
Sun, J.; Ge, Y.; Gu, X.; Li, R.; Ma, W.; Jin, G. Identification and Characterization of Malolactic Bacteria Isolated from the Eastern Foothills of Helan Mountain in China. Foods 2022, 11, 2455. https://doi.org/10.3390/foods11162455
AMA Style
Sun J, Ge Y, Gu X, Li R, Ma W, Jin G. Identification and Characterization of Malolactic Bacteria Isolated from the Eastern Foothills of Helan Mountain in China. Foods. 2022; 11(16):2455. https://doi.org/10.3390/foods11162455
Chicago/Turabian StyleSun, Jingxian, Yuzi Ge, Xiaobo Gu, Ruyi Li, Wen Ma, and Gang Jin. 2022. "Identification and Characterization of Malolactic Bacteria Isolated from the Eastern Foothills of Helan Mountain in China" Foods 11, no. 16: 2455. https://doi.org/10.3390/foods11162455
Note that from the first issue of 2016, this journal uses article numbers instead of page numbers. See further details here.